
Adsorption of Natural Organic Matter and Phosphorus from Surface Water Using Heated Aluminum Oxide (Predeposited) Dynamic Membrane Adsorber

Wroclaw University of Environmental and Life Sciences, Institute of Environmental Engineering, pl. Grunwaldzki 24, 50-363 Wroclaw, Poland
Appl. Sci. 2021, 11(16), 7384; https://0-doi-org.brum.beds.ac.uk/10.3390/app11167384
Submission received: 28 May 2021
/
Revised: 5 August 2021
/
Accepted: 7 August 2021
/
Published: 11 August 2021
(This article belongs to the Special Issue Advances in Separation Processes in Water and Waste Water Treatment Technologies)
Abstract
:The paper reports the removal of phosphorus and natural organic matter (NOM) from surface water by dynamic membrane (DM) adsorber. DM filter builds up as a layer of particles deposited via permeation through the membrane’s surface. This study reports the application of Heated Aluminium Oxide Particles (HAOPs) as a dynamic membrane adsorber. Filtration experiments were conducted with surface water and batch tests were carried out with synthetic water. The efficiency of phosphorus removal along with the efficiency of organics (represented as UV-254) removal was evaluated. Additionally, the impact of HAOPs surface loading on the changes of transmembrane pressure (TMP), the kinetics, isotherm modeling of the adsorption and the effect of the pH, the effect of ionic strength, the effect of coexisting organic matter on phosphorus removal efficiency were studied. In the case of phosphorus removal in batch adsorption experiments, its sorption kinetic and isotherm data were analyzed using pseudo-first- and pseudo-second-order models and Langmuir and Freundlich models, respectively. The results indicated that Langmuir adsorption isotherm fits the experimental data best (0.9894). The kinetics of phosphorus adsorption on HAOPs was best described by the pseudo-second-order model and the best removal was achieved at the pH 6–7 (96.65% on average). An increase in ionic strength did not impact the efficiency of phosphorus removal significantly. The outcome of this study highlights HAOPs efficiency in NOM removal up to 92% in filtration experiments. In the case of phosphorous, removal efficiency varied. For the highest HAOPs dose, the degree of phosphorus removal ranged up to 93 ± 5%. The same removal efficiency was observed for the lowest dose while for 17 g/m2 of HAOPs the fluctuations were larger and varied from 64.7% to 92%. The results demonstrate that HAOPs could potentially be applied in the removal of phosphorus from surface water, especially when there is a high concentration of phosphorus in the water. However, this process requires further research and optimization of its parameters.
1. Introduction
Dynamic membrane (DM) applications have been studied extensively for water filtration and wastewater treatment in recent years [1,2]. DM is formed when a layer of particles from feed water is deposited onto the membrane surface. This dynamically formed and porous filtration layer is used as a physical barrier that is also called a secondary membrane. Benefits of DM’s application, such as fouling mitigation and prolonged lifespan of the membrane have been widely reported in the literature [1,2,3,4,5]. Different particles of different sizes that can be found in the feed water are rejected by DM. So far, two basic categories of DMs have been reported: A self-forming DM and a pre-deposited one. In each case, the continuous process of DM formation helps to protect the underlying membrane. Unlike the pre-deposited DMs, where the secondary membrane is created through the filtration of solutions containing specific particles or colloids [2], the self-forming DMs are generated by the substances existing in the feedwater. Then, once a DM layer is fouled, it can be replaced by a new one [5].
An excessive amount of phosphorus in surface water poses serious environmental and technological challenges. Usually, the presence of phosphorus compounds is a limiting factor for primary production by phytoplankton in lakes, and its excess amount can result in eutrophication [4]. Additionally, an excessive amount of phosphorus can be correlated with an uncontrolled growth of indigenous bacteria in networks distributing drinking water. Although organic carbon is the most important nutrient for bacterial growth, inorganic nutrients, such as phosphorus and nitrogen, are equally important [6,7]. To date, most work on phosphorus removal efficiency has been focused on its removal from wastewater. However, since it can promote microbial regrowth in water distribution networks, exploration of more efficient phosphorus removal techniques is of importance [8,9,10,11,12,13,14]. The Water Framework Directive (Directive 2000/60/EC of the European Parliament) has set its limits between 0.5 and 1.0 mg/L. It is assumed that the lower limit will be reduced to 0.1 mg/L but, at the same time, that may be impossible to achieve by the means available with the current technology. Given this challenge, the most effective methods of removing phosphorus compounds are being sought after.
The removal of phosphorus can be performed using physico-chemical methods, biological treatment and/or combinations of both. In practice, the most commonly used methods are physico-chemical processes that include precipitation, sorption and/or ion exchange [15]. Among techniques applied to removing phosphorus compounds, the process of adsorption has recently attracted more attention. Various metal oxides and metal hydroxides have been synthesized and applied to capture phosphorus compounds, especially phosphate, from the feed water [16].
Galjaard et al. (2001) studied the impact of pre-coating materials such as powdered activated carbon, titanium dioxide, and iron oxide on direct treatment of surface water. These materials initially increased the fouling rate, then they stabilized and thus mitigated the fouling [17]. Ersahin et al. also outlined that a DM layer plays an important role in organic matter removal [18]. Benjamin’s research group developed a hybrid adsorbent/membrane process comprising a pre-treatment step, in which water was passed through a pre-deposited layer of HAOPs (heated aluminum oxide particles), followed by a conventional membrane filtration [1,19,20,21,22,23,24,25,26,27,28,29,30]. That process was applied for the first time by Kim et al. (2007) [23]. HAOPs have been synthesized in order to remove major foulants, such as natural organic matter (NOM), from surface water and also to mitigate the fouling of the downstream membrane. As such, they are adsorbents that combine adsorption and granular media filtration [19,20,21,22,23,24,25,26,27,28,29,30].
The main application of HAOPs is pretreatment prior to membrane filtration. Anantharaman et al. (2020) reported that the implementation of a DM composed of HAOPs protects the membrane the DM has been deposited on [1]. Additionally, they reported that HAOPs could be used as a coating layer on a porous surface such as ultrafiltration membranes and proved to be efficient in removal of NOM compounds from water [19,20,21,22,25,26,27,28,29].
Since the deposition of HAOPs involves the integration of a granular media filtration and a packed bed adsorption, the feed water is required to pass through a layer of pre-deposited adsorbent on a filtering media. Such DM adsorber has been reported to be very efficient in the reduction in both NOM and the fouling [19,21,22,23,24,25,26,27,28,29,30]. Although DMs containing HAOPs have been investigated for the removal of phosphorus from the effluent produced by a membrane bioreactor (MBR) [20,24], they have not yet been investigated for removal of phosphorus from the surface water. On the one hand, Kim et al. (2008) reported that iron oxides have superior adsorption affinity to phosphorus, when compared to HAOPs [21]. At the same time, Lee et al. (2019) outlined that the use of HAOPs as the adsorbent produces higher-quality treated permeate using lower adsorbent doses [24]. Additionally, Lee et al. (2019) reported that sludge generated from fouled DM layers was extremely easy to dewater and dry through vacuum filtering and drying [24]. Lately, Manamperuma et al. (2019) observed a significant removal of color from feed water when testing the application of HAOPs in a fully automated pilot system. NOM is a mixture of macromolecules and humic acid (HA) is the one that is responsible for the water color [29]. In that study, HAOPs were pre-coated/pre-deposited on 10 µm nylon mesh tube in a recycling mode to limit the loss of HAOPs [29]. However, it was not stated whether it was possible to recover and re-use HAOPs. Sludge management as well as energy consumption of the process were not evaluated either.
This work investigates the use of a pre-coated DM adsorber containing HAOPs for the simultaneous removal of NOM and phosphorus from surface water. The manuscript is focused on both NOM and phosphorus removal from surface water since biological stability of water is a new topic of importance in water technology and low concentrations of both carbon and phosphorus compounds are considered to be limiting factors to this phenomenon. The major purpose of the presented paper is to explore new areas of application of DM adsorber made of HAOPs.
2. Materials and Methods
2.1. Raw Water
The feed to the filtration system was surface water from the Olesnica River (51°11′59.2″ N 17°19′53.8″ E). The river was selected for its high phosphorus content. Water samples were taken from aprox. 20–50 cm below the water table. The water quality was reduced mainly by above-average contents of nutrients, nitrite nitrogen and phosphorus compounds [31].
The ranges of values of selected indicators for river water quality assessment are presented in Table 1.
2.2. Reagents
For the preparation of HAOPs, aluminum sulfate octadecahydrate and sodium hydroxide were used, obtained from WarChem, Poland. Humic acid (HA) was sourced from Sigma Aldrich, Poland.
2.3. HAOPs
HAOPs were synthesized according to the method of Cai et al. [19]. The solution of 18-hydrate aluminum sulfate was neutralized to pH 7 and then it was heated in a closed container at 110 °C for 24 h. Particles generated this way have diameters in the range of 1.5–30 μm [27]. Various reports have described HAOPs deposition tested on different support structures (membranes, typically PES, metal and nylon meshes) [19,21,22,23,27,28,30]. After filtration of the desired amount of water, HAOPs layer could be easily removed by hydraulic cleaning which suggests that HAOPs adhered to the support structure through physical bonds only.
The pre-deposited HAOPs layer greatly reduced fouling with hydraulic residence time in the HAOPs layer between 3 and 5 s depending on the layer’s thickness [21]. HAOPs achieved better NOM removal with an increased flux, and the pressure applied had little effect on the efficiency of the filtration [6,8,9,10,17,18,19,20].
The HAOPs layer is commonly pre-deposited on ultrafiltration membranes (UF), but other materials have also been used, such as nylon or metallic meshes (pore size 0.2 μm). So far, the best support structure for HAOPs particles, measured by the removal efficiency, was achieved with the application of UF membranes [19,21,22,23,26].
2.4. Membrane
Flat-sheet polyethersulfone (PES) UF membranes (Microdyn-Nadir GmbH, Wiesbaden, Germany) with molecular weight cut-off of 150 kD were used for this study. The analyzed membranes consist of a thin and dense surface skin on top of a porous substructure residing on a non-woven web reinforcing the entire fabric. The membrane unit was run using 47 mm diameter discs of the membrane with the effective area of 9.62 cm2 fit into the filter cartridge.
2.5. Scanning Electron Microscopy (SEM)
Membranes were cut into samples. After drying them for 24 h the membrane surface was evaluated with SEM and imaged using an acceleration voltage of imaging focused on the structure of the top layer of the membrane.
2.6. Analytical Methods
The efficiency of examined processes was determined by measuring the amount of organic matter in samples before and after filtration. NOM concentration was monitored by measuring the UV254 nm absorbance. The absorbance spectra were recorded with Thermo Scientific™ Evolution 201 UV-Vis spectrophotometer at wavelengths from 200 to 450 nm. Additionally, the chemical oxygen demand COD-KmnO4, turbidity and color test were also executed [32].
Phosphates and total phosphorus concentration were measured with Standard Method 4500-P using the vanadomolybdophosphoric acid colorimetric method and Hach DR/4000 spectrophotometer [32].
2.7. Phosphorus Removal in Batch Adsorption Experiments
These experiments were conducted for two concentrations that had occurred in the evaluated river (3.38 and 7.72 mg P/L) and for two concentrations above the typical phosphorus values.
The adsorption study of phosphorus was carried out with different initial concentrations of phosphorus and a fixed dose of the adsorbent at a constant temperature (25 °C ± 2) in a magnetic stirrer. The stock solution of potassium dihydrogenophosphate (KH2PO4) was prepared by dissolving it in DI to the concentration of 40 mg P/L. For adsorption isotherms, the tested mass of HAOPs was introduced into 100 mL of the examined solution with different phosphorus concentrations (28.7, 18.4, 7.72 and 3.38 mg P/L). The pH of the solution was maintained at 6.5. The solution was stirred for 60 min to ensure approximate equilibrium. At the end of the adsorption period, the solution was filtered through a 0.45 μm membrane filter and then analyzed for phosphorus concentration.
The adsorbed quantity Qe was calculated according to:
where Co and Ce (mg/L) are the initial and equilibrium concentrations of phosphorus in the solution, respectively, V (L) is the volume of the solution, and m (g) is the mass of adsorbent.
The pH effect on phosphorus adsorption was studied in the range from 2 to 11. The pH was adjusted with 0.1 M NaOH and 0.1 M HCl solutions. In the stock solution, the ionic strength was from 0.00014 mol/L to 0.00002 mol/L. The ions present in the stock solution are potassium ion and dihydrogen phosphate ion . The ionic strength was adjusted by adding NaCl.
The adsorption isotherms were evaluated according to the Langmuir and Freundlich models, represented by Equations (2) and (3), respectively:
where Qe represents the mass of adsorbate adsorbed in mg per mass of adsorbent in g, Ce is the equilibrium concentration of adsorbate in mg/L, Qm represents the maximum Langmuir adsorption capacity of the adsorbent in mg of adsorbate per g of adsorbent, and KL is the Langmuir adsorption constant in L/mg. The magnitude of KL in the Langmuir model indicates the degree of adsorbate-adsorbent affinity. The adsorption constants for the Freundlich model, KF (L/mg)1/n and n (dimensionless), are determined empirically.
The separation factor or equilibrium parameter (RL) can be defined as:
where b is the Langmuir constant and C0 is the highest initial concentration of phosphorus (mg/L). The value of RL indicates the adsorption nature to be either unfavorable (RL > 1), linear (RL = 1), favorable (0 < RL < 1) or irreversible (RL = 0) [33].
2.7.1. The Effect of the pH
The adsorption of phosphorus on dynamic membrane adsorber (HAOPs) was determined at pH values between 2 and 11.
2.7.2. The Effect of Ionic Strength on Phosphorus Removal Efficiency
The test was conducted to evaluate the difference of adsorption for ionic strengths of background 2 mM, spiked by 0.003 and 0.3 M NaCl. The background ionic strength was about 2 mM (determined by applying Russell’s factor to the conductivity of the solution).
2.7.3. Effect of Coexisting Organic Matter
In order to evaluate the efficiency of both NOM and phosphorous compounds a mixture of HA and potassium dihydrogenophosphate (KH2PO4) was prepared. HA was used as a NOM substitute. Since the interaction of phosphorus with HA was studied previously, the phosphorus and HA interaction was postulated to involve bridging metals and organic functional groups deprotonated [34].
The HA was dissolved in a basic solution (NaOH) and then the pH brought down to 7 by slowly adding an acid solution (HCl) followed by sonication in order to prevent the agglomeration. The applied HA concentrations were 3.65 mgC/L, 9.65 mgC/L, and 15.56 mgC/L.
2.8. Filtration Experiments
2.8.1. Operating Conditions for the Filtration Experiments
First, the membranes were soaked in deionized water (DI) for about 30 min. Then, they were placed into the cartridge filtration unit (Pall Co., New York, NY, USA) and then compacted by filtering of DI for another 30 min. Subsequently, HAOPs were deposited onto the surface of the membranes by injecting the desired dose of HAOPs into the cartridge filter with a syringe [19,20,21,22,23,26,30]. Right after depositing of HAOPs, DI was passed through the deposited layer and both the pressure and the flux were monitored. No significant changes to either of them were recorded. Additionally, the permeate turbidity was monitored in order to ensure that HAOPs would not leach into it. Turbidity check is a standard operational procedure in this technology. After filtrating the DI for 30 min, the feed water was introduced. The layer of HAOPs created this way has the resistance across the layer between 1.4 and 2.4 × 10¹¹ m−1 [21] and the HAOPs thickness of 5~10 µm [27].
For the filtration test, the water from the Olesnica river was delivered to the unit (Figure 1) which was operated in a dead-end mode using a flat sheet PES membrane fitted into the filter cartridge at operating conditions of 150 Liters per square meter per hour (LMH) and ambient temperature (20 ± 5 °C).
The water flux J was then calculated from Equation (5):
where V (L) is the cumulative volume of permeate obtained during time t (h) and the surface area A (m2) of the membrane.
All cycles had similarly long durations except for the test carried out on a pristine membrane (the control run).
In the first experiment, the feed water was applied directly to the cartridge filter with no exposure to any pre-treatment. The second experiment involved depositing 20 g/m2 HAOPs as the effective surface load of Al (mg Al per liter of water treated). The third experiment was identical to the second, but the dose of HAOPs was reduced by half (10 g/m2). In the last experiment, 17 g/m2 of HAOPs was applied. After each HAOPs deposition, in all filtration experiments, the feed water was fed to the filter. Usually, the permeate was collected for analysis as a composite from the entire filtration cycle, and, in several tests, the parameters discussed were measured each hour.
2.8.2. Data Processing
Data were analyzed with Microsoft Excel (Microsoft Office Home and Student 2019). The percent removal efficiency formula was used to calculate the performance of the dynamic membrane adsorber to assess how much NOM was removed:
3. Results and Discussion
3.1. Surface Characterization
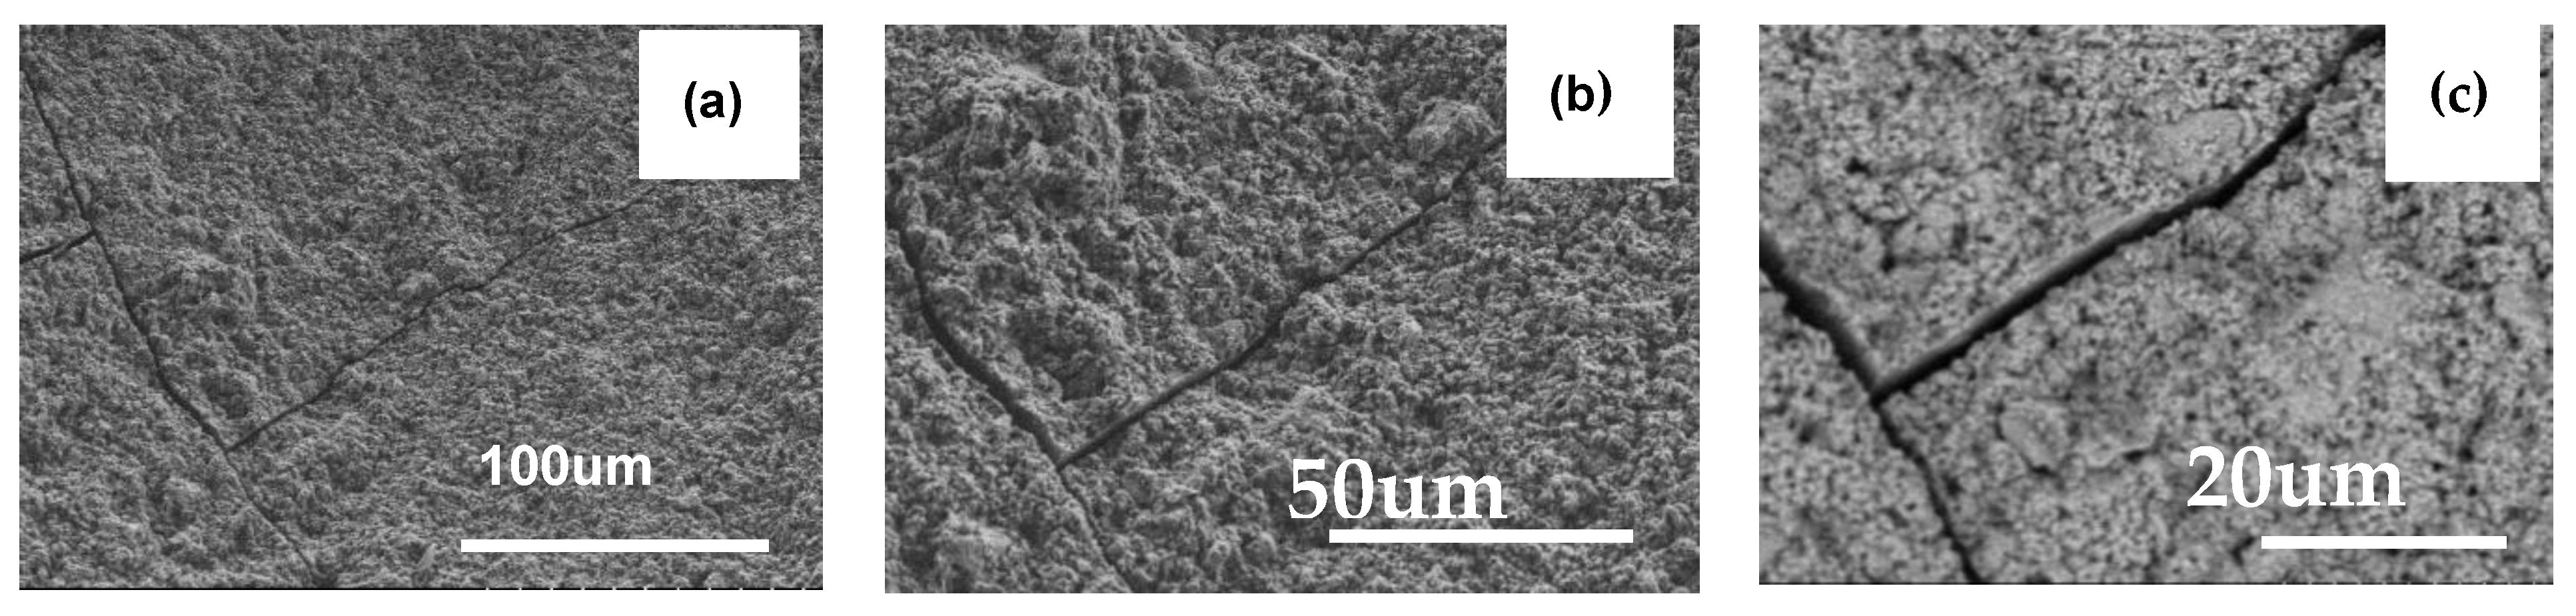
SEM characterization was applied to the utilized DM adsorber. SEM imaging confirms that HAOPs were deposited on the surface of the PES membrane. However, the preparation of the sample (drying) causes cracks in the HAOPs layer. Nevertheless, the SEM images of the top of the HAOPs layer have an irregular morphology that consists of closely packed particles of irregular spherical shapes. Similar observation was attributed to the agglomeration of almost spherical particles fabricated during atomization [19]. Figure 2 depicts the surface morphology of the HAOPs layer.
Earlier research on HAOPs cake layer indicated that it did not impact the membrane permeation [19,21,22,23,26,27,28,30]. The TMP before and after HAOPs deposition, when DI water was filtered through the membrane unit, was monitored constantly [28,30]. There was no significant increase in pressure after precoating the HAOPs layer on membrane surface.
Kim et al. [21], reported that the particles’ point of zero charge was at pH 7.7 and the BET surface area of HAOPs was 116 m2/g. Additionally, they reported that the solubility of HAOPs was less than 1 µg/L as Al at 4.5 < pH < 9.3. The mean diameter and the specific surface area of HAOPs were 30 μm and 35.6 m2/g, respectively [25].
Presented dynamic membrane adsorber creates a cake (gel-like structure) on top of the primary membrane that acts as a secondary membrane and retains NOM [35]. Foulants are retained and accumulated in the secondary membrane and—in dead-end filtration—the cake grows and, consequently, increases TMP over time. The application of dynamic membrane adsorber was successfully used in conjunction with hydrodynamics of plug-flow. Liu reported that HAOPs layer was found to be incompressible and applied pressure had no effect on dynamic membrane adsorber performance [30].
3.2. Phosphorus Removal in Batch Adsorption Experiments
The Table 2 presents the results of calculating the constant and correlation coefficient (R2) of adsorption.
The data matched the evaluated isotherm equations very well, as shown in Figure 3.
High correlation coefficients (R2 > 0.99) indicated that the Langmuir model matched the experimental data in this study acceptably well. The adsorption of phosphorus removal could be described well by the Langmuir isotherms with a correlation value of R2 = 0.9894 which indicated that chemisorption was the dominant process and suggested the monolayer adsorption. The maximum amount of phosphorus required to form a monolayer is equal to 6.31 mg/g. This value showed that HAOPs had a high capacity to remove phosphorus. Additionally, the n value was higher than 1 which indicated that the adsorption intensity was favorable at higher concentrations. However, the Freundlich adsorption model also fitted the data well which indicates that the multi-molecular layer adsorption coexisted in this process. These observations were in agreement with the work reported earlier [36].
The adsorption kinetics of phosphorus onto dynamic membrane adsorber was investigated using the pseudo-first-order, pseudo-second-order models. Kinetics of phosphorus adsorption by HAOPs were fitted to the pseudo-first-order (Equation (7)) and pseudo-second-order (Equation (8)) models:
where k1 and k2 are first- and second-order adsorption rate constants.
For the initial phosphorus concentration of 18.2 mg/L, the pseudo-second-order equation fitted the experimental data better with a correlation coefficient R2 = 0.9924, when compared to the first-order model R2 = 0.7785. In addition, the difference between the experimental and theoretical adsorbed masses at equilibrium for the pseudo-second-order was lower than 5% (Table 3).
The separation parameter RL (between 0.02 and 0.14) indicates the adsorption nature to be favorable.
Earlier studies demonstrated that metal hydroxides have a high affinity to phosphorus compounds, especially aluminum hydroxides [6,12,33,36,37]. Yang et al. [36] revealed that the adsorption capacity is determined mainly by the population of surface functional groups on the adsorbents.
The mechanisms of phosphorous adsorption by alumina-based adsorbents have been investigated in previous studies [16,33,34,35,36,37,38,39,40,41,42,43,44,45,46,47,48,49,50,51,52]. Peinemann et al. [42] revealed that the chemisorption of phosphorous compounds is associated with the displacement of the surface hydroxyl groups. Furthermore, Yang et al. [36] reported that the mechanism of the removal process of phosphorus compounds is controlled mainly by chemisorption or chemical bonding. The rapid phosphorus adsorption was also attributed to the boundary layer diffusion or macro-pore diffusion, while the slow adsorption was attributed to the intraparticle diffusion or micro-sore diffusion [41]. The high applicability of the pseudo-second-order model for the presented kinetic data is also in agreement with other studies [36,41].
3.2.1. The Effect of the pH
The results indicated that the phosphorus removal was highest in the pH range of 6–7. The removal was over 94% and the final concentration was lowered to below 1.0 mg/L. The adsorption started to decline at pH 2 and pH 11 (Figure 4).
The pH directly affects the form of phosphorus in water [38]. Due to a competition between the hydroxide and phosphate ions for the metallic ion, the efficiency of phosphorous removal is controlled by the relative concentrations of these two ions in solution. Luk [50] when describing the phenomenon, reported that the hydroxides during precipitation have the tendency to pick up small particles which would otherwise stay in suspension.
Several studies pointed out that the pH is a critical factor that affects the adsorption of phosphorus compounds [33,36,38,51]. The presented results are consistent with a previous study performed by Szabo et al. (2008) who also noted the best phosphorus removal at pH between 5 and 7 [51]. Smith et al. [49] suggested that the mechanisms of phosphorus removal consist of two processes such as co-precipitation and adsorption of phosphorus compounds that occur simultaneously. They reported a trend linking the pH increase with iron hydroxide's behavior. Briefly, when pH increased, iron hydroxides started to precipitate and further pH increase involved re-solubilization of iron hydroxides due to a build-up of negative charge on their surface. When the pH was higher, the formation of solid iron hydroxides occurred [51].
3.2.2. The Effect of Ionic Strength on Phosphorus Removal Efficiency
The results of the test are presented in (Figure 5).
Only a small change in removal efficiency was observed for the ionic strength of 0.003 M. The removal efficiency decreased slowly with the increase in ionic strength. The most notable decrease was 37% for the highest concentration. Compared to lower concentrations this decrease was much smaller, e.g., for the concentration of 4.34 mg/L the decrease was only 3%. This indicates that for the adsorption at different ionic strengths and constant pH value, the sole variable is ionic strength. Possible changes in the electrical double layer surrounding a charged metal oxide surface in HAOPs can explain the results. The effect of changing the surface charge from positive to negative as the phosphorous saturation of the surface increases was reported by Kilmerski et al. [41]. They also revealed that the maximum phosphorous adsorption was achieved when all sorption sites became occupied.
3.2.3. Effect of Coexisting Organic Matter
Surface water contains substances that can compete with phosphorous for binding sites on the adsorbent surface. In order to simulate the presence of natural organic matter, humic acid (HA) was introduced to the phosphorous solution.
Addition of HA exhibited a slight decrease in phosphorus removal efficiency (Figure 6). This decrease was associated with an increase in HA concentration, resulting in a reduction of approximately 13% for the highest HA concentration. However, the reduction was relatively low considering the fact that in filtration experiments with surface water similar phosphorous removal efficiency was achieved and also considering the fact that in surface water such high concentrations do not usually occur.
HAOPs have been reported to be very efficient in removal of NOM in particular HA. Malczewska et al. [28] reported that when HA is added to the surface water, the UV254 removal efficiency increased to 85–90%. In this case, for the mixture of HA and K2HPO4 the removal of HA was as follows: HA concentration 3.86 mgC/L—67%, 9.65 mgC/L—69% and for the highest HA concentration of 15.44% the removal was only 33% (Figure 6). In the case of the removal rate for phosphorus the fluctuation in the removal efficiency was: For the concentration of 3.64 mgP/L it was 99.99%, and for the 14.56 mg/L it dropped to 87%.
Previous studies evaluated the competition with SO42−, HCO3, Ca and Mg. Lee reported that the phosphorus removal by HAOPs with addition of anions such as SO42−, NO3−, and Cl− or salts did not impact the removal efficiency even in the case of sulfate which is a potential competitor for adsorptive sites on HAOPs [24]. The effects of the concentration of divalent cations were investigated by Liu, and addition of Ca2+ or Mg2+ had no effect on removal efficiency of HAOPs [30].
3.3. Filtration Experiments
The tested water had an increased content of organic compounds (Table 1). High turbidity and color are indirect indicators of the amount of colloidal particles in water (Table 1). Polanski reported that the Olesnica River’s quality is affected by an excessive content of biogenic substances such as nitrogen, nitrite nitrogen, and phosphorus compounds [53]. The highest reported amount of P was 8 mgP/L [31]. The sources of nitrates and phosphorus in water may originate from a runoff of sewage, a runoff from fertilized soil, rainwater and natural processes of nitrogen compounds decomposition.
3.3.1. Phosphorous Removal in Filtration Experiments
The HAOPs technology was developed to mitigate fouling by removing NOM compounds responsible for it. The primary purpose of the application is to protect the downstream membrane and to ensure that the membrane is as effective as possible in removing contaminants. In this layout, DM made of HAOPs has the potential to remove other contaminants.
In the presented studies, the pristine membrane removed up to 74 ± 5% of phosphorous from the feed water. At the same time, in the case of phosphorus (Ptot.), the variations were greater (Figure 7). For the highest HAOPs dose, the degree of phosphorus removal ranged up to 93 ± 5%. The same removal efficiency was observed for the lowest dose while for 17 g/m2 of HAOPs the fluctuations were larger and varied from 64.7% to 92%. Such low removal efficiency for that dose may be due to the poor sealing in the first filtration which was fixed in all subsequent tests. An example of a typical variation in the removal of phosphorus over a period of time, corresponding to the duration of the control run, is shown in Figure 7. The HAOPs removal capacity was proportional to the thickness of the layer (of 5 um), which is consistent with the previous findings [19,21,22,23,24]. In the range of analyzed HAOPs doses, and thus the HAOPs layer thickness, no significant increase in pressure or decrease in the membrane flux was observed when DI was filtered through the system.
In this study, a DM based on HAOPs reduced phosphorus from the Olesnica river by 77%, which is likely connected with its low initial concentration in feed water. Penn et al. [52] outlined the impact of higher phosphorus concentrations on its removal. According to their study, the higher the concentration of reactants the greater the chemical potential for ligand exchange. The retention time, along with the initial phosphorus concentration in feed water, allowed for greater phosphorus removal [22]. Presented results confirmed the impact of initial concentration on removal efficiency. For the initial concentration between 0.32 to 1.3 mg/L the removal efficiency was up to 77% but when the concentration in the synthetic feed water increased, the removal efficiency also increased, and it was 99.9% for 18.2 mg/L. Therefore, the adsorption capacity of HAOPs is very likely dependent on phosphorus concentration in the feed water.
Moreover, Lee et al. (2019) reported 99.5% phosphorus removal when the MBR effluent was applied, in the concentration range from 4 to 9 mg/L [24].
This study, although considering surface water, showed a significant difference in the removal of phosphorus. It may be connected with a relatively low concentration of phosphorus in the feed water within the analyzed period of time. The highest recorded concentration in the Olesnica river was 1.53 mg/L. The results show that the initial phosphorus concentration correlates with increasing phosphorous removal, which is in agreement with earlier studies [7,36,37,38,39,40,41,42,43,44,45,46,47,48,49,50,51,52,53,54,55,56,57,58,59,60,61].
3.3.2. NOM Removal in Filtration Experiments
In the initial experiments, the reduction in ultraviolet absorbance at 254 nm (UV254 nm), commonly considered an appropriate surrogate to assess NOM removal, was monitored. The most common wavelengths for NOM measurements are from 220 to 280 nm. Absorbance at 254 nm is typical for measurements of aromatic compounds [53,54]. When water was filtered through the pristine membrane, small quantities, typically 18% (Figure 8), of NOM were removed from the feed water (based on UV254nm absorbance). That level of effectiveness increased when the membrane was coated with HAOPs.
Duration of Filtration Cycles
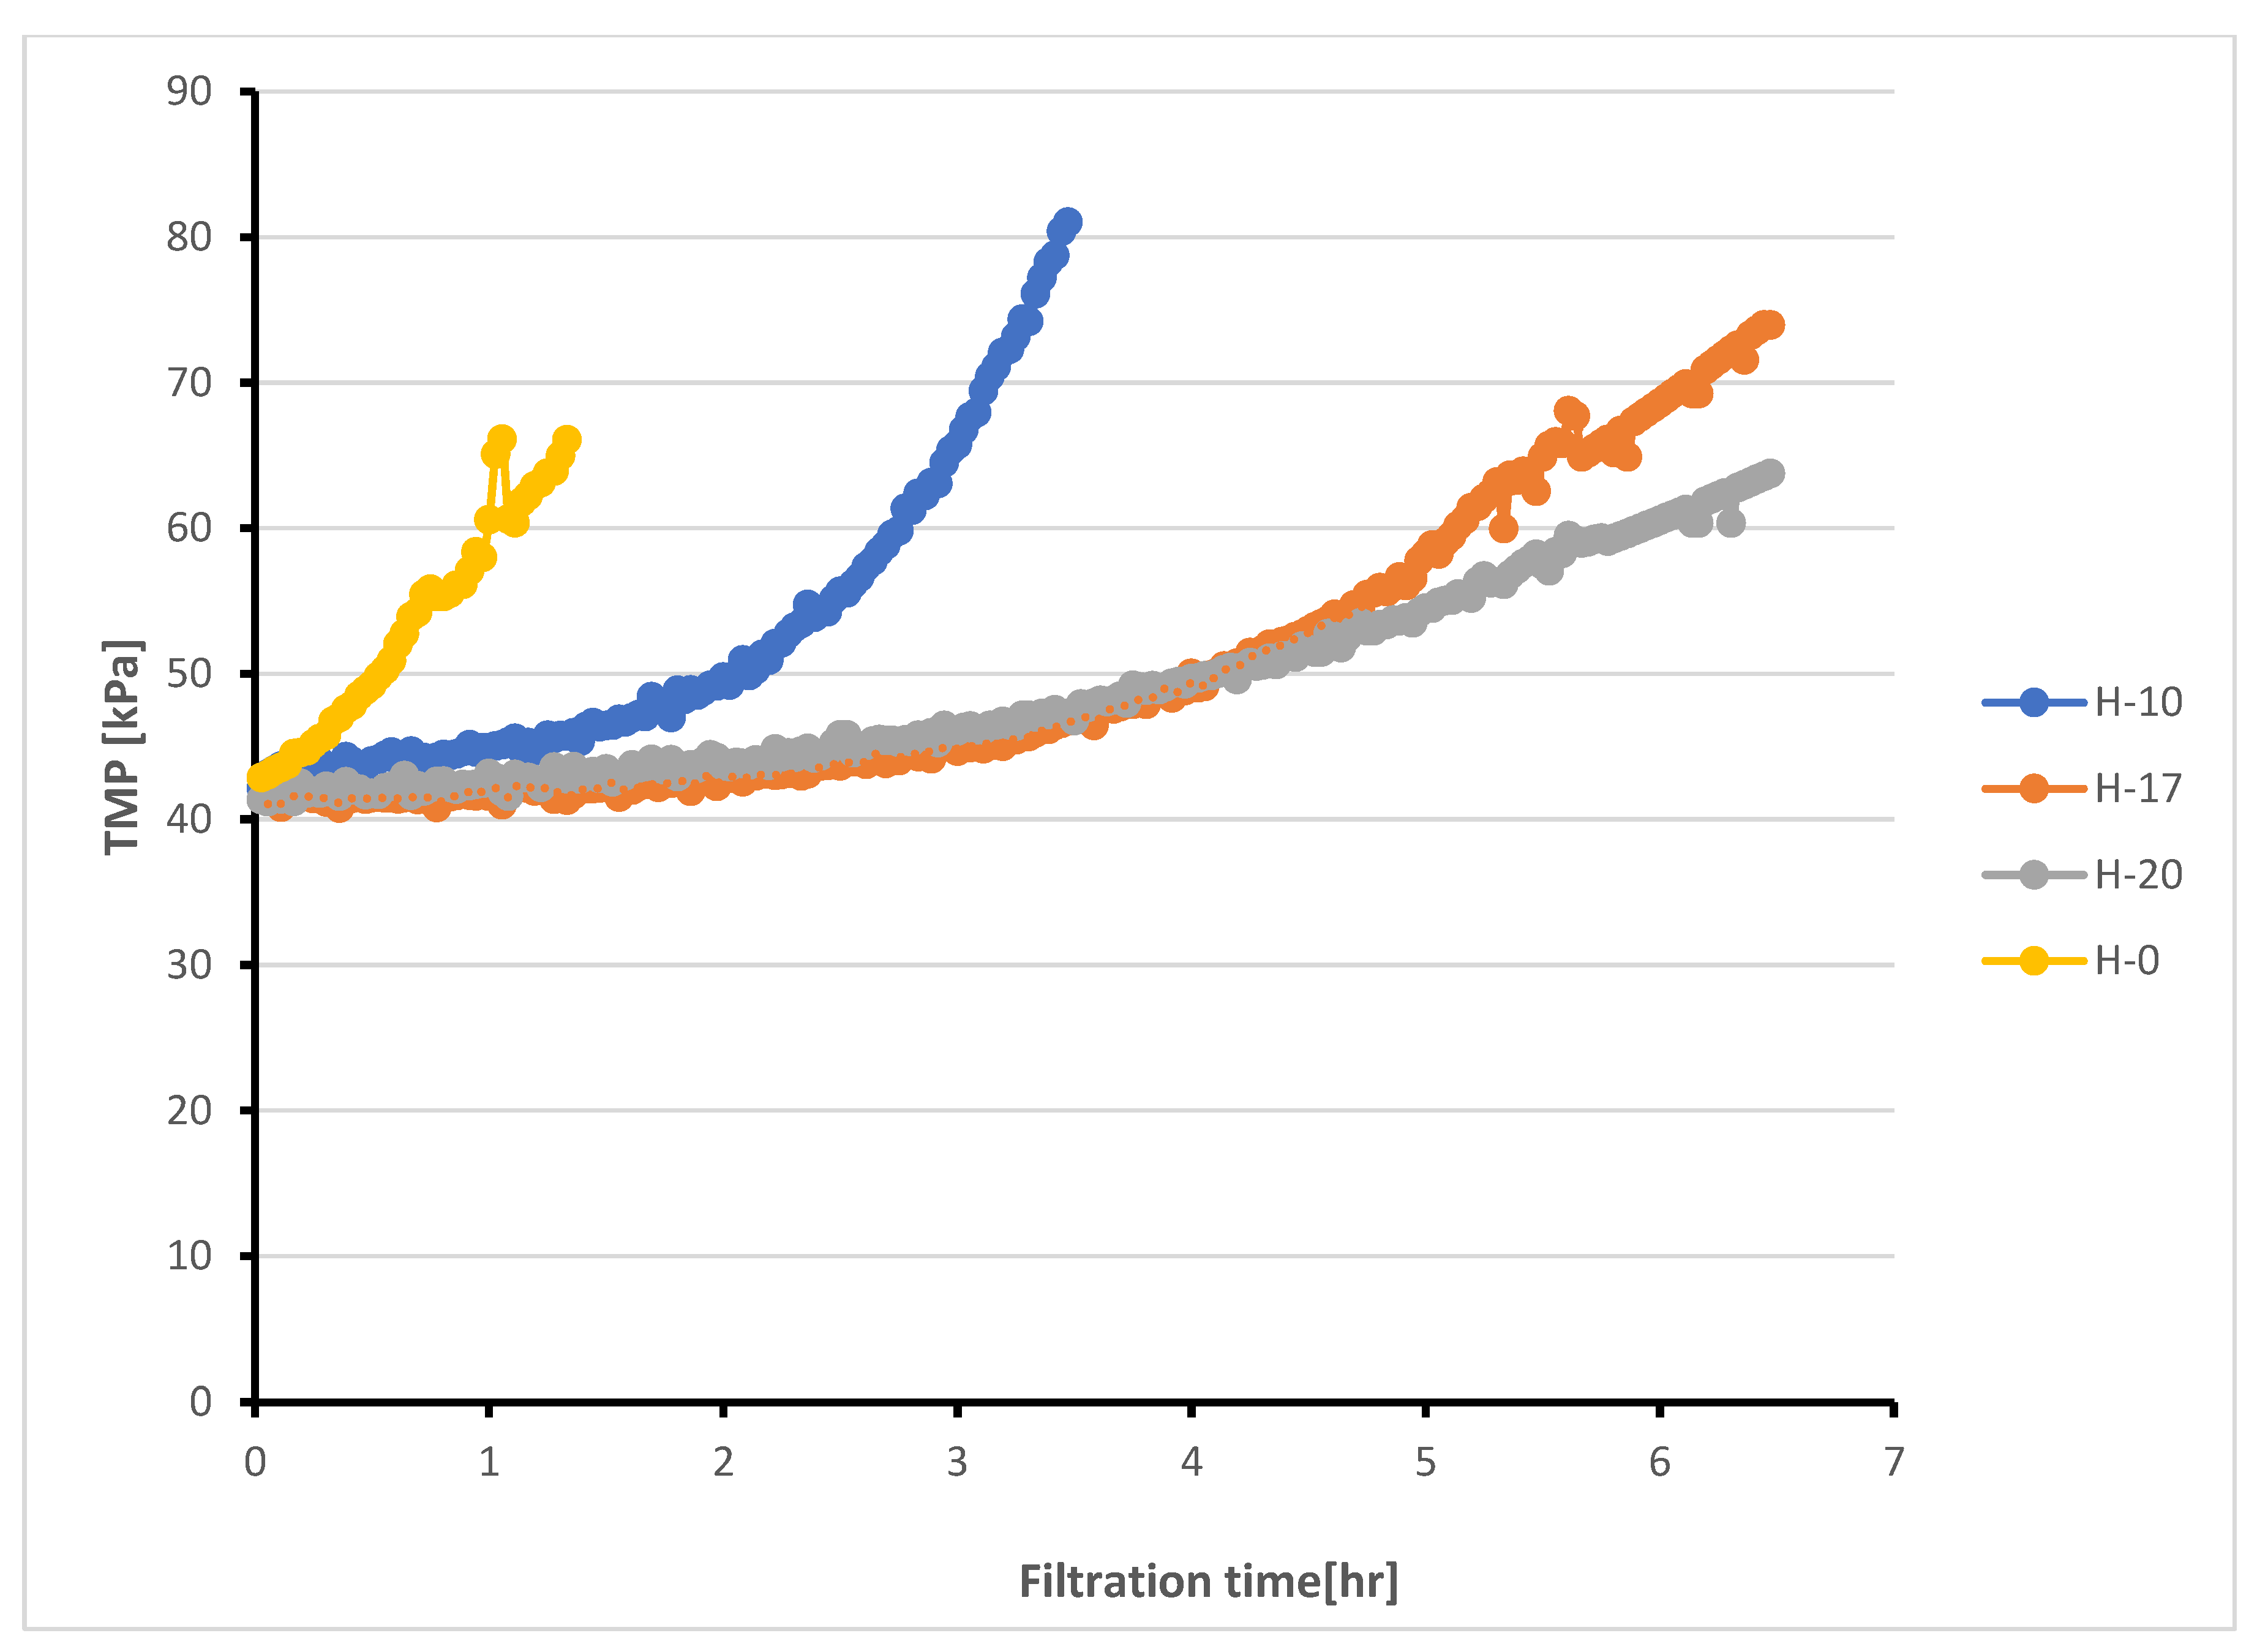
In preliminary tests, the pressure on the pristine membrane reached its limit (81 kPa—set by the software) in less than four hours of filtration, whereas with HAOPs surface loading of 20 and 17 g/m2, no pressure increase was recorded. For HAOPs surface loading of 10 g/m2, the increase was only 2.5 kPa within the same period of time (Figure 9).
Pressure Loss
Figure 9 presents the changes of TMP as a function of time. When HAOPs were applied, TMP was built up much slower than when the feed water was applied directly to the membrane (a control run). It has been observed that the higher the surface loading of HAOPs applied, the slower the TMP is built up. However, in the case of surface loading of 17 g/m2 and 20 g/m2, the difference was relatively small, unlike for 10 g/m2 dose.
Observed TMP build-up is in agreement with experimental results presented elsewhere [19,22,28]. With the flux used in these experiments (150 LMH), TMP increased exponentially during the control run, contrary to the filtration unit where HAOPs were pre-deposited.
Additionally, the influence of the HAOPs surface loading on the effectiveness of NOM removal was assessed. Consistent with the results from previous reports, HAOPs efficiency in NOM removal reached up to 75% removal of aromatic parts of NOM on average [3,4,5,6,7,8,9,10]. The tested surface loading (20, 17 and 10 g/m2 as Al) did not significantly affect the removal of that fraction. However, there is a clear decrease in HAOPs effectiveness in NOM fraction removal at 220 nm, which is associated with carboxylic and aromatic chromophores.
In the case of NOM removal, at the beginning of the filtration cycle, it was 77.73% and then, after 7 h of filtration, it decreased to 57.49%. During this filtration that lasted for 7 h permeate samples were taken for analysis every hour (Figure 10). The drop in removal efficiency may be due to DM depletion and the need of backwashing it, following pre-depositing a new HAOPs layer. The short operating time of DM adsorber may be caused by the lack of use of any kind of pre-filtration.
In addition to the absorbance, and in order to assess NOM removal surrogates, such as COD-KMnO4, the turbidity and color test was executed. According to the results of the study, HAOPs perfectly removed the part of NOM which is responsible for the color of water. Regardless of surface loading, in the composite permeate, the removal was over 80%, turbidity was reduced by more than 90%, whereas, in the case of COD-KMnO4, the rate of removal was much lower and remained just below 60% on average.
This study is a confirmation that a layer of HAOPs can be effectively deposited on a membrane and create a permeable layer of DM that can protect the downstream membrane and be utilized for phosphorus removal from surface water. This particularly applies to highly contaminated surface water. However, this process requires optimization, because many parameters need to be considered before applying the studied technology. Factors such as adsorbent dose, temperature, and contact time need to be evaluated for a proper design of the setup as an operating system. Many of the literature reports emphasize the relationship between the abovementioned parameters and the removal efficiency [16,37,38,39,40,41,42,43,44,45,46,47,48,49,50,51,52,56,57,58,59,60,61].
The proposed adsorbent can be a subject of further application studies. However, the presented studies indicate its high efficiency in phosphorus removal from highly contaminated. According to results from this study, increased phosphorus concentration in water resulted in better removal, and the best removal was achieved at the pH 6–7 (on average 96.65%).
4. Summary and Conclusions
The presented study tested the application of dynamic membrane adsorber (HAOPs) for the removal of phosphorus from surface water. The results showed that the maximum removal efficiency of 77% was achieved in the case of phosphorus while phosphate was removed below the detection limit. In the case of NOM, the results indicate that the process is very efficient, with the removal varying between 57.49% and 92%, depending on the dose of HAOPs.
In the case of synthetic water, the maximum removal efficiency of 99.99% was achieved. As for the adsorption capacity, this study revealed that the Langmuir adsorption isotherm fits the experimental data best (0.9893). The kinetics of phosphorus adsorption on HAOPs was best described by the pseudo-second-order model.
The best removal of phosphorus was achieved neutral pH (pH 6–7) and the increase in ionic strength did not significantly impact the efficiency of phosphorus removal.
The presence of organic matter slightly decreases the removal efficiency of phosphorus and this applies mainly to highly contaminated waters.
The evaluated process should be investigated further. The adsorption of phosphorus on DM involving adsorption on HAOPs and membrane filtration looks promising, but it needs optimization.
Research has shown that HAOPs are highly effective when the phosphorus content in surface water is high, at the same time as the concentration in the raw water decreases, the efficiency of the removal of this element decreases.
Funding
This research received no external funding.
Data Availability Statement
Not applicable.
Conflicts of Interest
The author declares no conflict of interest.
References
- Anantharaman, A.; Chun, Y.; Hua, T.; Chew, J.W.; Wang, R. Pre-deposited dynamic membrane filtration—A review. Water Res. 2020, 173, 115558. [Google Scholar] [CrossRef]
- Ersahin, M.E.; Ozgun, H.; Dereli, R.K.; Ozturk, I.; Roest, K.; van Lier, J.B. A review on dynamic membrane filtration: Materials, applications and future perspectives. Bioresour. Technol. 2012, 122, 196–206. [Google Scholar] [CrossRef]
- Millanar-Marfa, J.M.J.; Borea, L.; De Luna, M.D.G.; Belgiorno, V.; Naddeo, V. Self-Forming Dynamic Membrane: A Review Frontiers in Water-Energy-Nexus—Nature-Based Solutions, Advanced Technologies and Best Practices for Environmental Sustainability. In Proceedings of the 2nd WaterEnergyNEXUS Conference, Salerno, Italy, 14–17 November 2018; pp. 129–132. [Google Scholar]
- Li, L.; Xu, G.; Yu, H. Dynamic. Membrane Filtration: Formation, Filtration, Cleaning and Applications. Chem. Eng. Technol. 2017, 44, 7–18. [Google Scholar] [CrossRef]
- Zhang, Y.; Zhao, Y.; Chu, H.; Dong, B.; Zhou, X. Characteristics of dynamic membrane filtration: Structure, operation mechanisms, and cost analysis. Chin. Sci. Bull. 2014, 59, 247–260. [Google Scholar] [CrossRef]
- Miettinen, I.T.; Vartiainen, T.; Martikainen, P.J. Phosphorus and bacterial growth in drinking water. Appl. Environ. Microbiol. 1997, 63, 3242–3245. [Google Scholar] [CrossRef] [Green Version]
- Prest, E.I.; Hammes, F.; van Loosdrecht, M.; Vrouwenvelder, J.S. Biological Stability of Drinking Water: Controlling Factors, Methods, and Challenges. Front. Microbiol. 2016, 7, 45. [Google Scholar] [CrossRef]
- Srinivasan, S.; Harrington, G.W. Biostability analysis for drinking water distribution systems. Water Res. 2007, 41, 2127–2138. [Google Scholar] [CrossRef]
- Escobar, I.C.; Randall, A.A.; Taylor, J.S. Bacterial Growth in Distribution Systems: Effect of Assimilable Organic Carbon and Biodegradable Dissolved Organic Carbon. Environ. Sci. Technol. 2001, 35, 3442–3447. [Google Scholar] [CrossRef]
- van der Kooij, D. Significance and Assessment of the Biological Stability of Drinking Water. In Water Pollution; Springer: Berlin/Heidelberg, Germany, 1995; Volume 5, pp. 89–102. [Google Scholar]
- Wang, Q.; Tao, T.; Xina, K. The Relationship between Water Biostability and Initial Bacterial Growth Variations to Different Organic Carbon Concentrations. Procedia Eng. 2014, 89, 160–167. [Google Scholar] [CrossRef] [Green Version]
- Wolska, M. Efficiency of removal of biogenic substances from water in the process of biofiltration. Desalination Water Treat. 2016, 57, 1354–1360. [Google Scholar] [CrossRef]
- WHO. Guidelines for Drinking-Water Quality, 3rd ed.; WHO: Geneva, Switzerland, 2008; Volume 1, Available online: https://www.who.int/water_sanitation_health/dwq/fulltext.pdf (accessed on 15 July 2021).
- Kowal, A.L.; Świderska-Bróż, M. Oczyszczanie Wody; Wydaw Naukowe PWN: Warsaw, Poland, 1996. [Google Scholar]
- Bunce, J.T.; Ndam, E.; Ofiteru, I.D.; Moore, A.; Graham, D.W. A Review of Phosphorus Removal Technologies and Their Applicability to Small-Scale Domestic Wastewater Treatment Systems. Front. Environ. Sci. 2018, 22, 8. [Google Scholar] [CrossRef] [Green Version]
- Boisvert, J.-P.; To, T.C.; Berrak, A.; Jolicoeur, C. Phosphate adsorption in flocculation processes of aluminium sulphate and poly-aluminium-silicate-sulphate. Water Res. 1997, 31, 1939–1946. [Google Scholar] [CrossRef]
- Galjaard, G.; Buijs, P.; Beerendonk, E.; Schoonenberg, F.; Schippers, J.C. Pre-coating (EPCE) UF membranes for direct treatment of surface water. Desalination 2001, 139, 305–316. [Google Scholar] [CrossRef]
- Ersahin, M.E.; Tao, Y.; Ozgun, H.; Spanjers, H.; van Lier, J.B. Characteristics and role of dynamic membrane layer in anaerobic membrane bioreactors. Biotechnol. Bioeng. 2016, 113, 761–771. [Google Scholar] [CrossRef] [PubMed]
- Cai, Z.; Kim, J.; Benjamin, M.M. NOM removal by adsorption and membrane filtration using heated aluminum oxide particles. Environmental. Sci. Technol. 2008, 42, 619–623. [Google Scholar] [CrossRef]
- Chun, Y.; Hua, T.; Anantharaman, A.; Chew, J.W.; Cai, N.; Benjamin, M.; Wang, R. Organic matter removal from a membrane bioreactor effluent for reverse osmosis fouling mitigation by microgranular adsorptive filtration system. Desalination 2021, 506, 115016. [Google Scholar] [CrossRef]
- Kim, J.; Cai, Z.; Benjamin, M.M. Effects of adsorbents on membrane fouling by natural organic matter. J. Membr. Sci. 2008, 310, 356–364. [Google Scholar] [CrossRef]
- Kim, J.; Cai, Z.; Benjamin, M.M. NOM fouling mechanisms in a hybrid adsorption/ membrane system. J. Membr. Sci. 2010, 349, 35–43. [Google Scholar] [CrossRef]
- Kim, J.; Shi, W.; Yuan, Y.; Benjamin, M.M. A serial filtration investigation of membrane fouling by natural organic matter. J. Membr. Sci. 2007, 294, 115–126. [Google Scholar] [CrossRef]
- Lee, G.; Modarresi, S.; Benjamin, M.M. Efficient phosphorus removal from MBR effluent with heated aluminum oxide particles (HAOPs). Water Res. 2019, 159, 274–282. [Google Scholar] [CrossRef]
- Modarresi, S.; Benjamin, M.M. Using adsorbent mixtures to mitigate membrane fouling and remove NOM with microgranular adsorptive filtration. J. Membr. Sci. 2018, 573, 528–533. [Google Scholar] [CrossRef]
- Malczewska, B. 5Evaluation of effectiveness of natural organic compounds removal from water in hybrid processes. J. Land Water Dev. 2016, 30, 81–85. [Google Scholar] [CrossRef] [Green Version]
- Malczewska, B.; Benjamin, M.M. Efficacy of hybrid adsorption/membrane pretreatment for low. Water Res. 2016, 99, 263–271. [Google Scholar] [CrossRef] [Green Version]
- Malczewska, B.; Liu, J.; Benjamin, M.M. Virtual elimination of MF and UF fouling by adsorptive precoat filtration. J. Membr. Sci. 2015, 479, 159–164. [Google Scholar] [CrossRef]
- Manamperuma, L.D.; Vik, E.A.; Benjamin, M.; Cai, Z.; Skjefstad, J. Effects of a Novel Adsorbent on Membrane Fouling by Natural Organic Matter in Drinking Water Treatment. Membranes 2019, 9, 151. [Google Scholar] [CrossRef] [Green Version]
- Liu, J.C.W. Effects of Operational Parameters on Microgranular Adsorptive Filtration (μGAF). Ph.D. Thesis, University of Washington, Seattle, WA, USA, 2015; p. 115. Available online: https://digital.lib.washington.edu/researchworks/bitstream/handle/1773/35159/Liu_washington_0250E_15263.pdf?sequence=1 (accessed on 15 July 2021).
- Leadership of Chief Inspectorate of Environmental Protection(LCIEP). Report on the State of the Environment in Poland 2008. Available online: https://www.gios.gov.pl/en/state-of-the-environment/state-environmental-monitoring (accessed on 15 July 2021).
- Standard Methods for the Examination of Water and Wastewater. Available online: https://www.standardmethods.org (accessed on 14 July 2021).
- Yuan, X.; Xia, W.; An, J.; Yin, J.; Zhou, X.; Yang, W. Kinetic and Thermodynamic Studies on the Phosphate Adsorption Removal by Dolomite Mineral. J. Chem. 2015, 2015, 853105. [Google Scholar] [CrossRef] [Green Version]
- Inam, E.; Warwick, P.; Evans, N. The Interaction of Phosphorus with Humic Acid. IJCEPR 2010, 1, 119–124. [Google Scholar]
- Usman, M.; Belkasmi, A.I.; Kastoyiannis, I.A.; Ernst, M. Pre-deposited dynamic membrane adsorber formed of microscale conventional iron oxidebased adsorbents to remove arsenic from water: Application study and mathematical modeling. J. Chem. Technol. Biotechnol. 2021, 96, 1504–1514. [Google Scholar] [CrossRef]
- Yang, X.; Wang, D.; Sun, Z.; Tang, H. Adsorption of phosphate at the aluminum (hydr)oxides–water interface: Role of the surface acid–base properties. Colloids Surf. A Physicochem. Eng. Asp. 2007, 297, 84–90. [Google Scholar] [CrossRef]
- Pan, M.; Lin, X.; Xie, J.; Huang, X. Kinetic, equilibrium and thermodynamic studies for phosphate adsorption on aluminum hydroxide modified palygorskite nano-composites. RSC Adv. 2017, 7, 4492–4500. [Google Scholar] [CrossRef] [Green Version]
- Barrow, N.J. The effects of pH on phosphate uptake from the soil. Plant Soil 2017, 410, 401–410. [Google Scholar] [CrossRef]
- Tang, Q.; Li, N.; Lu, Q.; Wang, X.; Zhu, Y. Study on Preparation and Separation and Adsorption Performance of Knitted Tube Compositeβ-Cyclodextrin/Chitosan. Porous Membrane. Polymers 2019, 11, 1737. [Google Scholar] [CrossRef] [Green Version]
- Xiong, J.B.; Qin, Y.; Islam, E.; Yue, M.; Wang, W.F. Phosphate removal from solution using powdered freshwater mussel shells. Desalination 2011, 276, 317–332. [Google Scholar] [CrossRef]
- Klimeski, A.; Chardon, W.J.; Uusitalo, R.; Turtola, E. Potential and limitations of phosphate reduction media in water protection: A process-based review of laboratory and field scale tests. Agric. Food Sci. 2012, 21, 206–223. [Google Scholar] [CrossRef] [Green Version]
- Peinemann, N.; Helmy, A.K. Sorption of phosphate by hydrous oxides of aluminium and iron. J. Electroanal. Chem. Interfacial Electrochem. 1977, 78, 325–330. [Google Scholar] [CrossRef]
- Riahi, K.; Chaabane, S.; Thayer, B.B. A kinetic modeling study of phosphate adsorption onto Phoenix dactylifera L. date palm fibers in batch mode. J. Saudi Chem. Soc. 2017, 21, S143–S152. [Google Scholar] [CrossRef] [Green Version]
- Thistleton, J.; Clark, T.; Pearce, P.; Parsons, S.A. Mechanisms of Chemical Phosphorus Removal: 1—Iron (II) Salts. Process. Saf. Environ. Prot. 2001, 79, 339–344. [Google Scholar] [CrossRef]
- Vasudevan, S.; Sozhan, G.; Ravichandran, S.; Jayaraj, J.; Lakshmi, J.; Sheela, M. Studies on the Removal of Phosphate from Drinking Water by Electrocoagulation Process. Ind. Eng. Chem. Res. 2008, 47, 2018–2023. [Google Scholar] [CrossRef]
- Zhang, L.; Hong, S.; He, J.; Gan, F.; Ho, Y.S. Isotherm Study of Phosphorus Uptake from Aqueous Solution Using Aluminum Oxide. Clean Soil Air Water 2010, 38, 831–836. [Google Scholar] [CrossRef]
- Weng, L.; Van Riemsdijk, W.H.; Hiemstra, T. Factors Controlling Phosphate Interaction with Iron Oxides. J. Environ. Qual. 2012, 42, 628–635. [Google Scholar] [CrossRef]
- Mekonnen, D.T.; Alemayehu, E.; Lennartz, B. Removal of Phosphate Ions from Aqueous Solutions by Adsorption onto Leftover Coal. Water 2020, 12, 1381. [Google Scholar] [CrossRef]
- Smith, S.; Takacs, I.; Murthy, S.; Daigger, G.T.; Szabo, A. Phosphate complexation model and its implications for chemical phosphorus removal. Water Environ. Res. 2008, 80, 428–438. [Google Scholar] [CrossRef]
- Luk, G.K. Removal of phosphorous by metallic coagulation: An experimental aid to dose computation. In Transactions on Modelling and Simulation; Ashurst Lodge, Ashurst, WIT Press: Southampton, UK, 1999; p. 21. ISSN 1743-355X. [Google Scholar]
- Szabó, A.; Takács, I.; Murthy, S.; Daigger, G.T.; Licsko, I.; Smith, S. Significance of design and operational variables in chemical phosphorus removal. Water Environ. Res. 2008, 80, 407–416.51. [Google Scholar] [CrossRef] [PubMed]
- Penn, C.; Chagas, I.; Klimeski, A.; Lyngsie, G.A. Review of Phosphorus Removal Structures: How to Assess and Compare Their Performance. Water 2017, 9, 583. [Google Scholar] [CrossRef]
- Polanski, J. Water and Sewage Management in the Oleśnica Rural Municipality. Infrastructure and Ecology of Rural Areas; Polska Akademia Nauk: Kraków, Poland, 2013; pp. 189–207. [Google Scholar]
- Korshin, G.; Chow, C.W.; Fabris, R.; Drikas, M. Absorbance spectroscopy based examination of effects of coagulation on the reactivity of fractions of natural organic matter with varying apparent molecular weights. Water Res. 2009, 43, 1541–1548. [Google Scholar] [CrossRef]
- Albrektienė, R.; Rimeika, M.; Zalieckienė, E.; Šaulys, V.; Zagorskis, A. Determination of organic matter by UV absorption in the ground water. J. Environ. Eng. Landsc. Manag. 2012, 20, 163–167. [Google Scholar] [CrossRef]
- Kwon, B.; Park, N.; Cho, J. Effects of a dynamic membrane formed with polyethylene glycol on the ultrafiltration of natural organic matter. Front. Environ. Sci. Eng. China 2010, 4, 172–182. [Google Scholar] [CrossRef]
- Son, C.; An, W.; Lee, G.; Jeong, I.; Lee, Y.G.; Chon, K. Adsorption Characteristics of Phosphate Ions by Pristine, CaCl2 and FeCl3-Activated Biochars Originated from Tangerine Peels. Separations 2021, 8, 32. [Google Scholar] [CrossRef]
- Edet, U.A.; Ifelebuegu, A.O. Kinetics, Isotherms, and Thermodynamic Modeling of the Adsorption of Phosphates from Model Wastewater Using Recycled Brick Waste. Processes 2020, 8, 665. [Google Scholar] [CrossRef]
- Wu, H.F.; Wang, J.P.; Duan, E.G.; Hu, W.H.; Dong, Y.B.; Zhang, G.Q. Phosphorus removal by adsorbent based on poly-aluminum chloride sludge. Water Sci. Eng. 2020, 13, 193–201. [Google Scholar] [CrossRef]
- Liu, Y.; Hu, X. Kinetics and Thermodynamics of Efficient Phosphorus Removal by a Composite Fibe. Appl. Sci. 2019, 9, 2220. [Google Scholar] [CrossRef]
- Massoudinejad, M.; Asadi, A.; Vosoughi, M.; Gholami, M.; Kakavandi, B.; Karami, M.A. A comprehensive study (kinetic, thermodynamic and equilibrium) of arsenic(V) adsorption using KMnO4 modified clinoptilolite. Korean J. Chem. Eng. 2015, 32, 2078–2086. [Google Scholar] [CrossRef]
Figure 1.
Schematic illustration of the setup.

Figure 2.
SEM images of the HAOPs layer (a) 100 μm, (b) 50 μm and (c) 20 μm.

Figure 3.
Phosphorus adsorption on dynamic membrane adsorber.

Figure 4.
The effect of pH on phosphorus removal by HAOPs (adsorbent dose = 1 g/L, agitation speed = 200 rpm, temperature = 25 °C ± 2 °C, contact time = 60 min).
Figure 4.
The effect of pH on phosphorus removal by HAOPs (adsorbent dose = 1 g/L, agitation speed = 200 rpm, temperature = 25 °C ± 2 °C, contact time = 60 min).

Figure 5.
Effects of ionic strength on phosphorus removal efficiency (adsorbent dose = 1 g/L, agitation speed = 200 rpm, temperature = 25 °C ± 2 °C, contact time = 60 min).
Figure 5.
Effects of ionic strength on phosphorus removal efficiency (adsorbent dose = 1 g/L, agitation speed = 200 rpm, temperature = 25 °C ± 2 °C, contact time = 60 min).

Figure 6.
Effects of humic acid presence on phosphorus removal (adsorbent dose = 1 g/L, agitation speed = 200 rpm, temperature = 20 °C, contact time = 60 min).
Figure 6.
Effects of humic acid presence on phosphorus removal (adsorbent dose = 1 g/L, agitation speed = 200 rpm, temperature = 20 °C, contact time = 60 min).

Figure 7.
Representation of data variability of phosphorus removal rate for the applied HAOPs surface loading of 10 g/m2, with flux of 150 LMH, the abscissa indicates the specific volume (Vsp) of permeate produced during filtration (the filtration was repeated 3 times, and the repetitions are marked as 1, 2 and 3).

Figure 8.
Data variability in ultraviolet absorption spectra in permeates for pristine membrane (H-0), adsorbent surface loading of 10 g/m2 (H-10), 17 g/m2 (H-17) and for 20 g/m2 (H-20).
Figure 8.
Data variability in ultraviolet absorption spectra in permeates for pristine membrane (H-0), adsorbent surface loading of 10 g/m2 (H-10), 17 g/m2 (H-17) and for 20 g/m2 (H-20).

Figure 9.
Membrane fouling during filtration of feed water with varying amounts of pre-deposited HAOPs. Constant flux: 150 L/(m2 h), the abscissa indicates the filtration time versus TMP. NOM concentration in terms of UV-VIS254 nm was 0.2525 1/cm on average.
Figure 9.
Membrane fouling during filtration of feed water with varying amounts of pre-deposited HAOPs. Constant flux: 150 L/(m2 h), the abscissa indicates the filtration time versus TMP. NOM concentration in terms of UV-VIS254 nm was 0.2525 1/cm on average.

Figure 10.
Removal efficiency (for the HAOPs surface loading of 17 g/m2 as Al) during feed water filtration, NOM concentration in terms of UV-VIS254 nm was 0.2525 L/cm on average.
Figure 10.
Removal efficiency (for the HAOPs surface loading of 17 g/m2 as Al) during feed water filtration, NOM concentration in terms of UV-VIS254 nm was 0.2525 L/cm on average.


Table 1.
Ranges of parameters of raw water quality.
| Parameter | Feed Water | ||
|---|---|---|---|
| Max | Min | ||
| pH | - | 7.2 | 6.1 |
| Conductivity | μS/cm | 485.8 | 394.1 |
| Color | gPt/L | 40 | 17 |
| UV-254 | 1/cm | 0.258 | 0.247 |
| Turbidity | NTU | 4.8 | 3.5 |
| COD-KmnO4 | mgO2/L | 19.8 | 7.8 |
| Chlorides | mgCl/L | 52.2 | 45.8 |
| PO4 | mgP/L | 0.16 | 0.05 |
| Ptotal | mgP/L | 1.53 | 0.46 |
| N-NO3 | mgN/L | 2.57 | 0.25 |
| N-NO2 | mgN/L | 0.045 | 0.03 |
| Total Nitrogen | mgN/L | 4.07 | 1.69 |
Table 2.
Parameters of Langmuir and Freundlich isotherms.
| Langmuir Isotherm Model | Freundlich Isotherm Model | ||||
|---|---|---|---|---|---|
| Qm (mg/g) | KL (L/mg) | Correlation Coefficient R2 | KF (L/mg)1/n | n (-) | Correlation Coefficient R2 |
| 6.31 | 1.85 | 0.9894 | 0.49 | 2.62 | 0.8904 |
Table 3.
Kinetic parameters of phosphorus adsorption onto HAOPs.
| Pseudo-First-Order | Pseudo-Second-Order | ||||||
|---|---|---|---|---|---|---|---|
| qe,exp (mg/g) | qe,cal (mg/g) | k1 (1/min) | R2 | qe,exp (mg/g) | qe,cal (mg/g) | k2 (g/mg min) | R2 |
| 1.25 | 0.92 | 0.00601 | 0.7785 | 1.25 | 1.10 | 0.02325 | 0.9924 |
| 1.32 | 1.37 | 1.32 | 1.37 | ||||
| 1.36 | 1.60 | 1.36 | 1.49 | ||||
| 1.49 | 1.71 | 1.49 | 1.56 | ||||
Publisher’s Note: MDPI stays neutral with regard to jurisdictional claims in published maps and institutional affiliations. |
© 2021 by the author. Licensee MDPI, Basel, Switzerland. This article is an open access article distributed under the terms and conditions of the Creative Commons Attribution (CC BY) license (https://creativecommons.org/licenses/by/4.0/).
Share and Cite
MDPI and ACS Style
Malczewska, B. Adsorption of Natural Organic Matter and Phosphorus from Surface Water Using Heated Aluminum Oxide (Predeposited) Dynamic Membrane Adsorber. Appl. Sci. 2021, 11, 7384. https://0-doi-org.brum.beds.ac.uk/10.3390/app11167384
AMA Style
Malczewska B. Adsorption of Natural Organic Matter and Phosphorus from Surface Water Using Heated Aluminum Oxide (Predeposited) Dynamic Membrane Adsorber. Applied Sciences. 2021; 11(16):7384. https://0-doi-org.brum.beds.ac.uk/10.3390/app11167384
Chicago/Turabian StyleMalczewska, Beata. 2021. "Adsorption of Natural Organic Matter and Phosphorus from Surface Water Using Heated Aluminum Oxide (Predeposited) Dynamic Membrane Adsorber" Applied Sciences 11, no. 16: 7384. https://0-doi-org.brum.beds.ac.uk/10.3390/app11167384
Note that from the first issue of 2016, this journal uses article numbers instead of page numbers. See further details here.