Article

Characterization of Five Portuguese Wastewater Treatment Plants: Removal Efficiency of Pharmaceutical Active Compounds through Conventional Treatment Processes and Environmental Risk

by
Sofia Silva
1,
Vitor Vale Cardoso
1,
Lúcia Duarte
1,
Rui Neves Carneiro
1 and
Cristina Maria Martins Almeida
2,3,*
1
Direção de Laboratórios e Controlo da Qualidade da Água (LAB) da Empresa Portuguesa das Águas Livres (EPAL), Avenida de Berlim, 15, 1800-031 Lisboa, Portugal
2
iMed.UL (Institute for Medicines and Pharmaceutical Sciences), Faculty of Pharmacy, University of Lisboa, Av. Prof. Gama Pinto, 2, 1649-003 Lisboa, Portugal
3
Laboratory of Bromatology and Water Quality, Faculty of Pharmacy, University of Lisbon, Av. Prof. Gama Pinto, 2, 1649-003 Lisboa, Portugal
*
Author to whom correspondence should be addressed.
Submission received: 30 June 2021 / Revised: 6 August 2021 / Accepted: 9 August 2021 / Published: 11 August 2021

Abstract

:
Due to the high consumption and incorrect disposal of pharmaceutical active compounds (PhACs), they are recognized as contaminants of emerging concern. Wastewater treatment plants (WWTPs) may be inefficient in removing PhACs, therefore discharging them into surface waters. The removal efficiencies of five WWTPs located in the south of Portugal (Alentejo) were evaluated in 2020. Twenty-six PhACs were analyzed in wastewater influents, effluents, and surface waters, upstream and downstream of the WWTPs by solid-phase extraction (SPE) and ultra-performance liquid chromatography coupled with tandem mass detection (UPLC-MS/MS). The most representative PhACs in influents were acetaminophen, caffeine, naproxen, ibuprofen, and diclofenac with minimum-maximum concentrations of 49–225 µg/L, 26–46 µg/L, 5.9–13 µg/L, 5.2–22 µg/L, and 1.3–2.5 µg/L, respectively. For effluents, it was acetaminophen, caffeine, and diclofenac with minimum-maximum concentrations of 0.054–7.8 µg/L, 0.084–4.8 µg/L, and 0.28–3.3 µg/L, respectively. The highest removal efficiencies were observed for acetaminophen, sulfadiazine, cortisone, testosterone, metoprolol, and propranolol (100%). The lowest removal efficiencies were observed for carbamazepine (2.7%) and diclofenac (−13.2%). The risk quotient of sulfamethoxazole and diclofenac were higher than 1 for receiving waters, indicating they probably pose high risks to aquatic organisms.

1. Introduction

Anthropogenic pressures and climate change are currently responsible for extreme changes in raw water availability and quality as well as the degradation of water sources. Regarding anthropogenic pressures, there has been growing concern about several biologically active environmental contaminants in the aquatic environment, mainly regarding the group of so-called contaminants of emerging concern (CECs). The CECs include many contaminants, such as pesticides, industrial chemicals (surfactants, gasoline additives, brominated flame retardants, plasticizers, and perfluorinated compounds), personal care products, pharmaceutical active compounds (PhACs), nanomaterials, etc.
Although their occurrence is usually in a low concentration range (from ng/L to μg/L) they are of environmental and health concern due to their potential toxic behavior, such as endocrine-disrupting and mutagenicity, among others [1].
Furthermore, CECs are a growing source of concern due to their presence in the environment as a result of inadequate treatment of wastewaters, which can lead to the pollution of water sources that are destined for human consumption [2].
In this group of contaminants, special attention has been given to PhACs. They are introduced to the aquatic environment via several routes, including direct discharge of raw or treated wastewater from municipal wastewater treatment plants [3,4], hospital effluents [5], landfill leachate [6], and surface runoff from agricultural areas where treated wastewater, sludge, or manure waste was used [4,7]. Among the aforementioned sources, WWTPs are of particular interest since they continuously discharge these target compounds into the environment [8]. Regarding antibiotics, they may also accelerate the development of antibiotic resistance genes and bacteria, which shade health risks to humans and animals [9,10].
The presence of PhACs indicates a gap in the removal of these compounds in current conventional wastewater treatment plants (WWTPs) [11], and efforts have been made to improve the knowledge and data available on sources of PhACs, namely in wastewaters (influents and effluents) and in potential receiving waters.
The impact on the environment will depend on the quality of the treated effluents. If the WWTP is not efficient in the treatment of the influents, the receiving water bodies will be negatively impacted due to the insufficient dilution effect of the treated effluents. Conversely, if the treatment is efficient, the effluents may be used as a way of replenishing streams that would otherwise be dry [12].
Águas de Portugal (AdP) is a group of several Portuguese companies responsible for the collection, treatment, quality control, and distribution of drinking water, which includes the management of WWTPs. As of 2015, AdP is responsible for the management of over 900 WWTPs of varying treatment capacities [13]. Many of these WWTPs are in rural regions that are significantly affected by drought, and often, the discharge areas of these facilities can be heavily impacted.
In the Alentejo region, it is common to experience drought and restrictions to water use along with high temperatures during the summer period. This combination of factors can lead to a reduction in the influent flows that reach WWTPs, which can result in higher concentrations of contaminants due to a lack of dilution effect. This phenomenon will most likely propagate throughout the WWTP facility, causing whatever contaminants that were not removed during the treatment process to be present in the effluents in higher concentrations [14].
As such, any receiving surface water or stream that is mainly composed of insufficiently treated wastewater effluents can have high concentrations of contaminants such as hydrocarbons, metalloids, pesticides, pharmaceutical active compounds (PhACs), and pathogenic microorganisms, among others [15,16]. These water bodies can also have variations in the concentrations of nutrients, such as reductions in total phosphorus and chemical oxygen demand or increases in nitrogen and nitrates [17,18]. These changes to water bodies can result in a degradation of water quality that will negatively impact normal fauna and flora, leading instead to an increase in species that can tolerate such conditions [19].
However, in cases in which WWTPs do not receive heavily contaminated industrial influents or use efficient treatment processes, such as tertiary treatment, treated effluents may support the restoration and replenishing of streams in areas that are highly affected by drought [19,20].
One such example is the use of treated effluents in the state of California, in which several case studies were conducted to test the use of effluents in different scenarios to renew depleted urban streams by direct or indirect means [20].
There are also examples of rivers in North America where effluents are used to regenerate or replenish these aquatic ecosystems, resulting in rivers that are effluent-dominated, namely the Santa Ana, the Trinity, the South Platte, and the Chattahoochee. However, to address concerns of pollution in these rivers, WWTPs were not only upgraded, specific wastewater management structures were constructed. For example, in the case of the Santa Ana River in California, wetlands were constructed to remove nitrate from discharged effluents that would be used for groundwater recharge [12,20].
Despite successful cases where effluents have been used, the widespread use, occurrence, and persistence of PhACs can hinder the safe reuse of effluents. Furthermore, as WWTPs were not designed to remove these contaminants, they can be released into the environment mostly unchanged.
Therefore, this study had two objectives: (i) to assess the removal efficiency of a group of 26 PhACs belonging to ten common therapeutic classes; and (ii) to determine the potential impact on surface waters where effluents are discharged.
For this purpose, five WWTPs of AdP located in the South of Portugal (Alentejo) were selected, and the concentrations in influents and effluent samples were determined. Furthermore, concentrations of PhACs were also evaluated in samples upstream and downstream of the discharge locations. Therefore, this study provides fundamental data for the enhancement of the current knowledge about the presence and fate of PhACs in the WWTPs, the effect of the treatment adopted, and their potential impact in receiving waters.

2. Materials and Methods

2.1. Reagents and Standards

The target PhACs were chosen considering the Portuguese data consumption provided by Infarmed (Portuguese Authority of Medicines and Health) and the compounds proposed in the Water Framework Directive [21,22]. Specifically, a group of 26 PhACs belonging to ten common therapeutic classes was chosen, namely, analgesics (acetaminophen—APAP), antibiotics (erythromycin—ERT, sulfadiazine—SDZ, sulfamethoxazole—SMX, sulfapyridine—SPD, azithromycin—AZM, and clarithromycin—CLR), non-steroidal anti-inflammatories (NSAIDs) (diclofenac—DCF, ibuprofen—IBUP, and naproxen—NPX), beta-blockers (atenolol—ATN, metoprolol—MTPL, and propranolol—PPNL), anti-dyslipidemics (clofibric acid—CFA and bezafibrate—BZF), sexual hormones (17-αethinylestradiol—EE2, β-estradiol—E2, estrone—E1, estriol—E3, diethylstilbestrol—DES, gestodene—GTD, and testosterone—TTE), antidepressants (fluoxetine—FLX), anticonvulsants (carbamazepine—CBZ), psychostimulants (caffeine—CAF), and corticosteroids (cortisone—CTS).
All standards of PhACs are of analytical grade (purity ≥ 95%), suitable for chromatographic analysis. The standards of acetaminophen, clofibric acid, atenolol, bezafibrate, carbamazepine, cortisone, diclofenac, erythromycin, estrone, fluoxetine, ibuprofen, naproxen, propranolol, sulfadiazine, sulfamethoxazole, sulfapyridine, clarithromycin, and azithromycin were provided by Sigma-Aldrich (Steinheim, Germany), caffeine, and testosterone by Fluka (Buchs, Switzerland), and gestodene and metoprolol by LGC (Teddington, UK). Diethylstilbestrol, estradiol, estriol, and 17-α-ethinylestradiol were purchased from Dr. Ehrenstorfer, GmbH (Augsburg, Germany). Individual stock solutions of PhACs were prepared in methanol and stored at −20 ± 3 °C in the absence of light. A standard mixture solution was prepared by diluting each standard solution in methanol to a concentration of 1 mg/L, except for ibuprofen with 2 mg/L and 6 mg/L for hormones. Methanol was LC/MS purity grade (J.T. Baker, Deventer, the Netherlands). Formic acid (liquid chromatography grade, ≥98%) and ammonium acetate (98%, p.a.) were provided by Merck (Darmstadt, Germany). Reagent water was obtained using a Milli-Q device, Academic A-10 model, from Millipore (Molsheim, France).

2.2. Material and Apparatus

Sample extraction was performed by solid-phase extraction (SPE) technique using an automated AutoTrace 280 SPE workstation, Thermo Scientific Dionex (Sunnyvale, CA, USA). The following material was used: Oasis HLB (200 mg, 6 mL) cartridges, quantitative filter paper, 1.0 µm glass microfiber, and 0.45 µm nylon membrane from Waters Corporation (Milford, MA, USA). Polytetrafluoroethylene (PTFE) syringe filters (13 mm × 0.45 μm) from Millipore were also used.
The quantification of PhACs was performed by liquid chromatography-tandem mass spectrometry (LC-MS/MS) using a Dionex Ultimate 3000 system from Thermo Scientific. This liquid chromatographer is coupled to a mass spectrometer TSQ Endura triple quadrupole (Thermo Scientific). A Kinetex EVO C18 column (2.1 cm × 50 mm × 2.6 μm) from Phenomenex (Torrance, CA, USA) was used to achieve chromatographic separation. The tandem mass spectrometer operated in both positive and negative ion ESI modes using multiple reaction monitoring (MRM) mode.

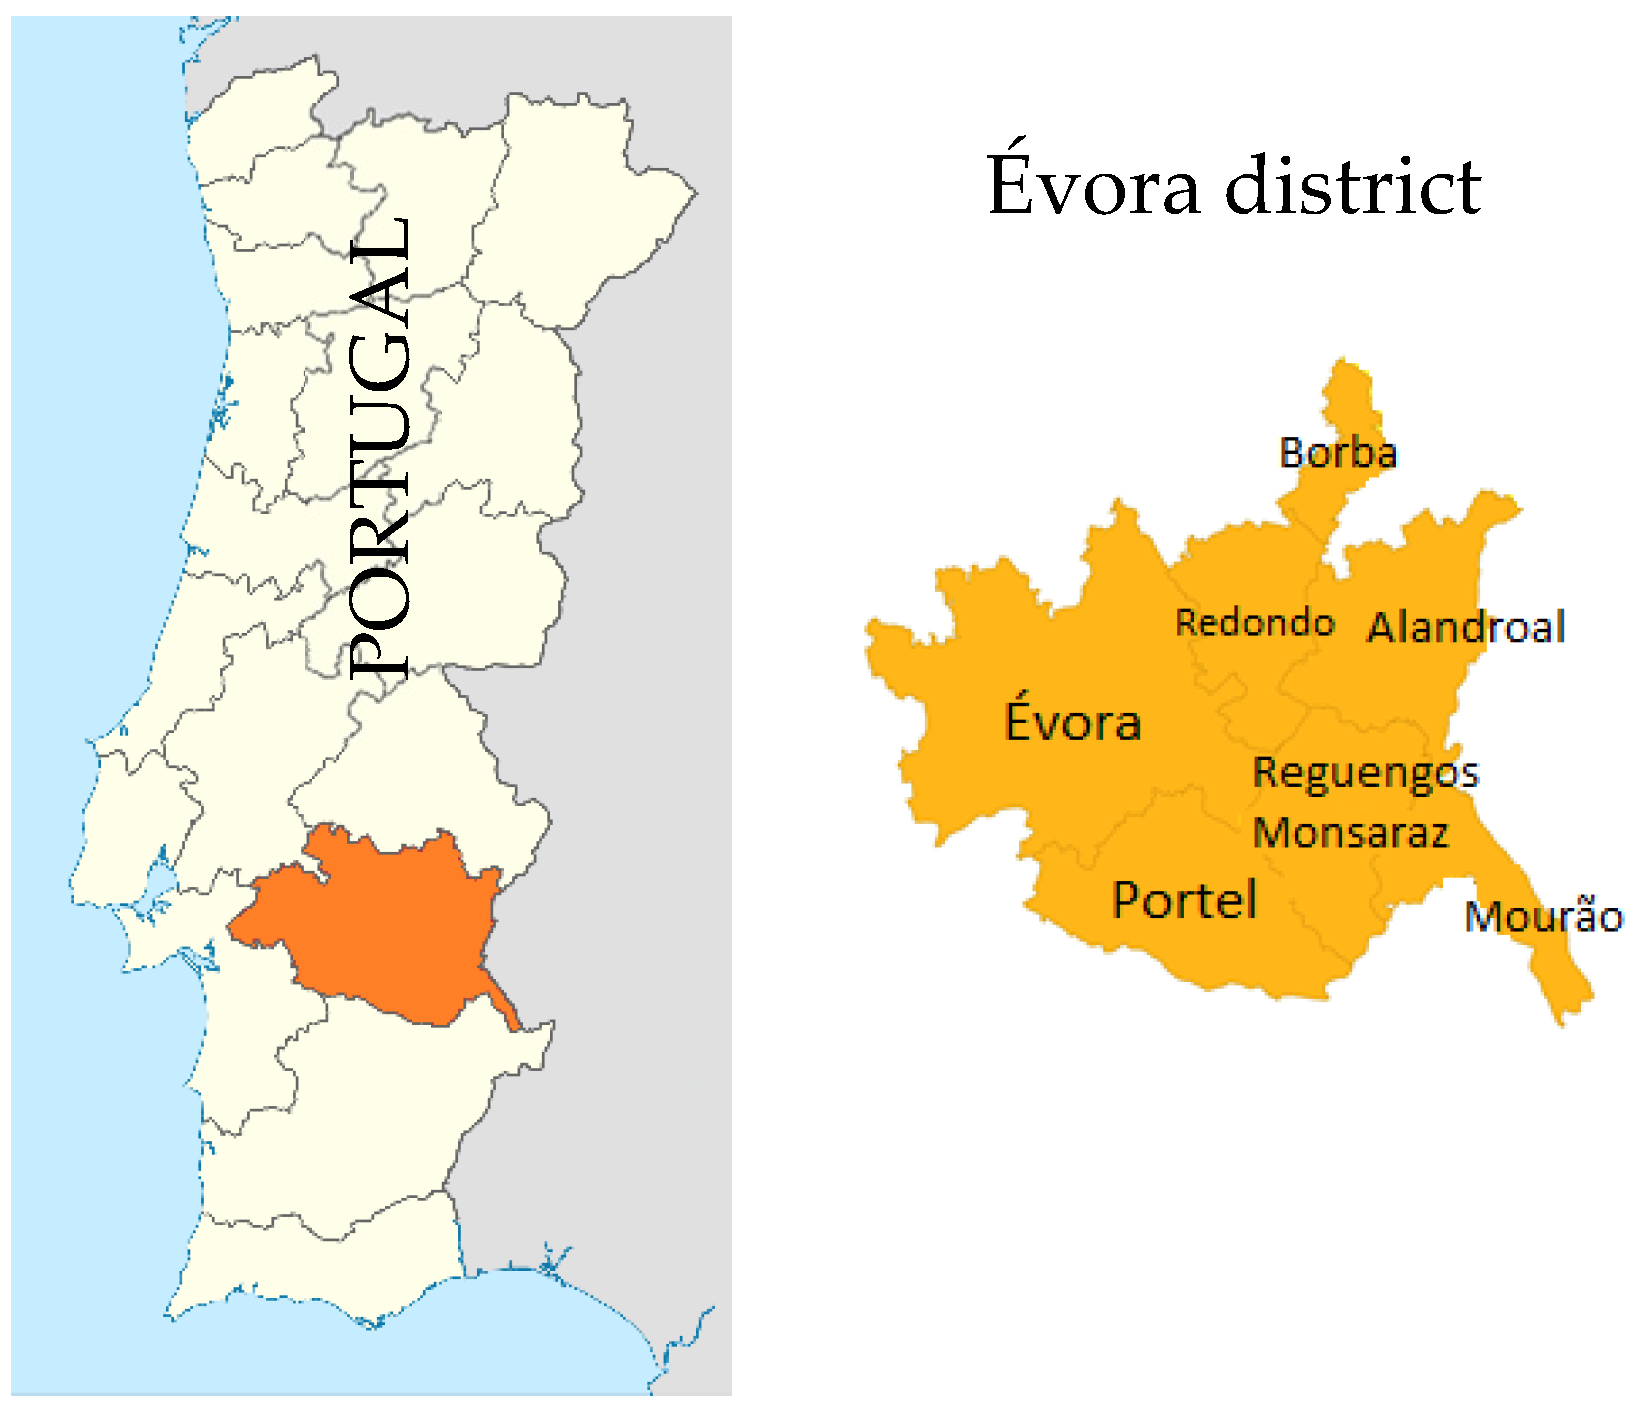
2.3. Wastewater Treatment Plant (WWTP) and Sampling Points

Five Portuguese WWTPs (Évora, Reguengos de Monsaraz (RM), Borba, Redondo, and Portel) were evaluated across at least four sampling campaigns conducted in 2020. The main sampling periods were conducted in January, June, September, and November.
The monitoring campaign included a total number of 77 samples and 2002 measurements. The samples included influents and effluents of each WWTP and surface waters upstream and downstream of the WWTPs.
The selected WWTPs were in the Évora district, whose capital is Évora city. It is the second biggest Portuguese district, with an area of 7393 km2 and 170,000 inhabitants, which is integrated into the Alentejo region of Portugal and corresponds entirely to the Central Alentejo subregion (Figure 1). This region is frequently affected by severe drought and high temperatures in the summer season. Table 1 summarizes the information on the five WWTPs of the Évora district.
The Évora WWTP is the biggest of these target facilities. Only Évora WWTP receives hospital effluents. The remaining facilities receive mainly domestic sewage.
It was impossible to collect upstream samples in Redondo WWTP because this sampling point is on private property.
All five WWTPs processes started with some form of pretreatment with the objective of removing grease and large solids from the wastewater that could damage the unit operations downstream.
The activated sludge conventional process (ASCP) is by far the most widely used for sewage biological secondary treatment.
In the bioreactor, which operates in continuous mode, the suspended microorganisms consume the colloidal and dissolved organic matter by aerobic biodegradation. Therefore, the reactor is aerated to provide dissolved oxygen. Évora WWTP uses two reactors in series, the first for nutrient removal and the second for digestion of organic matter. In the settling tank or clarifier, the activated sludge (flocculated biomass) is gravitationally separated from the treated wastewater and the effluent overflows into the receiving waterbody, after a filtration step and before being discharged.
The long-term activated sludge process (LT-ASP) was adopted for activating sludge in order to obtain the highest efficiency in the biological treatment, wherein the aeration periods were higher than in the conventional process. The three WWTPs that use this treatment process (Reguengos de Monsaraz, Borba and Redondo) all have a similar operation, with the use of oxidation ditches, followed by settlers.
Waste stabilization ponds (WSPs) consist of open basins that use natural processes to treat domestic wastewater. The most common types of WSPs are anaerobic ponds, facultative ponds, maturation or polishing ponds, aerated ponds, and high-rate algal ponds (HRAPs). WSP systems require large areas of open land, making them ideal in smaller towns and rural settings; however, they are used successfully in many urban environments as well, often in combination with other sanitation technologies. One of the biggest advantages of WSPs is that they are easy and inexpensive to operate and maintain, and generally do not rely on mechanized equipment or expensive material or energy inputs. The Portel WWTP is equipped with an anaerobic waste stabilization pond followed by two facultative stabilization ponds.
Figures S1–S4 of Supplementary Material show diagrams for each type of treatment performed in the studied facilities.

2.4. Wastewater Samples Analysis by SPE-LC-MS/MS

Of the collected sample volume, 500 mL was filtered using quantitative filter paper, 1.0 µm glass microfiber, and 0.45 µm nylon membrane. This volume was selected to ensure a representative water sample, but only 50 mL of the filtered sample was used. Therefore, only the concentrations of PhACs in the dissolved fraction of the sample are considered.
For extraction, the SPE method was implemented based on previous work conducted in wastewater samples [23]. Briefly, cartridges were activated with 4 + 4 mL of methanol followed by 4 + 4 mL of reagent water. Wastewater and surface water samples were passed through cartridges at a flow rate of 5 mL/min. Afterward, the cartridges were rinsed with 4 mL of reagent water and dried under a nitrogen stream for 20 min. Cartridges were eluted with 4 + 4 mL of methanol at a flow rate of 2 mL/min. The organic extract was evaporated to dryness in a TurboVap system with a nitrogen stream (5 psi/35 °C). Samples were reconstituted with 1 mL of reagent water and filtered through a 0.45 μm polytetrafluoroethylene (PTFE) syringe filter.
For quantification, standard addition calibration curves of PhACs were prepared by adding 100 µL of sample and 100 µL of standard solution with a minimum of six points. For the non-spiked calibration point, 100 µL of reagent water was used instead of standard solution.
For analysis, the LC-MS/MS method that was used had already been validated for PhACs determination in wastewaters, clams, and sludge samples [23,24,25]. To ensure maximum sensitivity, two chromatographic methods were used. One was an acidic method that uses two solvents, A (water + 0.01 mM ammonium acetate + 0.5% formic acid (v/v)) and B (methanol) for the quantification of 14 PhACs. The other was a basic method that uses a solvent C (water + 0.05% ammonia (v/v) at 25%) and B (methanol), for the quantification of the remaining 12 PhACs. For both methods, the injection volume used in the chromatographic separation was 20 µL. Regarding mass spectrometer conditions, two transitions (product ion) were determined for each compound, one for quantification (MRM1), and another for confirmation (MRM2), except for ibuprofen (IBUP), which only has one identifiable transition. Further details of the optimized chromatographic conditions and on the optimized mass spectrometer conditions are described in [24,26].

2.5. Working Range, Method Detection (MDL) and Quantification Limits (MQL), and Expanded Uncertainty

Standard addition calibration curves at six concentration levels ranging from 0.75 µg/L to 94 µg/L were used to determine the working range of the method. The working range was evaluated using the coefficient of determination (R2), the coefficient of variation of the method (CVm, %), and Mandel’s test for nonlinearity [27]. The acceptance criteria of these statistical tests were R2 ≥ 0.995, CVm ≤ 5.0%, and PG ≤ F(0.05; N-1; N-3), respectively.
The instrumental limit of quantification was determined based on the standard deviation of the method (Sm), namely, LOQ = 10 × Sm. Sm is the ratio between the relative standard deviation of the standard addition calibration curves (Sy/x) and its slope (b).
The method detection limit (MDL) and method quantification limit (MQL) of the SPE-LC-MS/MS method were based on the limit of quantification (LOQ) of LC-MS/MS (first calibration point of calibration curve) using the following equations:
  M Q L   ( μ g / L ) = L O Q C F × 100 R e c  
M D L   ( μ g / L ) = M Q L 3.3
where, LOQ = concentration equivalent to the first calibration point, expressed in µg/L; C F = concentration factor from the SPE; R e c = recovery of PhAC, expressed in %.
The recovery assays were performed daily with a spike concentration equivalent to the second concentration level of the standard addiction calibration curve.
The expanded uncertainty of the method was evaluated using “top-bottom” methodology. Using this approach, we combined the components of uncertainty related with the precision and trueness studies [28]. Therefore, this estimation of uncertainty was based on the quality control of results obtained during all assays.

2.6. Removal Efficiency and Environmental Risk Assessment

Average removal efficiency (RE) of PhACs in WWTPs was calculated using the concentrations in the influent and effluent samples using the following equation:
R E   ( % ) = C i n f C e f f   C i n f   × 100
where C i n f = concentration in the influent samples, µg/L; C e f f = concentration in the effluent samples, µg/L.
The potential risks of residual PhACs in the effluent to aquatic organisms were assessed using risk quotient (RQ), which is calculated as the ratio of the measured environmental concentration (MEC) to the predicted no effect concentration (PNEC) of a target compound [29]. In this study, the strictest standard, that is, the lowest PNEC value of a specific compound ever reported in water was adopted for calculation. The weighted measured environmental concentration (WMEC) of a PhAC in the final effluent and the downstream environment of the five WWTPs was calculated as follows:
W M E C = C a v e   × R t o t   +   C m a x   ×   R 90 % m a x
where C a v e   and C m a x   represent the average and maximum concentrations, respectively; R t o t   represents the detection frequency (%); and R 90 % m a x represents the ratio of the number of samples with concentrations higher than 90% maximum concentration to the total number of samples.
Hence, the RQ was calculated by Equation (5):
R Q = W M E C P N E C
The specific values of PNEC used for RQ calculations are detailed in Table S1 [3,30,31,32,33]. Common ranking criteria for evaluation of environmental risks were adopted in this work: RQ < 0.1, low risk; 0.1 ≤ RQ < 1, medium risk; and RQ ≥ 1, high risk [30].

2.7. Water Analysis

PhACs in wastewater and surface water samples were quantified by standard addition method and they were expressed as µg/L. Samples with a PhAC concentration higher than the MQL were considered positive, whereas samples with concentrations lower than LOQ were considered negative. Mean and median concentrations of PhACs in water samples were calculated using the concentrations of positive samples.

3. Results and Discussion

All figures and tables show the PhACs grouped by acid and basic chromatographic runs, and in each method, they are grouped by their retention time.

3.1. Method Performance

The method for determining 26 PhACs using SPE cartridges and LC-MS/MS technique was validated. Table 2 gives an overview of the validation parameters. The initial linear range for each PhAC was narrowed until all data accomplished the specified criteria of the statistical tests. The method showed good working range, precision, and accuracy as well as low method detection and method quantification limits (MDL, MQL). The calibration curves of all the compounds were linear over a concentration range from 0.76 to 87 μg/L (depending on the analyte) with a determination coefficient (R2) between 0.9983 (E2) and 0.9999 (IBUP), coefficient of variation between 1.55% (SMX) and 6.66% (GTD), and all the PG values were lower than the F tabulated values for the corresponding degrees of freedom (F (0.05; 4;3) = 9.11). The MQLs ranged from 6.81 ng/L (DCF) to 223 ng/L (E1).
The obtained recovery values were between 43.9% (GTD) and 160% (FLX). Despite the lower and higher recoveries of certain PhACs, the variability of the data was satisfactory with an RSD ≤ 24%. (Table 2). Considering the complexity of matrices and the concentration ranges, the obtained recoveries were considered acceptable.
The expanded uncertainty (U) of the analytical method was lower than 41%, with a confidence level of 95%.

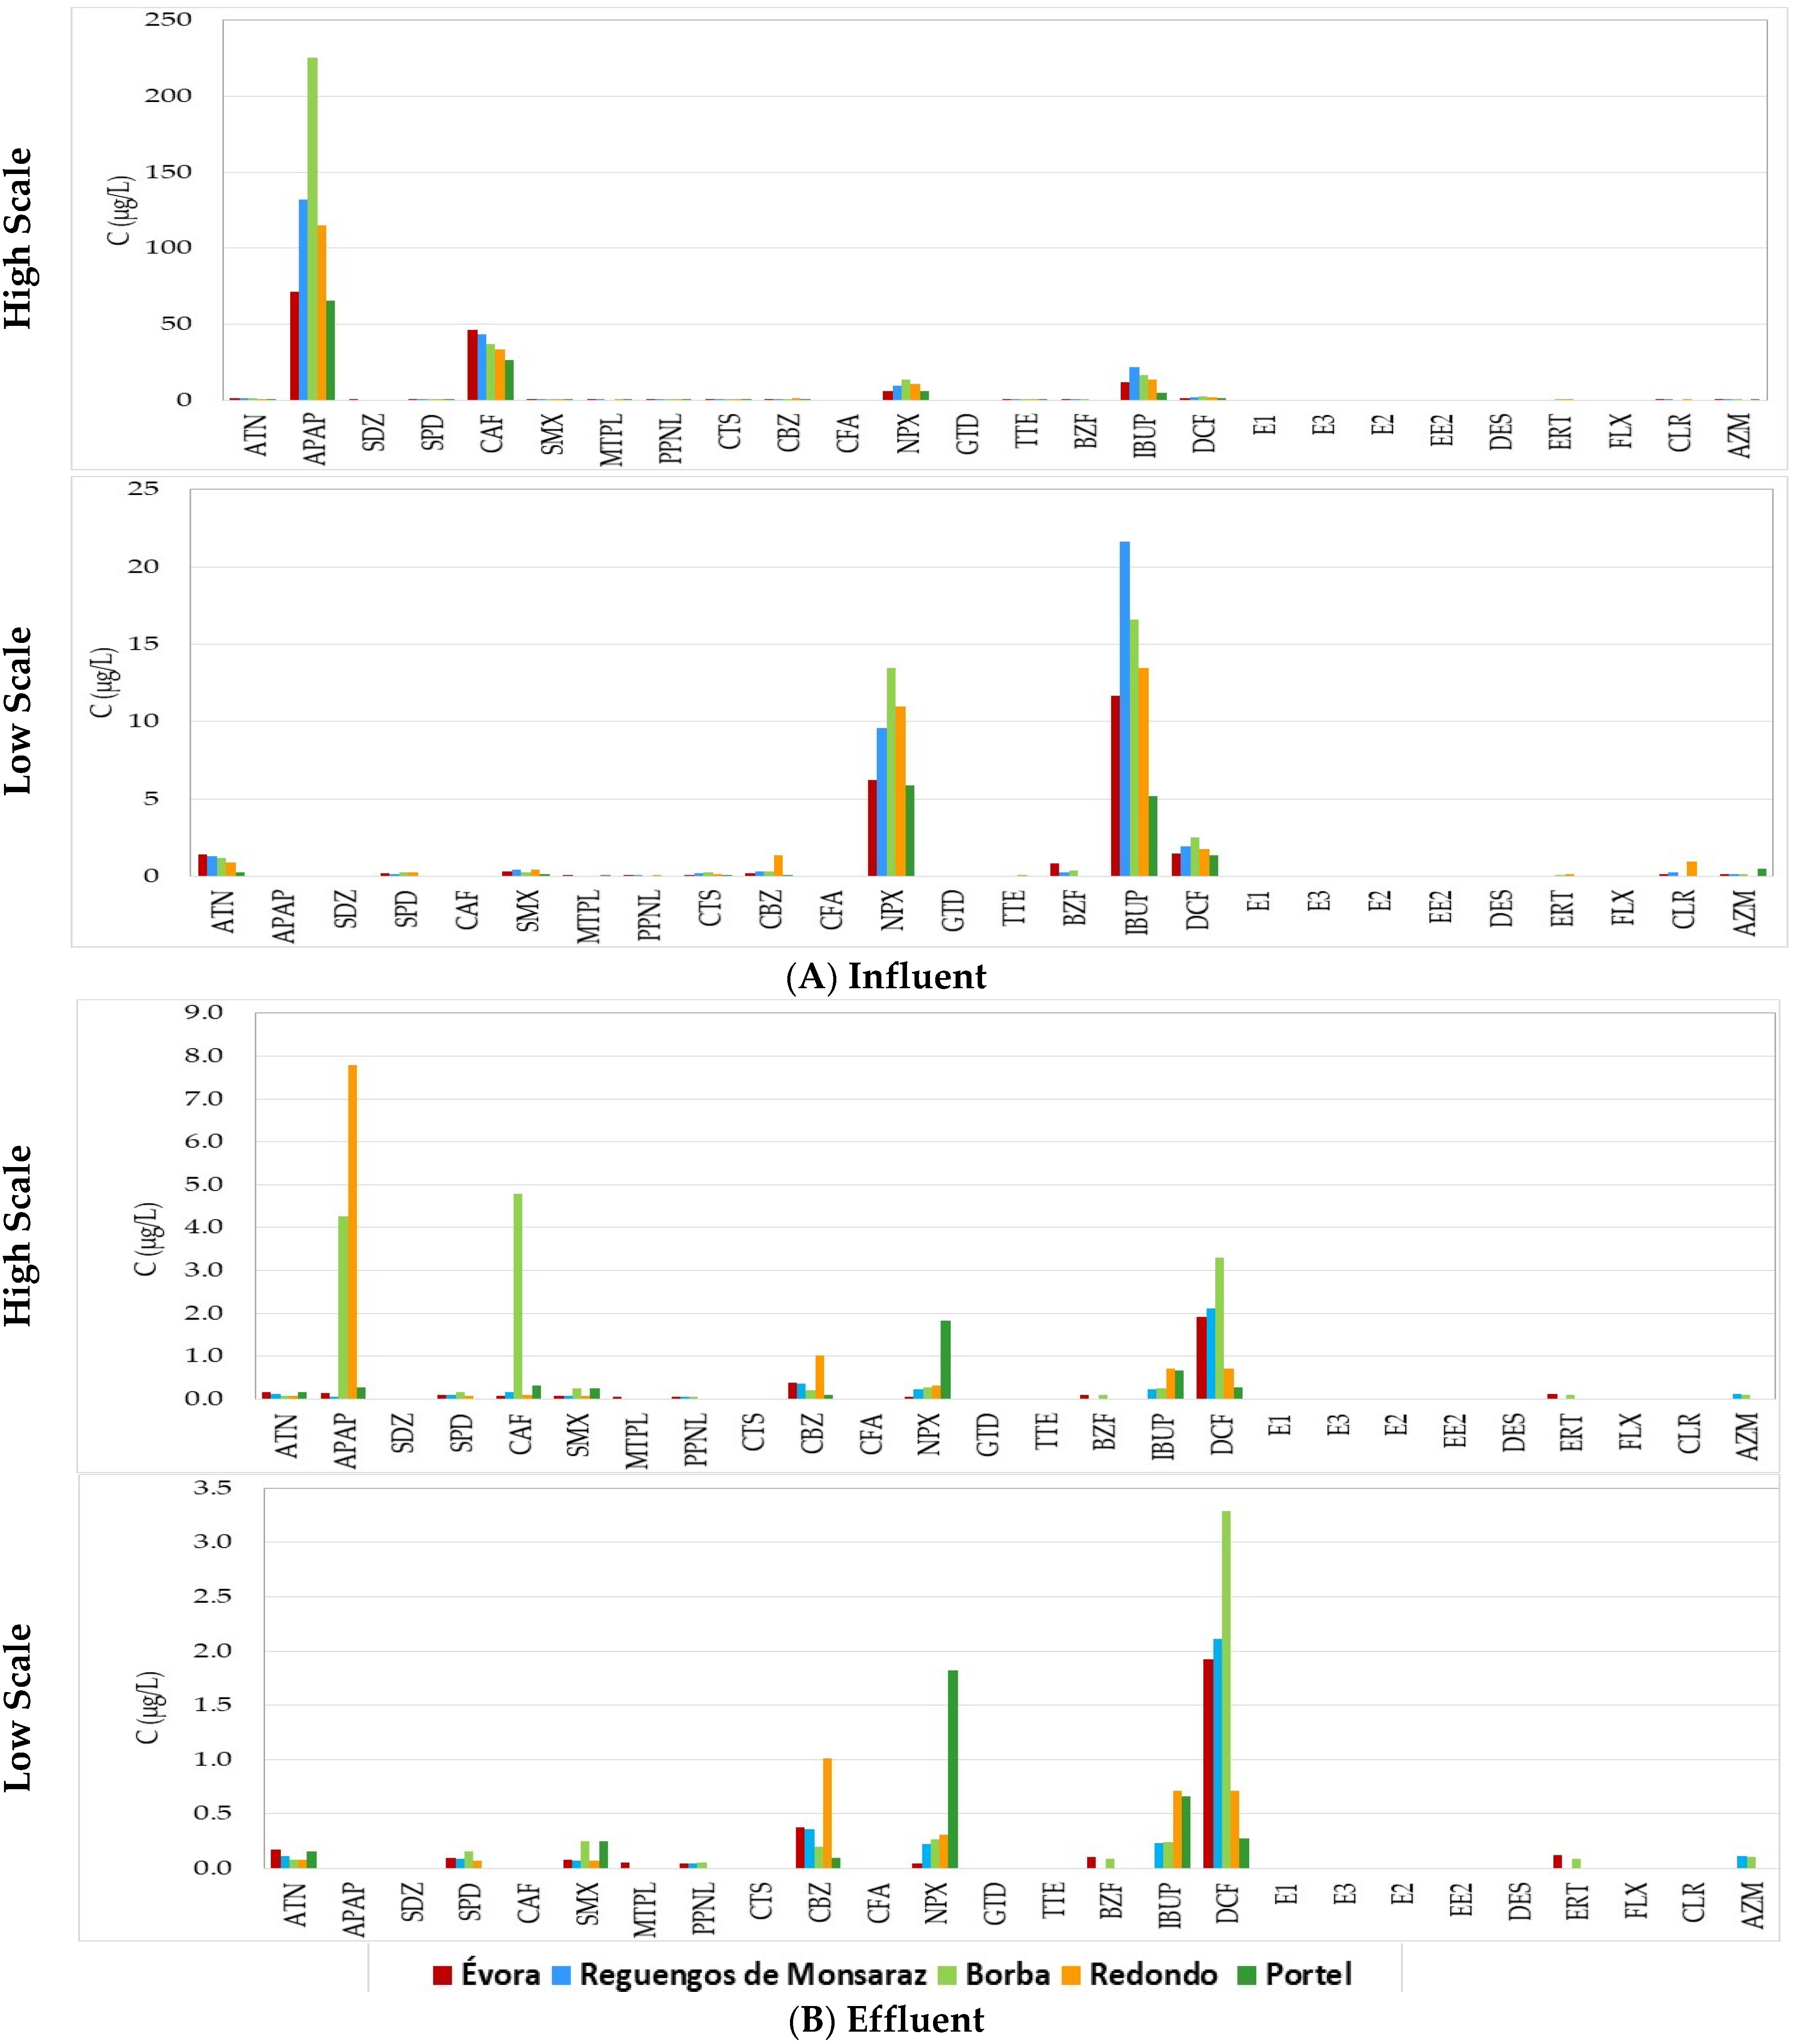
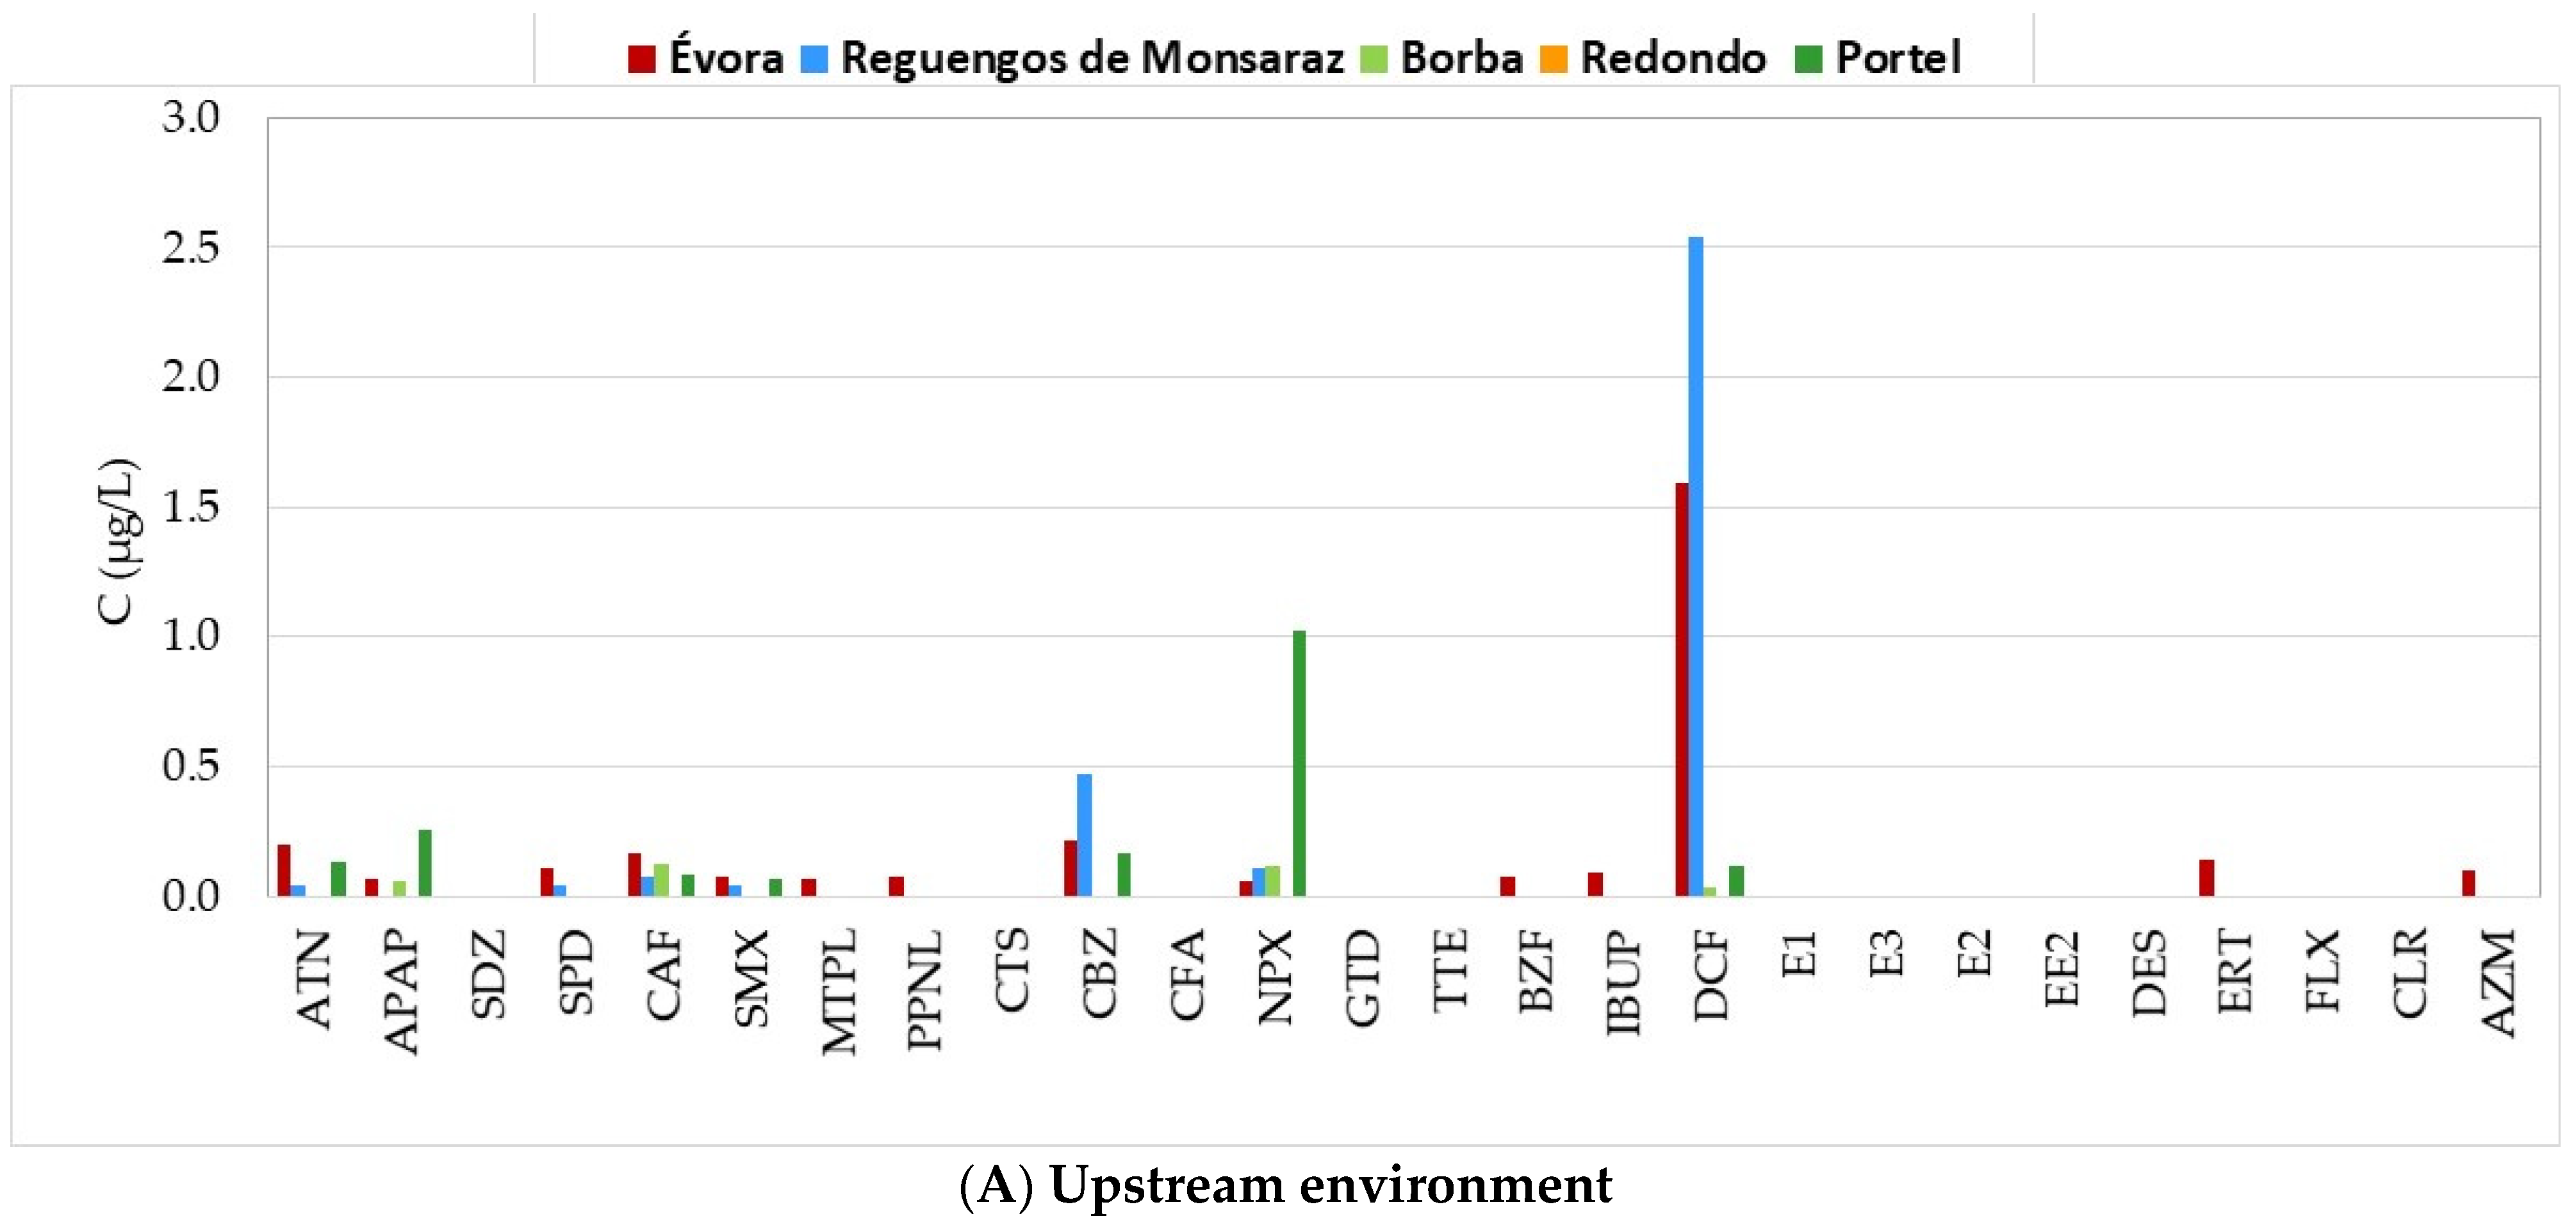
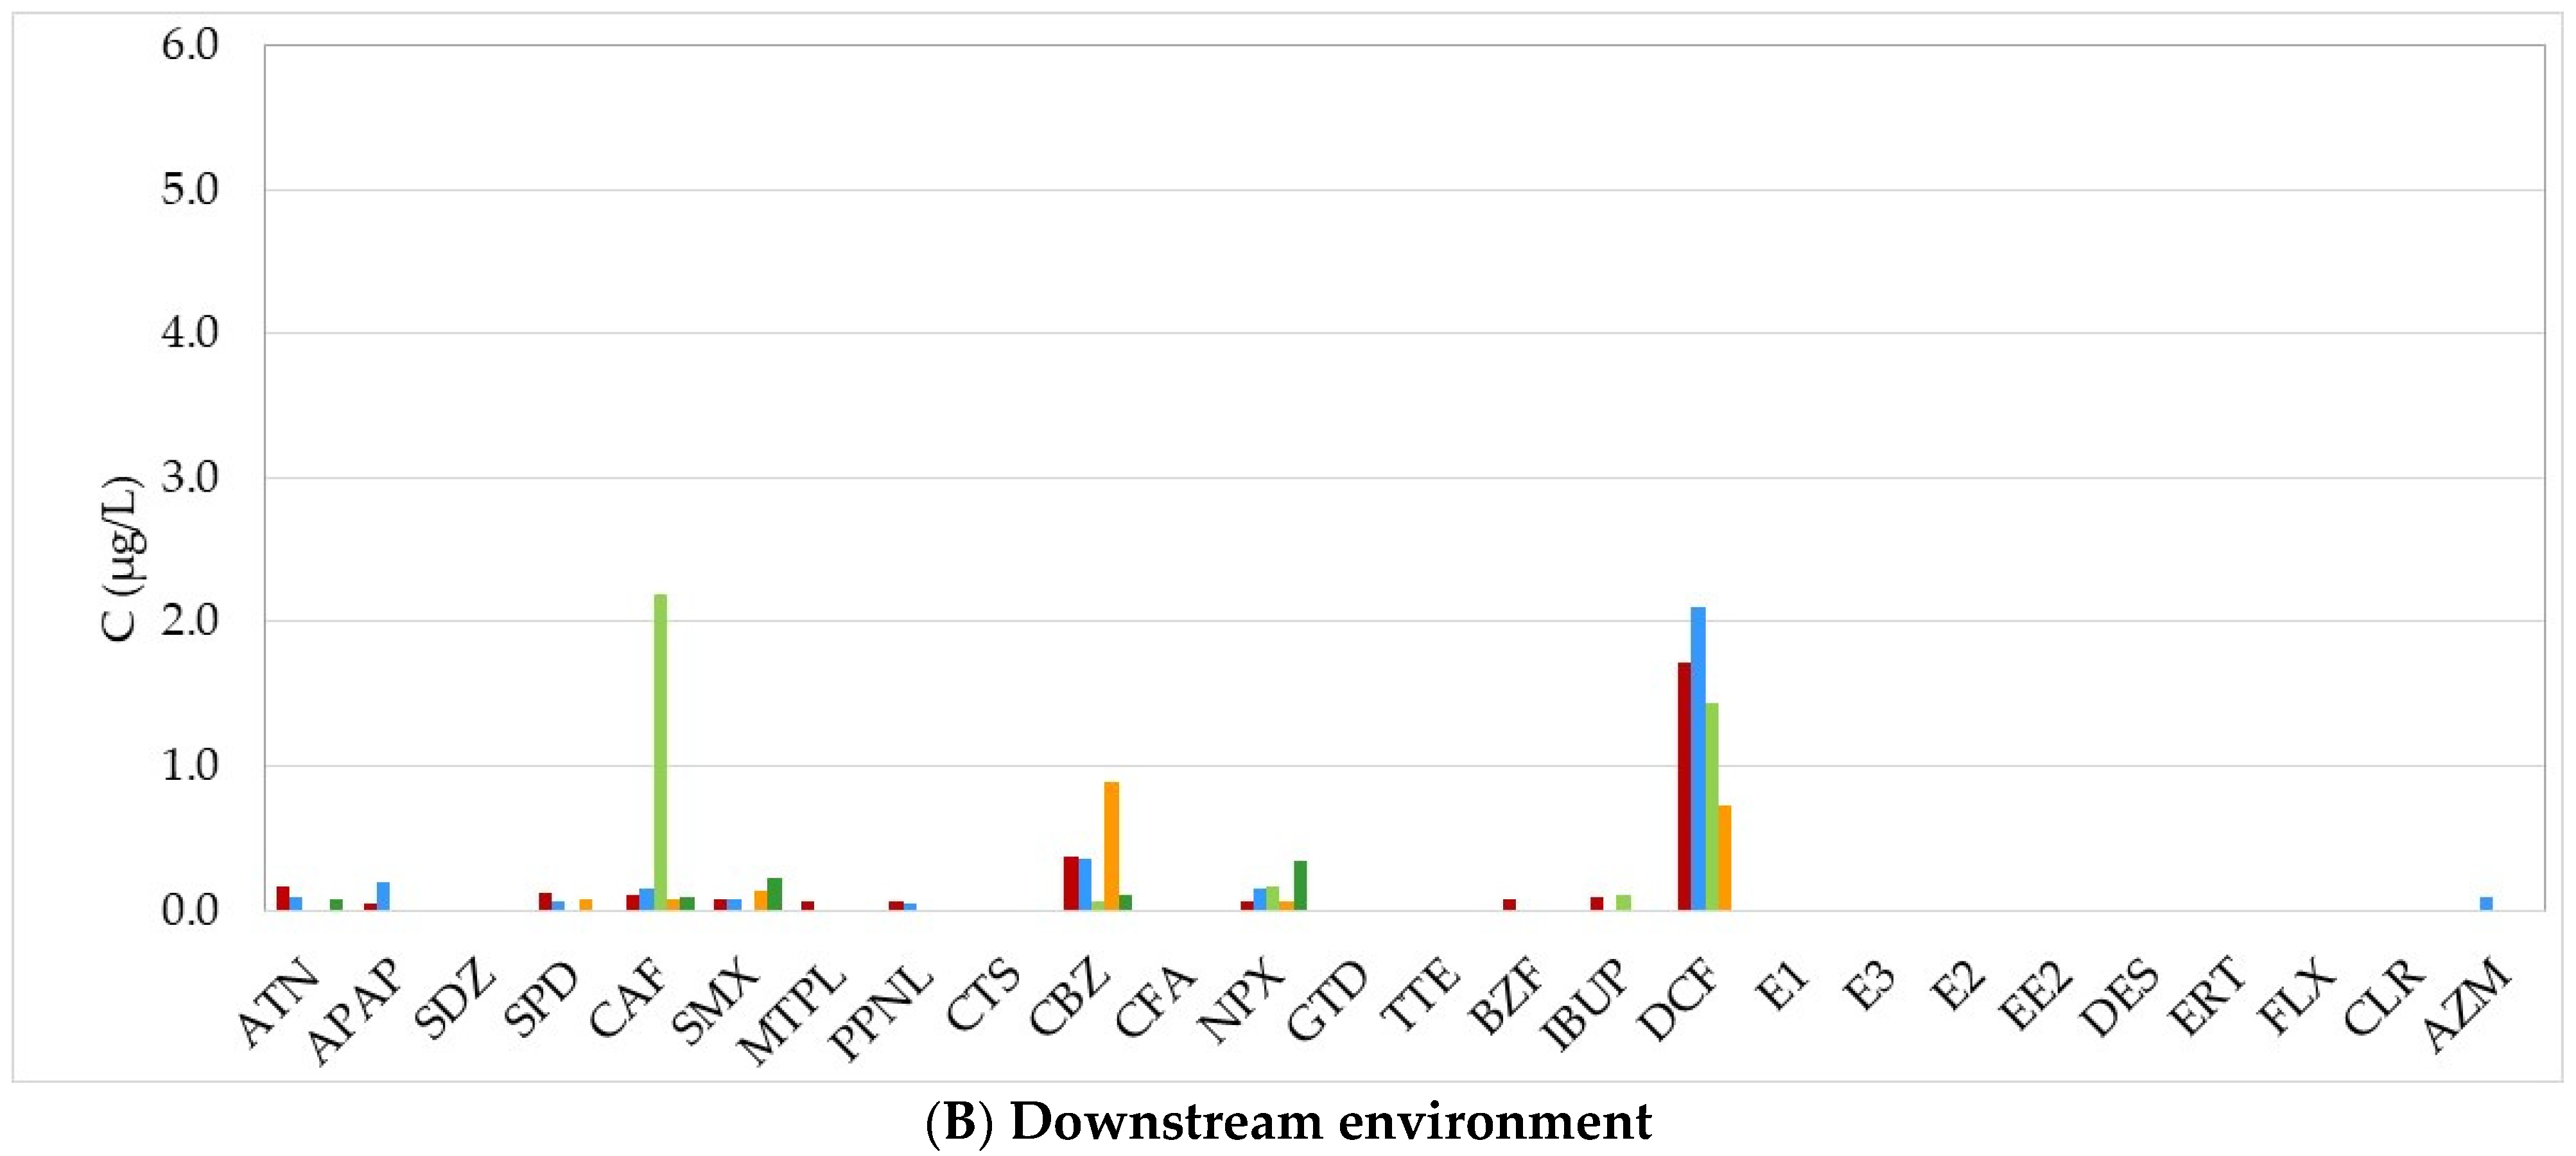
3.2. Occurrence of PhACs in the Five WWTPs and Surface Waters

The discussion is focused on concentrations and detection frequencies of PhACs in the influent and effluent of target WWTPs (Table 3), and the values obtained upstream and downstream of the target WWTPs (Table 4). Both tables show the obtained results organized by minimum concentration (Min), maximum concentration (Max), median concentration (Med), percentage of positive samples (% Pos), and detection frequency (Freq) in influents (or upstream) and effluents (or downstream) of the five WWTPs of the Évora district. The Freq is equal to the number of positive samples divided by the number of studied WWTPs. All PhACs not detected in the water samples (<MQL) were excluded from the statistical analysis.
Regarding PhACs occurrence in target WWTPs, 18 and 14 out of the 26 PhACs analyzed were quantified in influents and effluents, respectively (Table 3). Eight PhACs (CFA, GTD, E1, E2, E3, EE2, DES, and FLX) were not quantified in both wastewaters. Four PhACs were only quantified in influents, namely, sulfadiazine, cortisone, testosterone, and clarithromycin.
The most representative PhACs were the analgesic drug acetaminophen (APAP), the psychostimulant caffeine and three NSAIDs, ibuprofen, naproxen, and diclofenac, with median concentration values of 115.4 µg/L, 40.9 µg/L, 12.1 µg/L, 8.0 µg/L, and 1.7 µg/L, respectively (Table 3). The concentration of the two most representative NSAIDs, IBUP and NPX, was about one-tenth and one-fifth of the median concentration of acetaminophen and caffeine concentrations. Except for acetaminophen, the obtained concentrations of these five PhACs were similar to those found in recent studies in other two Portuguese WWTP, Beirolas WWTP and Faro WWTP [25]. The median concentrations of acetaminophen were much higher than those found in other WWTP influents in Portugal [23,34,35,36] and in Europe [8]. The obtained values for this PhAC were double than the median concentration in influents of the two biggest WWTPs in Portugal, Beirolas WWTP and Faro WWTP [26]. In these reported studies, caffeine, acetaminophen, ibuprofen, naproxen, and diclofenac were consistently identified as the PhACs found in the highest concentrations in wastewater influents.
For the remaining PhACs, the median concentration values ranged between 0.044 (sulfadiazine) and 0.92 µg/L (atenolol). Except for sulfadiazine, the antibiotics’ median concentration was higher than 0.1 µg/L, with values between 0.12 (erythromycin) and 0.31 µg/L (sulfamethoxazole).
Eight of 18 PhACs found in WWTP influents showed a high frequency of detection with several positive samples higher than 95% (CAF, NPX, IBUP, DCF, ATN, CBZ, APAP, and SMX). For five of 18 PhACs, the frequency of detection ranged between 50% and 88% (SPD, PPNL, CTS, BZF, and TTE).
The frequency of these PhACs was higher for ten compounds (ATN, CAF, CBZ, NPX, DCF, APAP, SMX, SPD, PPNL, and CTS) with frequency values higher than 2.5 (50% of target WWTP).
The occurrence profile of PhACs in effluents was different from those obtained in the WWTP influents. The most representative PhACs in effluents were diclofenac, carbamazepine, and caffeine, with 100% of positive samples, a frequency of 4.8, and a median concentration of 1.6, 0.35, and 0.16 µg/L, respectively.
The second group of target PhACs in effluents included naproxen, atenolol, and sulfamethoxazole, with median concentration values of 0.25, 0.15, and 0.095 µg/L, respectively. The frequency in target WWTPs varied between 4.2 and 4.4, and the positive samples between 88% and 92%. IBUP and APAP showed a significant decrease in median concentrations compared to influents, 0.32 and 0.18 µg/L, respectively. However, the positive samples were equal to or lower than 50%, with a frequency of 2.4 and 2, respectively. The remaining positive samples showed median concentrations lower than 0.10 µg/L or a frequency lower than 2.
Regarding the overall upstream and downstream results obtained for all the surface waters surrounding the WWTPs of interest (Table 4), 14 out of 26 monitored PhACs were detected with a wide range of median concentrations.
DCF can be considered the most prevalent PhAC, due to having the highest median concentrations for the upstream and downstream samples, 0.85 and 1.6 µg/L, respectively.
CAF behavior was similar for both types of samples, with an occurrence percentage of 100%. Frequencies ranged from 2.74 to 3.4 and median concentrations fluctuated from 0.15 µg/L in upstream samples and 0.10 µg/L for downstream samples.
NPX showed occurrence percentages of around 70%, with median concentrations ranging from 0.07 to 0.11 µg/L for upstream and downstream samples, respectively.
CBZ was only detected in 45% of upstream samples; however, it had a median concentration of 0.22 µg/L. Conversely, in downstream samples, the median concentration was similar, 0.29 µg/L; however, this corresponds to a 94% detection rate and a frequency of 3.2.
The remaining detected PhACs had occurrence percentages varying between 9% and 36% and median concentration in upstream samples ranging from 0.07 to 0.15 µg/L (SMX and ATN, respectively). While in downstream samples, the detection percentage ranged from 6% to 71%, with median concentrations ranging from 0.054 to 0.13 µg/L (PPNL and ATN, respectively).
As expected, the PhACs that were never detected in wastewater samples, namely CFA, GTD, E1, E3, E2, EE2, and DES were also not detected in any surface water samples. Furthermore, PhACs that are completely removed during the treatment stages, such as CTS and TTE, were also not detected. Moreover, most PhACs mean concentrations increased in the samples collected downstream from the WWTP as opposed to the upstream samples that were collected.
Not many studies regarding the quantification of PhACs in surface waters that have direct influence from WWTPs were found in the Évora region. Only one study was found that included the Xarrama River as one of the sampling points, with samplings in 2014 and 2015 [37]. However, no similarities were found between our two studies, considering that most of the PhACs that were monitored were either not detected or only detected in considerably lower concentrations compared to the current study.
The occurrence profile of influent and effluent of each WWTP is represented in Figure 2 and detailed in Tables S2–S6 of Supplementary Material. The individual influent profile was similar in all target WWTPs. However, for the most representative compounds, acetaminophen and caffeine, the median concentrations were different.
The median concentration of CAF ranged between 26.3 (Portel WWTP) and 46.3 µg/L (Évora WWTP).
The median concentration of APAP can be grouped in three ranges: the lowest around 70 µg/L (Portel and Évora WWTPs), the median range around 100 µg/L (Reguengos de Monsaraz and Redondo WWTP), and the highest was Borba WWTP with 225 µg/L.
NSAIDs, IBUP, and NPX showed significant differences between influents of WWTPs, with median concentrations ranging between 5.2 (Portel WWTP) and 21.6 µg/L (Reguengos de Monsaraz WWTP), and between 6.2 (Évora WWTP) and 13.4 µg/L (Borba WWTP), respectively.
Apart from diclofenac, with a median concentration between 1.35 (Portel WWTP) and 2.52 µg/L (Borba WWTP), the remaining PhACs (>MQL) showed concentrations lower than 1.5 µg/L in all WWTPs.
Portel WWTP presented the lowest values of PhACs in influents due to having the lowest population equivalent.
Regarding effluents, the difference between WWTPs was more significant, especially due to the values of certain target PhACs. Borba WWTP showed higher median concentrations of diclofenac (3.29 µg/L), acetaminophen (4.26 µg/L), and caffeine (4.78 µg/L). Redondo WWTP showed the highest concentration of acetaminophen (7.79 µg/L). Reguengos de Monsaraz WWTP showed the highest median concentration of atenolol (0.11 µg/L).
The occurrence profile of upstream and downstream samples of each WWTP is represented in Figure 3 and detailed in Tables S7–S11 of Supplementary Material. Unlike the influent results, upstream samples considerably presented different profiles. For instance, in the samples collected upstream from Évora WWTP, 14 out of 26 PhACs were detected, namely erythromycin (ERT) and azithromycin (AZM), bezafibrate (BZF) and IBUP, metoprolol (MTPL), propranolol (PPNL), and SPD, which were only detected in these samples. DCF in Évora presented the second-highest median concentration with 1.59 µg/L. Moreover, ATN (0.20 µg/L) and CAF (0.17 µg/L) showed the highest median concentrations of all samples. Upstream of the Reguengos de Monsaraz WWTP, DCF and CBZ had the highest median concentrations of all five locations, 2.54 and 0.47 µg/L, respectively. Despite serving the smallest population, the Portel WWTP upstream samples had the highest concentrations of APAP and NPX, 0.26 and 1.02 µg/L, respectively.

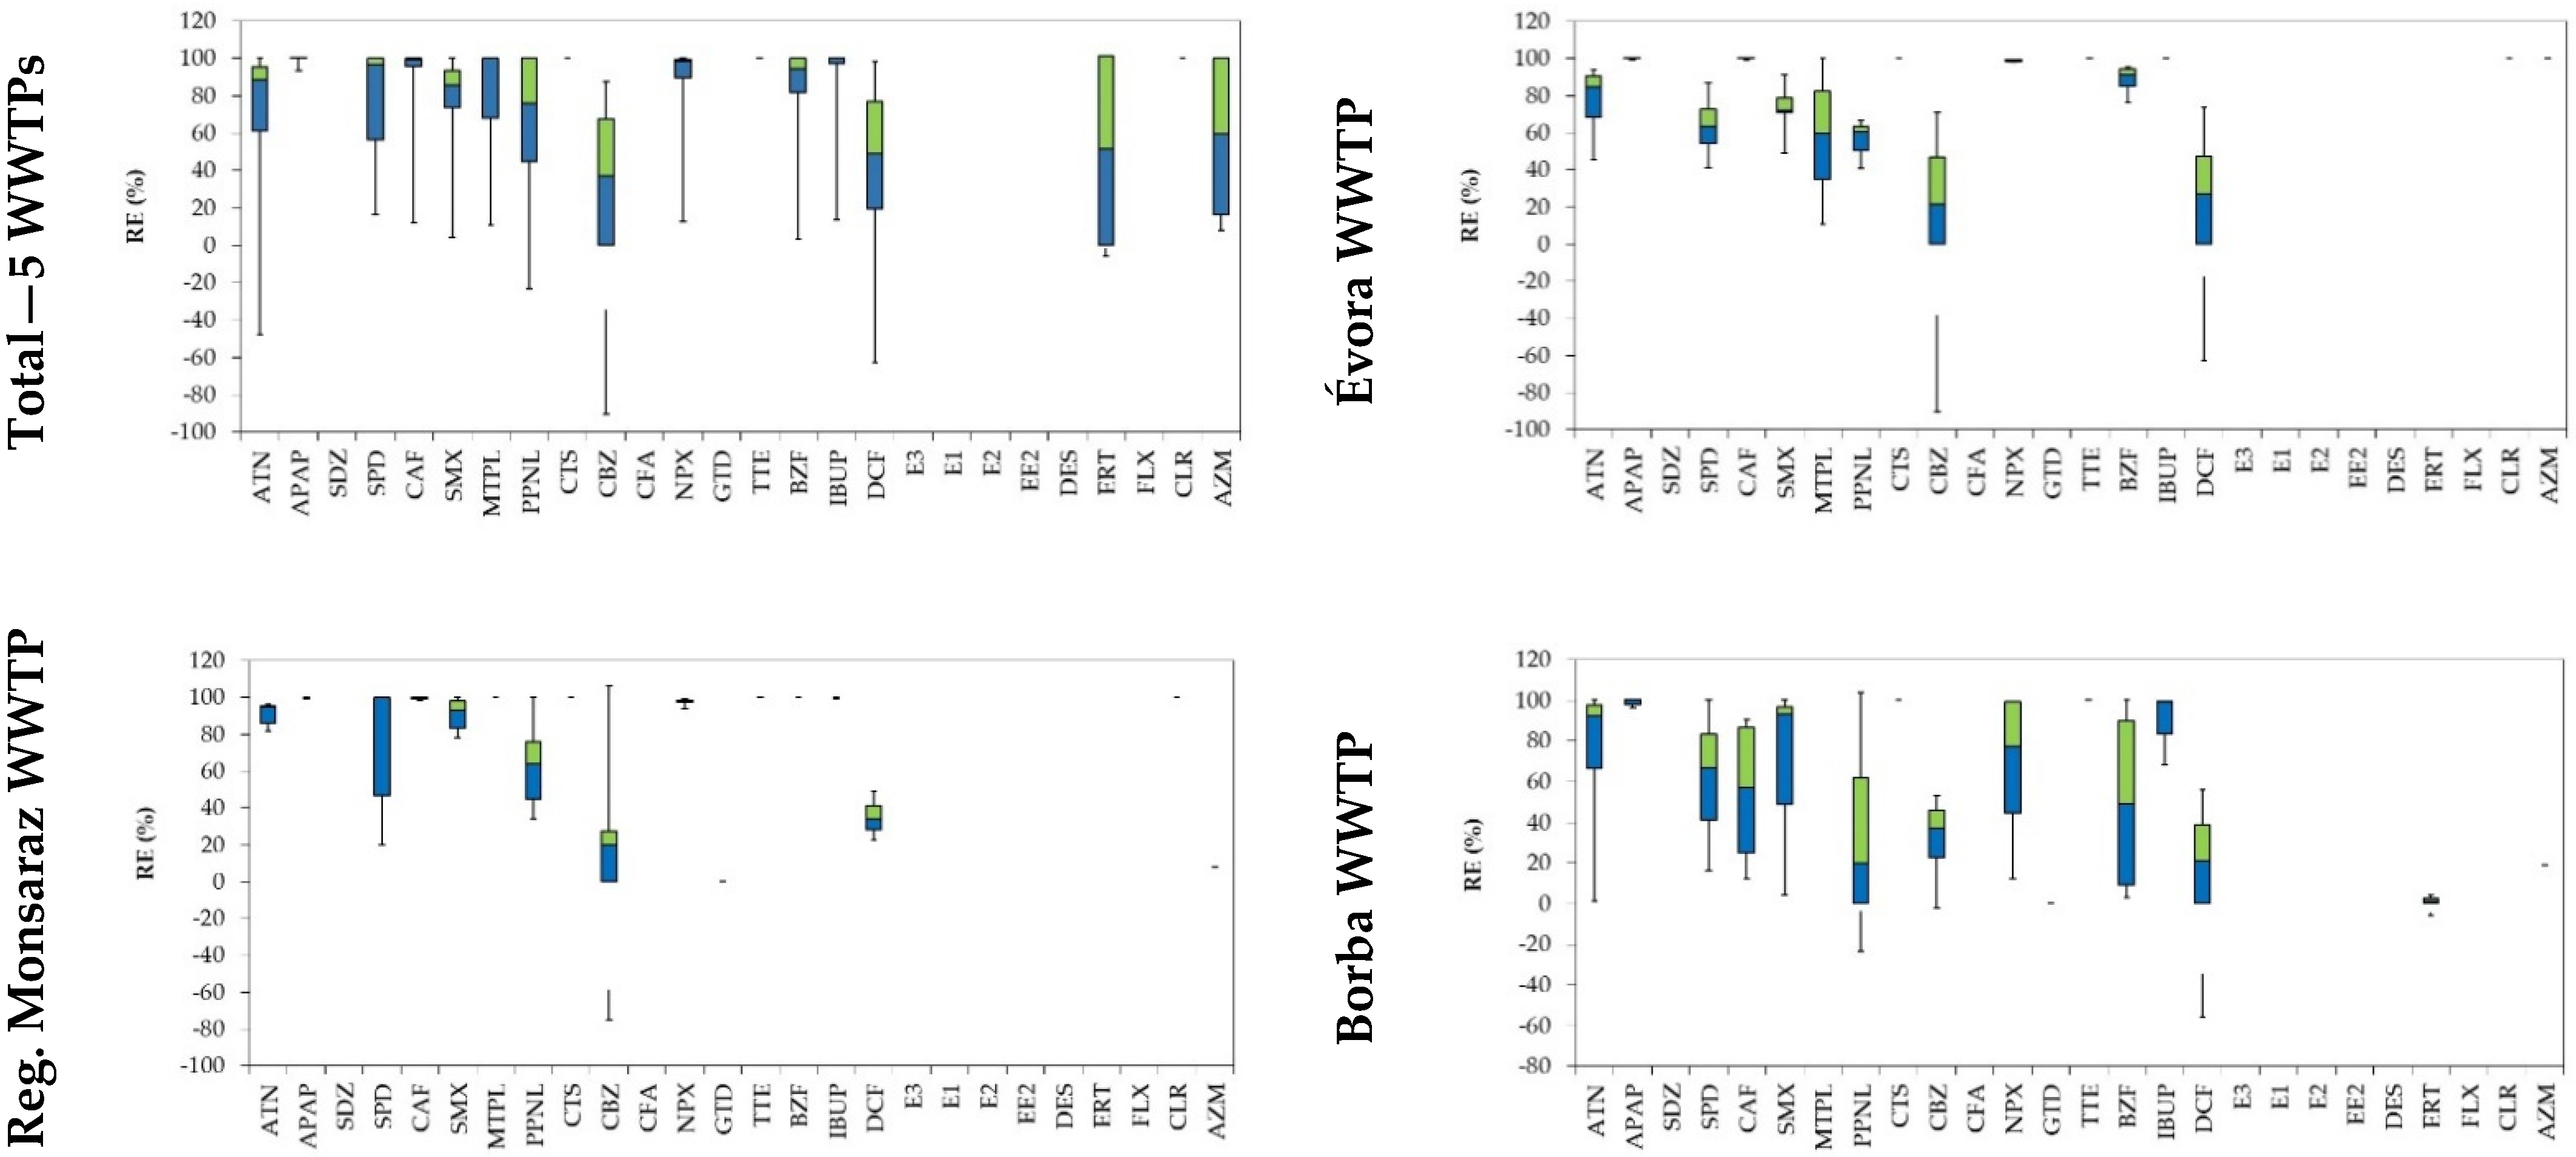
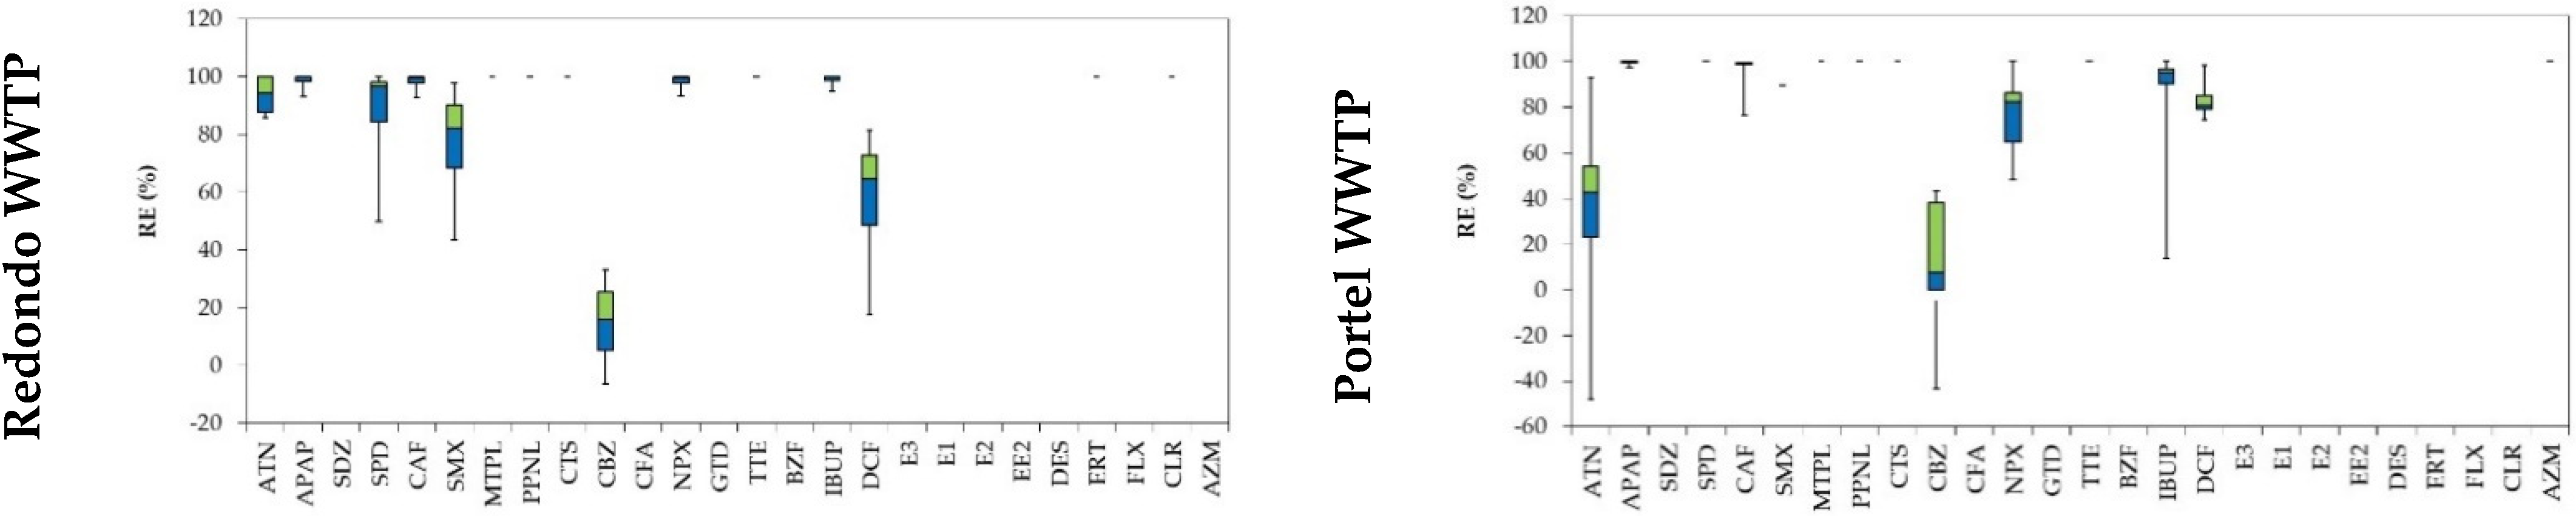
3.3. Removal Efficiencies of PhACs by WWTPs

The removal efficiencies of all five WWTPs combined as well as the individual removal efficiencies for each WWTP are presented in Figure 4.
The global removal efficiency ranged between −90% and 100% with a medium and an average of 98% and 74%, respectively. Two PhACs, DCF and CBZ, showed several negative values of removal efficiencies across all WWTPs. The compounds with the lowest removal efficiencies were CBZ, DCF, ERT, AZM, and PPNL with median removal efficiencies of 2.7%, 49.2%, 50%, 59.6%, and 2.7%, respectively. The remaining PhACs showed median removal efficiencies between 85.6% (SMX) and 100% (APAP, MTPL, CTS, TTE, IBUP, and CLR). The dispersal of obtained values was high for all compounds in all five WWTPs, except for APAP. This discrepancy is due to the differences in removal efficiencies of each WWTP.
Except for CBZ and DCF, Évora WWTP had consistently high removal efficiencies with the least dispersal, median values of 94%, and an average of 72%. This behavior was similar for Reguengos de Monsaraz WWTP, which showed median removal efficiencies of 99% and an average of 78%; however, the only exception in this case was CBZ. Borba WWTP had lower removal efficiencies than the first two WWTPs, with a median and an average of 67% and 55%, respectively. As for Redondo WWTP, CBZ was again the compound with the lowest removal efficiency. However, this plant registered a median and an average removal efficiency of 100% and 85%, respectively. Lastly, for Portel, despite being the smallest WWTP, this facility achieved median and mean removal efficiencies of 98% and 77%, respectively. Moreover, DCF had a median removal efficiency of 81%, which is the highest of all five WWTPs.
Globally, CBZ was the least removed compound with efficiencies ranging between −2.7% (Portel WWTP) and 37.2% (Borba WWTP). This tendency is also noted for DCF, which registered removal efficiencies between −13.2% (Borba WWTP) and 81.1% (Portel WWTP).
These negative removal efficiencies can be explained because for certain PhACs, parent compounds may be released during treatment, probably caused by the simultaneous presence of deconjugable substances, that is, human metabolites, of these compounds in the raw influent. Therefore, the negative removal efficiencies observed for certain PhACs, namely, carbamazepine and diclofenac, can be explained by deconjugation of glucuronidated or sulphated PhACs and desorption from particles or hydrolysis. These effects have been observed in several PhACs of different therapeutic classes, in particular diclofenac, ibuprofen, carbamazepine, estrone, and iopromide [3,23,38,39].
Due to the recalcitrant properties of organic compounds such as diclofenac, they are slowly biodegradable or non-biodegradable in UWWTP, remaining unaffected, and as such, persist in the effluent after treatment [40,41,42]. The occurrence of these organic contaminants in wastewater may be either in solution or adsorbed onto solids. The hydrophobic or lipophilic nature of many organic contaminants result into their adsorption on solid particles during wastewater treatment, eventually resulting in their accumulation in the sludge solids [43,44].
Diclofenac has a log Kow = 4.51 and it was expected to adsorb significantly to the organic matter of sludge solids. The Kow is also dependent on the pH of the aqueous system and therefore the pKa of the analyte [45]. An ionized PhAC is more hydrophilic (and therefore less lipophilic) than the neutral compound. This is reflected in a lower log Kow value at a pH where the compound is ionized. The pKa = 4.15 of DCF is also lower than the pH of wastewater (pH around 8); therefore, it is in ionized form, with more affinity to the aqueous phase. The slight increase of DCF in effluents can be explained probably due to the movement from the adsorbed to the dissolved phase during the treatment process and due to the degradation of organic matter, as reported by other authors [23,46].
Our findings are in agreement with previous studies found in the scientific literature, in which incomplete removal of a wide range of pharmaceuticals in conventional WWTPs has been described [3,5,23,35,36,38,40].

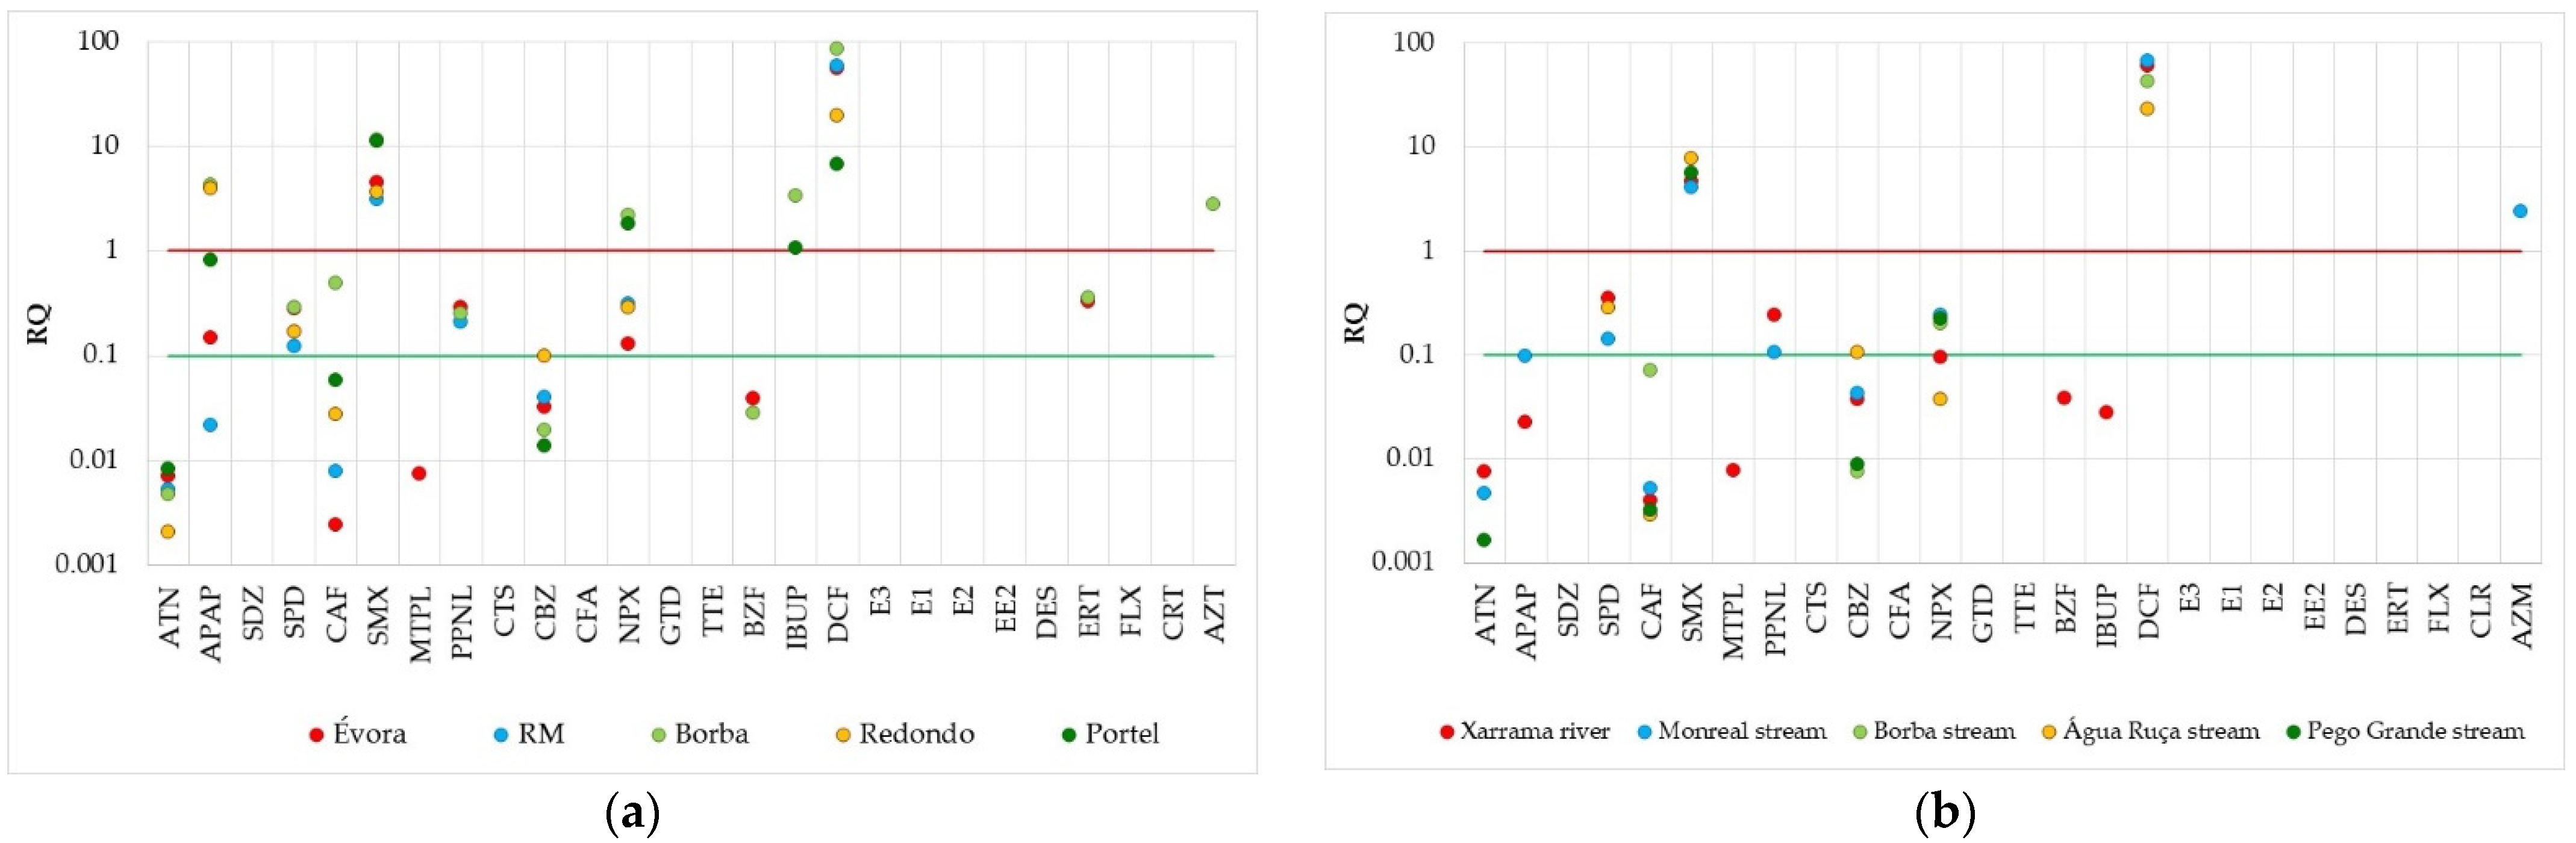
3.4. Environmental Risks of Target PhACs

As shown in Figure 5a and Table S1, in the effluents, the RQs for SMX and DCF were higher than 1.0 in all WWTPs, indicating they probably pose high risks to aquatic organisms. The RQs for SMX ranged between 3.12 (effluent of RM WWTP) and 11.4 (effluent of Borba WWTP). Due to the recalcitrant properties of DCF, it was present in effluents and the downstream environment in high concentrations. Thus, the RQs ranged between 6.76 (effluent of Portel WWTP) and 84.7 (effluent of Borba WWTP). The obtained values for these two PhACs were higher than those reported by other authors [30,37], but the concentrations and frequency of detection of both compounds in effluents and the downstream environment were higher too.
Other WWTP’s effluents showed RQ values higher than 1.0 for certain PhACs: namely, APAP and NPX in Borba WWTP; NPX, IBUP, and AZM in Portel WWTP; and APAP in Redondo WWTP.
All WWTPs showed RQs between 1.0 and 0.1 for SPD, PPNL, and ERT, indicating medium risks. These values of RQs were also observed for APAP (Borba and Portel WWSTPs), CAF (Borba WWTP), and NPX (Évora, RM, and Redondo WWTPs).
Only ATN showed RQs lower than 0.1 in target WWTPs. CAF and CBZ also showed RQs lower than 0.1 for most WWTPs, indicating they may pose low risks to aquatic organisms.
It is difficult to compare the obtained results because the number of studies is scarce and the target PhACs are different. Ben et al. [30] reported RQs higher than 1 for certain PhACs, namely, sulfamethoxazole, sulfadiazine, erythromycin, carbamazepine, and ofloxacin in the WWTP effluents in China. Although the dilution by receiving water and the adsorption to sediments will lower the PhACs concentrations when the WWTP effluent is discharged, the continuous input of PhACs also requires a risk assessment evaluation considering long-term exposure scenarios [30,37]. Therefore, the downstream environments were also evaluated.
With respect to receiving waters (downstream environments), the profile of environmental risk assessment (RQs) is similar. Except for SMX and DCF, the values of RQs were lower because of the dilution of target PhACs and the potential sorption to the sediments. In receiving waters, SMX and DCF showed high values of RQ. These values may be underestimated due not only to the limited number of sampling points but also because the samples were examined in periods with a good flow of surface water. Additionally, in receiving waters, due to climate-driven variability, significant variations in water flowrates can occur due to water scarcity, which is typical of this region mainly in summer periods. In certain downstream environments, higher percentages of effluents in the surface water were observed, with the river flow composed almost exclusively by the WWTP effluent of this region.
The simultaneous presence of different xenobiotics can result in toxic effects at concentrations lower than the PNEC for each contaminant [47]. Regarding PhACs, due to their similar pharmacological mechanisms, mainly in PhACs of the same therapeutical class, additive or synergetic effects may occur. As a result, the risks associated with residual PhACs in the downstream environments are probably higher than the calculated values [37,48].
In addition, the transformation by-products of PhACs in WWTPs or the environment (biodegradation, photolysis, and oxidation, among others) may pose additional risks.

4. Conclusions

Based upon our results, the presence of analgesic drugs (acetaminophen), NSAIDs (naproxen, ibuprofen, and diclofenac), antibiotics (sulfapyridine and sulfamethoxazole), beta-blockers (atenolol), psychostimulant drugs (caffeine), and anti-epileptic drugs (carbamazepine) in the influents of WWTPs of the Évora district was evident.
Acetaminophen was the prevalent PhAC measured in WWTPs, ranging from 27 to 414 µg/L, followed by caffeine with concentrations between 4.1 and 159 µg/L. NSAIDs, ibuprofen, diclofenac, and naproxen also showed higher concentrations, but in lower amounts than those obtained for APAP and caffeine on any WWTP, with median concentrations varying from 1.7 to 12µg/L.
The antibiotics sulfamethoxazole and sulfapyridine showed lower concentration levels, with median concentrations of 0.31 and 0.17 µg/L, respectively.
For treated effluents, diclofenac and carbamazepine showed results similar to those obtained in the influents, reflecting its recalcitrant characteristics being resistant to conventional WWTP removal processes.
Acetaminophen, ibuprofen, and naproxen were consistently measured at lower concentrations, or lower than the method quantification limit, reflecting removal efficiencies above 95% for these PhACs.
While the majority of PhACs showed RQs lower than one, suggesting negligible risks to the environment, RQs for diclofenac and sulfamethoxazole were derived at 7.7 and 68 in the downstream environments Água Ruça stream and Monreal stream, respectively. Although an RQ greater than the unit should not be directly interpreted as actual risks, this observation signifies the need for further investigations on the ecological consequences of these two pharmaceutical residues in an aquatic environment.

Supplementary Materials

The following are available online at https://0-www-mdpi-com.brum.beds.ac.uk/article/10.3390/app11167388/s1, Figure S1. Wastewater treatment steps of Évora WWTP. Figure S2. Wastewater treatment steps of Redondo and Reguengos WWTPs. Figure S3. Wastewater treatment steps of Borba WWTP. Figure S4. Wastewater treatment steps of Portel WWTP. Table S1. Parameters for calculation of risk quotient (RQ) of effluent and downstream environments of PhACs from Évora WWTPs. Table S2. PhACs in influents and effluents of Évora WWTP. Table S3. PhACs in influents and effluents of Reguengos de Monsaraz WWTP. Table S4. PhACs in influents and effluents of Borba WWTP. Table S5. PhACs in influents and effluents of Redondo WWTP. Table S6. PhACs in influents and effluents of Portel WWTP. Table S7. PhACs in downstream and upstream environment of Évora WWTP. Table S8. PhACs in downstream and upstream environment of Reguengos de Monsaraz WWTP. Table S9. PhACs in downstream and upstream environment of Borba WWTP. Table S10. PhACs in downstream environment of Redondo WWTP. Table S11. PhACs in downstream and upstream environment of Portel WWTP.

Author Contributions

Conceptualization, V.V.C. and R.N.C.; methodology, V.V.C., L.D., and C.M.M.A.; validation, S.S., V.V.C., and C.M.M.A.; formal analysis, S.S.; resources, R.N.C.; V.V.C., and C.M.M.A.; writing—original draft preparation, S.S. and C.M.M.A.; writing—review and editing, S.S., C.M.M.A., and V.V.C.; supervision, V.V.C. and R.N.C. All authors have read and agreed to the published version of the manuscript.

Funding

This research received no external funding.

Institutional Review Board Statement

Not applicable.

Informed Consent Statement

Not applicable.

Acknowledgments

The authors acknowledge the contributions of Águas do Vale do Tejo for providing the wastewater samples (sampling). This may include administrative and technical support.

Conflicts of Interest

The authors declare no conflict of interest.

References

  1. Mastroianni, N.; De Alda, M.L.; Barceló, D. Capitulo Lirbo Emergin contaminant Nicola Mastroianni. Contrib. Sci. 2010, 6, 193–197. [Google Scholar]
  2. Sorlini, S.; Collivignarelli, M.C.; Miino, M.C. Technologies for the control of emerging contaminants in drinking water treatment plants. Environ. Eng. Manag. J. 2019, 18, 2203–2216. [Google Scholar]
  3. Verlicchi, P.; Al Aukidy, M.; Zambello, E. Occurrence of pharmaceutical compounds in urban wastewater: Removal, mass load and environmental risk after a secondary treatment—A review. Sci. Total Environ. 2012, 429, 123–155. [Google Scholar] [CrossRef]
  4. Al Aukidy, M.; Verlicchi, P.; Jelic, A.; Petrovic, M.; Barcelò, D. Monitoring release of pharmaceutical compounds: Occurrence and environmental risk assessment of two WWTP effluents and their receiving bodies in the Po Valley, Italy. Sci. Total Environ. 2012, 438, 15–25. [Google Scholar] [CrossRef]
  5. Verlicchi, P.; Galletti, A.; Masotti, L. Management of hospital wastewaters: The case of the effluent of a large hospital situated in a small town. Water Sci. Technol. 2010, 61, 2507–2519. [Google Scholar] [CrossRef]
  6. Yi, X.; Tran, N.H.; Yin, T.; He, Y.; Gin, K.Y.-H. Removal of selected PPCPs, EDCs, and antibiotic resistance genes in landfill leachate by a full-scale constructed wetlands system. Water Res. 2017, 121, 46–60. [Google Scholar] [CrossRef]
  7. Sidhu, J.P.S.; Ahmed, W.; Gernjak, W.; Aryal, R.; McCarthy, D.; Palmer, A.; Kolotelo, P.; Toze, S. Sewage pollution in urban stormwater runoff as evident from the widespread presence of multiple microbial and chemical source tracking markers. Sci. Total Environ. 2013, 463–464, 488–496. [Google Scholar] [CrossRef]
  8. Tran, N.H.; Reinhard, M.; Gin, K.Y.H. Occurrence and fate of emerging contaminants in municipal wastewater treatment plants from different geographical regions—A review. Water Res. 2018, 133, 182–207. [Google Scholar] [CrossRef] [PubMed]
  9. Zhang, X.-X.; Zhang, T.; Fang, H.H.P. Antibiotic resistance genes in water environment. Appl. Microbiol. Biotechnol. 2009, 82, 397–414. [Google Scholar] [CrossRef] [PubMed]
  10. Kraemer, S.A.; Ramachandran, A.; Perron, G.G. Antibiotic Pollution in the Environment: From Microbial Ecology to Public Policy. Microorganisms 2019, 7, 180. [Google Scholar] [CrossRef] [Green Version]
  11. Ternes, T.A.; Hirsch, R. Occurrence and Behavior of X-ray Contrast Media in Sewage Facilities and the Aquatic Environment. Environ. Sci. Technol. 2000, 34, 2741–2748. [Google Scholar] [CrossRef]
  12. Luthy, R.G.; Sedlak, D.L.; Plumlee, M.H.; Austin, D.; Resh, V.H. Wastewater-effluent-dominated streams as ecosystem-management tools in a drier climate. Front. Ecol. Environ. 2015, 13, 477–485. [Google Scholar] [CrossRef] [Green Version]
  13. AdP—Águas de Portugal. Águas de Portugal: By the Book, Edições Especiais, lda; Printer Portuguesa: Rio de Mouro, Portugal, 2016; ISBN 978-989-8614-07-0. [Google Scholar]
  14. Hughes, J.; Cowper-Heays, K.; Olesson, E.; Bell, R.; Stroombergen, A. Impacts and implications of climate change on wastewater systems: A New Zealand perspective. Clim. Risk Manag. 2021, 31, 100262. [Google Scholar] [CrossRef]
  15. Münze, R.; Hannemann, C.; Orlinskiy, P.; Gunold, R.; Paschke, A.; Foit, K.; Becker, J.; Kaske, O.; Paulsson, E.; Peterson, M.; et al. Pesticides from wastewater treatment plant effluents affect invertebrate communities. Sci. Total Environ. 2017, 599–600, 387–399. [Google Scholar] [CrossRef]
  16. Akpor, O.B.; OTohinoyi, D.A. Pollutants in Wastewater Effluents: Impacts and Remediation Processes. Int. J. Environ. Res. Earth Sci. 2014, 27, 249–253. [Google Scholar]
  17. Jin, Z.; Zhang, X.; Li, J.; Yang, F.; Kong, D.; Wei, R.; Huang, K.; Zhou, B. Impact of wastewater treatment plant effluent on an urban river. J. Freshw. Ecol. 2017, 32, 697–710. [Google Scholar] [CrossRef] [Green Version]
  18. Martí, E.; Riera, J.L.; Sabater, F. Effects of Wastewater Treatment Plants on Stream Nutrient Dynamics Under Water Scarcity Conditions. In Water Scarcity in the Mediterranean; The Handbook of Environmental Chemistry, vol 8; Springer: Berlin/Heidelberg, Germany, 2009; pp. 173–195. [Google Scholar]
  19. Hamdhani, H.; Eppehimer, D.E.; Bogan, M.T. Release of treated effluent into streams: A global review of ecological impacts with a consideration of its potential use for environmental flows. Freshw. Biol. 2020, 65, 1657–1670. [Google Scholar] [CrossRef]
  20. Bischel, H.N.; Lawrence, J.E.; Halaburka, B.J.; Plumlee, M.H.; Bawazir, A.S.; King, J.P.; McCray, J.E.; Resh, V.H.; Luthy, R.G. Renewing urban streams with recycled water for streamflow augmentation: Hydrologic, water quality, and ecosystem services management. Environ. Eng. Sci. 2013, 30, 455–479. [Google Scholar] [CrossRef]
  21. Infarmed Monitorization of the Market. 2018. Available online: https://www.infarmed.pt/documents/15786/1229727/Estatística+do+medicamento+2018+%28pdf%29/343a8ff0-40fe-0be3-be6d-82c79be3f680?version=1.3 (accessed on 11 June 2021).
  22. EU Directive 2013/39/EU of the European Parliament and of the Council of 12 August 2013 amending Directives 2000/60/EC and 2008/105/EC as regards priority substances in the field of water policy. Off. J. Eur. Union 2013, 226, 1–17.
  23. Gaffney, V.J.; Cardoso, V.V.; Cardoso, E.; Teixeira, A.P.; Martins, J.; Benoliel, M.J.; Almeida, C.M.M. Occurrence and behaviour of pharmaceutical compounds in a Portuguese wastewater treatment plant: Removal efficiency through conventional treatment processes. Environ. Sci. Pollut. Res. 2017, 24, 14717–14734. [Google Scholar] [CrossRef]
  24. Rodrigues, J.; Albino, S.; Silva, S.; Cravo, A.; Cardoso, V.V.; Benoliel, M.J.; Almeida, C.M.M. Development of a Multiresidue Method for the Determination of 24 Pharmaceuticals in Clams by QuEChERS and Liquid Chromatography-Triple Quadrupole Tandem Mass Spectrometry. Food Anal. Methods 2019, 12, 838–851. [Google Scholar] [CrossRef]
  25. Silva, S.; Rodrigues, J.A.; Coelho, M.R.; Martins, A.; Cardoso, E.; Cardoso, V.V.; Benoliel, M.J.; Almeida, C.M.M. Occurrence of pharmaceutical active compounds in sewage sludge from two urban wastewater treatment plants and their potential behaviour in agricultural soils. Environ. Sci. Water Res. Technol. 2021, 7, 969–982. [Google Scholar] [CrossRef]
  26. Silva, C.; Almeida, C.M.M.; Rodrigues, J.A.; Silva, S.; do Coelho, M.R.; Martins, A.; Lourinho, R.; Cardoso, E.; Cardoso, V.V.; Benoliel, M.J.; et al. Occurrence and seasonality of pharmaceutical compounds in urban wastewaters in two Portuguese regions. Urban Water J. 2021, 18, 465–478. [Google Scholar] [CrossRef]
  27. International Organization for Standardization ISO, ISO 8466-1:1990. Water Quality-Calibration and Evaluation of Analytical Methods and Estimation of Performance Characteristics-Part 1: Statistical Evaluation of the Linear Calibration Function, ISO/TC 147/SC 2 Physical, Chemical and Biochemical Methods, 1-8, 1st ed.; International Organization for Standardization: Genève, Switzerland, 1990. [Google Scholar]
  28. International Organization for Standardization ISO. ISO 11352: 2012. Water Quality-Estimation of Measurement Uncertainty Based on Validation and Quality Control Data. ISO/TC 147/SC 2 Physical, Chemical and Biochemical Methods, 1–26, 1st ed.; International Organization for Standardization: Genève, Switzerland, 2012. [Google Scholar]
  29. CEC (Commission of the European Community). Technical Guidance Document on Risk Assessment in Support of Commission Directive 93/67/EEC on Risk Assessment for New Notified Substances, Commission Regulation (EC) No 1488/94 on Risk Assessment for Existing Substa; 2003. Available online: http://0-scholar-google-com.brum.beds.ac.uk/scholar?hl=en%7B%5C&%7DbtnG=Search%7B%5C&%7Dq=intitle:Technical+guidance+document+on+risk+assessment+Part+II%7B%5C#%7D6 (accessed on 24 June 2021).
  30. Ben, W.; Zhu, B.; Yuan, X.; Zhang, Y.; Yang, M.; Qiang, Z. Occurrence, removal and risk of organic micropollutants in wastewater treatment plants across China: Comparison of wastewater treatment processes. Water Res. 2018, 130, 38–46. [Google Scholar] [CrossRef]
  31. Liu, N.; Jin, X.; Feng, C.; Wang, Z.; Wu, F.; Johnson, A.C.; Xiao, H.; Hollert, H.; Giesy, J.P. Ecological risk assessment of fifty pharmaceuticals and personal care products (PPCPs) in Chinese surface waters: A proposed multiple-level system. Environ. Int. 2020, 136, 105454. [Google Scholar] [CrossRef]
  32. Loos, R.; Marinov, D.; Sanseverino, I.; Napierska, D.; Lettieri, T. Review of the 1st Watch List under the Water Framework Directive and Recommendations for the 2nd Watch List, EUR 29173 EN; Publication Office of the European Union: Luxembourg, 2018; ISBN 9789279818394. [Google Scholar]
  33. Caldwell, D.J.; Mastrocco, F.; Anderson, P.D.; Länge, R.; Sumpter, J.P. Predicted-no-effect concentrations for the steroid estrogens estrone, 17β-estradiol, estriol, and 17α-ethinylestradiol. Environ. Toxicol. Chem. 2012, 31, 1396–1406. [Google Scholar] [CrossRef] [PubMed]
  34. Salgado, R.; Noronha, J.P.; Oehmen, A.; Carvalho, G.; Reis, M.A.M. Analysis of 65 pharmaceuticals and personal care products in 5 wastewater treatment plants in Portugal using a simplified analytical methodology. Water Sci. Technol. 2010, 62, 2862–2871. [Google Scholar] [CrossRef]
  35. Santos, L.; Gros, M.; Rodriguez-Mozaz, S.; Delerue-Matos, C.; Pena, A.; Barcelo, D.; Montenegro, M. Contribution of hospital effluents to the load of pharmaceuticals in urban wastewaters: Identification of ecologically relevant pharmaceuticals. Sci. Total Environ. 2013, 461, 302–316. [Google Scholar] [CrossRef] [Green Version]
  36. Pereira, A.M.P.T.; Silva, L.J.G.; Meisel, L.M.; Lino, C.M.; Pena, A. Environmental impact of pharmaceuticals from Portuguese wastewaters: Geographical and seasonal occurrence, removal and risk assessment. Environ. Res. 2015, 136, 108–119. [Google Scholar] [CrossRef] [PubMed] [Green Version]
  37. Pereira, A.M.P.T.; Silva, L.J.G.; Laranjeiro, C.S.M.; Meisel, L.M.; Lino, C.M.; Pena, A. Human pharmaceuticals in Portuguese rivers: The impact of water scarcity in the environmental risk. Sci. Total Environ. 2017, 609, 1182–1191. [Google Scholar] [CrossRef] [PubMed]
  38. Zorita, S.; Mårtensson, L.; Mathiasson, L. Occurrence and removal of pharmaceuticals in a municipal sewage treatment system in the south of Sweden. Sci. Total Environ. 2009, 407, 2760–2770. [Google Scholar] [CrossRef]
  39. Gaffney, V.J.; Cardoso, V.V.; Rodrigues, A.; Ferreira, E.; Benoliel, M.; Almeida, C.M.M. Analysis of Pharmaceutical Compounds in Waters by SPE-UPLC-ESI-MS/MS. Quim. Nova 2014, 37, 138–149. [Google Scholar] [CrossRef] [Green Version]
  40. Gupta, A.; Thakur, I.S. Treatment of Organic Recalcitrant Contaminants in Wastewater. In Biological Wastewater Treatment and Resource Recovery; Robina, F., Ahmad, Z., Eds.; IntechOpen: London, UK, 2017. [Google Scholar]
  41. Rodríguez-Nava, O.; Ramírez-Saad, H.; Loera, O.; González, I. Evaluation of the simultaneous removal of recalcitrant drugs (bezafibrate, gemfibrozil, indomethacin and sulfamethoxazole) and biodegradable organic matter from synthetic wastewater by electro-oxidation coupled with a biological system. Environ. Technol. 2016, 37, 2964–2974. [Google Scholar] [CrossRef]
  42. Schröder, P.; Helmreich, B.; Škrbić, B.; Carballa, M.; Papa, M.; Pastore, C.; Emre, Z.; Oehmen, A.; Langenhoff, A.; Molinos, M.; et al. Status of hormones and painkillers in wastewater effluents across several European states—considerations for the EU watch list concerning estradiols and diclofenac. Environ. Sci. Pollut. Res. 2016, 23, 12835–12866. [Google Scholar] [CrossRef]
  43. Katsoyiannis, A.; Samara, C. The fate of dissolved organic carbon (DOC) in the wastewater treatment process and its importance in the removal of wastewater contaminants. Environ. Sci. Pollut. Res. Int. 2007, 14, 284–292. [Google Scholar] [CrossRef] [PubMed]
  44. Katsoyiannis, A.; Zouboulis, A.; Samara, C. Persistent organic pollutants (POPs) in the conventional activated sludge treatment process: Model predictions against experimental values. Chemosphere 2006, 65, 1634–1641. [Google Scholar] [CrossRef]
  45. Manallack, D.T. The pKa Distribution of Drugs: Application to Drug Discovery. Perspect. Medicin. Chem. 2007, 1, 25–38. [Google Scholar] [CrossRef] [PubMed]
  46. Sui, Q.; Huang, J.; Deng, S.; Yu, G.; Fan, Q. Occurrence and removal of pharmaceuticals, caffeine and DEET in wastewater treatment plants of Beijing, China. Water Res. 2010, 44, 417–426. [Google Scholar] [CrossRef]
  47. Wang, L.; Ying, G.-G.; Zhao, J.-L.; Yang, X.-B.; Chen, F.; Tao, R.; Liu, S.; Zhou, L.-J. Occurrence and risk assessment of acidic pharmaceuticals in the Yellow River, Hai River and Liao River of north China. Sci. Total Environ. 2010, 408, 3139–3147. [Google Scholar] [CrossRef] [PubMed]
  48. Backhaus, T.; Faust, M. Predictive Environmental Risk Assessment of Chemical Mixtures: A Conceptual Framework. Environ. Sci. Technol. 2012, 46, 2564–2573. [Google Scholar] [CrossRef]
Figure 1. Identification of geographical area under evaluation and localization of WWTPs regions.
Applsci 11 07388 g001
Figure 2. Composition profiles of PhACs in influents (A) and effluents (B) of target WWTPs.
Applsci 11 07388 g002
Figure 3. Composition profiles of PhACs in upstream and downstream samples of target WWTPs. As for the downstream results, the profiles between samples were different. DCF was the most representative PhAC in Évora (1.72 µg/L) and Reguengos de Monsaraz (2.10 µg/L) WWTPs. For Borba WWTP it was CAF (2.19 µg/L) and DCF (1.44 µg/L). For the Redondo WWTP, CBZ and DCF had the highest concentrations of 0.88 µg/L and 0.72 µg/L, respectively. All the remaining detected PhACs had concentrations smaller than 1 µg/L.
Applsci 11 07388 g003aApplsci 11 07388 g003b
Figure 4. Removal efficiencies of target PhACs in WWTPs of the Évora district: removal efficiency of all WWTPs and the removal efficiency of each WWTP.
Applsci 11 07388 g004aApplsci 11 07388 g004b
Figure 5. Risk quotient (RQ) values of target PhACs in effluents of each WWTP (a) and their receiving waters (b).
Applsci 11 07388 g005
Table 1. Characterization of WWTPs of the Évora district, number of samples, and identification of wastewater sampling points.
Évora WWTPReguengos de Monsaraz
WWTP
Borba
WWTP
Redondo WWTPPortel WWTP
Population equivalent78,60111,050800070003164
Influent flow rate (m3/day)11,9911066636808740
Effluent flow rate (m3/day)13,720207614301409657
TreatmentASCPLT-ASPLT-ASPLT-ASPWSPs
Wastewater sources
Domestic sewage
Industrial sewage
Hospital sewage

X
X
X

X
X

X
X

X
X

X
X
Number of samples1916141216
Influents56455
Effluents65445
Upstream413---3
Downstream44333
Receiving watersXarrama RiverMonreal StreamBorba StreamÁgua Ruça StreamPego Grande Stream
ASCP: activate sludge conventional process; LT-ASP: long-term activate sludge process; WSPs: wastewater stabilization ponds.
Table 2. Working range, method detection, and method quantification limits (MDL, MQL), recovery (Rec, %) and relative standard deviation (RSD, %), and expanded uncertainty (U, %) of SPE-LC-MS/MS method.
PhACsWorking Range (µg/L)R2
(n = 6)
CVm (%)PGMDL
(ng/L)
MQL
(ng/L)
Rec
(%)
(n = 25)
RSD
(%)
(n = 25)
U
(%)
Acidic method
ATN0.76–7.10.99984.14−0.4940.512.375.115.029
APAP0.79–7.30.99934.751.3142.412.974.512.828
SDZ0.84–7.80.99962.870.0441.912.780.17.6130
SPD0.77–7.10.99971.580.3436.711.1849.4131
CAF0.8–7.40.99965.211.7129.99.0610713.224
SMX0.77–7.20.99981.550.1731.29.4698.77.4129
MTPL0.76–7.10.99993.530.2729.28.8610414.834
PPNL0.79–7.30.99964.481.8153.916.358.68.9942
CTS0.78–7.30.99981.640.0342.412.873.66.1331
CBZ0.78–7.30.99982.510.8557.717.554.10.6829
CFA4.2–390.99972.345.76140.042.412016.729
NPX0.77–7.20.99992.902.4531.59.5497.89.6126
GTD0.78–7.30.99936.665.7971.121.543.91.3235
TTE0.75–7.00.99954.231.2453.516.256.110.138
Basic method
BZF0.75–7.00.99961.931.5526.37.98113.918.236
IBUP1.6–14.50.99991.593.5366.420.196.48.0128
DCF0.77–7.20.99973.750.00322.56.811374.1413
E110.1–940.99973.912.94735.9223.054.913.935
E37.19–670.99991.700.98284.886.310117.823
E29.02–840.99835.780.08560.2169.864.418.135
EE29.24–860.99902.625.81658.8199.656.113.440
DES9.27–870.99855.940.3435.2131.985.213.841
ERT1.58–150.99946.236.0444.213.414323.840
FLX1.51–140.99924.880.9937.811.416019.532
CLR1.52–140.99945.760.3587.126.469.813.038
AZM1.51–140.99933.251.9096.029.162.917.633
Table 3. Minimum (Min), maximum (Max), and median (Med) PhACs concentrations. Percentage of positive results (Pos (%)) and frequency (Freq) in the influent and effluent of five WWTPs of the Évora district.
PhACsAcidic Method
Influent (µg/L)Effluent (µg/L)
MinMaxMedPos (%)FreqMinMaxMedPos (%)Freq
ATN0.0763.10.921004.80.0670.240.15884.2
APAP27.2414115964.60.0488.40.18502.4
SDZ0.0440.0440.04440.2---------00
SPD0.0362.90.17884.20.0410.220.087542.6
CAF4.216040.91004.80.04339.20.171004.8
SMX0.0394.10.31964.60.0540.440.096924.4
MTPL0.0510.190.079381.80.0440.0780.052211
PPNL0.0490.180.10753.60.0390.0740.051502.4
CTS0.0760.430.12673.2---------00
CBZ0.0841.60.301004.80.0781.30.361004.8
CFA---------00---------00
NPX0.2937.68.01004.80.0354.10.25884.2
GTD---------00---------00
TTE0.0300.0830.051502.4---------00
Basic method
BZF0.0581.70.67502.40.0470.380.089381.8
IBUP0.3537.112.11004.80.07110.80.32422
DCF0.325.21.691004.80.0474.01.61004.8
E1---------00---------00
E3---------00---------00
E2---------00---------00
EE2---------00---------00
DES---------00---------00
ERT0.0950.290.17130.60.0860.150.099170.8
FLX---------00---------00
CLR0.150.940.26130.6---------00
AZM0.130.480.15170.80.110.120.1180.4
--- (<MQL).
Table 4. Minimum (Min), maximum (Max), and median (Med) PhACs concentrations. Percentage of positive results (Pos (%)) and frequency (Freq) in the upstream and downstream of five WWTPs of the Évora district.
PhACsAcidic Method
Upstream (µg/L)Downstream (µg/L)
MinMaxMedPos (%)FreqMinMaxMedPos (%)Freq
ATN0.0460.220.153610.0420.230.13531.8
APAP0.0480.260.0763610.0450.200.12120.4
SDZ---------00---------00
SPD0.0440.130.084270.750.0430.180.079592
CAF0.0570.390.151002.750.0413.10.111003.4
SMX0.0440.0870.0703610.0430.230.095712.4
MTPL0.0680.0680.06890.250.0430.0730.060180.6
PPNL0.0770.0770.07790.250.0350.0730.054240.8
CTS---------00---------00
CBZ0.0430.470.22451.250.0441.30.29943.2
CFA---------00---------00
NPX0.0531.00.071641.750.0360.340.11762.6
GTD---------00---------531.8
TTE---------00---------120.4
Basic method
BZF0.0460.110.078180.50.0390.120.077240.8
IBUP0.0900.0970.094180.50.0930.100.098120.4
DCF0.0362.50.85551.50.493.51.6822.8
E1---------00---------00
E3---------00---------00
E2---------00---------00
EE2---------00---------00
DES---------00---------00
ERT0.140.140.1490.25---------00
FLX---------00---------00
CLR---------00---------00
AZM0.0940.110.10180.50.920.0920.09260.2
--- (<MQL).
Publisher’s Note: MDPI stays neutral with regard to jurisdictional claims in published maps and institutional affiliations.

