
Performance Estimation of Intensity Accumulation Display by Computer-Generated Holograms

1
Department of Photonics, Feng Chia University, 100 Wenhwa Rd., Seatwen, Taichung 40724, Taiwan
2
Digital Optics Center, Feng Chia University, 100 Wenhwa Rd., Seatwen, Taichung 40724, Taiwan
3
Peng Cheng Laboratory, Shenzhen 518055, China
4
Bradley Department of Electrical and Computer Engineering, Virginia Tech, Blacksburg, VA 24061, USA
*
Author to whom correspondence should be addressed.
Appl. Sci. 2021, 11(16), 7729; https://0-doi-org.brum.beds.ac.uk/10.3390/app11167729
Submission received: 1 August 2021
/
Revised: 19 August 2021
/
Accepted: 19 August 2021
/
Published: 22 August 2021
(This article belongs to the Special Issue Holography, 3D Imaging and 3D Display Volume II)
Abstract
:The image generated by binary computer-generated holograms (CGHs) always suffers from serious speckle noise. Thanks to the fast frame rate of the binary spatial light modulator, the speckle can be significantly suppressed by intensity accumulation, i.e., the sequential display of multiple CGHs of the same scene. If enough randomness is added to the CGHs, the speckle noise can be mostly averaged out. Intuitively, the quality of the reconstructed image should be proportional to the number of intensity accumulation. However, there is no simple method to predict the dependence of the average noise and accumulation number, and we can only know the results after finishing the full computation. In this paper, we propose an empirical formula of the average noise based on the speckle phenomenon in a laser projector. Using this model, we have confirmed that the randomness induced by random phase is equivalent to that induced by random down-sampling for the generation of binary CGHs. In addition, if the computational efficiency is a concern, the CGH calculated with iterations is not recommended for intensity accumulation display. Finally, there is an upper-quality limit of the reconstructed image by intensity accumulation. Thus, a strategy for efficient intensity accumulation is suggested.
1. Introduction
The use of a computer-generated hologram (CGH) is a promising technique for naked-eye three-dimensional (3D) display without the issue of vergence-accommodation conflict [1]. To realize the display, the CGHs are applied to address a spatial light modulator (SLM), generating the light field of a 3D scene. Usually, the SLM is a phase-modulation (PM) SLM for the high diffraction efficiency. Alternatively, the 3D display can also be realized by using a binary SLM; i.e., the modulation is 0, in phase or 0, 1 in amplitude [2,3,4,5,6]. The display quality of a binary SLM is usually low because of the limited degrees of freedom. Although optimization algorithms, such as binary search [7,8,9] or simulated annealing [10], can be applied to improve the quality of binary CGH display, the quality of a single binary CGH is still limited. Error diffusion [11,12,13] can generate a binary CGH with good quality only when the object distance, the normalization factor, and the weighting factors are optimized. Super-pixel display schemes [14,15,16] can achieve high-quality display by binary CGHs. However, its optical filtering setup significantly increases the form factor, thereby limiting its application potential. On the other hand, it is easier to drive a binary SLM, and thus the display frame rate of a binary SLM can be ten to a thousand times faster than an eight-bit PM SLM. Therefore, it is capable of quickly displaying different CGHs of the same scene, which is called intensity accumulation (IA) [17,18,19,20]. In this way, the speckle noise can be averaged out and thus the quality of a reconstructed image can be significantly improved. However, there is no simple method to predict the dependence of average noise and accumulation number, and we can only know the results after finishing the full computation. In this paper, our goal is to find a suitable model to describe the dependence between the average noise and the accumulation number. This model is confirmed to fit the properties of binary CGHs generated by the random phase (RP) method, the modified iterative Fresnel algorithm (MIFA), and the localized random down-sampling (LRDS) method. With the help of the noise model, we can optimize the design strategy for various application circumstances.
2. Method
2.1. Binary Computer-Generated Holograms
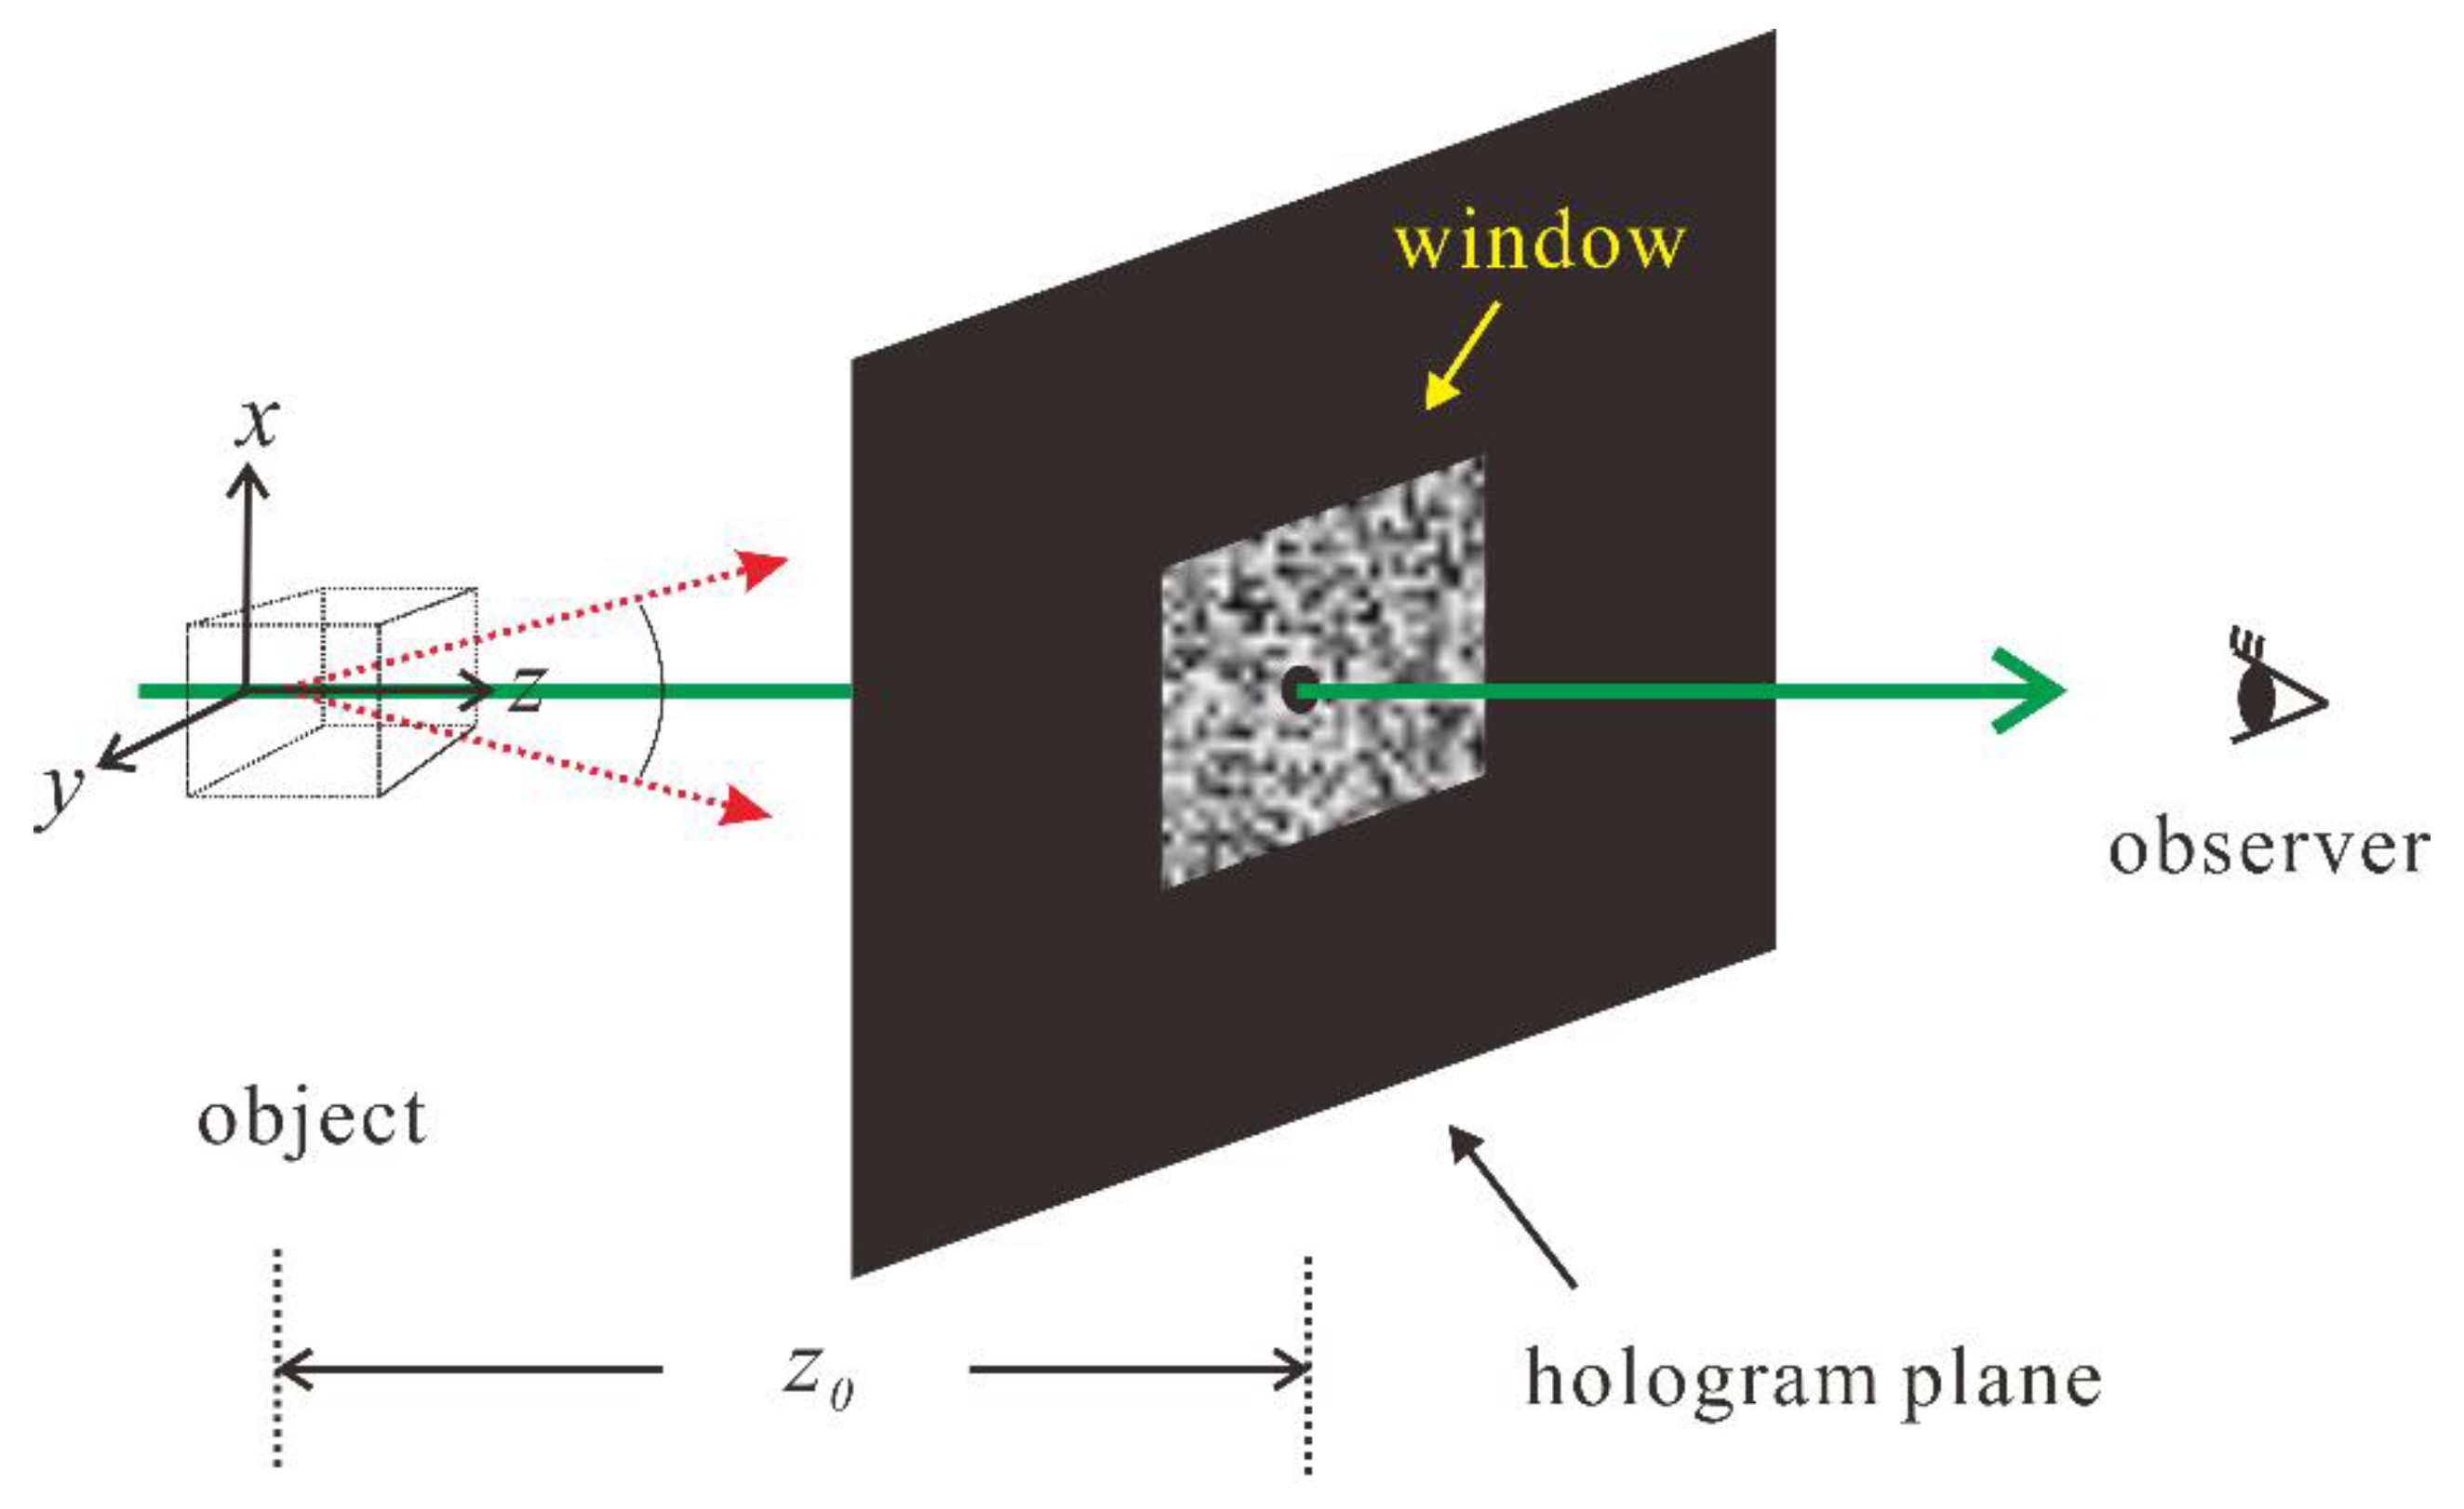
Figure 1 illustrates the setup for calculating binary CGHs. First, the complex amplitude of the object light at the hologram plane is calculated by
where is the object function (the amplitude transmittance of object), which is assumed to be two-dimensional (2D) for simplicity; is the free-space transfer function, are spatial frequencies corresponding to spatial coordinates and ; is the distance from the object to the hologram plane; and finally and denote the 2D Fourier transform and 2D inverse Fourier transform, respectively. In the digital calculation of free-space propagation, the workspace of both the object plane and the hologram plane must be much larger than the object; otherwise, aliasing occurs [21]. Subsequently, the light field inside the window region of the hologram plane is cropped and binarized by
where is the window function, and is the binarization operator, defined by
In reconstruction, the binary hologram is backpropagated from the hologram plane to the object plane. There are two problems in the calculation of binary CGHs. First, if the object function is spatially smooth, the binary CGH will reconstruct a high-pass filtered version of the image and the low spatial-frequency information is lost [22]. Therefore, the object function should be pre-processed before the forward propagation. The processing methods will be introduced in the next section. The second problem is that both the field truncation due to the window function and binarization will result in speckle noise. In this paper, our focus is on speckle noise suppression by intensity accumulation. The image reconstructed by intensity accumulation is expressed as
where is the reconstructed field of the -th binary hologram , and is the total number of holograms for the same object. Finally, we use peak-signal-to-noise ratio (PSNR) as the metric to estimate the quality of the reconstructed image. PSNR is defined as
where and are, respectively, the maximum signal and the root mean square error of in comparison with .
2.2. Processing of the Object Function
The typical method to process the object function is the random phase (RP) method, in which a random phase function is multiplied to an object function, giving a new function,
where is a random value in the range . Because there will be numerous distributions of the random phase, it is easy to generate different random phase functions for binary CGHs. A variation of the RP method is the modified iterative Fresnel algorithm (MIFA), in which the object field and the binary hologram are iteratively obtained with each other [23,24]. The object-amplitude constraint and the binary-amplitude constraint are applied on the retrieved object and the hologram, respectively. Therefore, each iteration in MIFA needs one forward propagation and one backward propagation. After multiple iterations, the object can be regarded as being modulated by an optimized phase mask, and the phase distribution of the object still looks random.
The second method of object processing is localized random down-sampling (LRDS). The down-sampled object function is expressed as
where is a binary mask with the same size as the object function. The mask is segmented into many tiles with size pixels. For each tile, one pixel is randomly selected as unity (on), and the others are zero (off). Therefore, the down-sampling rate of the mask is , and many LRDS masks with different sampling positions can be generated. Based on LRDS, there is an advanced method called adaptive intensity accumulation (AIA) [18]. In the AIA method, the object will not only be down-sampled but will also be modified by an adaptive binary mask. The -th adaptive mask is determined from the reconstruction of previous n CGHs to enhance the image quality. Therefore, every CGH for the AIA method needs one forward propagation and one backward propagation.
2.3. Noise Model of Intensity Accumulation
Before comparing different methods of binary CGHs, we need to find a model to quantitatively describe the dependence of the speckle noise on the number of intensity accumulation. Because this is a statistical problem and needs complicated calculation, we intend not to derive the exact solution. By contrast, we only build an empirical formula according to the simulation data. The candidate formula comes from an analogous speckle phenomenon, i.e., the summation of multiple speckled images in laser projection [25,26]. This postulation is reasonable because the holographic recording is similar to the step of light from a micro displayer to the entrance pupil of the projector; the holographic reconstruction is comparable to the procedure of light from the exit pupil of the projector to the screen. In short, the speckle contrast of the displayed image is expressed as
where is the number of summation, and is the ratio of imaging resolution (the minimum imaging spot size) over the speckle size. In our problem, i.e., the intensity accumulation of CGHs, depends on object distance, the pixel pitch, and the hologram size. According to our simulation condition, ranges from 15 to 25 normally. However, direct calculation of is difficult because it is also affected by the distribution of object function and the processing method. Finally, by assuming that all the noise in reconstruction comes from speckle, the PSNR in this model is expressed as
where is the peak signal, which depends on the distribution of the objective function and the object processing method. It should be noted that Equation (8) is originally derived under the assumption that the signal is uniform. In practice, the signal, i.e., the original object, contains different brightness in various locations. Therefore, we can only find the mean values of and from simulation or experimental data.
3. Simulation
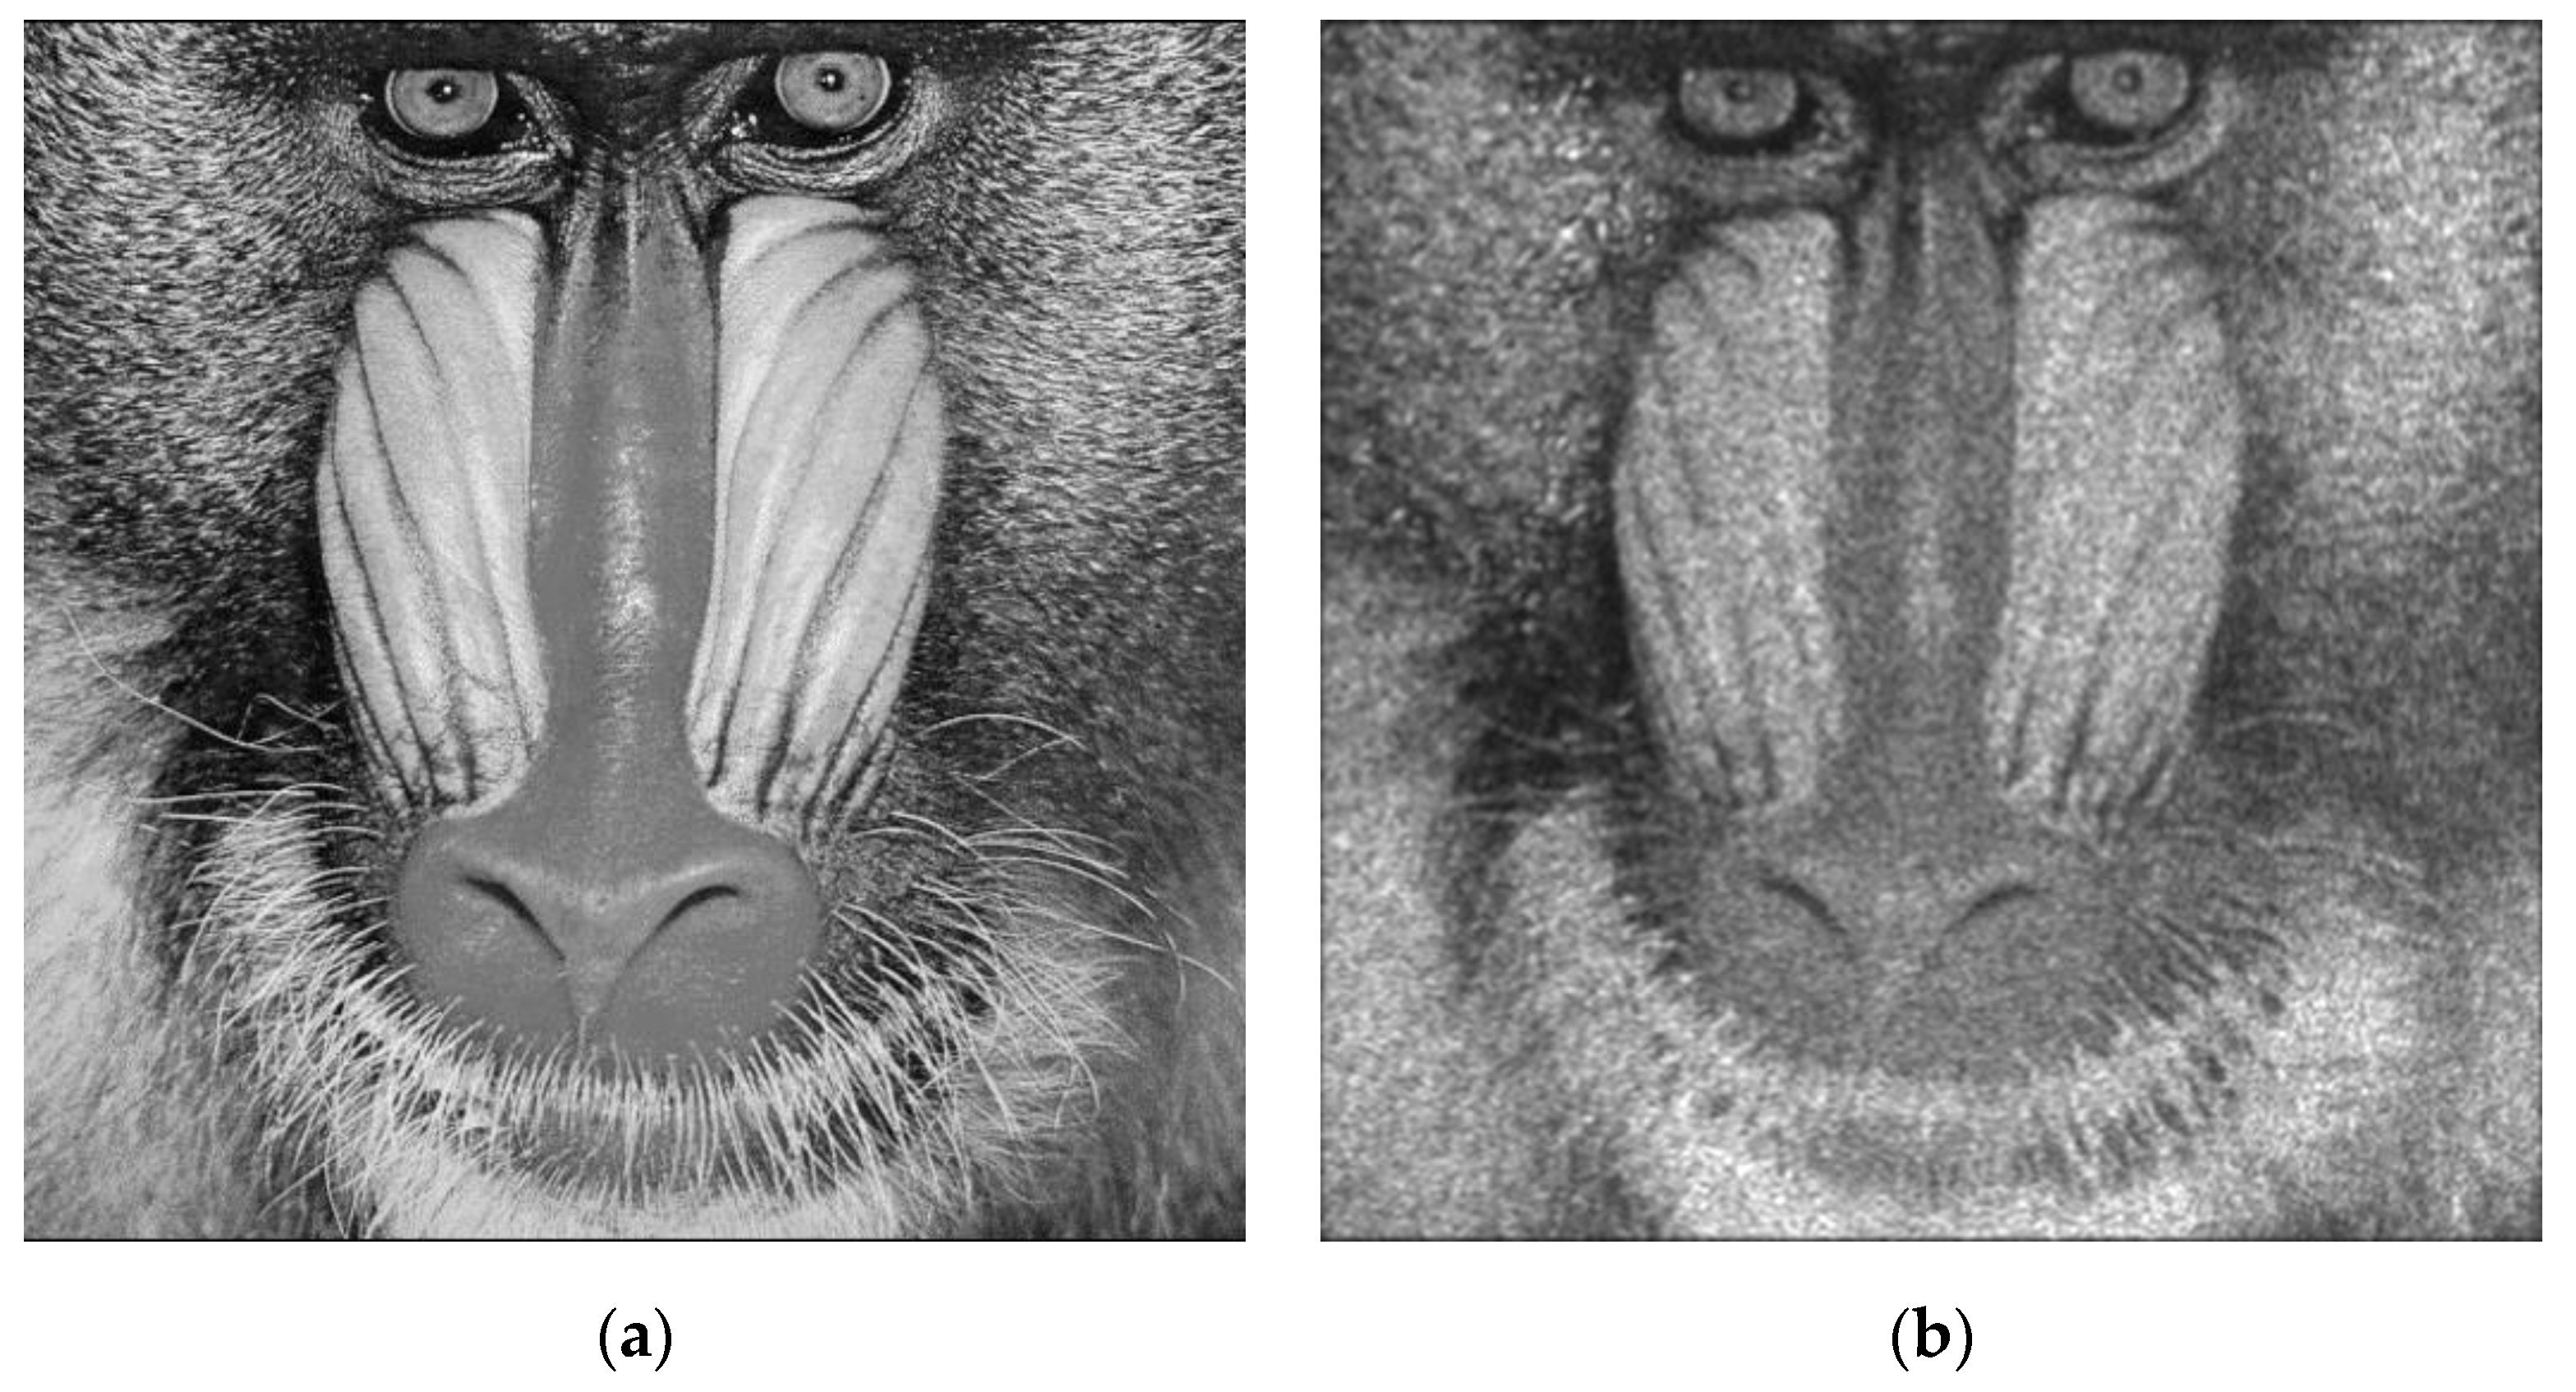
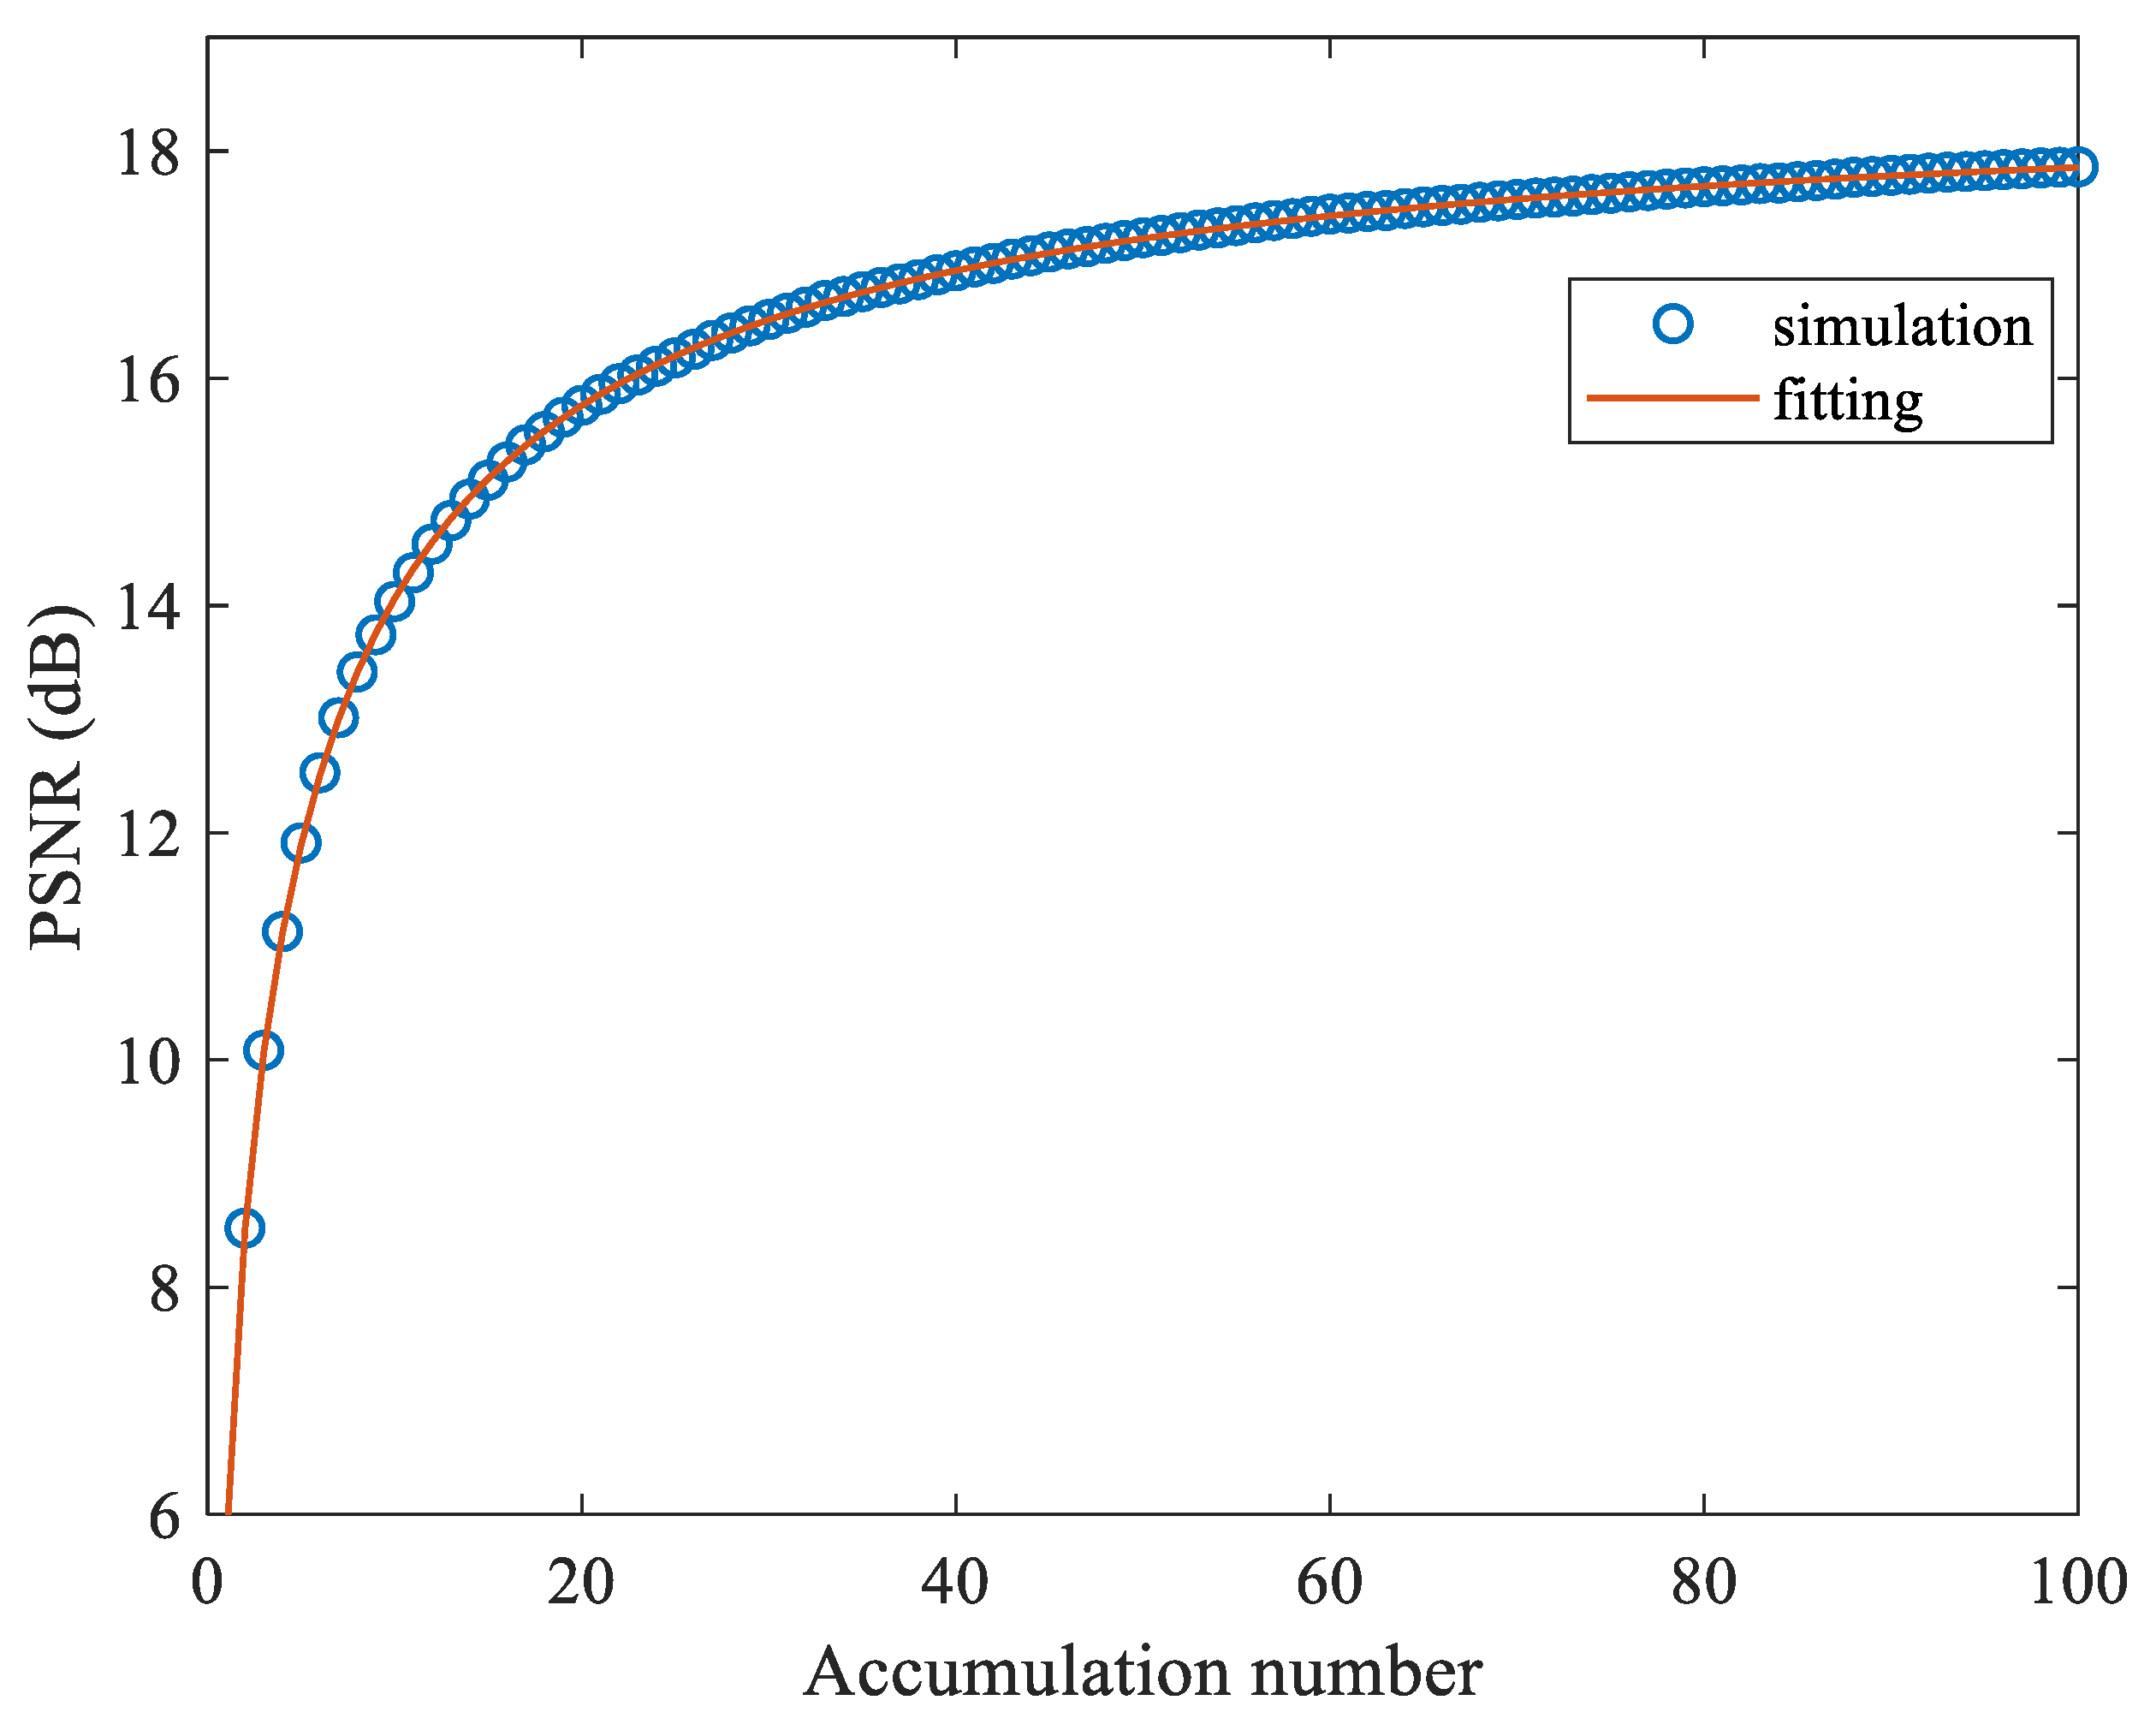
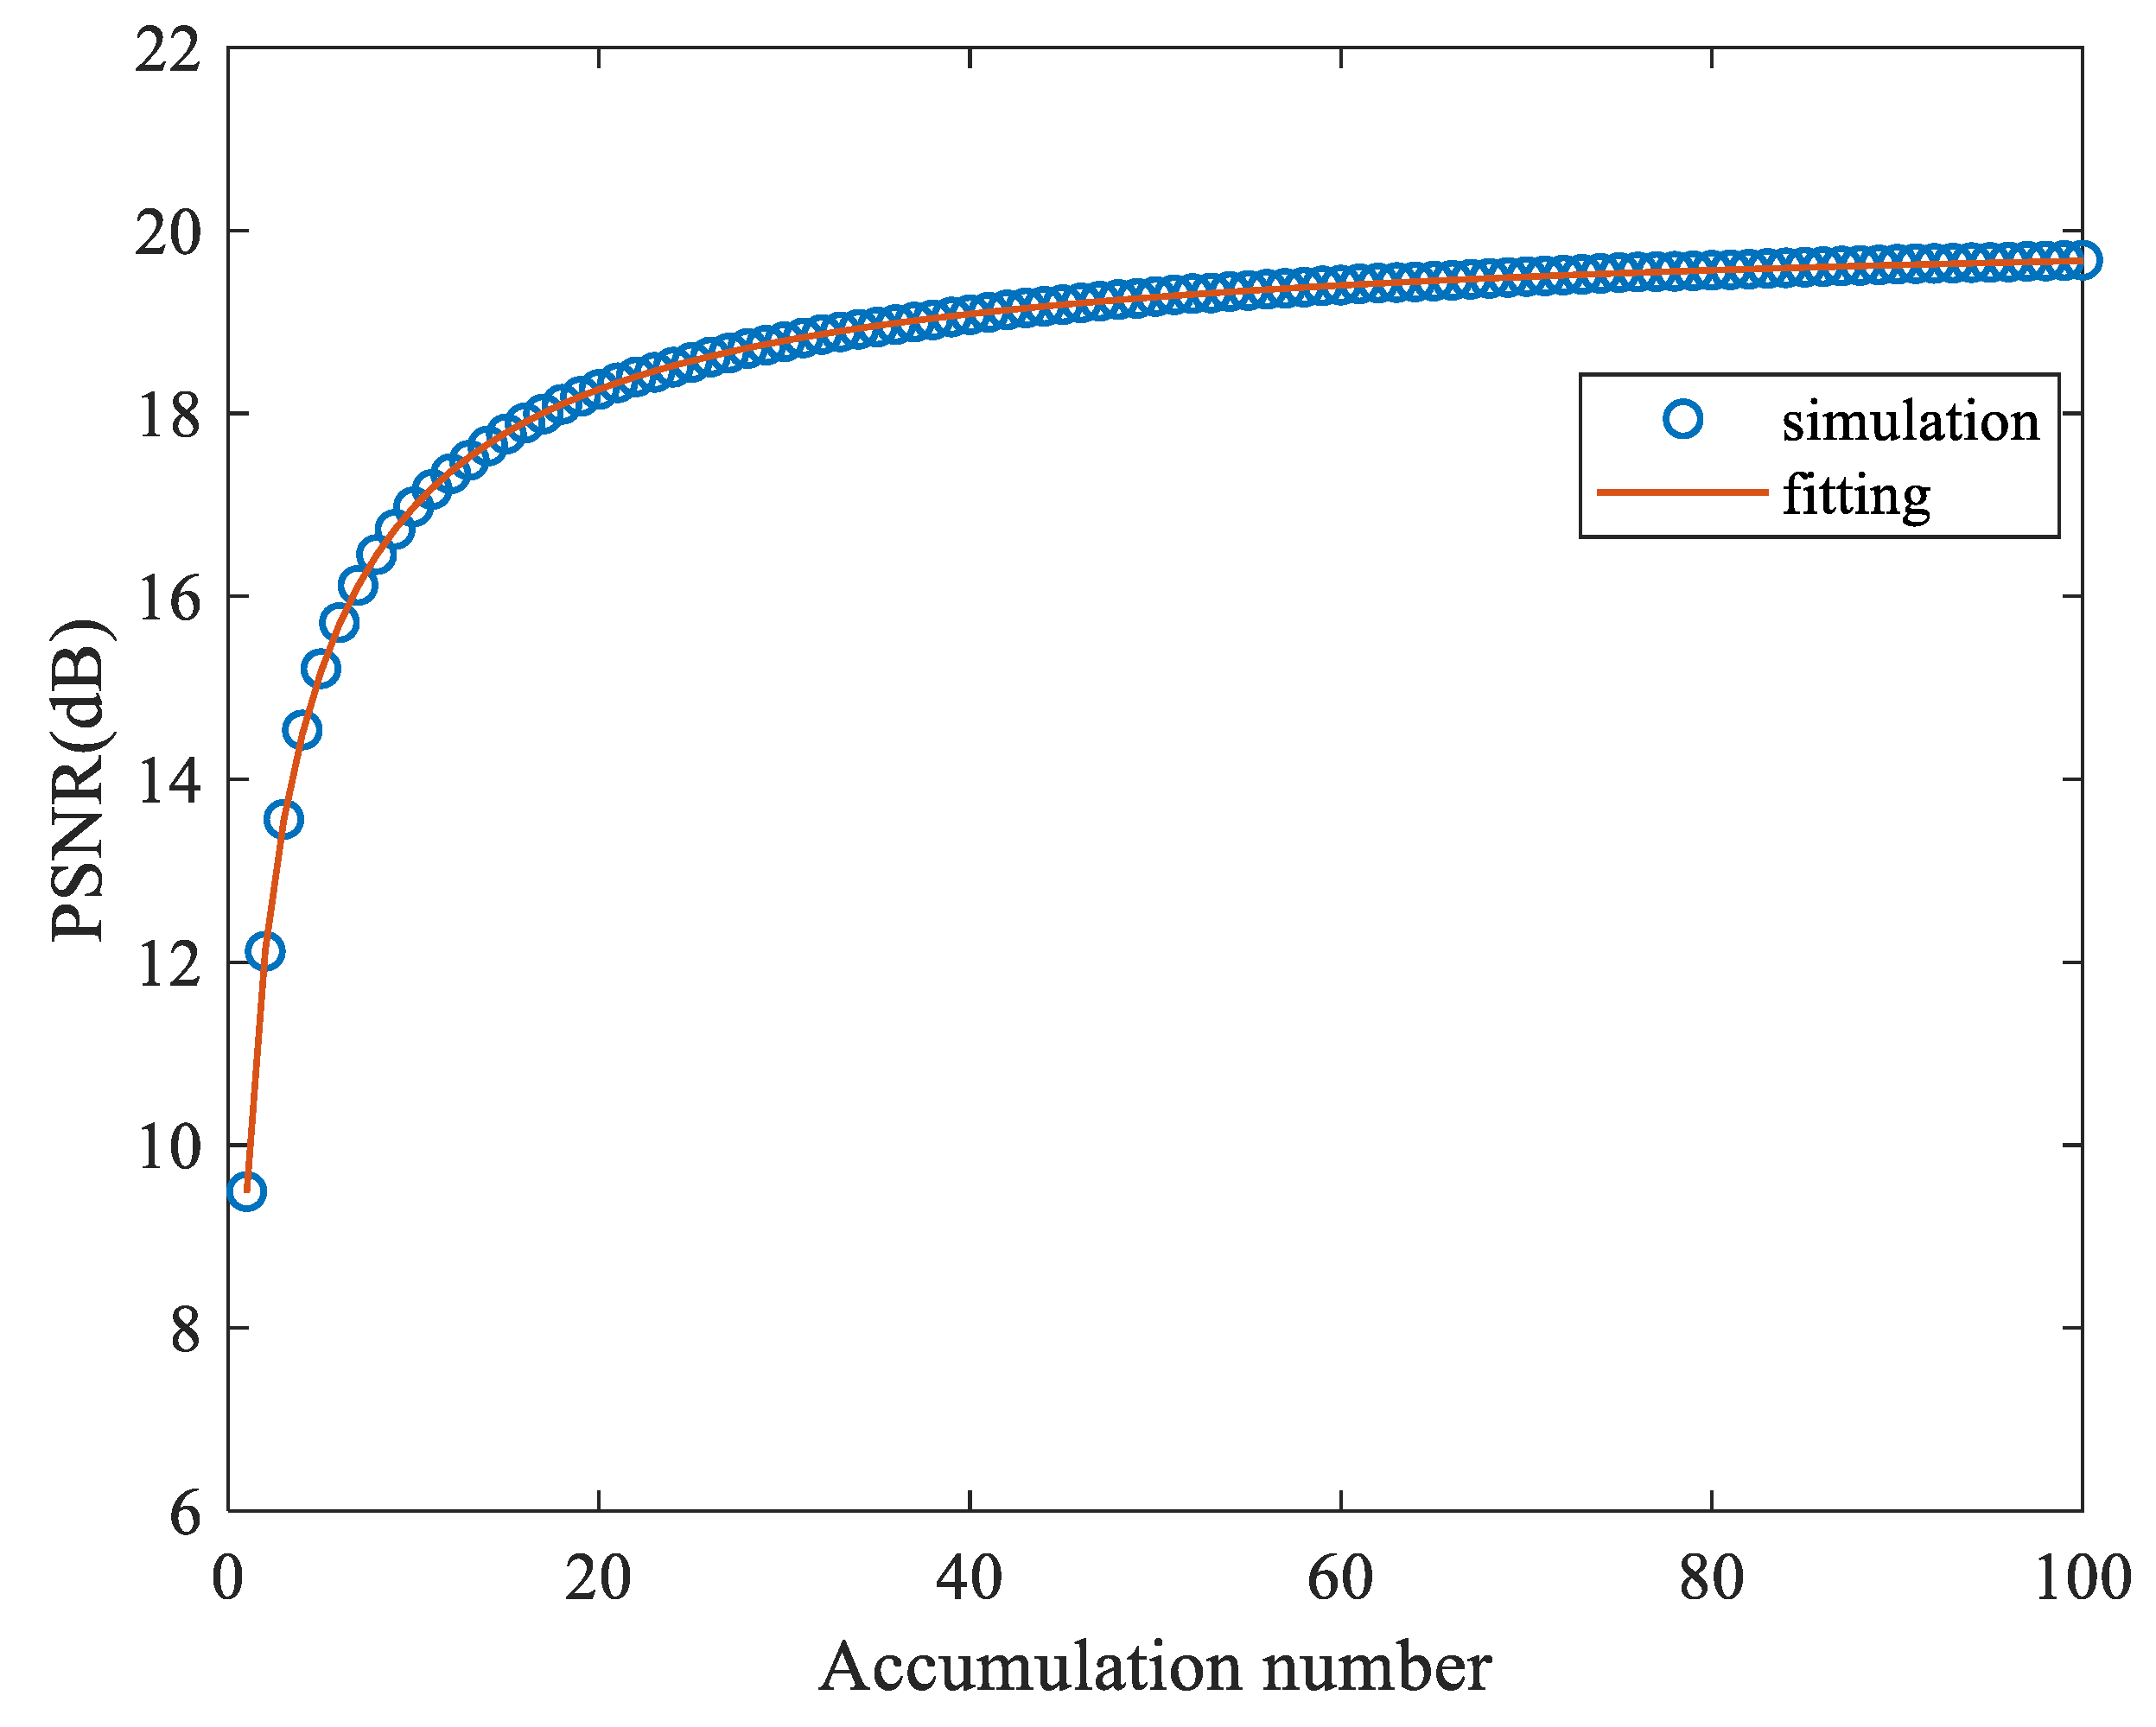
We performed simulations to confirm the noise model. The simulation specifications are as follows. The wavelength and the pixel pitch are and , respectively. The computing workspace is pixels, while both the object size and the hologram size are pixels. The object distance is . First, we used the RP method to generate 100 binary CGHs and calculated the PSNR of the reconstructed image with different accumulation numbers. The ground truth image (object) applied in the simulation is shown in Figure 2a. Figure 2b shows a typical reconstructed image, which is from the intensity accumulation of images reconstructed by 100 RP binary CGHs. The resolution of the reconstructed image is apparently less than the ground truth image because of the natural lowpass filtering of the limited size of the hologram (Figure 1). The PSNR of the reconstructed image is calculated in the region of interest (the same size as the object) at every number of intensity accumulation. As we obtain the PSNR curve from simulations, we can fit the simulation curve using Equations (8) and (9) to find the values of and . Both the PSNR from simulations (in circle) and the fitting PSNRC (in solid line) are shown in Figure 3. Apparently, the proposed noise formula matches the simulation very well. In this case, the values of the parameters are found to be 2.04 and 17.36, respectively. The values can be also regarded as a reference of comparison. The same procedures for MIFA CGHs (five iterations and ten iterations), the LRDS CGHS, and the LRDS+AIA CGHs were repeated. The PSNR data, together with the fitting curves, are shown in Figure 4, Figure 5, Figure 6 and Figure 7, respectively. The model fit well most types of CGHs, except for the AIA method. These simulation results are discussed in the next section.
4. Discussions
The important parameters obtained from the empirical formula are listed in Table 1. In particular, we consider the PSNR at different propagations (P) or different numbers of intensity accumulation (N). The concern of different propagations is for the evaluation of the computing-capacity-limited case, in which the binary CGHs must be generated using a limited computing power (e.g., the real-time display). The concern of different numbers of intensity accumulation is for the evaluation of the frame-rate-limited case, in which the frame rate is limited but the computing power is not a constraint (i.e., non-real-time applications). From Equations (8) and (9) and for , we can also define a maximum achievable PSNR as . In other words, the image quality cannot be infinitely improved via intensity accumulation. This is very different from previous studies [19,20,27], in which the noise was assumed to be proportional to and thus the quality could be continuously improved.
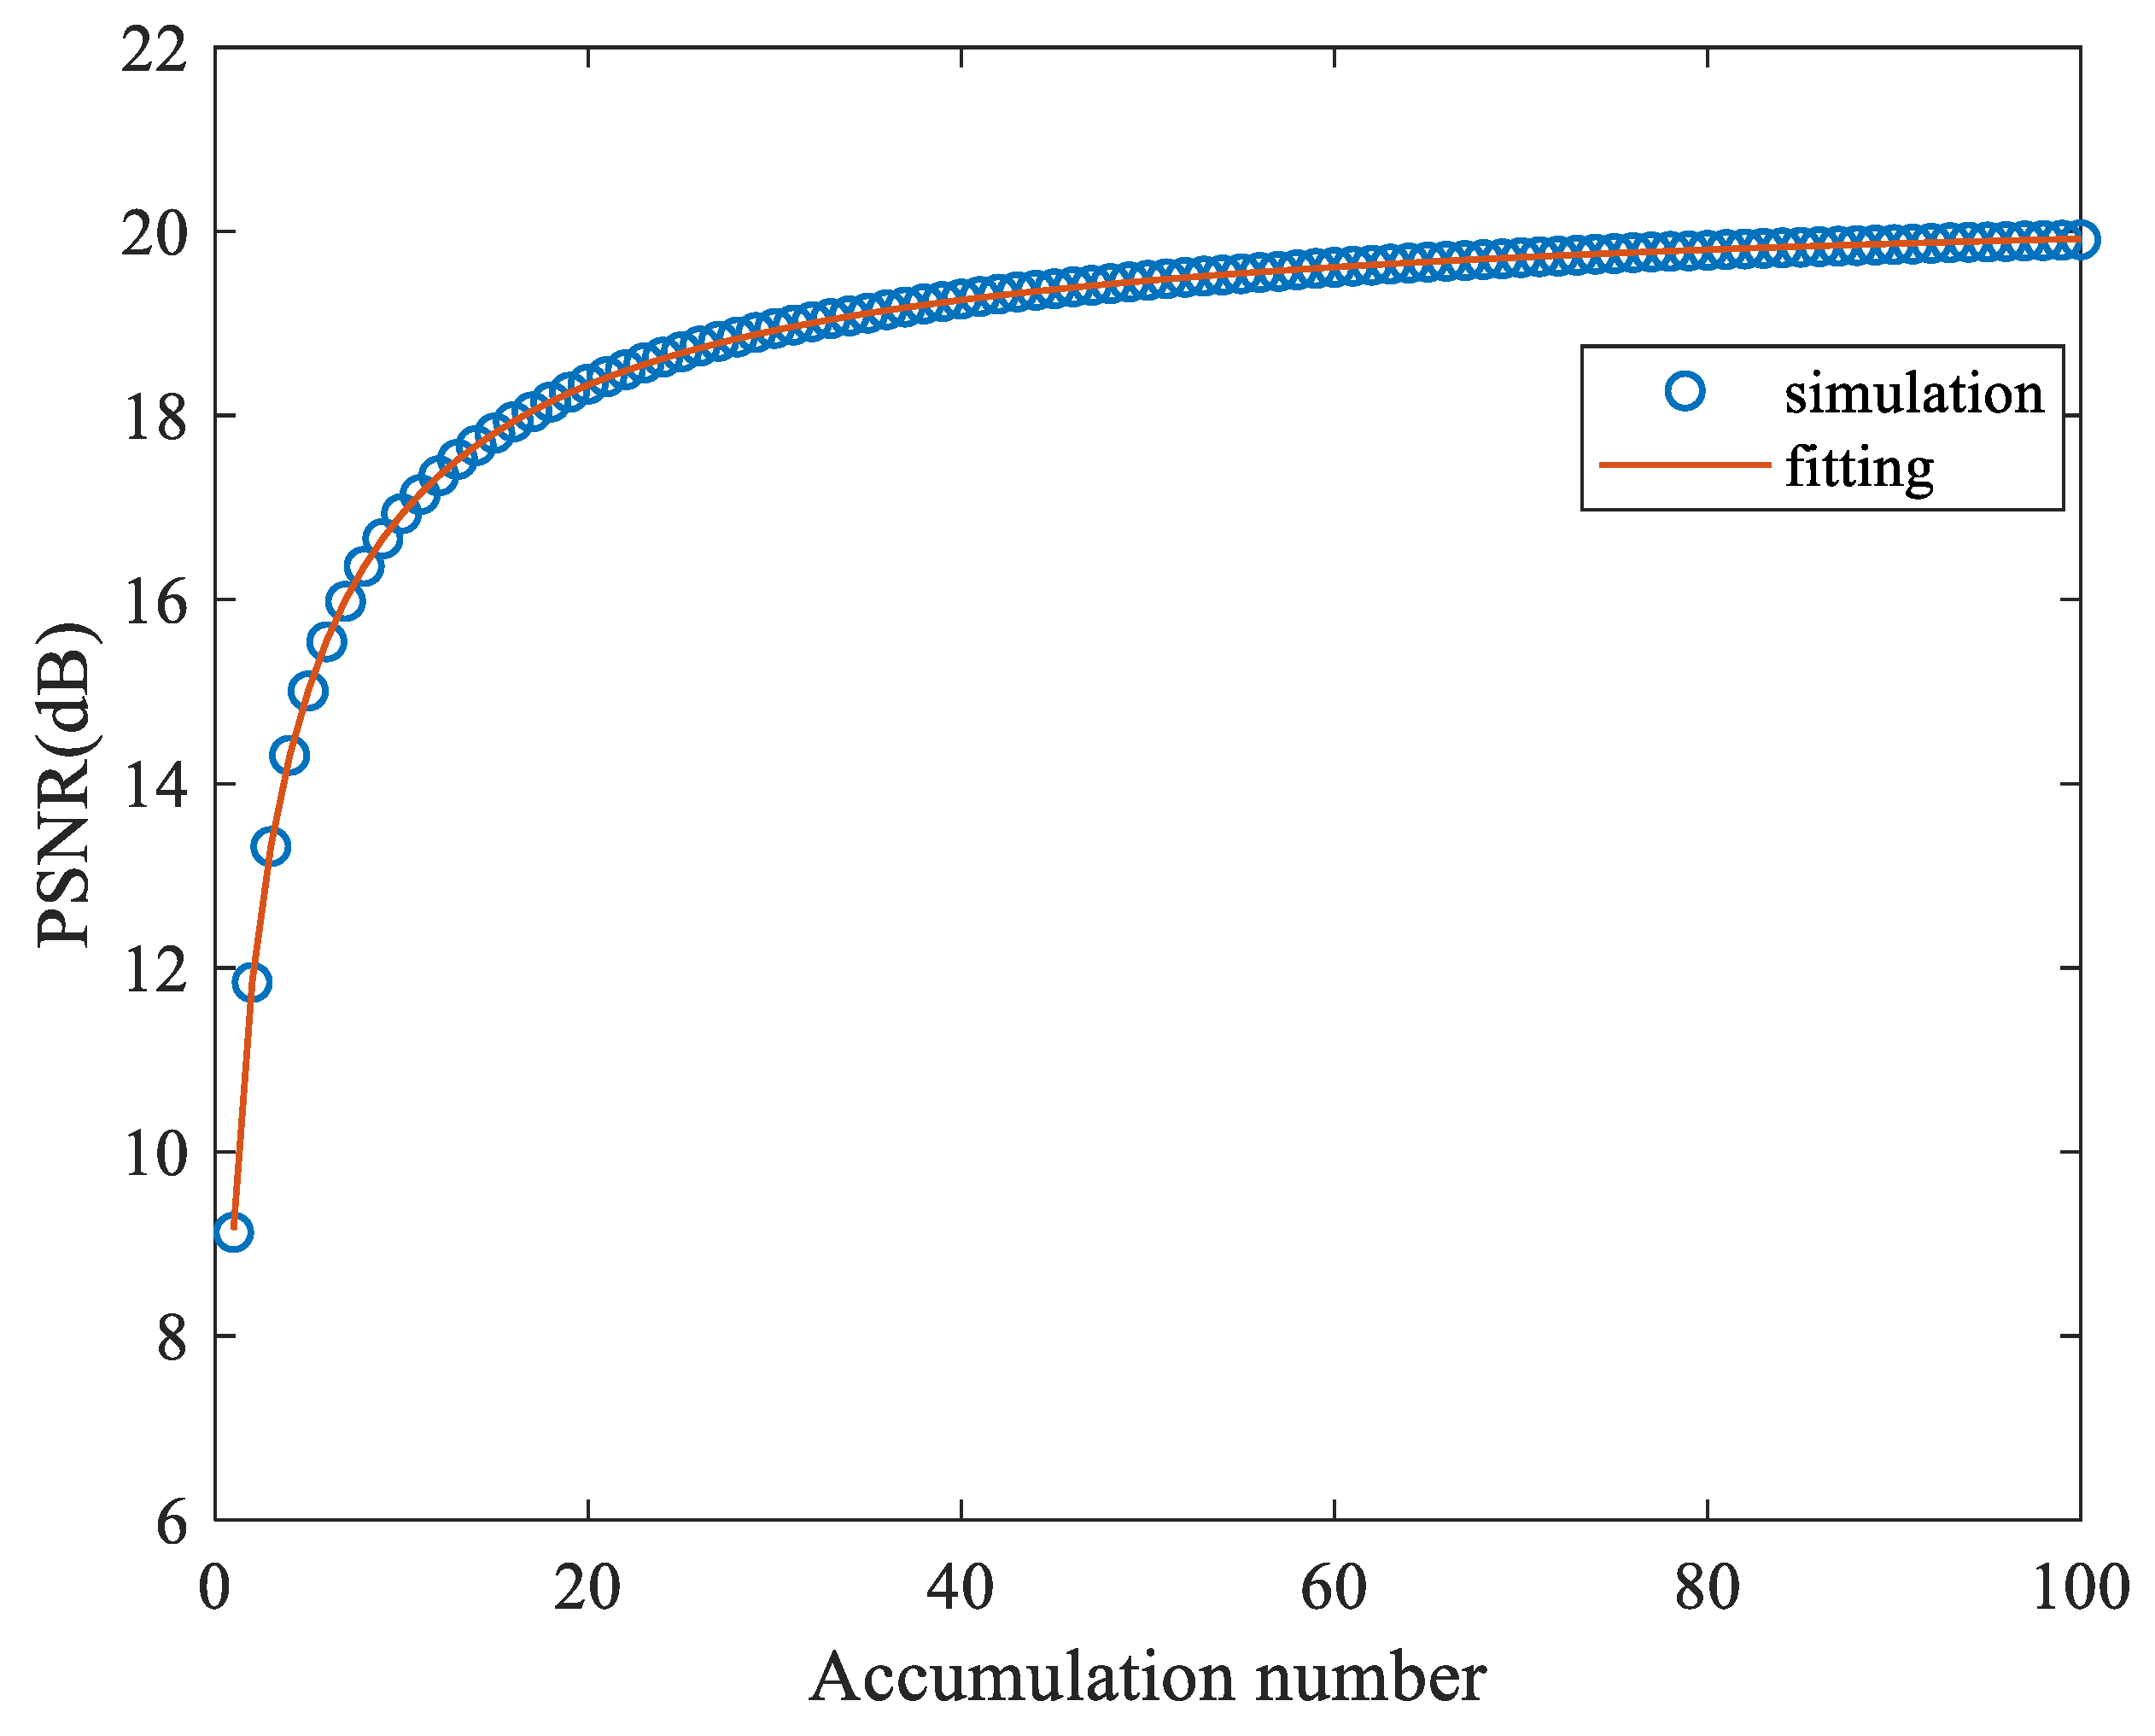
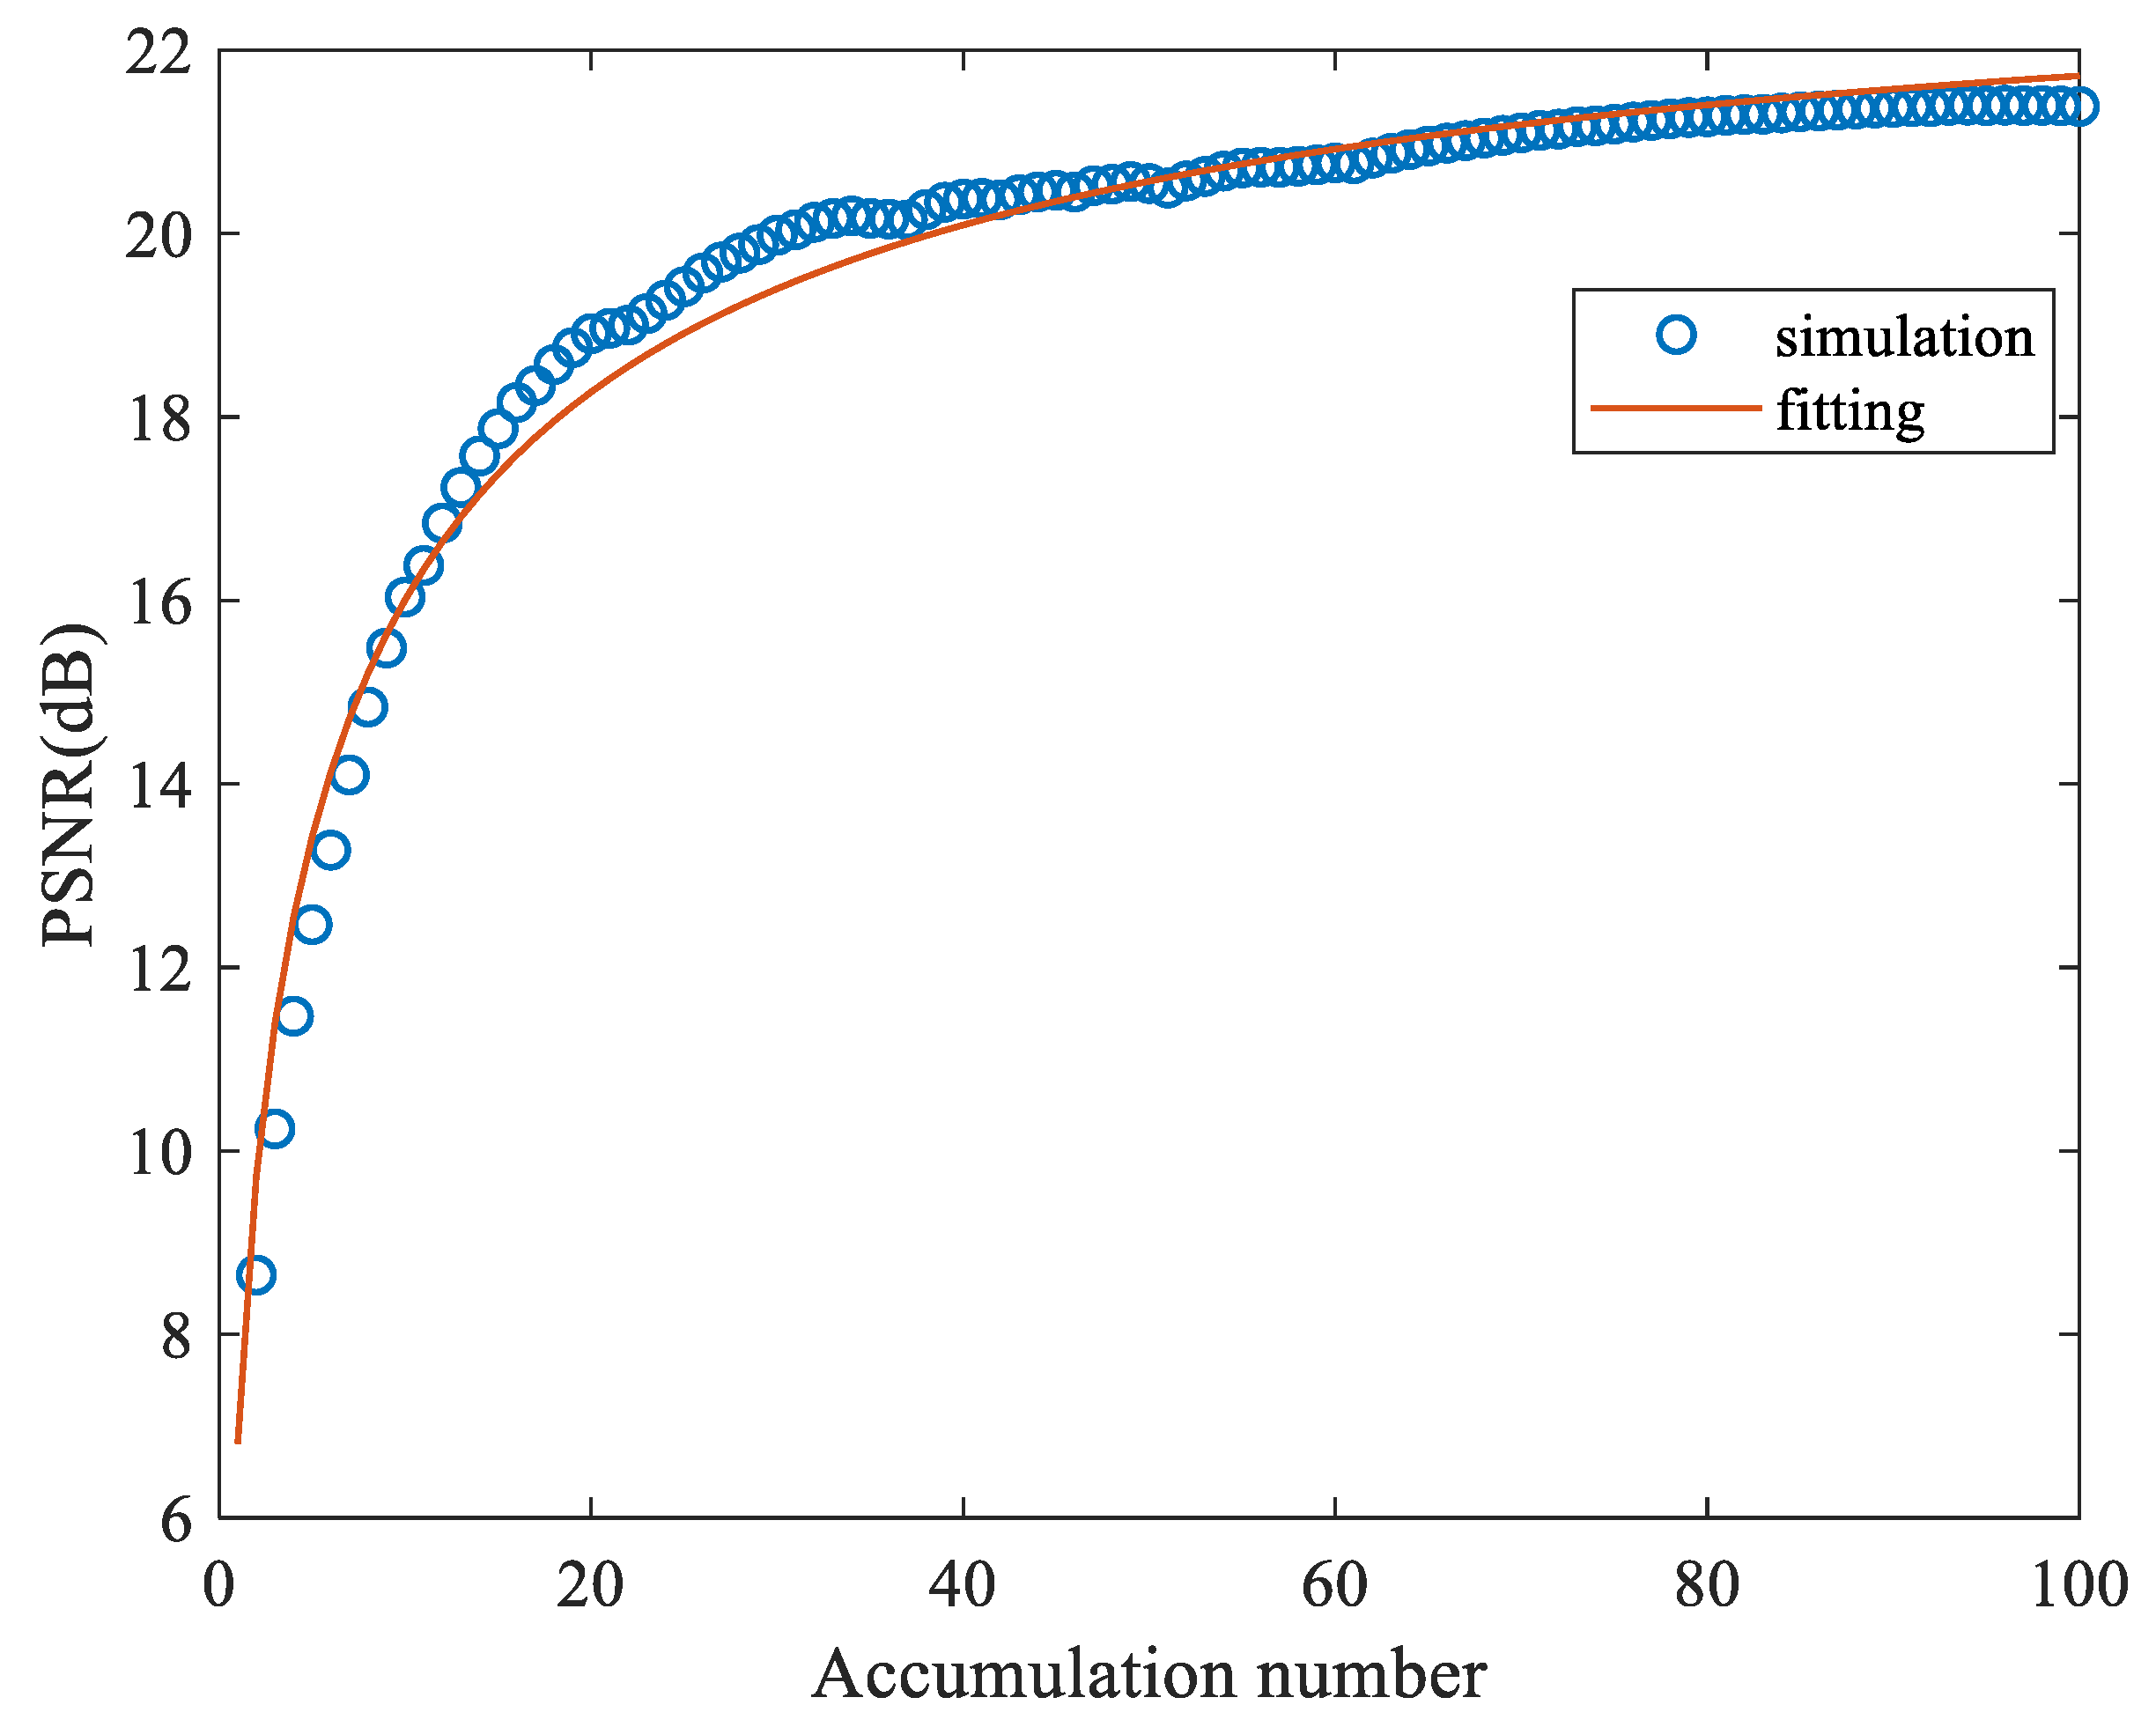
For the MIFA method (Figure 4), the value raises to above 3, but decreases, in comparison with the RP method. For MIFA with 10 iterations (Figure 5), the value increases further than that of MIFA, with five iterations. It is postulated that a greater iteration number can increase the maximum achievable PSNR. On the contrary, the maximum achievable PSNR decreases slightly in the case of more iterations. This counterintuitive result can be explained by the fact that the iteration in producing one hologram is a procedure of signal enhancement. Meanwhile, the same procedure also increases the correlation between different holograms, which effectively reduces the value of in the average process. The significantly reduced also results in another problem. The efficiency (PSNR at 100 propagations) of intensity accumulation by MIFA CGHs is the worst among all discussed methods. Accordingly, MIFA is not recommended for the intensity accumulation, provided the computing cost is the main concern. The characteristics of LRDS CGH (Figure 6) are almost the same as those of RP CGH. This implies that the randomness generated by random phase and by random down-sampling can be regarded to be identical in practice. Therefore, for a pointwise CGH algorithm (e.g., [28]), the use of random down-sampling can significantly reduce the computing load without degrading the display quality. The fitting model is not applicable for the LRDS+AIA method (Figure 7). The reason is that AIA is an adaptive method to improve the quality of reconstruction globally. Therefore, the statistical randomness of each binary hologram has been broken in this method. According to the above discussion and Table 1, we can conclude that the RP method and the LRDS method are better for the computing-capacity-limited case, while MIFA method can provide a better PSNR for the frame-rate-limited case. The LRDS + AIA method always exhibits the best PSNR, except for the case of a small number of propagations ().
Finally, we will consider the design strategy of intensity accumulation. Since there is a maximum achievable PSNR, the display by using many numbers of intensity accumulation is a waste of computing power. Our goal is to find a reasonable number of intensity accumulation to achieve a PSNR only slightly lower than the maximum achievable PSNR. The difference between the maximum achievable PSNR and PSNR at a specific number is calculated as
It is noted that is independent of . From Equation (10) and for a given and , we find
The needed accumulation numbers for different ’s and ’s were calculated and are listed in Table 2. Normally, we can set to achieve a balance between quality and computing cost.
5. Conclusions
In this paper, we have proposed a model to estimate the dependence of PSNR on the number of intensity accumulation by binary CGHs. The model is confirmed to fit the properties of binary CGHs generated by the random phase (RP) method, the modified iterative Fresnel algorithm (MIFA), and the localized random down-sampling (LRDS) method. In summary, MIFA can achieve good quality but is worse in its computing efficiency. The randomness characteristic of RP CGHs and LRDS CGHs is almost the same. Therefore, for a pointwise CGH algorithm, the LRDS method is a better object processing method because the computing load can be significantly reduced without degrading the display quality. For any method, there is a maximum achievable PSNR for the reconstructed image, and thus the number of accumulations must be accurately determined in order to avoid the waste of computing power. In this paper, we only considered the speckle due to wave truncation and quantization. In practice, the speckle due to scattered light from optical elements cannot be suppressed by intensity accumulation, and thus the image quality is usually worse than the simulation. On the other hand, the coherence of light source is another important factor of image quality. If a low-coherence source is applied, the speckle can be better suppressed. This aspect has not been considered in the present paper, and it is worthy of further study.
Author Contributions
Conceptualization, J.-P.L. and Y.-C.L.; methodology, J.-P.L., Y.-C.L. and S.J.; writing—original draft preparation, J.-P.L. and T.-C.P.; writing—review and editing, T.-C.P. All authors have read and agreed to the published version of the manuscript.
Funding
This research was funded by the Ministry of Science and Technology of Taiwan (109-2221-E-035-076-MY3), (109-2813-C-035-039-E).
Institutional Review Board Statement
Not applicable.
Informed Consent Statement
Not applicable.
Data Availability Statement
Not applicable.
Conflicts of Interest
The authors declare no conflict of interest.
References
- Poon, T.-C. (Ed.) Digital Holography and Three-Dimensional Display; Springer: Berlin, Germany, 2006. [Google Scholar]
- Takaki, Y.; Yokouchi, M.; Okada, N. Improvement of grayscale representation of the horizontally scanning holographic display. Opt. Express 2010, 18, 24926–24936. [Google Scholar] [CrossRef]
- Takaki, Y.; Yokouchi, M. Speckle-free and grayscale hologram reconstruction using time-multiplexing technique. Opt. Express 2011, 19, 7567–7579. [Google Scholar] [CrossRef]
- Sando, Y.; Barada, D.; Yatagai, T. Full-color holographic 3D display with horizontal full viewing zone by spatiotemporal-division multiplexing. Appl. Opt. 2018, 57, 7622–7626. [Google Scholar] [CrossRef] [PubMed]
- Fujiwara, M.; Takada, N.; Araki, H.; Ikawa, S.; Maeda, Y.; Niwase, H.; Oikawa, M.; Kakue, T.; Shimobaba, T.; Ito, T. Color representation method using RGB color binary-weighted computer-generated holograms. Chin. Opt. Lett. 2018, 16, 080901. [Google Scholar] [CrossRef]
- Takahashi, T.; Shimobaba, T.; Kakue, T.; Ito, T. Time-division color holographic projection in large size using a digital micromirror device. Appl. Sci. 2021, 11, 6277. [Google Scholar] [CrossRef]
- Liu, J.-P.; Yu, C.-Q.; Tsang, P.W.M. Enhanced direct binary search algorithm for binary computer-generated Fresnel holograms. Appl. Opt. 2019, 58, 3735–3741. [Google Scholar] [CrossRef] [PubMed]
- Jennison, B.K.; Allebach, J.P.; Sweeney, D.W. Efficient design of direct-binary-search computer-generated holograms. J. Opt. Soc. Am. A 1991, 8, 652–660. [Google Scholar] [CrossRef]
- Seldowitz, M.A.; Allebach, J.P.; Sweeney, D.W. Synthesis of digital holograms by direct binary search. Appl. Opt. 1987, 26, 2788–2798. [Google Scholar] [CrossRef]
- Yoshikawa, N.; Yatagai, T. Phase optimization of a kinoform by simulated annealing. Appl. Opt. 1994, 33, 863–868. [Google Scholar] [CrossRef]
- Yang, G.; Jiao, S.; Liu, J.-P.; Lei, T.; Yuan, X. Error diffusion method with optimized weighting coefficients for binary hologram generation. Appl. Opt. 2019, 58, 5547–5555. [Google Scholar] [CrossRef]
- Cheremkhin, P.A.; Kurbatova, E.A.; Evtikhiev, N.N.; Krasnov, V.V.; Rodin, V.G.; Starikov, R.S. Comparative analysis of off-axis digital hologram binarization by error diffusion. J. Opt. 2021, 23, 075703. [Google Scholar] [CrossRef]
- Min, K.; Park, J.-H. Quality enhancement of binary-encoded amplitude holograms by using error diffusion. Opt. Express 2020, 28, 38140–38154. [Google Scholar] [CrossRef]
- Jiao, S.; Zhang, D.; Zhang, C.; Gao, Y.; Lei, T.; Yuan, X. Complex-amplitude holographic projection with a digital micromirror device (DMD) and error diffusion algorithm. IEEE J. Sel. Top. Quant. Electron. 2020, 26, 1–8. [Google Scholar] [CrossRef]
- Chlipala, M.; Kozacki, T. Color LED DMD holographic display with high resolution across large depth. Opt. Lett. 2019, 44, 4255–4258. [Google Scholar] [CrossRef] [PubMed]
- Goorden, S.A.; Bertolotti, J.; Mosk, A.P. Superpixel-based spatial amplitude and phase modulation using a digital micromirror device. Opt. Express 2014, 22, 17999–18009. [Google Scholar] [CrossRef] [PubMed] [Green Version]
- Masuda, K.; Saita, Y.; Toritani, R.; Xia, P.; Nitta, K.; Matoba, O. Improvement of image quality of 3D display by using optimized binary phase modulation and intensity accumulation. J. Display Technol. 2016, 12, 472–477. [Google Scholar] [CrossRef]
- Liu, J.-P.; Wu, M.-H.; Tsang, P.W.M. 3D display by binary computer-generated holograms with localized random down-sampling and adaptive intensity accumulation. Opt. Express 2020, 28, 24526–24537. [Google Scholar] [CrossRef] [PubMed]
- Liu, S.-J.; Wang, D.; Li, S.-J.; Wang, Q.-H. Speckle noise suppression method in holographic display using time multiplexing. Opt. Eng. 2017, 56, 063107. [Google Scholar] [CrossRef]
- Lee, B.; Yoo, D.; Jeong, J.; Lee, S.; Lee, D.; Lee, B. Wide-angle speckleless DMD holographic display using structured illumination with temporal multiplexing. Opt. Lett. 2020, 45, 2148–2151. [Google Scholar] [CrossRef] [PubMed]
- Liu, J.-P. Controlling the aliasing by zero-padding in the digital calculation of the scalar diffraction. J. Opt. Soc. Am. A 2012, 29, 1956–1964. [Google Scholar] [CrossRef]
- Tsang, P.; Poon, T.-C.; Cheung, W.K.; Liu, J.-P. Computer generation of binary fresnel holography. Appl. Opt. 2011, 50, B88–B95. [Google Scholar] [CrossRef] [PubMed] [Green Version]
- Wyrowski, F.; BryngdahI, O. Iterative fourier-transform algorithm applied to computer holography. J. Opt. Soc. Am. A 1988, 5, 1058–1965. [Google Scholar] [CrossRef]
- Wu, C.-H.; Chen, C.-L.; Fiddy, M.A. Iterative procedure for improved computer-generated-hologram reconstruction. Appl. Opt. 1993, 32, 5135–5140. [Google Scholar] [CrossRef] [PubMed]
- Goodman, J.W. Speckle Phenomena in Optics: Theory and Applications; Viva Books: New Delhi, India, 2008. [Google Scholar]
- Tran, T.-K.-T.; Chen, X.; Svensen, Ø.; Akram, M.N. Speckle reduction in laser projection using a dynamic deformable mirror. Opt. Express 2014, 22, 11152–11166. [Google Scholar] [CrossRef] [PubMed] [Green Version]
- Pandey, N.; Hennelly, B. Quantization noise and its reduction in lensless fourier digital holography. Appl. Opt. 2011, 50, B58–B70. [Google Scholar] [CrossRef] [PubMed]
- Liu, J.-P.; Lu, S.-L. Fast calculation of high-definition depth-added computer-generated holographic stereogram by spectrum-domain look-up table [Invited]. Appl. Opt. 2021, 60, A104–A110. [Google Scholar] [CrossRef] [PubMed]
Figure 1.
Setup of CGH calculation.

Figure 2.
The ground truth image (a) and the reconstructed image (b) by 100 intensity accumulation of reconstructed images of RP binary CGHS. The PSNR of (b) is 17.86 dB.
Figure 2.
The ground truth image (a) and the reconstructed image (b) by 100 intensity accumulation of reconstructed images of RP binary CGHS. The PSNR of (b) is 17.86 dB.

Figure 3.
PSNR of the reconstructed image by RP binary CGHs as a function of accumulation number. The values of the parameters of the fitting curve are (2.04, 17.36).
Figure 3.
PSNR of the reconstructed image by RP binary CGHs as a function of accumulation number. The values of the parameters of the fitting curve are (2.04, 17.36).

Figure 4.
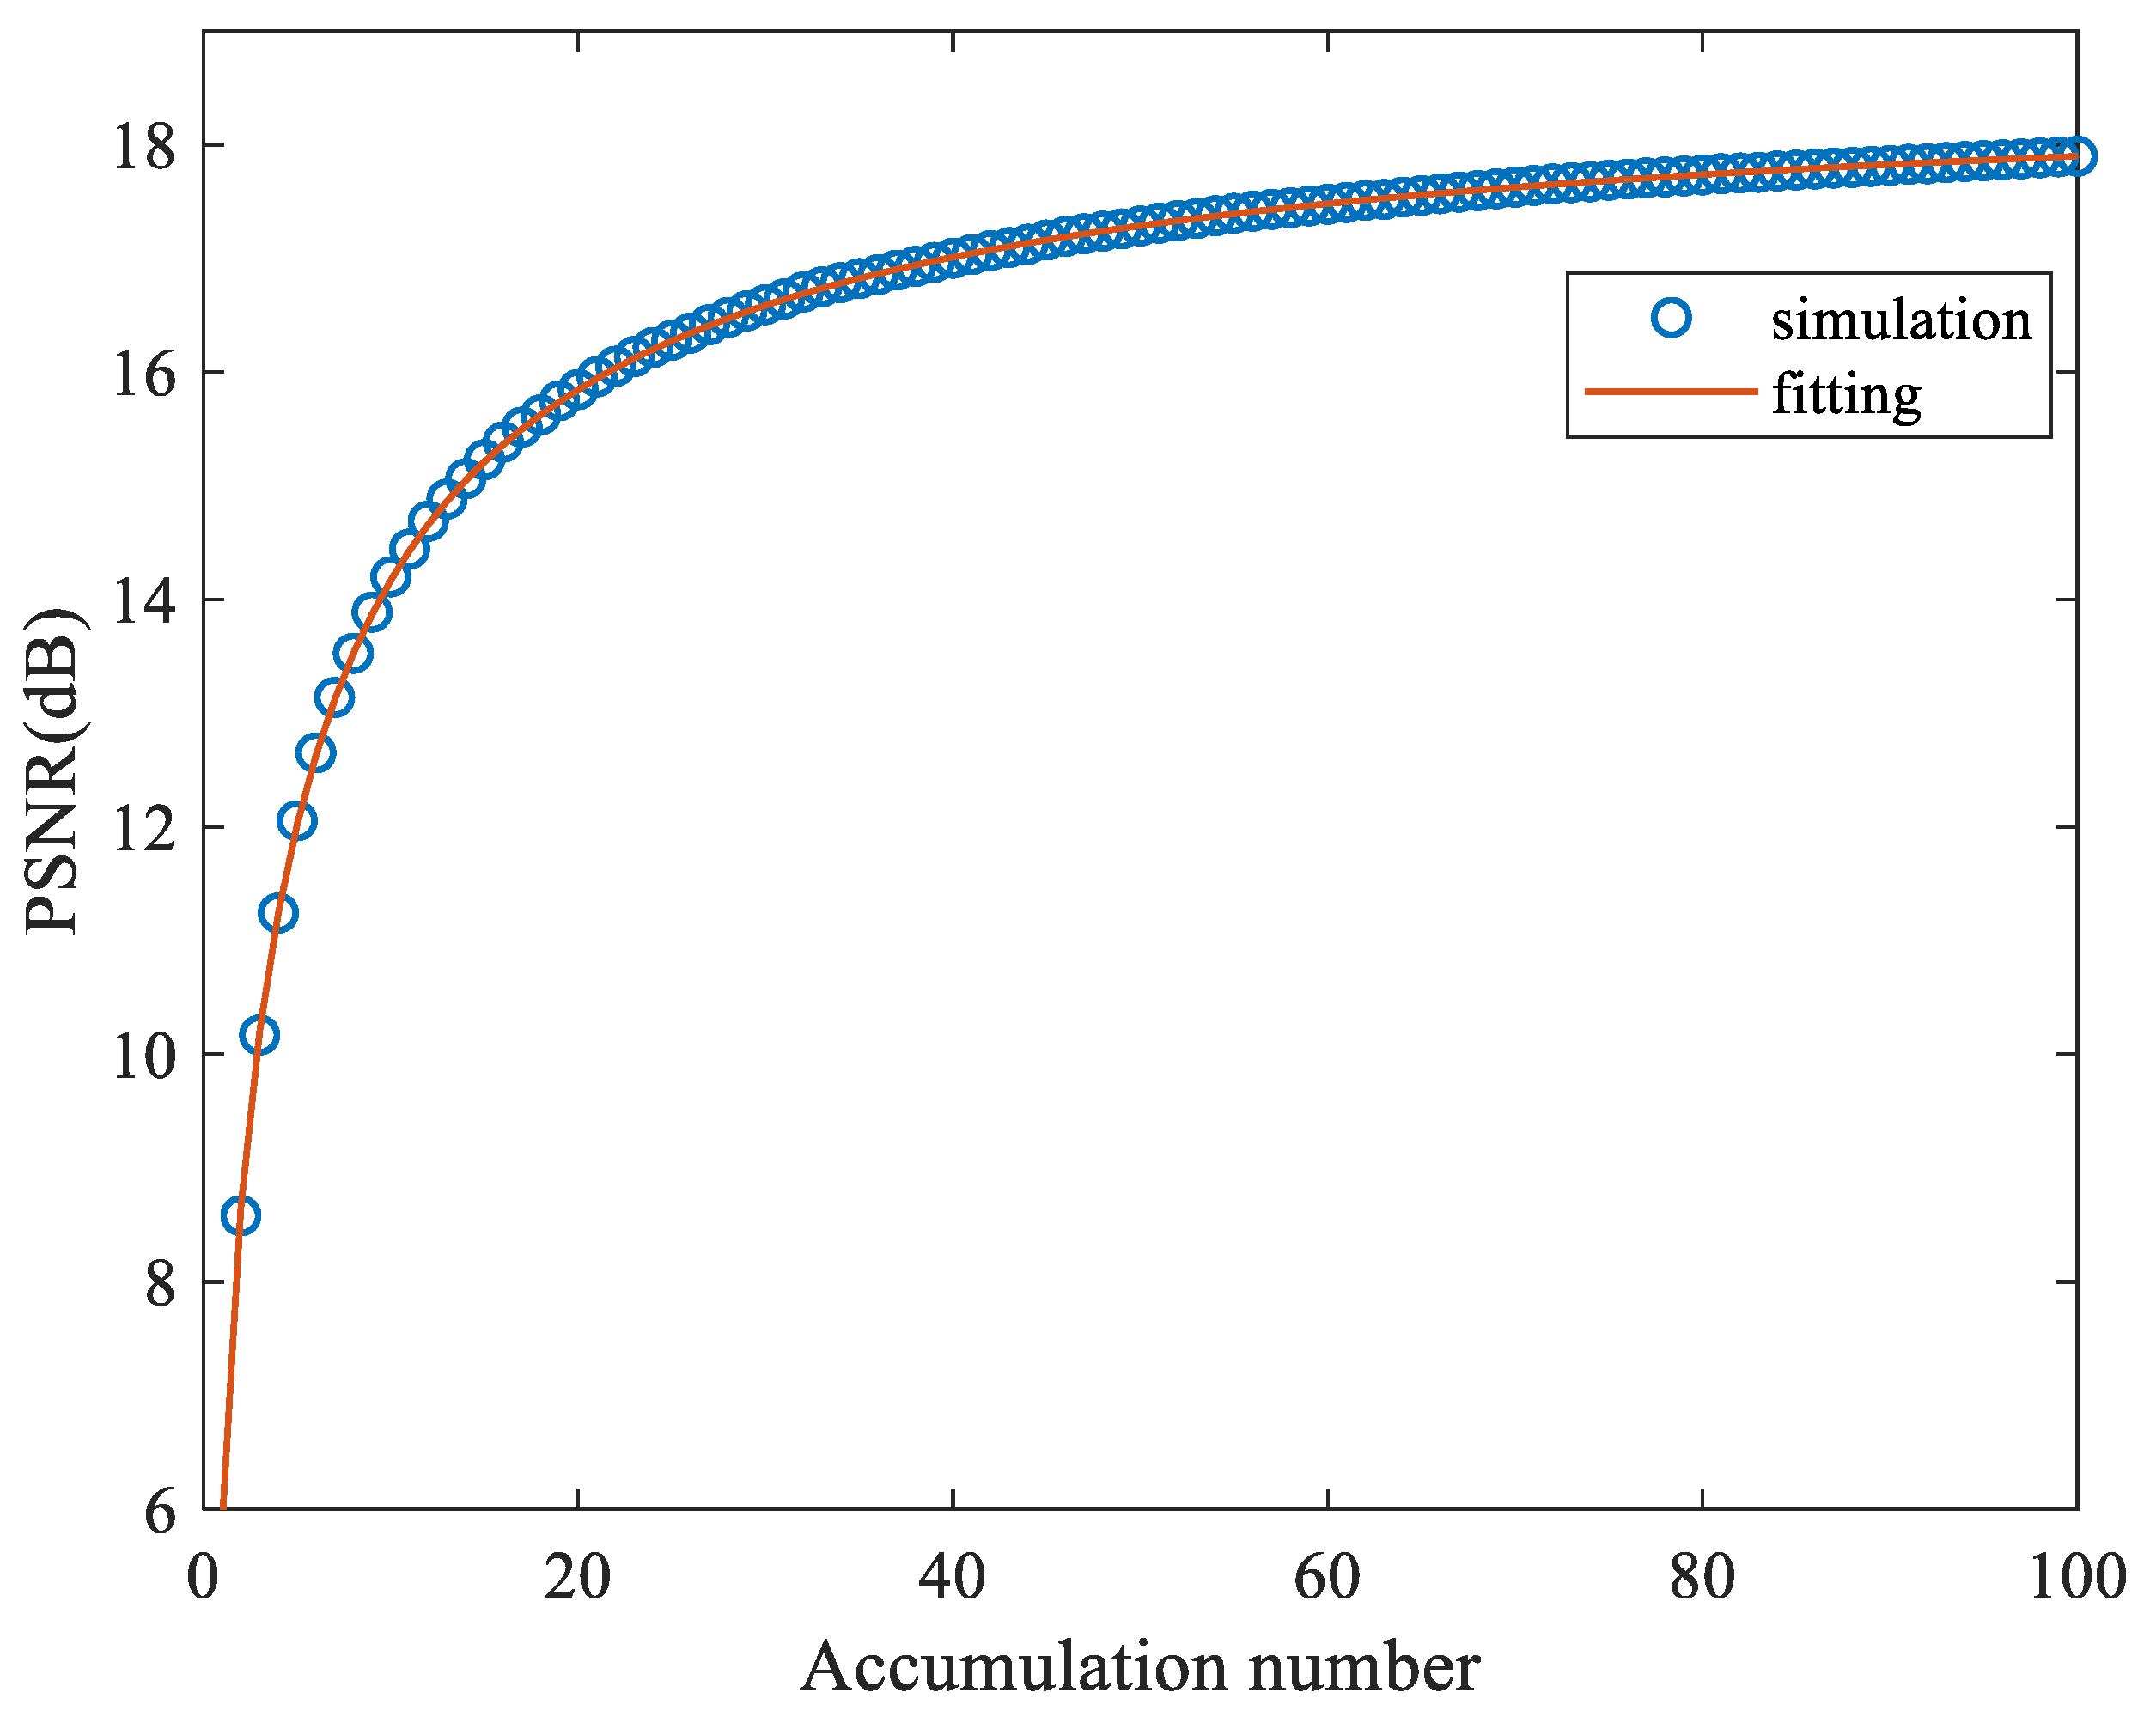
PSNR of the reconstructed image by MIFA binary CGHs (iteration number is 5) as a function of accumulation number. The values of the parameters of the fitting curve are (3.11, 11.40).
Figure 4.
PSNR of the reconstructed image by MIFA binary CGHs (iteration number is 5) as a function of accumulation number. The values of the parameters of the fitting curve are (3.11, 11.40).

Figure 5.
PSNR of the reconstructed image by MIFA binary CGHs (iteration number is 10) as a function of accumulation number. The values of the parameters of the fitting curve are (3.27, 9.55).
Figure 5.
PSNR of the reconstructed image by MIFA binary CGHs (iteration number is 10) as a function of accumulation number. The values of the parameters of the fitting curve are (3.27, 9.55).

Figure 6.
PSNR of the reconstructed image by LRDS binary CGHs () as a function of accumulation number. The values of parameters of the fitting curve are (2.08, 12.79).
Figure 6.
PSNR of the reconstructed image by LRDS binary CGHs () as a function of accumulation number. The values of parameters of the fitting curve are (2.08, 12.79).

Figure 7.
PSNR of the reconstructed image by LRDS binary CGHs () together with AIA as a function of accumulation number. The values of the parameters of the fitting curve are (2.24, 42.4).
Figure 7.
PSNR of the reconstructed image by LRDS binary CGHs () together with AIA as a function of accumulation number. The values of the parameters of the fitting curve are (2.24, 42.4).


Table 1.
Comparison of different binary CGH methods.
| Method | PSNR (dB) at Propagations | PSNR (dB) at Accumulations | |||||
|---|---|---|---|---|---|---|---|
| RP | 2.04 | 17.36 | 14.04 | 17.86 | 14.04 | 17.86 | 18.59 |
| MIFA (5 iterations) | 3.11 | 11.4 | 9.13 1 | 16.93 2 | 16.93 | 19.91 | 20.42 |
| MIFA (10 iterations) | 3.27 | 9.55 | NA | 15.21 3 | 16.98 | 19.68 | 20.09 |
| LRDS () | 2.08 | 16.79 | 14.2 | 17.9 | 14.2 | 17.9 | 18.61 |
| LRDS+AIA () | 2.24 4 | 42.4 4 | 12.47 | 20.54 | 16.04 | 21.39 | 23.28 4 |
1 The PSNR at because each iteration needs two propagations. 2 The PSNR at . 3 The PSNR at . 4 The applied model is inapplicable, but the fitting result is still listed here for reference.
Table 2.
Number of intensity accumulation for different and .
| 10 | 154 | 92 | 63 | 43 | |
| 15 | 224 | 132 | 92 | 62 | |
| 20 | 294 | 173 | 120 | 81 | |
| 25 | 364 | 213 | 149 | 101 | |
Publisher’s Note: MDPI stays neutral with regard to jurisdictional claims in published maps and institutional affiliations. |
© 2021 by the authors. Licensee MDPI, Basel, Switzerland. This article is an open access article distributed under the terms and conditions of the Creative Commons Attribution (CC BY) license (https://creativecommons.org/licenses/by/4.0/).
Share and Cite
MDPI and ACS Style
Liu, J.-P.; Lin, Y.-C.; Jiao, S.; Poon, T.-C. Performance Estimation of Intensity Accumulation Display by Computer-Generated Holograms. Appl. Sci. 2021, 11, 7729. https://0-doi-org.brum.beds.ac.uk/10.3390/app11167729
AMA Style
Liu J-P, Lin Y-C, Jiao S, Poon T-C. Performance Estimation of Intensity Accumulation Display by Computer-Generated Holograms. Applied Sciences. 2021; 11(16):7729. https://0-doi-org.brum.beds.ac.uk/10.3390/app11167729
Chicago/Turabian StyleLiu, Jung-Ping, Yu-Chih Lin, Shuming Jiao, and Ting-Chung Poon. 2021. "Performance Estimation of Intensity Accumulation Display by Computer-Generated Holograms" Applied Sciences 11, no. 16: 7729. https://0-doi-org.brum.beds.ac.uk/10.3390/app11167729
Note that from the first issue of 2016, this journal uses article numbers instead of page numbers. See further details here.