Article

Phosphate Coatings: EIS and SEM Applied to Evaluate the Corrosion Behavior of Steel in Fire Extinguishing Solution

by
Diana-Petronela Burduhos-Nergis
1,
Gabriel Dragos Vasilescu
2,
Dumitru-Doru Burduhos-Nergis
1,
Ramona Cimpoesu
1,* and
Costica Bejinariu
1,*
1
Faculty of Materials Science and Engineering, “Gheorghe Asachi” Technical University, 700050 Iasi, Romania
2
National Institute for Research and Development in Mine Safety and Protection to Explosion—INSEMEX, 332047 Petrosani, Romania
*
Authors to whom correspondence should be addressed.
Submission received: 4 August 2021 / Revised: 21 August 2021 / Accepted: 23 August 2021 / Published: 25 August 2021

Abstract

:
Phosphate coatings are one of the most important methods in preventing metal corrosion, especially iron alloys. The high interest in this method for industrial applications is mainly due to the low costs associated with the phosphating solution component and technological process. Considering this aspect and the advantages offered to the materials (corrosion resistance, good adhesion, wear resistance), this study evaluates the potential of using the phosphate coating method in health and safety applications. Therefore, the deposition of a layer of zinc phosphate on the steel surface used in the manufacture of components for personal protective equipment was approached. Firefighters, during rescue/evacuation operations, use protective equipment for fall arrest, whose accessories (hooks, carabiners) are made of steel. Due to the low corrosion resistance property of carbon steel, these accessories must be replaced frequently. This paper aims to analyze the possibility of improving the corrosion resistance of carbon steel in a fire extinguishing solution. Accordingly, the electrochemical behavior of two different types of coatings was studied by electrochemical impedance spectroscopy (EIS) and scanning electron microscope (SEM). In the literature, different corrosion evaluating methods or systems have been considered, and up until now, there has been no previous study to have approached the corrosive behavior of C45, phosphate C45, and painted phosphate C45 immersed in fire extinguishing solution.

1. Introduction

The personal protective equipment against falls from heights is used by workers to prevent falling during their working activities [1]. Along with the harness or safety belt, the fall arrest system includes a series of components (rope, anchoring device, connectors), each one having a well-established function [2].
Connectors are components of the safety system that have the role of linking the other elements of the system or assuring the connection between the equipment and the anchoring point. Considering their shape and characteristics, there are two common types of connectors: the carabiners and the hooks [3,4]. Depending on the field in which the personal fall protection equipment is used, the connectors are made of aluminum or steel [5]. Usually, steel connectors are used in areas where high mechanical properties are required such as construction engineering or firefighting operations while aluminum connectors are used when the weight of the fall arrest system is indicated to be small, for example, in mountaineering [6]. Although steel connectors have a higher mechanical strength than aluminum connectors, their biggest limitation is related to their low corrosion resistance [7].
According to the literature [8,9], one of the risks that cause injury or death to people who work at height is the failure of the personal protective equipment. To avoid accidents related to connector failure, it has been established to immediately replace the carabiners or the hooks if it is suspected that their surface has corroded areas or inside cracks caused by collision or impacts with different objects. Therefore, up until now, various methods have been attempted to eliminate these disadvantages, either related to changing the design or the manufacturing material. However, each method has also resulted in a significant increase in the connector costs [10,11,12,13,14].
In the field of firefighting, in rescue/evacuation operations, firefighters use carbon steel connectors. Although the mechanical strength is satisfactory, the low corrosion resistance makes it necessary to change them often, resulting in a high cost–durability ratio, while any missed inspection of the safety equipment can have serious consequences [15]. Accordingly, to carry out their actions safely, they must rely on the equipment they use, therefore, a durability increase in carabiners can contribute to a safe work environment for firefighters.
This paper addresses the issue of the low corrosion resistance of carbon steel connectors and proposed to eliminate it by depositing a zinc-based phosphate layer. Moreover, to prevent the appearance of internal cracks due to mechanical shocks [16], considering the porosity of the phosphate layer that facilitates the adhesion of further coatings, a layer of elastomer-based paint was deposited on the surface.
The phosphating process is one of the most widely used methods to increase the corrosion resistance of metallic materials [17]. The components of phosphating solutions are cheap, and the workers who perform the operations do not require high qualification, therefore, low manufacturing costs are involved [18].
Based on previous publications [19,20], the corrosion resistance to atmospheric, Black Sea water, and pluvial water can be improved by phosphate coatings. However, in the case of firefighting operations, another media (i.e., fire extinguishing solution (FES) can significantly affect the behavior of the metallic components in their equipment. As reported in [21], FES is a highly corrosive environment, therefore, to consider these coatings suitable for the anticorrosive protection of carabiners used by firefighters, it is necessary to evaluate the corrosion behavior of materials over a longer immersion period. Given the importance of the corrosion resistance of connectors used in fall arrest systems, this article analyzes the corrosion behavior, depending on the immersion time in fire extinguishing solution, of three types of samples: base (carbon steel), carbon steel coated with zinc phosphate layer, and carbon steel coated with a zinc phosphate layer and elastomer-based paint layer.
In order to analyze the toughness and adhesion between the zinc–phosphate layer and the substrate, in a preliminary experiment [9,22], scratch and microindentation tests were performed to evaluate the coefficient of friction and microhardness. The tribological analyses exhibited a coefficient of friction of 0.59 a.u. (for C45 steel, the value was 0.24 a.u.) and an increase in the frictional force up to 3.8 N (for C45 steel, the value was 1.5 N). Moreover, the graph exhibited a significant change in the slope at a load of 6.5 N, which was attributed to the phosphate layer penetration. When the microhardness values were compared, we observed a similar behavior between the control sample (C45 steel) and the coated sample. Accordingly, the hardness of the zinc–phosphate sample was 13.12 GPa with a modulus of elasticity of 388.95 GPa. Therefore, by coating the C45 steel with a phosphate layer, a tough, adherent layer with higher coefficient of friction could be obtained.

2. Materials and Methods

2.1. Materials

The base material used in this study is a common carbon steel from which the connectors, used by firefighters in rescue/evacuation operations during firefighting, are manufactured. Its chemical composition is 0.45%.wt. carbon, 0.98%.wt. manganese, 0.22%.wt. silicon, 0.17%.wt. chromium, 0.15%.wt. copper, 0.02%.wt. phosphorus, and iron (balance).

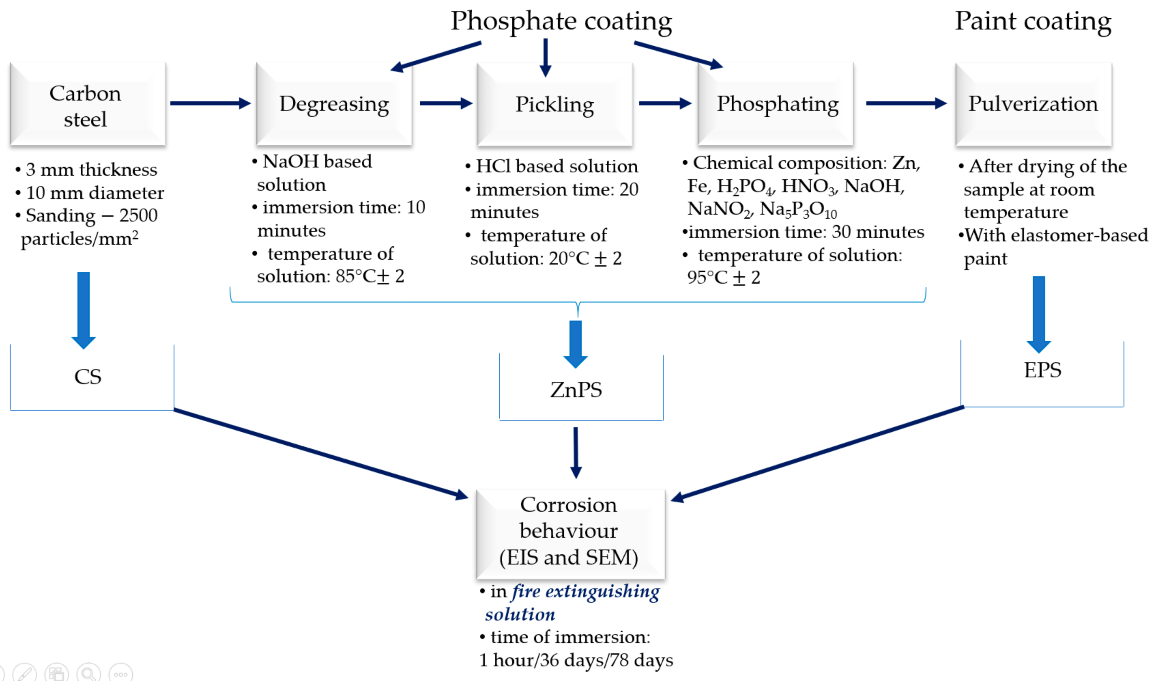
2.2. Sample Preparation

Before phosphating, the carbon steel samples were cut to specimens of 10 mm in diameter and 3 mm thickness. Then, they went through the stages of the phosphating process (degreasing, pickling, and phosphating), being immersed in each bath for a certain time. After drying, a layer of elastomer-based paint type KS 1000 (Car System GmbH, Uetersen, Germany) was pulverized on some of the phosphate samples. Figure 1 depicts the preparation process of the studied samples from the point of view of the corrosion behavior depending on the immersion time in the fire extinguishing solution.
In this study, the tested samples and the corrosive environment are represented as follows:
  • Carbon steel sample: CS;
  • Carbon steel sample on which a layer of zinc phosphate was deposited: ZnPS;
  • The phosphate carbon steel sample (ZnPS) on which a layer of elastomer-based paint was deposited: EPS; and
  • Fire extinguishing solution: FES.

2.3. Methods

To study the corrosion behavior of the three types of samples depending on the immersion time in the fire extinguishing solution, they were placed in hermetically sealed glass containers, in which 40 mL of FES was added. Every week, the aeration of the solution was performed. The samples were removed from the containers after 1 h, 36 days, and 78 days, and the surface layer structure was analyzed by electrochemical impedance spectroscopy (EIS). Additionally, the samples immersed for 78 days were removed from the FES, dried, and the surface morphology and chemical composition were analyzed using a scanning electron microscope (SEM) and the electron dispersive spectroscopy (EDS).
Depending on the samples’ immersion time in the fire extinguishing solution, they were covered with a thinner or thicker layer of corrosion products and/or adsorbed or absorbed components from the corrosion environment.
Considering that the corrosion products can change the pH of the corrosion environment in which the samples are immersed [19], the evolution of this parameter must be checked during the experiment. Therefore, pH measurements of the fire extinguishing solution were performed using a pH-METER OP-2641/1 (Radelkis, Budapest, Hungary) for the three immersion periods studied, and the obtained values are presented in Table 1.
A relatively small change in the pH of the corrosive medium was observed, which increased with the samples’ immersion time.
The structural changes of the superficial surface layers were analyzed by electrochemical impedance spectroscopy (EIS) using a PGZ 301 potentiometer (Radiometer Analytical SAS, Lyon, France). The data acquisition was performed with VoltaMaster 4 software, and the ZSimpWin software was used to process the collected data [21]. The values presented in the following tables were determined in accordance with the theoretical procedure presented in [9].
For the EIS determinations, we used:
  • a glass cell with three electrodes type C145/170 (Radiometer Analytical SAS, Lyon, France);
  • the Teflon washers for fixing the samples on working electrode, the surface of exposure of the samples to the corrosion environment being S = 0.503 cm2;
  • a platinum electrode (S = 0.8 cm2): auxiliary electrode;
  • a saturated calomel electrode: reference electrode.
  • The parameters used for EIS determinations were:
  • frequency range = 105 ÷ 2.5·10−2 Hz; and
  • potential amplitude = 10 mV.
The morphology of the superficial surface structure and its chemical composition were analyzed with a Vega Tescan LMH II scanning electron microscope (30 kV, SE detector) to which an EDX QUANTAX QX2 detector (Bruker/Roentec Co., Berlin, Germany) was connected.

3. Results and Discussion

3.1. The Effects of CS Immersion in Fire Extinguishing Solution

To process the EIS data obtained for the CS samples in the initial and after 36 days or 78 days of immersion in fire extinguishing solution, the circuit shown in Figure 2 was used.
The equivalent circuit is characteristic of a corrodible metal covered with a porous non-conductive film in which the corrosion process takes place under a mixed, kinetic, and diffusion control. In this circuit, Rs is the resistance of the solution, and Rext and Cext are the resistance and the electrical capacity of the coating, respectively. Moreover, Rct and CPE are the resistance and the constant phase element, which takes the place of the double-electric kinetic. Additionally, W is the characteristic constant in the expression of the diffusion impedance, a quantity that controls the reaction rate by the influence of the diffusion of oxidizing and reducing species to and from the metal. The parameter values of the circuit elements are presented in Table 2. The Nyquist (a) and Bode (b) diagram for CS sample is presented in the Figures S1–S3.
Following the analysis of the data in this table, the following aspects can be observed:
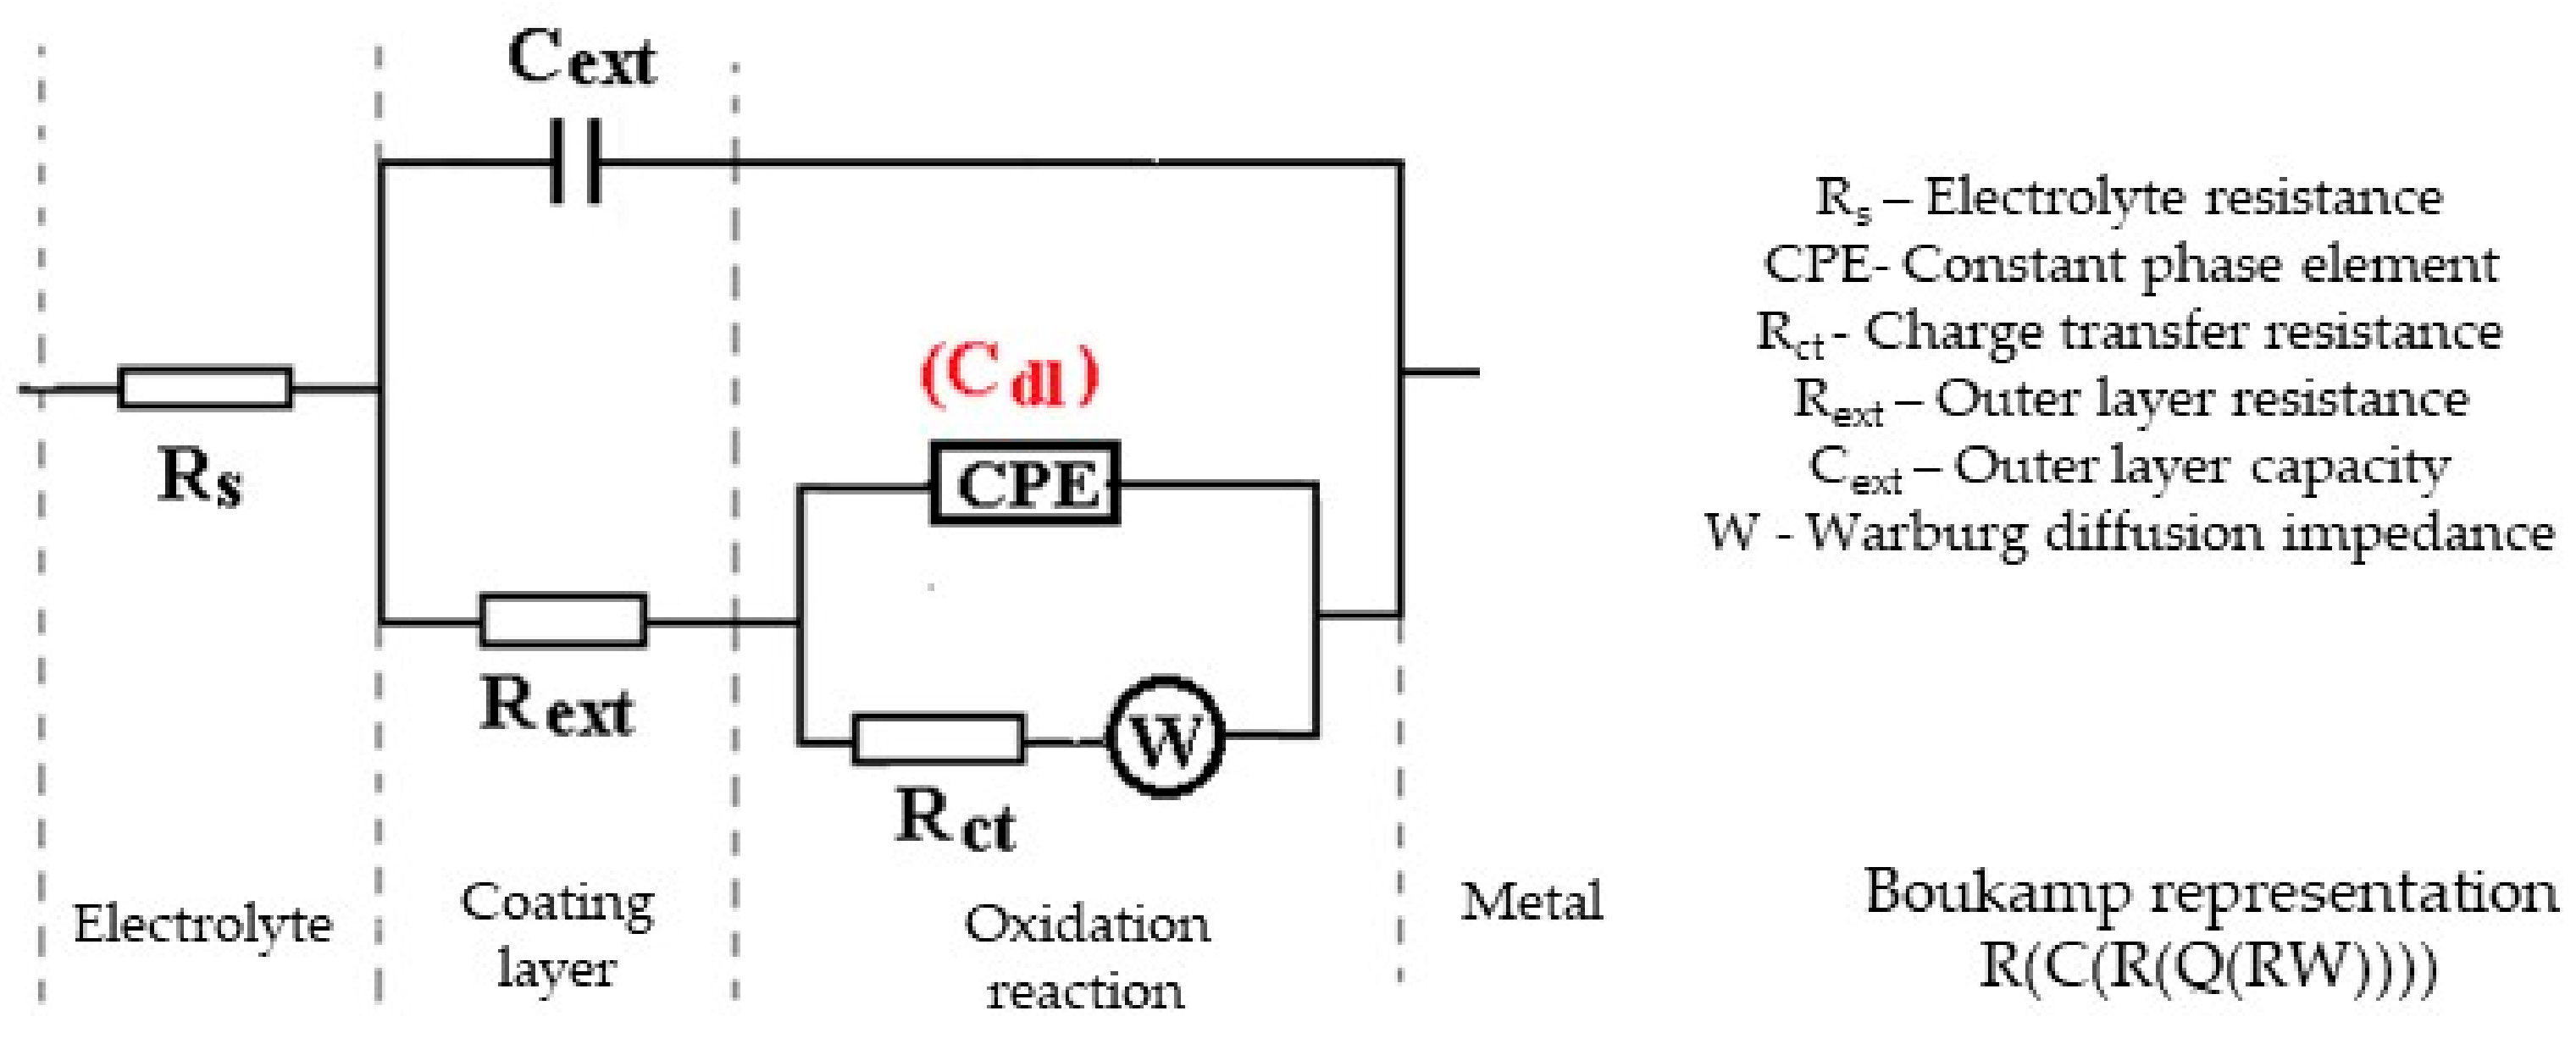
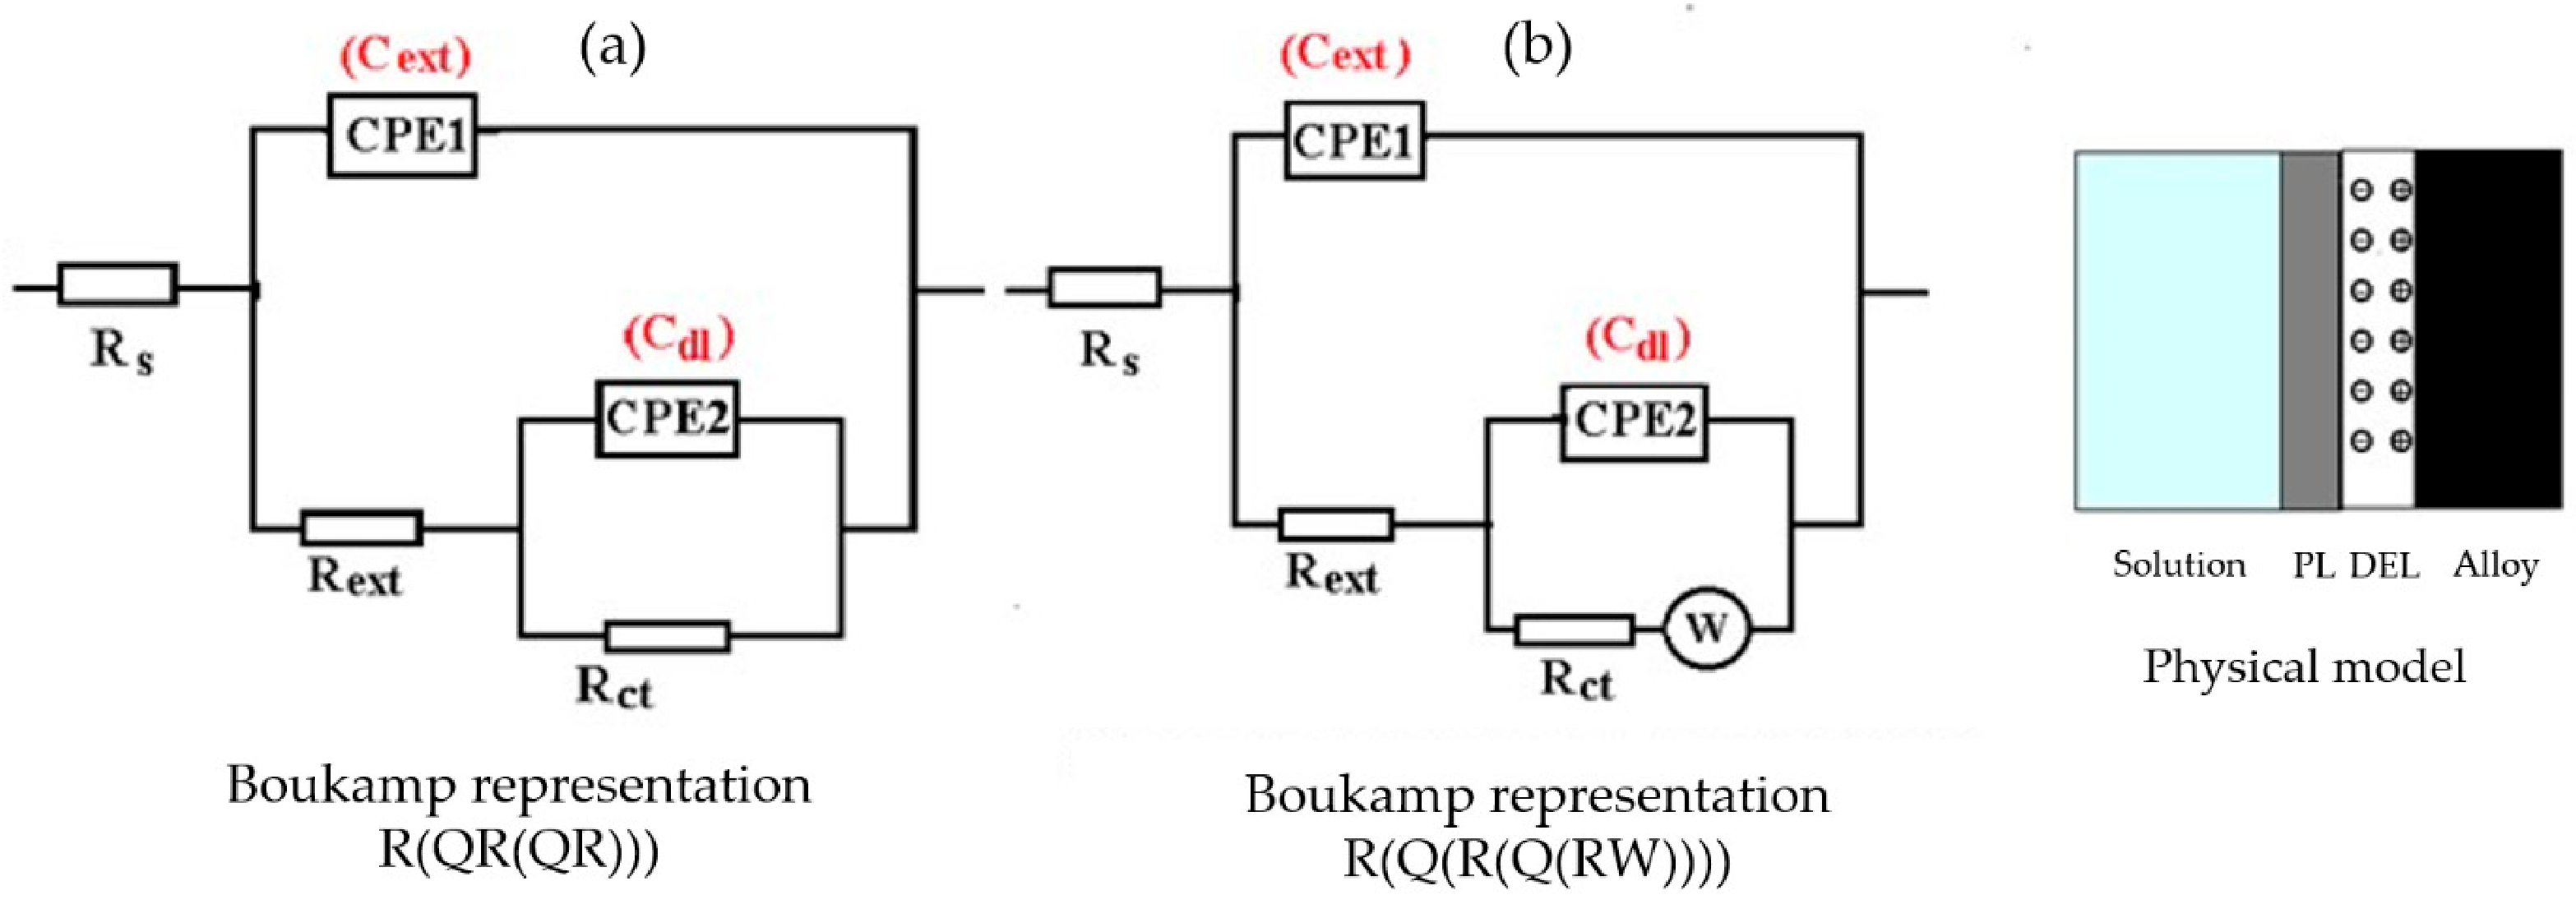
  • For the CS sample immersed in FES, it is necessary, even from the initial moments, to use a bi-layer model and it is needed to take into account the diffusion, although the alloy used has been freshly ground. This phenomenon can be explained if it is considered that the fire extinguishing solution or some of its components adhere to the surface of the metal, even when it is introduced into the liquid and forms a very thin film. The film is porous, and as a result, its resistance is very low and does not affect the resistance of the solution or the charge transfer resistance;
  • By increasing the thickness of the outer layer (i.e., more products from the solution are adsorbed to the formed layer), there is an increase in Rs and the resistance of the outer layer, however, the charge transfer resistance decreases;
  • The constant W decreases with the immersion time so that the Warburg impedance increases significantly and the effect that the diffusion has on the reaction speed intensifies (the speed decreases); and
  • The double-electric layer is represented by a non-ideal capacitor, and its capacity varies randomly, probably due to the changes that take place at the metal/solution interface at various moments of immersion.
The surface microstructure of the sample immersed for 78 days in fire extinguishing solution, after drying, is presented in Figure 3 for various areas and at various magnifications. As can be seen, a crust, apparently uniform, formed on the entire surface of the sample (zone A), and in the center of the sample, there was an additional deposit with a thickness of 0.5–0.6 mm (zone B). In both areas, the deposits were formed by small agglomerations that formed an irregular porous mass, and over them were distributed, from place to place, lighter agglomerations. In zone B, the number of these agglomerates was much higher than in zone A; for this reason, zone B is lighter in color.
EDS measurements indicate the complexity of the compositions in these two areas, and the agglomerations distributed locally on the surface (Figure 4 and Figure 5). The main crust had the most complex composition, and the elements identified in this area were components absorbed from the fire extinguishing solution (oxygen, carbon, sulfur) and the corrosion products of the alloying elements.
In zone B, the number of identified elements was smaller. Compared to area A, the percentage of iron was lower and the percentage of carbon was higher. Ca appeared instead, therefore, in correlation with the increase in carbon, the presence of calcium carbonate can be considered.
Punctual microanalysis performed on a small agglomeration of light color (point 1 in Figure 4) showed that in these agglomerations, the corrosion product was in very small quantities, instead oxygenated compounds of fire extinguishing solution, calcium carbonate, and sodium chloride predominate.
The energy spectra and the elemental mapping of the two areas on the sample surface are shown in Figure 5, Figure 6 and Figure 7. In A zone, the distribution of elements was more uniform, while in zone B, some elements were preferentially distributed (Fe, O, C, S).

3.2. The Effects of ZnPS Immersion in Fire Extinguishing Solution

Samples of carbon steel coated with a zinc–phosphate layer were studied initially, after 36 days, and 78 days of immersion in FES. In this case, the experimental data were processed using the equivalent circuits presented in Figure 8, circuit (a) for the initial (after 1 h of immersion) and circuit (b) for the samples immersed in FES for 36 and 78 days, respectively.
The equivalent circuit in Figure 8a is a two-layer model, characteristic of a corrodible metal covered with a porous non-conductive film in which the corrosion process takes place under kinetic control. In this circuit, Rs is the resistance of the solution; Rext and CPE1 represent the resistance and the constant phase element that characterizes the outer layer, respectively; while Rct and CPE2 are the resistance and constant phase element that takes the place of double-electric layer capacity (they control the speed of kinetic reaction), respectively. The parameter values of the elements in this circuit are presented in Table 3. The Nyquist (a) and Bode (b) diagram for ZnPS is presented in theFigures S4–S6.
The resistance of the solution at the initial moment was identical to that found for the CS/FES system, proof that both the double-electric layer and the phosphate layer were porous, at least in the initial moments.
The values of the parameters that characterize constant phase elements (Q and n) indicate that both the outer layer and the double-electric layer are characterized by non-ideal capacitors. In the case of the double-electric layer, the constant phase element is very close to a Warburg impedance, therefore, the corrosion process is influenced by the diffusion of active species.
To adapt the EIS data recorded in the case of samples immersed for longer periods in the solution, an equivalent circuit proposed by Bousselmi [23] and by Guo et al. [24] for a nodular cast iron/water system was used. The circuit describes a three-layer physical model: the double-electric layer represented by Rct (charge transfer resistance) and Cdl (electrical capacity); an inner layer characterized by the resistance of Rin and CDE (the constant phase element related to the electrical capacity of this layer (Cin)); and an outer layer characterized by Rext and Cext. The inner layer was the phosphate film, porous, with free pores, or partially clogged with reaction products, and the outer layer consisted of adsorbed substances from the fire extinguishing solution and corrosion products. The values of the parameters of the circuit elements for the two immersion periods are presented in Table 4.
The analysis of the data in the table led to the following observations:
  • The outer layer was porous and had very low resistance, which did not vary appreciably with the immersion time, and the capacity was also small and weakly influenced by the immersion time;
  • The resistance of the phosphate layer increased with the immersion period; from 283 at the initial moment to 494 after 78 days of immersion, probably due to pores clogging with oxides/corrosion products [20]; and
  • The presence of two layers in which the clogging of the pores takes place, leading, in time, to a very high increase in the charge transfer resistance and consequently to the passivation of the alloy.
The general appearance of the sample and two details on the surface are presented in Figure 7. The surface of the sample was covered with a seemingly homogeneous crust (zone A) and a portion of this crust was damaged (zone B). In the center of the sample, the crust was convex (zone C) without being damaged.
The outer layer was largely formed by adsorption of FES and corrosion products accumulated under this layer. Because they could not pass through it completely, it created pressure and deformed. It thus appears that zone B appeared as a result of the eruption of the crust under the pressure of the products inside. In Figure 9, it can be observed that the partially uncovered area was much rougher than the continuous crust (zone A).
The average compositions in these two areas, determined by EDS microanalysis, are shown in Figure 10. It can be seen that in both areas, the elements of the FES predominated, which also contained corrosion products (probably FeOOH). The distribution of the elements in that areas is presented in Figure 11 and Figure 12.
According to the data in Figure 10 and the elemental mapping in Figure 11 and Figure 12 the following observations can be made:
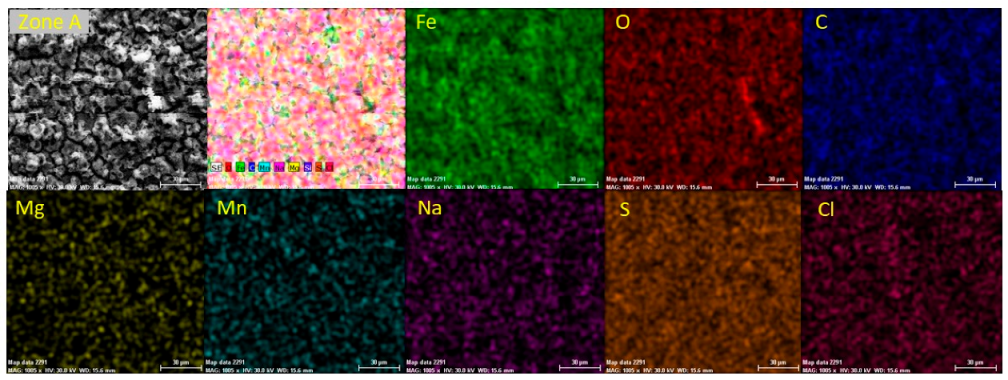
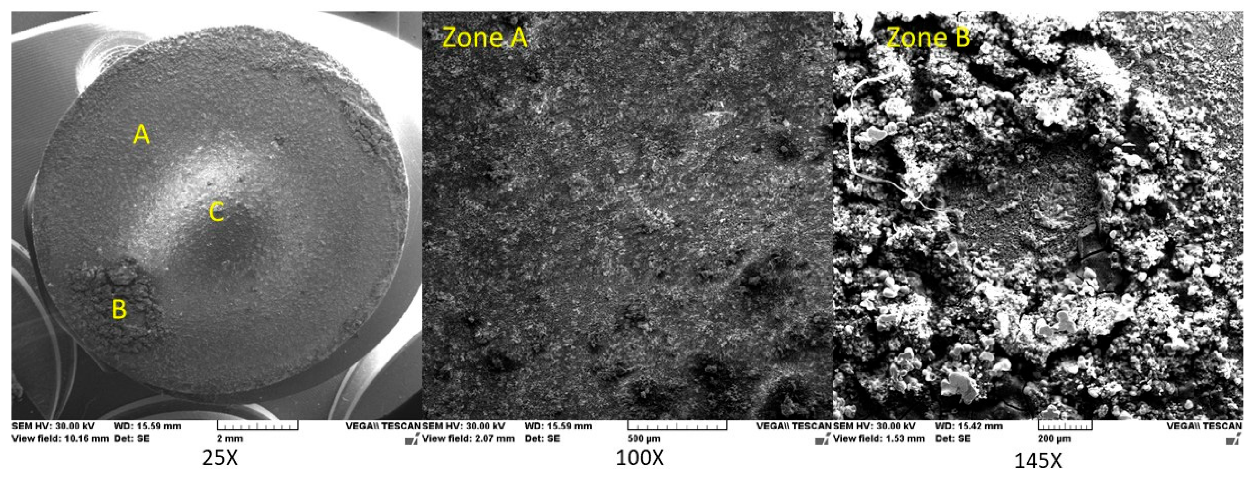
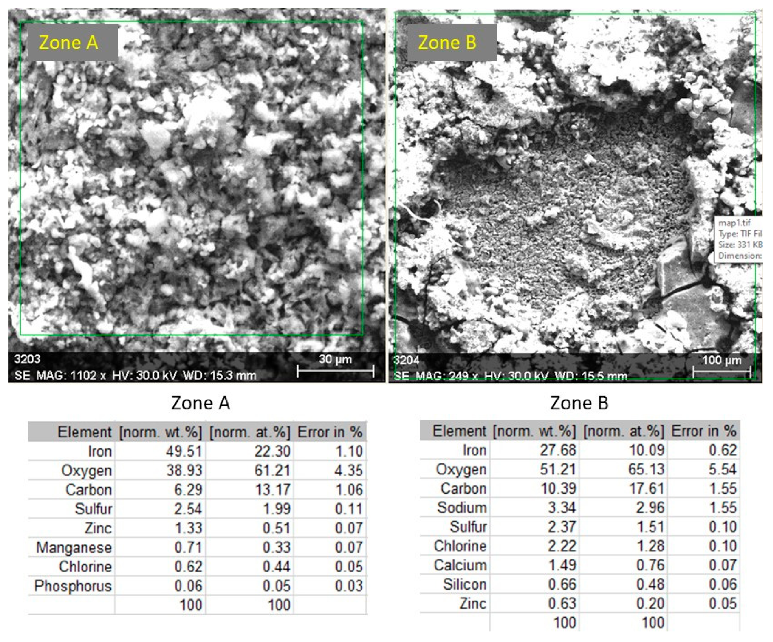
  • The amount of oxygen in both areas was very high, therefore, if the concentration of iron oxides is considered relatively small, the high amount of oxygen can be attributed only to FES molecules adsorbed on the surface;
  • The percentages of oxygen and carbon were higher in zone B than in zone A and the amount of iron was almost half in zone B compared to that in zone A. This finding led us to hypothesize that the formation of the outer layer in zone B occurred after the eruption of the crust under the pressure of the corrosion products;
  • Only in zone A could phosphorus and zinc derived from the partial degradation of the phosphating layer be observed, therefore, the process takes place only in the initial moments of immersion; and
  • Sodium and chlorine were found in much larger quantities in zone B, they also came from the solution that accumulated in the cavity of this zone and were concentrated in the corrosion product (FeOOH). Carbon and sulfur can only have come from the fire extinguishing solution.

3.3. The Effects of EPS Immersion in Fire Extinguishing Solution

The modeling of the SIE data for these systems was conducted in optimal conditions with the equivalent circuits from Figure 13. The equivalent circuit in Figure 13a describes a two-layer model in which corrosion was only controlled kinetically. This circuit was used for the 1 h and 36 day immersed samples, respectively. The circuit in Figure 13b also describes a two-layer model, but in which there is a mixed control of corrosion: kinetic and diffusional. This was used for the sample immersed for 78 days in FES.
It is surprising that for such a complex alloy/FES interface (electric double layer phosphating layer/paint layer/reaction products) such a simple circuit can be used (an electric double layer and an outer layer, most likely porous). This could be because the paint layer is practically compact and almost impermeable, although it could also contain a series of pores and form a screen on which the reaction products that managed to pass through the pores are deposited.
The values of the equivalent circuit parameters for the three immersion periods are presented in Table 5. The Nyquist (a) and Bode (b) diagram for EPS is presented in Figures S7–S9.
From the analysis of this data, the following can be highlighted:
  • The resistance of the electrolyte (Rs) varies appreciably with the immersion time, this being explained by the fact that the actual resistance of the FES layer between the sample and the reference electrode (4.6 Ω·cm2 see the CS/FES system) added fractions of the strength of the paint layer and the resistance of the porous phosphating layer, and while maintained in solution, added fractions of the resistance of the corrosion products that clogged the pores and deposited on or under the paint layer.
  • The resistance of the outer layer (Rext ≡ Rpor in Figure 13) increased with the immersion time while the electrical capacity of this layer was replaced by the constant phase element (CPE1), which is physically an imperfect capacitor. The degree of imperfection of this element decreased accordingly with the immersion time as a consequence of the increase of the roughness and the chemical inhomogeneity of this layer.
  • The presence of superimposed layers over the active surface of carbon steel resulted in a high charge transfer resistance (Rct), which increased over time.
  • The electric double layer must be regarded as a non-ideal capacitor, represented in the equivalent circuit by the constant phase element CPE2. In this case, the fitting degree increased appreciably with the immersion time (from an almost pure capacitor to a diffusion element).
  • In the EPS sample immersed for 78 days in FES, the corrosion process was also influenced by the diffusion of the charges through the clogged pores and the layer of iron oxides that accumulated under and above the paint layer.
  • Due to the high value of the electric double layer resistance and the diffusion process, the corrosion rate decreased during the EPS contact with the FES.
The SEM micrographs for the total surface and various zones from this surface, at various magnifications, are presented in Figure 14.
After 78 days of immersion in FES, three areas could be distinguished on the sample surface: an area covered with a fairly thick crust (Zone B); an area from which the crust was detached, but on which another layer was deposited (Zone A); and a portion of zone B on which material had been deposited (the color was whiter because it was higher than the other zones). In all zones, the surface was very irregular with crystalline and non-crystalline deposits (the largest amount), thus explaining the replacement of the outer layer capacity with the constant phase element CPE2.
The results of the EDS microanalysis of some zones in these areas are presented in Figure 15.
The analysis of these data indicates that areas B and C had practically the same composition. The differences were in the limit of experimental errors, taking into account the fact that the surface on which the composition was evaluated was very small (0.0225 mm2) and the inhomogeneity of the surface.
Considering the compositions presented in Figure 15 and the elemental mapping exhibited in Figure 16 and Figure 17, the following observations can be made:
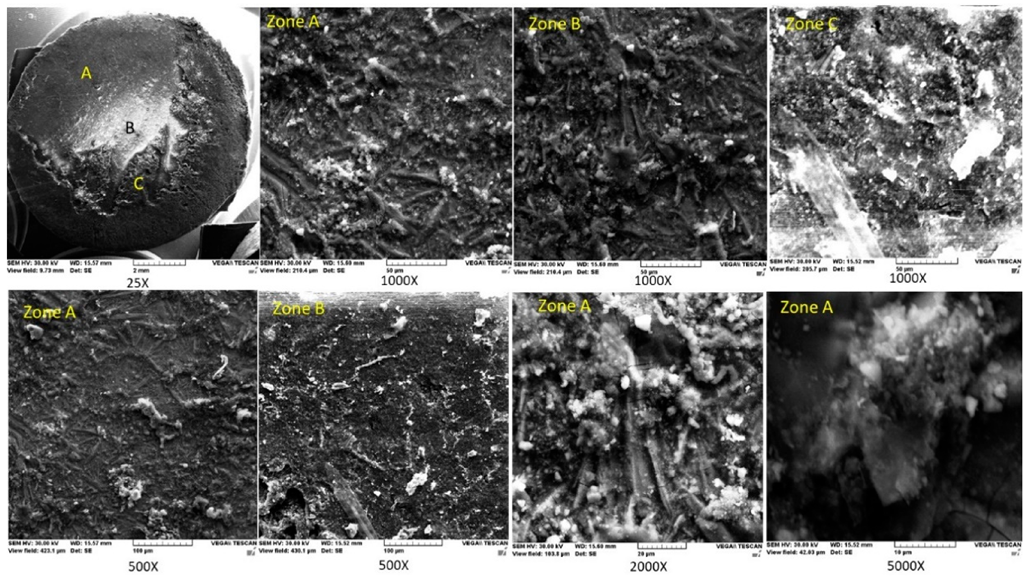
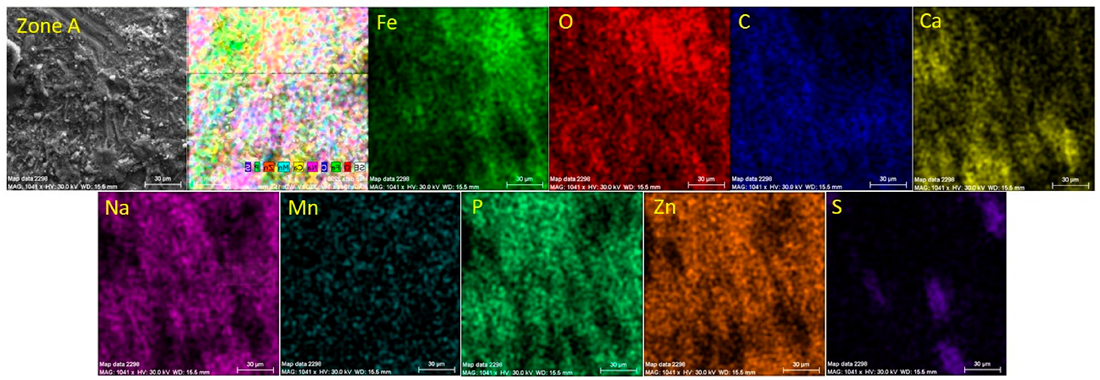
  • In zone A, the paint layer was most likely damaged, this can be stated based on the fact that the concentrations of phosphorus and zinc (which are part of the phosphate layer) were high. In this area, there were also elements from FES (carbon, sulfur, sodium) and paint layer (carbon, calcium (CaCO3)), according to the elemental mapping. Iron in the form of oxide or oxyhydroxide is found in relatively small quantities, being deposited after adsorption of the elements in the FES.
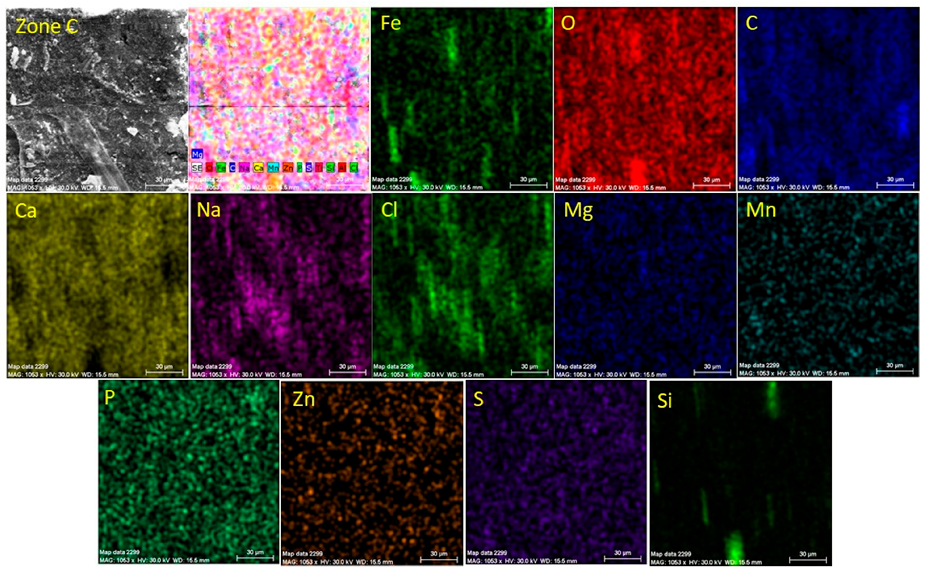
  • In zones B and C, the amount of oxygen was very high and came mainly from the composition of the paint layer and the adsorbed components from the FES. As the iron from corrosion products was only in extremely small quantities (1.3%), few traces could be observed in the elemental mapping,
  • According to the elemental mapping, in these areas, chlorine was found in the form of NaCl and MgCl2, while Calcium could be found in the form of carbonate (CaCO3).

4. Conclusions

Even though different corrosion evaluating methods or systems (material/corrosive environment) have been considered in the literature up to now, there has been no previous study to approach the corrosive behaviour of C45, phosphate C45, and painted phosphate C45 immersed in fire extinguishing solution. Therefore, this study evaluated the corrosion behavior of the material used for the manufacture of connecting elements from fall arrest systems. Considering the firefighting activities, a new corrosive environment that can affect the durability of the metallic connectors was identified (i.e., fire extinguishing solution).
According to the EIS data, the following corrosion behavior of the analyzed samples was observed:
-
after 1 h of immersion, the CS sample exhibited a very low value (154.4 Ω·cm2) of charge transfer resistance (Rct) compared with the ZnPS and EPS samples, where the Rct was approximately 6 and 11 times higher, respectively.
-
after 36 days of immersion, the Rct of the CS sample continued to be low, lower than the initial one, even though the resistance of the outer layer increased as a result of adsorption of different products from the fire extinguishing solution (FES). Therefore, the layer created on the CS surface did not protect the sample from corrosion, and consequently, degradation of the steel surface continued. In contrast, in the case of the EPS sample, a 14 times higher Rct was obtained, while the maximum corrosion protection potential was exhibited by the ZnPS sample (i.e., an Rct value approximately 49 times higher than that of CS).
-
after 72 days of immersion, the FES resistance (Rs) and Rext increased considerably for the C45/FES and EPS/FES system, however, in the case of the ZnPS/FES system, the value of Rs remained very low despite the immersion time. This was due to the passivation of the sample as a result of pores clogging, consequently, compared to the CS sample, the Rct value was 66 times higher.
The double-coated sample (EPS) presented a 14 times higher corrosion resistance than CS at long exposure, however, the Rct was significantly lower than that of ZnPS. However, considering the advantages introduced by the presence of the elastomer-based paint (i.e., mechanical shock absorption), even the maximum protection potential was not achieved. Considering the operating conditions of the carabiners used by firefighters, the most suitable protection for these connectors will be achieved with the double coating.

Supplementary Materials

The following are available online at https://0-www-mdpi-com.brum.beds.ac.uk/article/10.3390/app11177802/s1, Figure S1: The Nyquist (a) and Bode (b) diagram for CS sample after 1 hour of immersion in FES, Figure S2: The Nyquist (a) and Bode (b) diagram for CS sample after 36 days of immersion in FES, Figure S3: The Nyquist (a) and Bode (b) diagram for CS sample after 78 days of immersion in FES, Figure S4. The Nyquist (a) and Bode (b) diagram for ZnPS sample after 1 hour of immersion in FES, Fig-ure S5. The Nyquist (a) and Bode (b) diagram for ZnPS sample after 36 days of immersion in FES, Figure S6. The Nyquist (a) and Bode (b) diagram for ZnPS sample after 78 days of immersion in FES, Figure S7. The Nyquist (a) and Bode (b) diagram for EPS sample after 1 hour of immersion in FES, Figure S8. The Nyquist (a) and Bode (b) diagram for EPS sample after 36 days of immersion in FES, Figure S9. The Nyquist (a) and Bode (b) diagram for EPS sample after 78 days of immer-sion in FES.

Author Contributions

Conceptualization, writing original draft and investigation, D.-P.B.-N.; Writing original draft, project administration, and scientific supervision, R.C.; Methodology, investigation, data curation, and validation, D.-D.B.-N.; Data curation, validation and writing—reviewing and editing, C.B.; Resources, investigation and formal analysis, G.D.V. All authors have read and agreed to the published version of the manuscript.

Funding

This work was supported by a publications grant at the Gheorghe Asachi Technical University of Iaşi—TUIASI-Romania, project number GI/P4/2021.

Institutional Review Board Statement

Not applicable.

Informed Consent Statement

Not applicable.

Data Availability Statement

The data presented in this study are available on request from the corresponding author.

Conflicts of Interest

The authors declare no conflict of interest.

References

  1. Samet, M. The Climbing Dictionary: Mountaineering Slang, Terms, Neologisms, & Lingo: An Illustrated Reference to More than 650 Words; Mountaineers Books: Seattle, DC, USA, 2011; ISBN 9781594855023. [Google Scholar]
  2. Cameron, I.; Gillan, G.; Duff, A.R. Issues in the Selection of Fall Prevention and Arrest Equipment. Eng. Constr. Archit. Manag. 2007, 14, 363–374. [Google Scholar] [CrossRef]
  3. Lehner, S.; Senner, V. Evaluation of Ergonomics of a New Effort Saving Via-Ferrata Carabiner—Child vs. Adult Use. Procedia Eng. 2013, 60, 319–324. [Google Scholar] [CrossRef] [Green Version]
  4. Baszczyński, K. Effects of Full Body Harness Design on Fall Arrest Performance. Int. J. Occup. Saf. Ergon. 2020, 27, 938–945. [Google Scholar] [CrossRef] [PubMed]
  5. Burduhos Nergiş, D.P.; Nejneru, C.; Achiţei, D.C.; Cimpoieşu, N.; Bejinariu, C. Structural Analysis of Carabiners Materials Used at Personal Protective Equipments. IOP Conf. Ser. Mater. Sci. Eng. 2018, 374, 012040. [Google Scholar] [CrossRef]
  6. Bright, C.M. A History of Rock Climbing Gear Technology and Standards. Bachelor’s Thesis, University of Arkansas, Fayetteville, AR, USA, 2014. [Google Scholar]
  7. Pomares, J.C.; Carrion, E.Á.; Irles, R.; González, A.; Segovia, E.G. Experimental Tests on Personal Safety Devices for Falls from Height. In WIT Transactions on the Built Environment; WITPress: Southampton, UK, 2018; Volume 180, pp. 69–81. [Google Scholar]
  8. Zafren, K.; Durrer, B.; Herry, J.P.; Brugger, H. Lightning Injuries: Prevention and on-Site Treatment in Mountains and Remote Areas: Official Guidelines of the International Commission for Mountain Emergency Medicine and the Medical Commission of the International Mountaineering and Climbing Federation (ICAR and UIAA MEDCOM). Resuscitation 2005, 65, 369–372. [Google Scholar] [CrossRef] [PubMed]
  9. Burduhos-Nergis, D.P.; Bejinariu, C.; Sandu, A.V. Phosphate Coatings Suitable for Personal Protective Equipment; Materials Research Forum LLC: Millersville, PA, USA, 2021; Volume 89, ISBN 9781644901113. [Google Scholar]
  10. Kane, B.R.H.D. Residual Strength of Carabiners Used by Tree Climbers|Request PDF. Arboric. Urban For. 2009, 35, 75–79. [Google Scholar]
  11. Harutyunyan, D.; Milton, G.W.; Dick, T.J.; Boyer, J. On Ideal Dynamic Climbing Ropes. Proc. Inst. Mech. Eng. Part P J. Sports Eng. Technol. 2017, 231, 136–143. [Google Scholar] [CrossRef] [Green Version]
  12. Scott, V. Design of a Composite Carabiner for Rock Climbing Final Report; Allen Institute for AI: London, UK, 2008. [Google Scholar]
  13. Smith, R.A. The Development of Equipment to Reduce Risk in Rock Climbing. Sports Eng. 1998, 1, 27–39. [Google Scholar] [CrossRef] [Green Version]
  14. May, M.; Furlan, S.; Mohrmann, H.; Ganzenmüller, G.C. To Replace or Not to Replace?–An Investigation into the Residual Strength of Damaged Rock Climbing Safety Equipment. Eng. Fail. Anal. 2016, 60, 9–19. [Google Scholar] [CrossRef]
  15. Burduhos-Nergis, D.P.; Baciu, C.; Vizureanu, P.; Lohan, N.M.; Bejinariu, C. Materials Types and Selection for Carabiners Manufacturing: A Review. IOP Conf. Ser. Mater. Sci. Eng. 2019, 572, 012027. [Google Scholar] [CrossRef]
  16. Burduhos-Nergis, D.-P.; Sandu, A.-V.; Burduhos-Nergis, D.-D.; Darabont, D.-C.; Comaneci, R.-I.; Bejinariu, C. Shock Resistance Improvement of Carbon Steel Carabiners Used at PPE. In Proceedings of the 9th International Conference on Manufacturing Science and Education–MSE 2019 “Trends in New Industrial Revolution”, Sibiu, Romania, 5–7 June 2019; Volume 290. Article Number 12004. [Google Scholar] [CrossRef]
  17. Díaz, B.; Freire, L.; Mojío, M.; Nóvoa, X.R. Optimization of Conversion Coatings Based on Zinc Phosphate on High Strength Steels, with Enhanced Barrier Properties. J. Electroanal. Chem. 2015, 737, 174–183. [Google Scholar] [CrossRef]
  18. Darband, G.B.; Aliofkhazraei, M. Electrochemical Phosphate Conversion Coatings: A Review. Surf. Rev. Lett. 2017, 24, 1730003. [Google Scholar] [CrossRef]
  19. Bejinariu, C.; Burduhos-Nergis, D.-P.; Cimpoesu, N. Immersion Behavior of Carbon Steel, Phosphate Carbon Steel and Phosphate and Painted Carbon Steel in Saltwater. Materials 2021, 14, 188. [Google Scholar] [CrossRef] [PubMed]
  20. Burduhos-Nergis, D.-P.; Vizureanu, P.; Sandu, A.V.; Bejinariu, C. Phosphate Surface Treatment for Improving the Corrosion Resistance of the C45 Carbon Steel Used in Carabiners Manufacturing. Materials 2020, 13, 3410. [Google Scholar] [CrossRef] [PubMed]
  21. Burduhos-Nergis, D.P.; Vizureanu, P.; Sandu, A.V.; Bejinariu, C. Evaluation of the Corrosion Resistance of Phosphate Coatings Deposited on the Surface of the Carbon Steel Used for Carabiners Manufacturing. Appl. Sci. 2020, 10, 2753. [Google Scholar] [CrossRef]
  22. Burduhos-Nergis, D.P.; Cimpoesu, N.; Vizureanu, P.; Baciu, C.; Bejinariu, C. Tribological characterization of phosphate conversion coating and rubber paint coating deposited on carbon steel carabiners surfaces. Mater. Today Proc. 2019, 19, 969–978. [Google Scholar] [CrossRef]
  23. Bousselmi, L.; Fiaud, C.; Tribollet, B.; Triki, E. Impedance Spectroscopic Study of a Steel Electrode in Condition of Scaling and Corrosion: Interphase Model. Electrochim. Acta 1999, 44, 4357–4363. [Google Scholar] [CrossRef]
  24. Org, W.E.; Guo, H.; Tian, Y.; Shen, H.; Liu, X.; Chen, Y. Electrochemical Science Study on the Electrochemical Corrosion and Scale Growth of Ductile Iron in Water Distribution System. Int. J. Electrochem. Sci. 2016, 11, 6993–7010. [Google Scholar] [CrossRef]
Figure 1. Sample preparation flow chart.
Applsci 11 07802 g001
Figure 2. The equivalent circuit used in the analysis of EIS data for the CS immersed in FES.
Applsci 11 07802 g002
Figure 3. SEM micrographs of the CS immersed for 78 days in the fire extinguishing solution.
Applsci 11 07802 g003
Figure 4. Chemical compositions of the crust formed on the surface of the CS immersed for 78 days in FES.
Applsci 11 07802 g004
Figure 5. Energy spectra for zones A and B of the CS immersed for 78 days in FES.
Applsci 11 07802 g005
Figure 6. Elemental mapping in zone A of the CS sample immersed for 78 days in FES.
Applsci 11 07802 g006
Figure 7. Elemental mapping in zone B of the CS sample immersed for 78 days in FES.
Applsci 11 07802 g007
Figure 8. The equivalent circuit used in the analysis of EIS data for ZnPS immersed in FES for (a) 1 h or (b) 36/78 days.
Applsci 11 07802 g008
Figure 9. The general appearance of the ZnPS sample immersed for 78 days in FES.
Applsci 11 07802 g009
Figure 10. The compositions of the surface of the ZnPS sample after 78 days of immersion in FES.
Applsci 11 07802 g010
Figure 11. Elemental mapping in zone A on the ZnPS sample immersed in FES for 78 days.
Applsci 11 07802 g011
Figure 12. Elemental mapping in zone B on the ZnPS sample immersed in FES for 78 days.
Applsci 11 07802 g012
Figure 13. Equivalent circuits used for modeling the EIS data of EPS samples immersed in FES for (a) 1 h/36 days and (b) 78 days.
Applsci 11 07802 g013
Figure 14. The microstructure of the EPS sample immersed for 78 days in FES.
Applsci 11 07802 g014
Figure 15. Compositions of different areas from the EPS sample immersed for 78 days in FES.
Applsci 11 07802 g015
Figure 16. Elemental mapping in zone A of the EPS sample after 78 days of immersion in FES.
Applsci 11 07802 g016
Figure 17. Elemental mapping in zone C of the EPS sample after 78 days of immersion in FES.
Applsci 11 07802 g017
Table 1. Variation of the fire extinguishing solution pH with the immersion time of the samples.
Corrosion EnvironmentImmersion Time (Days)CS, pHZnPS, pHEPS, pH
FESInitial6.416.416.41
366.526.436.41
786.606.606.50
Table 2. Equivalent circuit element values for the CS immersed in FES.
Immersion TimeRs
Ω·cm2
Cext
µF/cm2
Rext
Ω·cm2
CPERct
Ω·cm2
W
Ss½/cm2
103χ2εZ
Q
Ssn/cm2
n
1 h4.641.7136.421.43 × 10−30.646154.40.2770.5562.30
36 days34.390.77115.106.31 × 10−30.783134.60.1052.314.81
78 days43.5915.89145912.47 × 10−30.743129.50.0660.0900.95
Table 3. Equivalent circuit element values for ZnPS immersed for 1 h in FES.
Immersion TimeRs
Ω·cm2
CPE1 Rext
Ω·cm2
CPE2Rct
Ω·cm2
103χ2εZ
Q1
Ssn/cm2
n1Q2
Ssn/cm2
n2
1 h4.643.80 × 10−40.634282.82.03 × 10−30.5339892.264.75
Table 4. Equivalent circuit element values for ZnPS immersed for long periods in FES.
Immersion TimeRs
Ω·cm2
Cext
µF/cm2
Rext
Ω·cm2
CPERin
Ω·cm2
Cdl
μF/cm2
Rct
Ω·cm2
103χ2εZ
Q
Ssn/cm2
n
36 days4.5612.322.026.07 × 10−40.70040921.2867072.214.78
78 days4.8316.983.008.96 × 10−40.6194945.21186130.6962.63
Table 5. Equivalent circuit elements values for EPS immersed in FES.
Immersion TimeRs
Ω·cm2
CPE1 Rext
Ω·cm2
CPE2Rct
Ω·cm2
W
Ss1/2/cm2
103χ2εZ
104·Q1
Ssn/cm2
n1104·Q2
Ssn/cm2
n2
1 h14.237.910.6933572.190.9091765-0.4272.10
36 days53.293.420.5898985.370.7331935-0.4982.23
78 days187.11.480.58119716.580.57319728.9 × 10−40.3381.94
Publisher’s Note: MDPI stays neutral with regard to jurisdictional claims in published maps and institutional affiliations.

