Article

Synchrotron X-ray Microprobes: An Application on Ancient Ceramics

by
Alessandra Gianoncelli
1,*,
George Kourousias
1,
Sebastian Schöder
2,
Antonella Santostefano
3,
Maëva L’Héronde
4,
Germana Barone
5,
Paolo Mazzoleni
5 and
Simona Raneri
6
1
Elettra—Sincrotrone Trieste, Strada Statale 14, km 163.5 in Area Science Park, 34149 Basovizza, Italy
2
Synchrotron SOLEIL, PUMA Beamline, Saint-Aubin BP48, 91192 Gif-sur-Yvette, France
3
Department of Ancient and Modern Civilizations, University of Messina, Polo Universitario dell’Annunziata, 98168 Messina, Italy
4
IPANEMA USR3461, CNRS, Université Paris-Saclay, Ministère de la Culture, UVSQ, MNHN, 91192 Saint-Aubin, France
5
Department of Biological, Geological and Environmental Sciences, University of Catania, Corso Italia 57, 95129 Catania, Italy
6
Institute of Chemistry of Organometallic Compounds, National Research Council, ICCOM-CNR, Via G. Moruzzi 1, 56124 Pisa, Italy
*
Author to whom correspondence should be addressed.
Submission received: 23 July 2021 / Revised: 25 August 2021 / Accepted: 26 August 2021 / Published: 30 August 2021

Abstract

:
Synchrotron X-ray µ- and nano-probes are increasingly affirming their relevance in cultural heritage applications, especially in material characterization of tiny and complex micro-samples which are typical from archaeological and artistic artifacts. For such purposes, synchrotron radiation facilities are tailoring and optimizing beamlines and set-ups for CH, taking also advantages from the challenges offered by the third-generation radiation sources. In ancient ceramics studies, relevant information for the identification of production centers and manufacture technology can be obtained in a non-invasive and non-destructive way at the micro-sample level by combining different SR based methods. However, the selection of appropriate beamlines, techniques and set-ups are critical for the success of the experiments. Fine and varnished wares (e.g., Attic and western-Greek colonial products) are an excellent case study for exploring challenges offered by synchrotron X-ray microprobes optimized to collect microchemical and phase-distribution maps. The determination of provenance and/or technological tracers is relevant in correctly classifying productions, often based only on ceramic paste, gloss macroscopic features or style. In addition, when these vessels are preserved in Museums as masterpieces or intact pieces the application of non-invasive approach at the micro sample is strictly required. Well-designed synchrotron µXRF and µXANES mapping experiments are able providing relevant clues for discriminating workshops and exploring technological aspects, which are fundamental in answering the current archaeological questions on varnished Greek or western-Greek colonial products.

1. Introduction

X-ray fluorescence (XRF) for cultural heritage materials is a widely used and well-assessed technique for compositional characterization of archaeological and artistic objects. It enables the elemental analysis of materials and provides an easy way to determine the materiality of artifacts [1,2,3,4].
In ancient ceramics studies, laboratory XRF is traditionally used for provenance issues. XRF is a non-invasive technique, this means that it can be used directly on the object without the need of sampling. However, when used with a non-focused X-ray beam, as it is often provided by laboratory instruments, sampling might be needed to obtain meaningful and reliable bulk analysis. This typically consists of the preparation of pressed pellets from a few grams of powdered sample. In addition, it is sometimes combined with other destructive analytical tools for trace elements determination, such as ICP-MS, ICP-OES, NAA [5]. For provenance studies, geochemical data are often processed by using statistical methods able to create correlation among group of samples, also in comparison with databases [6,7]. When geochemical tracers fail in group classification and provenance discrimination, recent studies have demonstrated the merits of isotopic analysis as clay provenance fingerprint [8,9]. Ceramics are the most numerous records in archaeological excavations and are often expendable for destructive analysis. However, in some cases, the artistic and cultural value of ceramic objects—especially when preserved and exhibited in Museums as masterpieces—prevents macro-sampling needed for such destructive XRF analyses. The use of portable XRF systems enables to overcome this limit. Being nondestructive and noninvasive they offer the advantage of material characterization without sampling and directly in situ [10,11,12,13]. Indeed, the advent of new powerful and focused X-ray tubes in the last decades, together with performant detectors, which do not require liquid nitrogen cooling, has pushed to use and the performance of both portable and laboratory XRF systems. Single point XRF equipment is currently available in the majority of diagnostic laboratories. Moreover, the accessibility of advanced macro-XRF systems introduced in laboratories—pioneering set-ups designed at synchrotron radiation facilities—allows determining and localizing the distribution of chemical elements at the sample surface [14,15,16]. Detection limits and element ranges are the most common limits of portable and lab-based systems. Thus, when micro-sampling is allowed (for example, from hidden part of the ceramic vessel) the use of synchrotron-based (SR) X-ray sources appears quite valuable. It is non-invasive and non-destructive on the micro-samples, which can be later on used for further investigations. SR X-ray sources offer numerous advantages. They are brilliant sources assuring intense X-ray radiation, providing a quasi-monochromatic beam and an energy selection over a wide range, which can be chosen according to elements of interest [17,18].
In the last decades, one of the main innovations at SR-based X-ray sources are micro- and nano-focusing systems aimed at obtaining micro- and nanometric lateral resolution for both qualitative and quantitative analysis in complex and/or tiny samples [19,20,21]. Soft and hard X-ray microprobes are available at synchrotron radiation sources. The selection of the probes depends on the energy range of interest—and thus the elements to detect. In ceramic studies, elements with emission energies below 10 keV are common constituents. However, the use of harder X-ray microprobes appears suitable for the determination of elements usually present in traces and also relevant in provenance or technological studies. Among SR-based X-ray microbeam techniques, µXRF mapping systems appear particularly useful in analyzing ceramic decorations (slip, glazes, etc.) or to detect enrichment/depletion of specific elements across ceramic section for provenance or technological purposes [22,23]. Being heterogenous materials, the analysis of ceramics can benefit from the combination of different SR-based X-ray methods with micrometric or sub-micrometric spatial resolutions. For example, µXRF can be combined with micro-X-ray diffraction (µXRD) for the determination of crystalline phases in both the ceramic body and decorative layers or nano-XRD for single crystal studies even in not-crystalline matrix, such as in glazes [24,25,26]. µXRF can be also coupled with µ- or nano-XANES, enabling the determination and even the distribution of the valence state of an element [27]. Usually, this method requires the preliminary acquisition of a µXRF map for the selection of areas of interest. The XANES measurement consists of scans in fluorescence or transmission (TXM) mode—depending on sample preparation and characteristics—at defined energies across the adsorption edge of the element of interest. µ- and nano-XANES are still relatively recent application in the CH field and therefore poorly explored [20]. In literature, very few examples discuss the merits of µXANES in the mild or hard X-ray range, particularly suitable for technological studies on slips and gloss layers in decorated vessels [28,29,30].
The combination of SR-based X-ray methods, such as fluorescence, diffraction and absorption, appears relevant for different purposes in ancient ceramics studies. For provenance issues, SR-based µXRF mapping might provide insights on the chemical distribution of elements across the sample section. It can highlight enrichment/depletion of minor and trace elements in ceramic paste vs. surface decoration, also in comparison with other productions and/or reference data. Additionally, SR-based X-ray methods are suited for technological studies. The microanalysis of slip or varnished surfaces might provide information on chemical composition, elemental distribution, presence of crystallites in glossy matrix and speciation of elements (metals) for the better understanding of manufacture procedures.
For such applications, the sampling of small fragments or even a more refined sample preparation (e.g., cross-section or thin section) depends on the field of view required in the investigation. XRF or XANES maps acquired with µbeams in fluorescence mode can be carried out on small fragments. The sample can be positioned in cross-sectional geometry to acquire information on both the clay paste and the surface slip. Otherwise, the use of nano-beams for acquiring details on single layers, characterize crystallites, investigating the element distribution at sub-micrometric scale, or performing transmission XANES maps require the preparation of thin sections or microtome sections. The use of µ and nano-beams implies in general higher localized radiation doses in the sample, as the flux is focused on a smaller spot size. However, in ceramic studies radiation damage is usually not a big issue. Sample preparation depends also on beamline set-up; for example, it is possible to perform the analysis in air—even on big objects or entire vessels—or in vacuum—which often requires microtome sections. Looking at the International Synchrotron Radiation Facilities, Table 1 reports a list of beamlines particularly suitable for material sciences applications, some of which are specifically optimized for cultural heritage studies, with details about energy range (which elements can be detected, mapped and for which the speciation can be determined), beam size (level of resolution) and sample environment (sample preparation required, vacuum or air, big or small samples). The overall listed information appears quite relevant in designing a successfully experiment, depending on the archaeological question to be answered.
Among ancient Greek ceramics, red and black figures wares and black-gloss wares have a great interest both from the stylistic/typological point of view and the provenance and technological aspects. In fact, their analysis might draw the mobility of goods and/or painters and artisans through Greece and the western-Greek colonies. The identification of specific chemical markers to discriminate productions—especially among western-Greek colonies—is not straightforward due to high depuration of raw materials. In addition, even if the current literature mainly agrees on the technological routine applied in ancient time to obtain well manufactured red, black or red and black gloss wares, some issues remain still open [29,31,32]. To explore the challenges offered by SR-based X-ray microbeams in provenance and technological studies of ancient ceramics, fragments of black-gloss ware from different Greek and western Greek colonial products have been selected—as examples—and investigated at PUMA beamline of the SOLEIL Synchrotron Radiation Facility [33].
The selection of this beamline allowed (i) the determination of elements with emission energies higher than 10 keV, relevant in provenance and technological studies; (ii) obtaining micrometric lateral resolution (microbeam) for the determination of enrichment/depletion of elements in layers micrometric in thickness (black gloss); (iii) collecting both XRF and XANES maps at micrometric scale; (iv) to use samples without specific sample preparation due to the analysis being carried out in air, with a relatively flexible sample stage to accommodate fragments with different shapes or even entire vessels.
For the purpose of comparison, other classical non-destructive and non-invasive (at micro-sample level) microchemical methods were used and the results are discussed in the light of the SR X-ray data.

2. Materials and Methods

In this case, 14 samples of black-gloss ceramics from the excavations of the Greek colonies of Gela and Messina (Sicily, Italy) have been selected for this study. They are representative of two different productions, Laconian (GEL 1–8) and so-called Chalciadian (ME 67–70, 73, 133). The classification was preliminarily based on the morphological and typological features of the selected specimens and on macroscopic observations of the black-gloss and the paste (Table 2). Attic products and Sicilian (Geloan) and south-Italian (Locrian?) colonial products already characterized in a previous research [22] were also re-considered for the purpose of comparison.
The so-called Chalcidian pottery is known in literature for both figurative and aniconic series, dated from the 6th century B.C. to the beginning of the 5th century B.C. According to the most recent archaeological studies, it is a colonial product that has been located in the southern Calabria or in the Strait of Messina area [34,35,36,37]. Laconian black pottery is produced in the Greek region of Laconia during the 6th century B.C. and is exported to different sites in the Mediterranean [38,39].
For the experiments, small fragments were sampled from vessels preserved in Archeological Museums of Gela and at the deposits of the Superintendence of Messina. Vessels from Messina classified as Chalcidian were also studied by benchtop XRF and ICP-MS in the frame of previous published research, pointing out some geochemical criteria for productions discrimination, which are based—however—on destructive methods [35].
Non-destructive and non-invasive preliminary studies [22] at micro-samples on Attic, Sicilian and South-Italian colonial products pointed out enrichment-depletion of specific elements in clay paste and black gloss useful as provenance indicators. Additionally, Zn has been verified as peculiar of non-Sicilian colonial products and of specific manufacturing practices [22], of which nature and workshop distribution needs to be verified.
The analysis of the selected corpus by different non-destructive and non-invasive methods offered the opportunity to explore the challenges offered by the combination of SR based µXRF and µXANES mapping in providing valuable provenance and technical features for this ceramic class.
A very preliminary qualitative chemical characterization was obtained by portable XRF mapping using an Elio Bruker device equipped with an x-y motor stage and an X-ray tube with Rhodium anode. The measuring spot on the surface was about 1 mm. 2D maps were acquired on the gloss surface using a 40kV tension of the X-ray tube, 80 µA current, 3 s/point acquisition time. However, the large analysis spot (about 1 mm) prevented the necessary resolution for accurate determination of the black-gloss features; in addition, the analysis is expected to be influenced by bulk composition.
Following a successful microchemical approach on black-gloss potteries [22] micro-samples were analysed at PUMA beamline, Synchrotron Soleil (France). A KB mirror focuses the X-ray photons to a spot of 3 µm × 3 µm on the sample. The surface to be analyzed is orientated at an angle of 45° in respect to the beam axis, producing an effective beam size of 3 µm in vertical and 4.3 µm in horizontal direction. The measurements were performed in ambient air and temperature. The XRF signal was acquired by a SGX Sirius SD silicon drift detector installed at 90° from the incident beam. A visible light microscope located perpendicularly to the sample surface allowed micrometric visualization and navigation of the sample. During XRF analyses, the samples were scanned at 18 keV with a step size of 10 µm using 1 s acquisition time per pixel. Samples were scanned in two geometries, namely with the gloss facing the beam and in cross-section. On these latter samples, after XRF mapping, specific points on the surface of the gloss were selected to perform XANES measurements across the Fe K and Zn K absorption edges. The XANES spectra were collected in fluorescence mode with 1 s/point acquisition time. For Fe an energy resolution of 2 eV was chosen in the pre-edge range from 7.03 to 7.08 keV and in the post-edge zone from 7.2 to 7.33 keV. The area around the edge from 7.08 to 7.2 keV was scanned with higher resolution in steps of 0.5 eV. For Zn an energy resolution of 2 eV was used in the pre-edge range from 9.37 to 9.4 keV and in the post-edge range from 9.47 to 9.71 keV, while close to the edge from 9.4 to 9.47 KeV an energy resolution of 0.5 eV/step.
Reference standards of Fe2+ and Fe3+ were used for calibration and to help Fe-speciation identification, while ZnO and ZnFe2O4 (Gahnite) were used for calibration and help with Zn-speciation. Collected spectra were compared both to the measured reference standards and to reference spectra available in the literature.
For a pre-selection of the samples to be mapped in cross-section, XANES maps were acquired at 4 different energies across Fe and Zn K absorption edges, 7330 eV, 7136 eV, 7132 eV, 7127 eV for Fe and 9872 eV, 9688 eV, 9669 eV and 9665 eV for Zn, respectively. Some of these energies were used to acquire insights on Fe (7127 eV, 7132 eV) and Zn (9688 eV, 9669 eV and 9665 eV) speciation distribution in 2D, in addition to the single point spectra previously acquired. XANES maps were acquired over areas of 150 µm × 150 µm, with 5 µm step size and 1 s acquisition time per point, centering the area as 50 µm above surface and 100 µm below surface (that is, inside the sample paste).
Table 2. List of studied samples.
Sample IDType and ChronologyProvenanceAttribution (Based on Typology and Black Gloss Appearance)
GEVN 1–6, GEVN 8, GEVN 11–13 [22]Cup-skyphos (GEVN 1), skyphoi (GEVN 4, 8, 12–13), kylikes (GEVN 3, 5–6), small bowls (GEVN 2, 11)
(5th-first quarter 4th cent. B.C.)
Gela, Molino a Vento, excavation 1955–1956Sicilian colonial production (Geloan)
GEVN 14–15, 17–20 [22]Skyphoi (GEVN 14–15), kylikes (GEVN 18, 20), small bowls (GEVN17, 19)
(5th-first quarter 4th cent. B.C.)
Gela, Old Station,
excavation 1984
Sicilian colonial production (Geloan)
GEVN 7 [22]Cup-skyphos (last quarter 6th cent. B.C.)Gela, Molino a Vento, excavation 1956Attic production
GEVN 9 [22]Saltcellar (Ca. 450 B.C.)Gela, Molino a Vento, excavation 1956Attic production
GEVN 10 [22]Stemmed dish
(late 6th-early 5th cent. B.C.)
Gela, Molino a Vento, excavation 1955Chalcidian production
GEVN 16 [22,40,41]Skyphos (Ca. 400–380 B.C.)Gela, Old Station, excavation 1984South-Italian production (Locrian?)
GEL 1–8 [22]Kraters (6th cent. B.C.)Gela, Molino a Vento, excavation 1955–1956, 1974Laconian production
ME 67 (Inv. 10561), ME 68 (Inv. 10566), ME 69 (Inv. 10564), ME 70 (Inv 10565), ME 73 (Inv. 10563), ME 133 (Inv. 10544) [35,37]Skyphoi (ME 67–69, 73, 133),
krater (ME 70)
(second half 6th–early 5th cent. B.C.)
Messina, Via Industriale-Isolato S, US 3. Excavation 1991–1992Chalcidian production
For comparison, on the same analysis area scanned at PUMA, traditional microchemical investigation was performed by SEM-EDS at IPANEMA facility labs [42] by using a ZEISS Supra55VP SEM-EDS with a Schottky Field Emission Gun (FEG) equipped with a Bruker EDS system. Measurements were carried out without any metal coating on the sample surface to assure a non-invasive and non-destructive testing; nevertheless, to obtain better images and microanalysis, studied samples were wrapped in aluminum foil leaving out a small window in the region of interest to analyze.

3. Results

3.1. Portable XRF

Even with obvious limits, a fast and non-destructive scan of the surface provided some clues on compositional differences among the studied productions. In fact, Attic and Laconian vessels, and Chalcidian, south-Italian (Locrian?) and Sicilian colonial (Geloan) samples show different features.
In Attic fragments glaze is mainly Fe-rich with low amounts of silicon and potassium. Laconian samples are characterized by a Fe-based black-gloss with Mn co-localization, along with silicon and potassium in lower amount. Sicilian colonial fragments are characterized by Fe-based gloss with potassium and manganese. On the other hand, Chalcidian and Locrian products show a co-localization of Fe and Zn, along with silica and low amount of K and Mn. Of course, this qualitative analysis provided a not-univocal classification criteria. However, a portable XRF approach seems to permit the discrimination between Attic and colonial products, and between Sicilian and South-Italian colonial products based on Zn marker (Figure S1).

3.2. SR Based X-ray Methods Using Microprobes
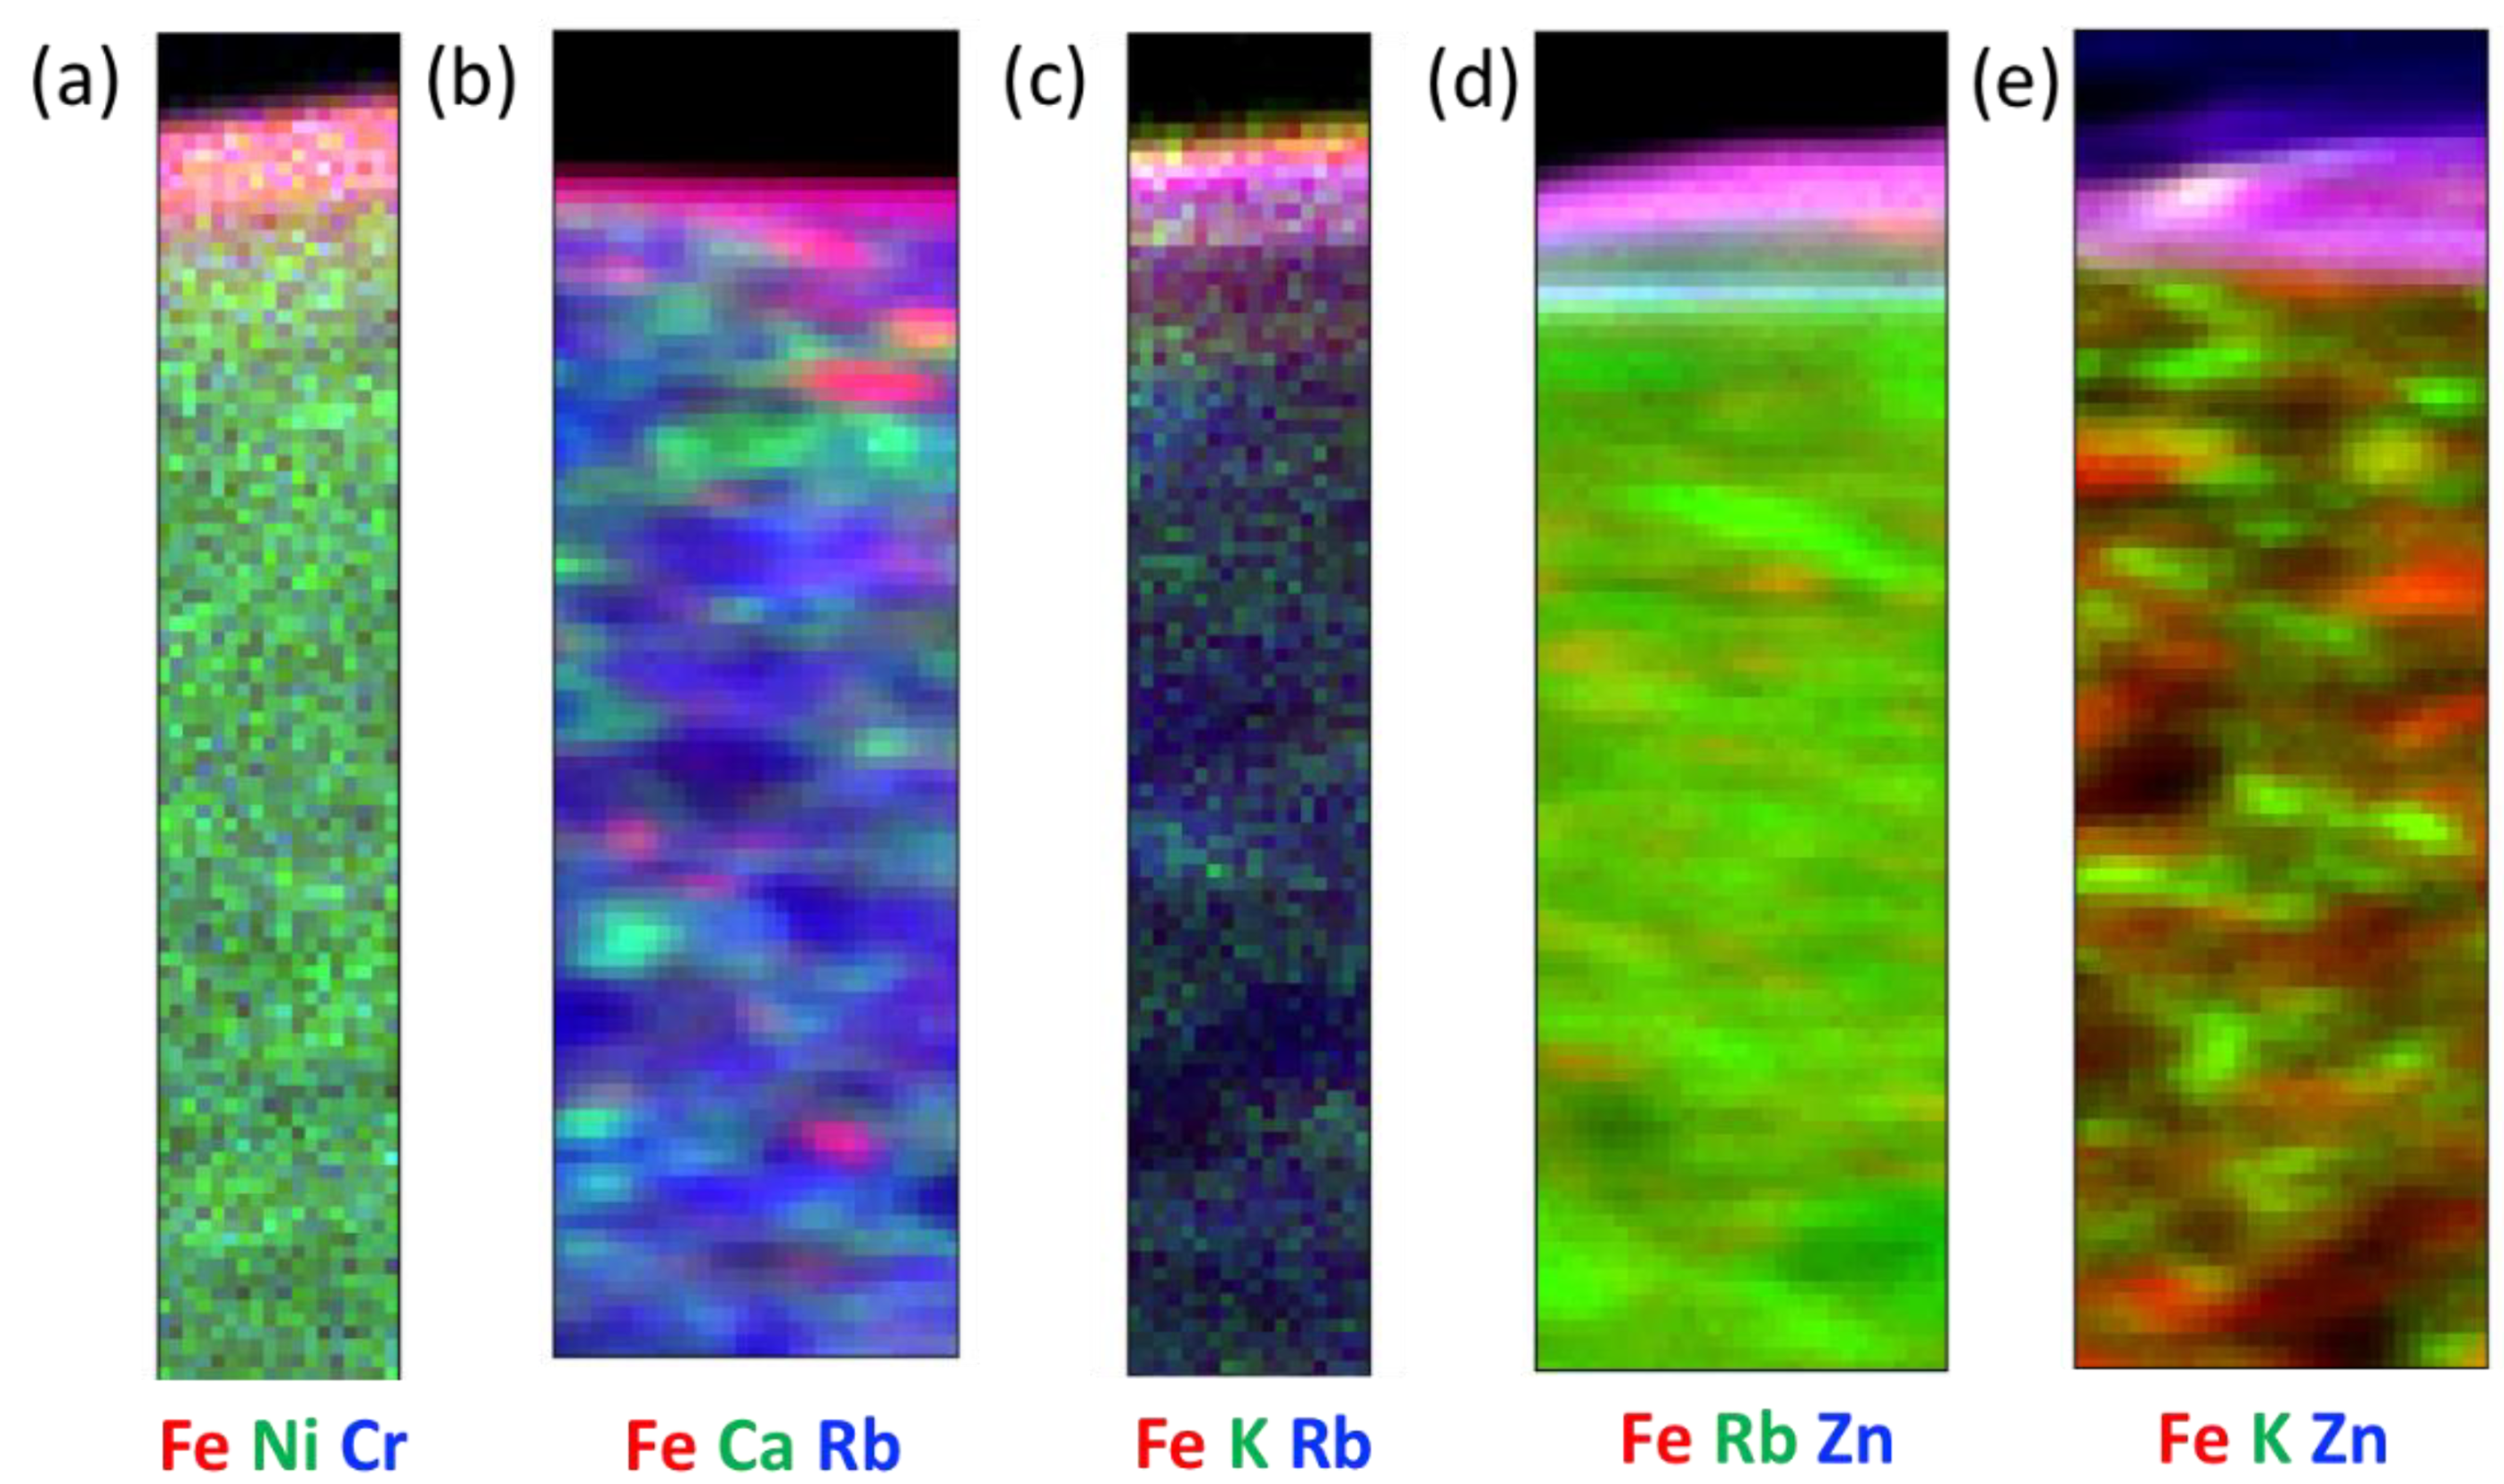
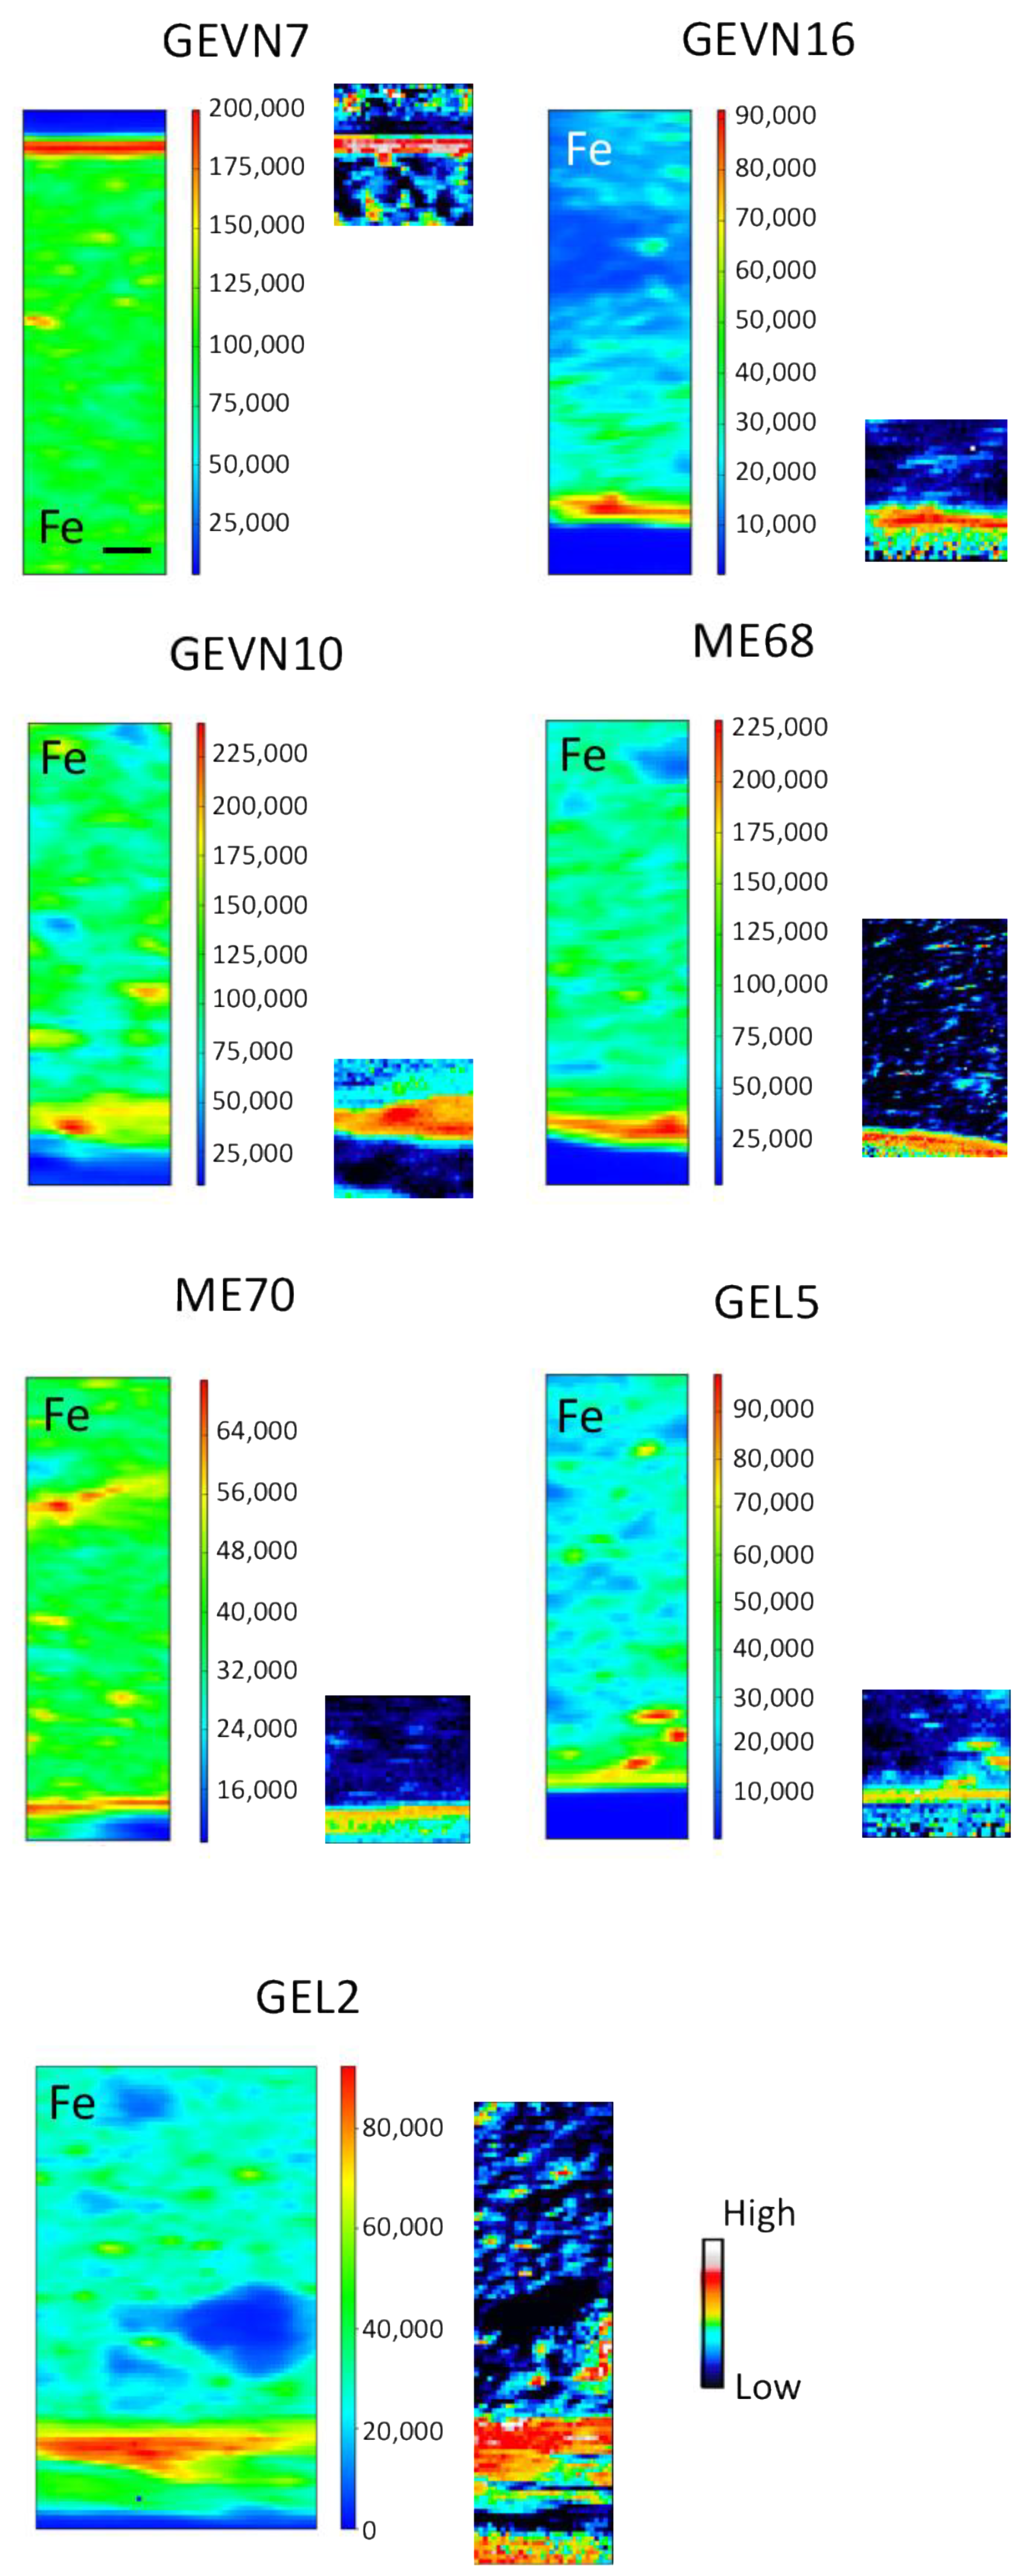
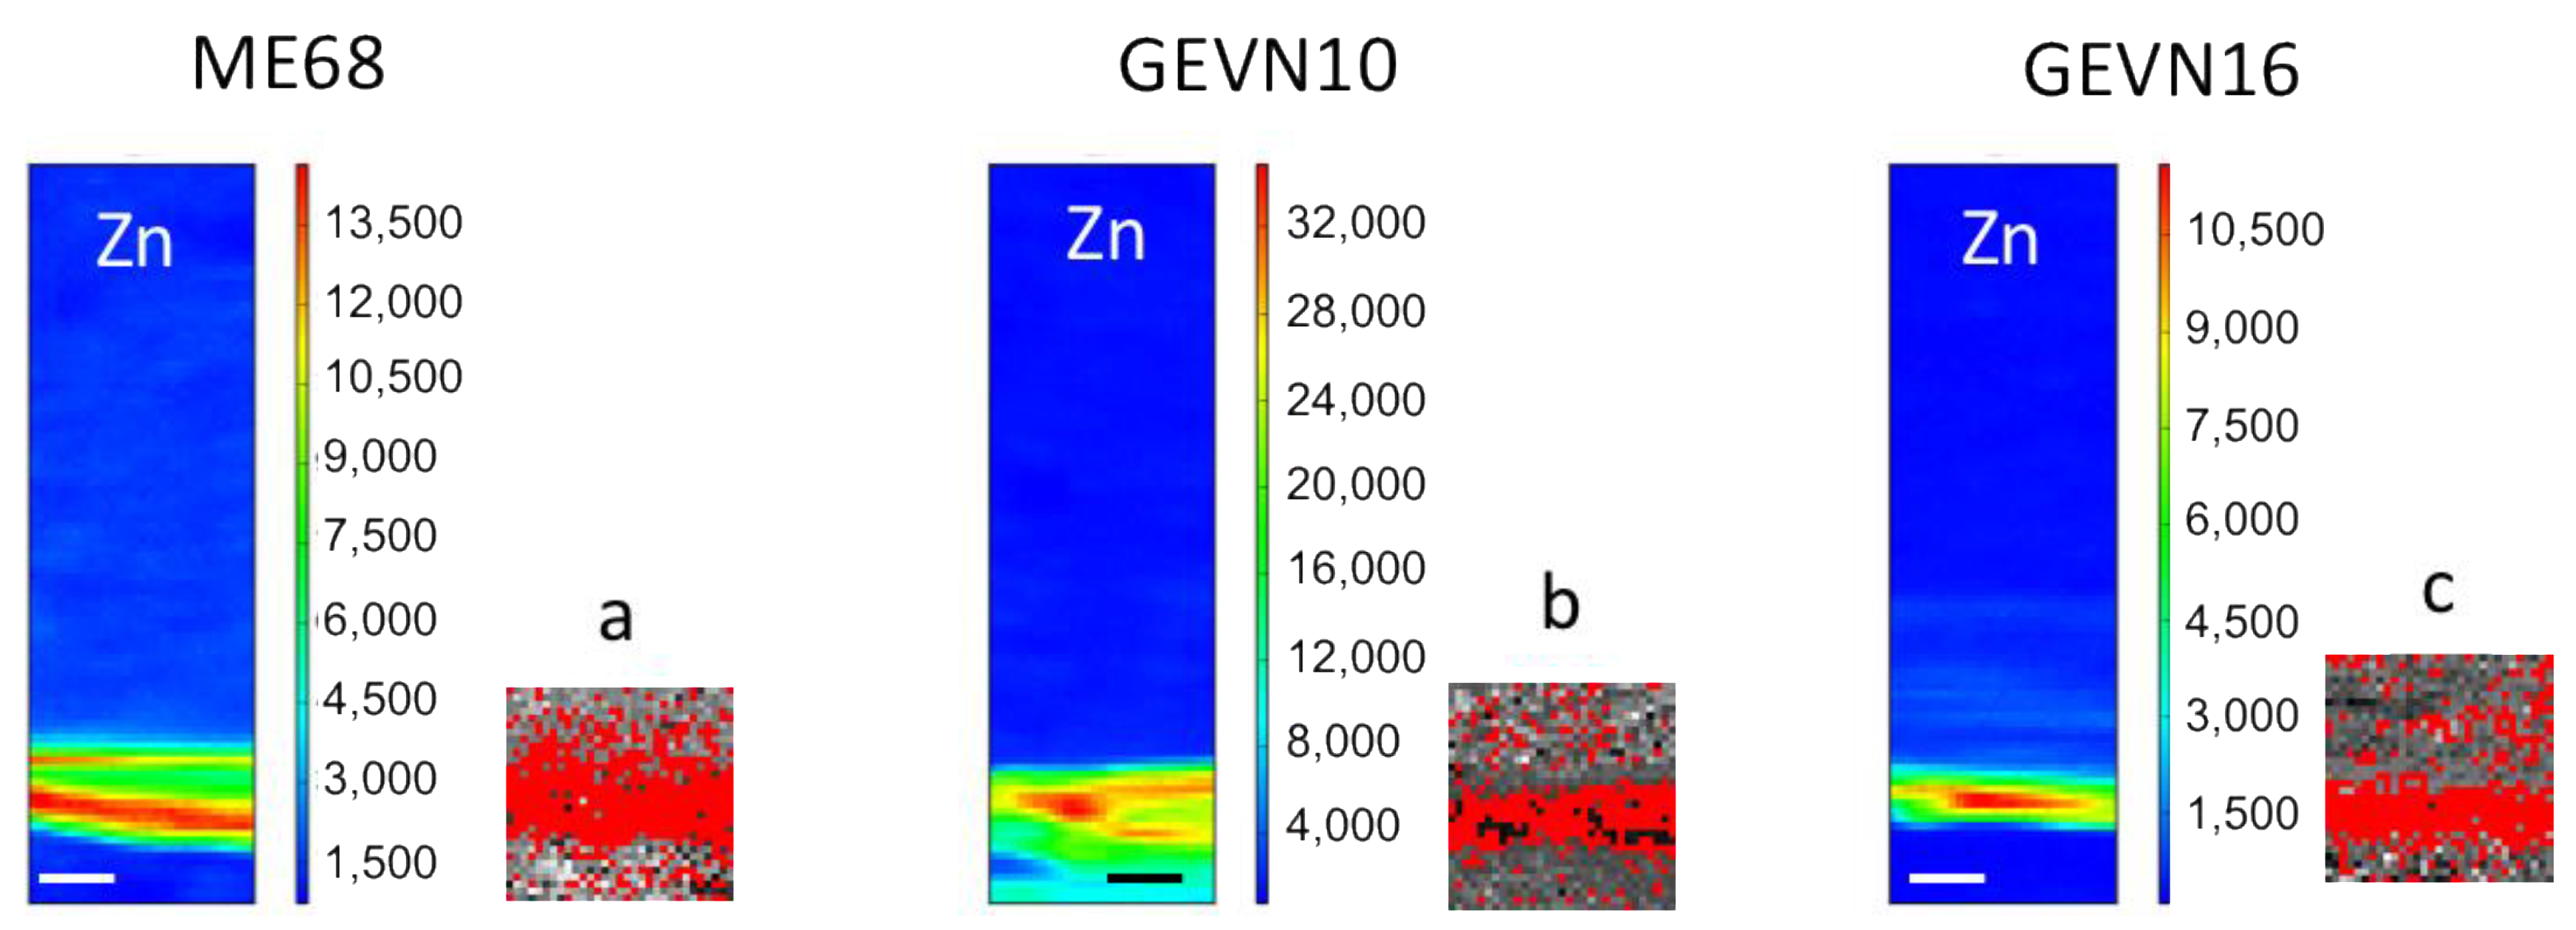
3.2.1. µXRF Maps

µXRF maps collected on representative samples of black gloss ceramics allowed to distinguish different productions. It also showed the usefulness of the cross-sectional set-up in data collection to detect enrichment/depletion in gloss vs. clay paste (Figure 1). The different productions examined were thus non-destructively discriminated based on microchemical tracers identified on the black gloss vs. the clay paste.
The thin (~20 μm) shiny, compact, deep black gloss proper of Attic production is characterized by a prominent Fe-based black-gloss, and a clay paste enriched in Ni and Cr. Laconian vessels are characterized by a very thin (about 10 µm) matte black gloss characterized by Fe-rich composition and a clay paste rich in Rb and Ca. The thinner (~15 μm), matte and brownish (even reddish) gloss typical of vessels from the Sicilian Greek colony of Gela is due to Fe-based black-gloss enriched in Rb and Mn, and a K-rich clay paste.
South Italian colonial vessels (Chalcidian and probable Locrian products) showed peculiar features. The matte and compact black/black-bluish gloss is in fact characterized by Fe- and Zn enrichment and a clay paste marked by Ni, Cr signature (less than in Attic products), while Rb, K, Mn in Chalcidian black gloss ceramics. Accordingly, previous mineralogical and geochemical investigations on reference groups assessed characteristics geochemical fingerprints [35,37] for this production, providing criteria based on destructive methods useful to locate the products in the south-Italian Greek colonies (Strait of Messina area and Ionian cost) and discriminate them from Sicilian and Attic ones. However, bulk analysis could not trace a quite interesting chemical marker, which is also useful for ceramic technological studies. The SR based non-invasive investigation revealed this to be a Fe-Zn-rich black gloss.

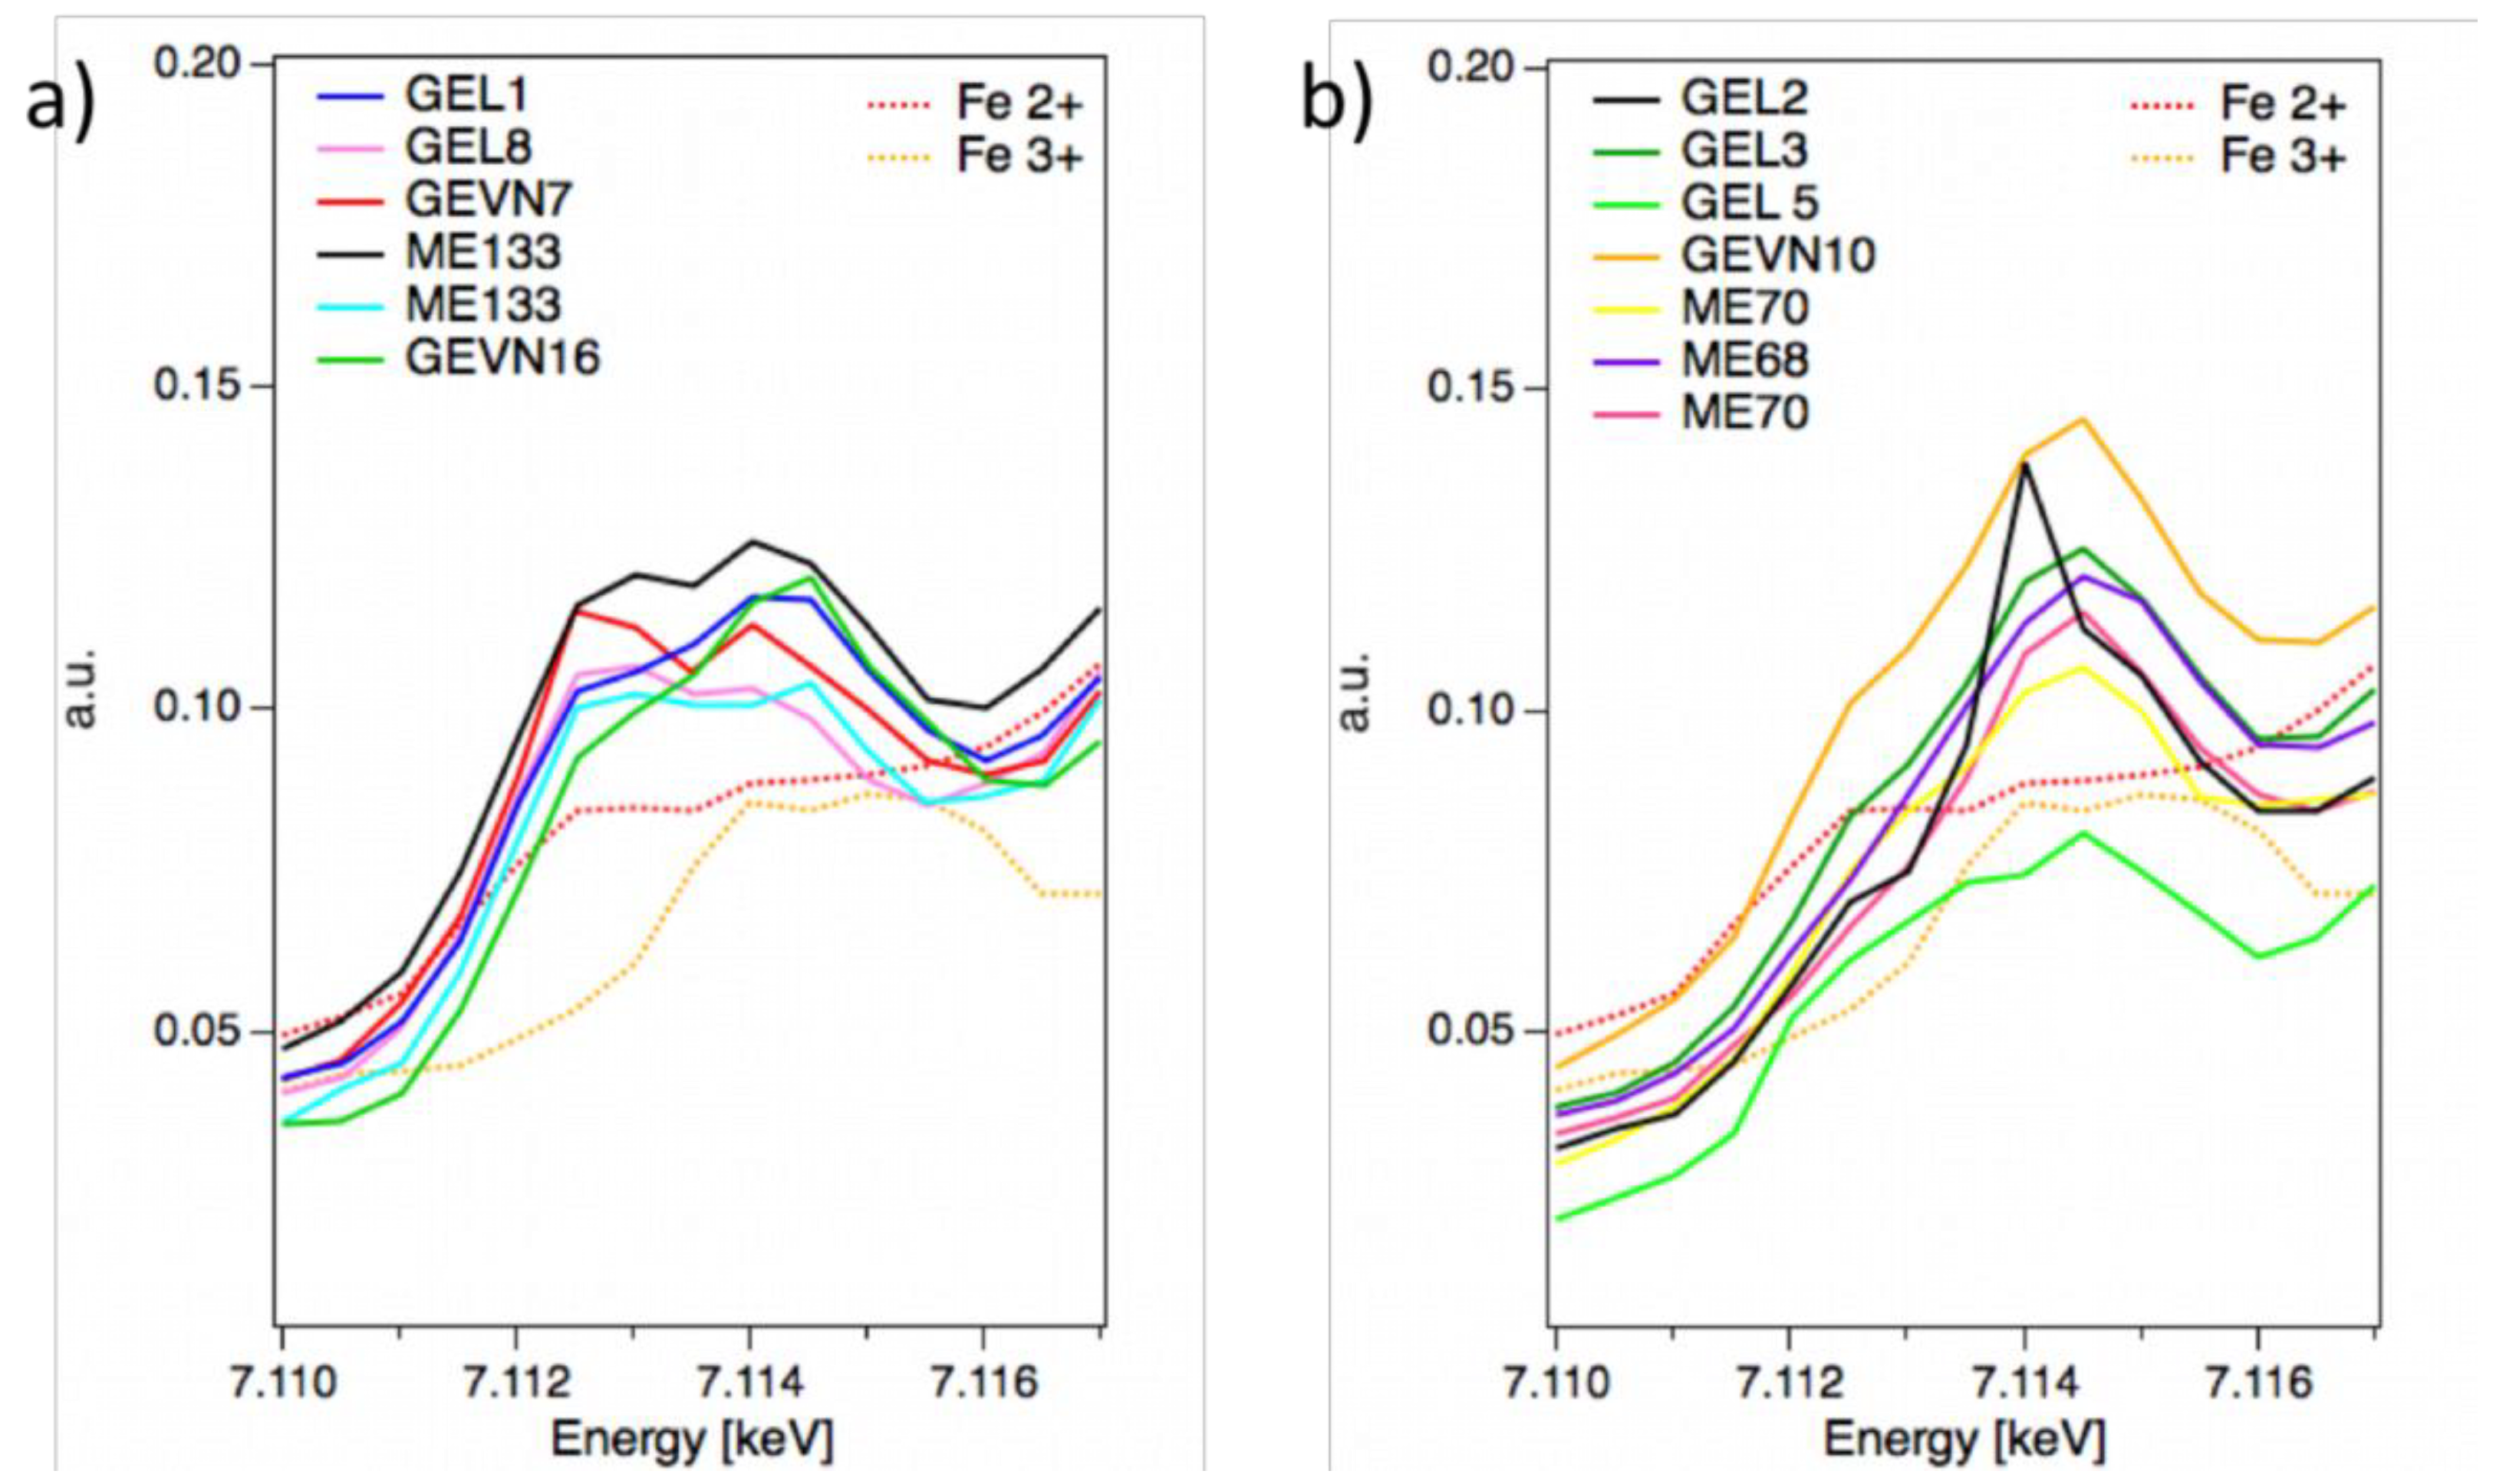
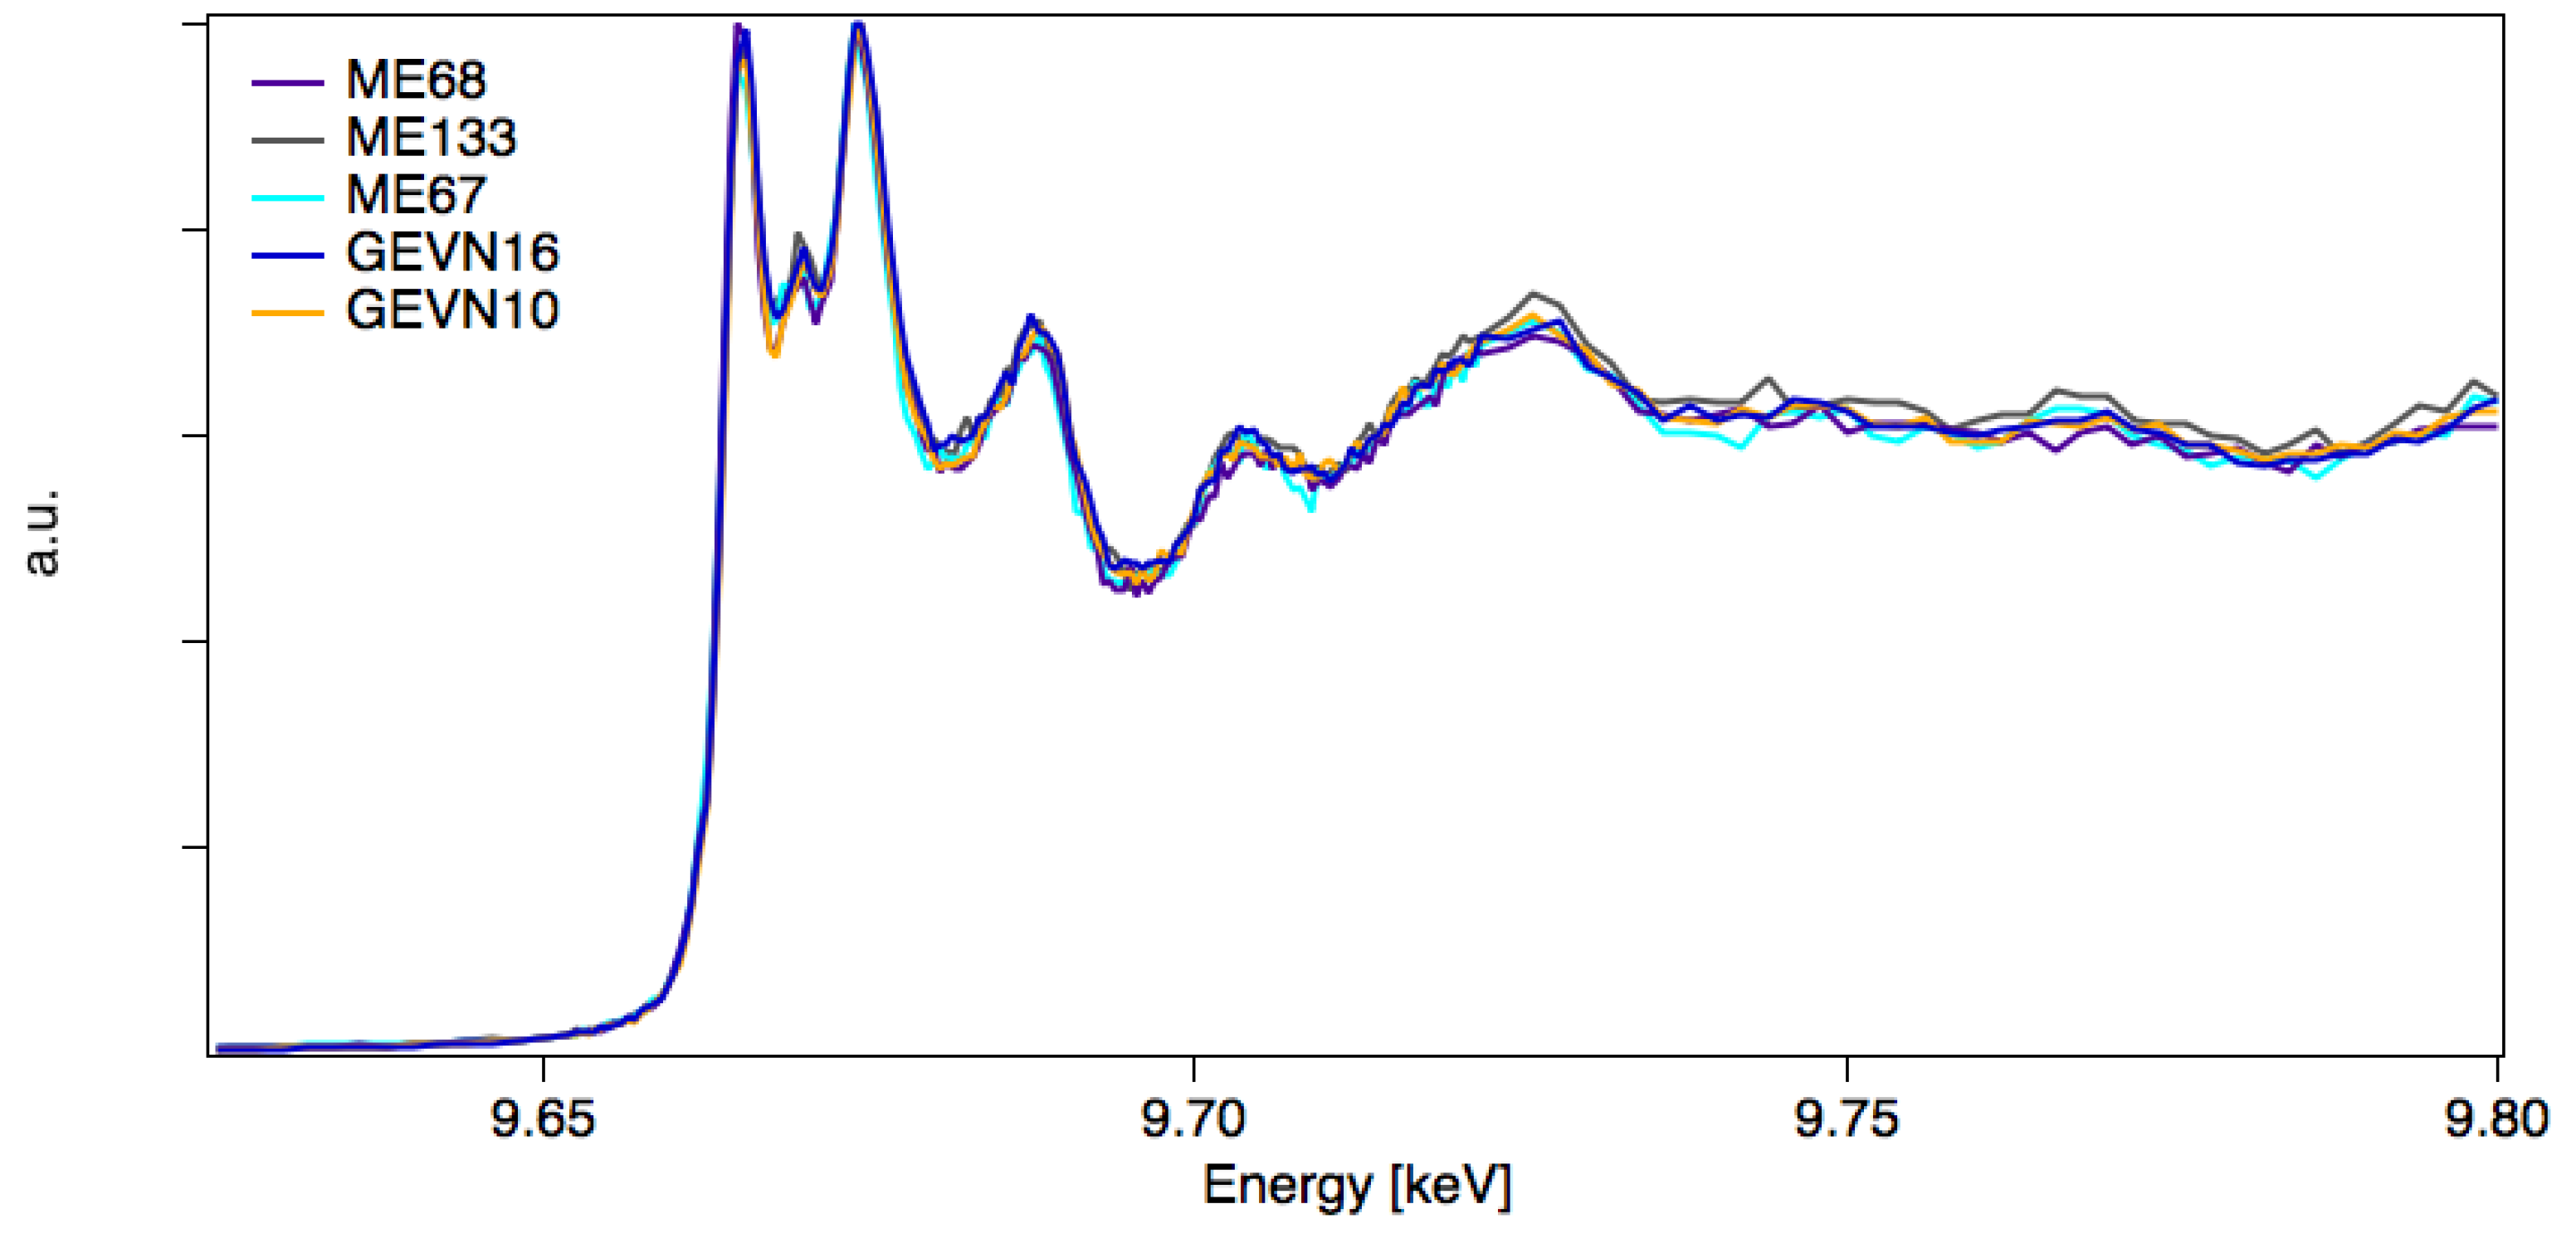
3.2.2. µXANES Spectra and Maps

XANES Fe K-edge spectra acquired on the black gloss layer—with the sample cross-section facing the incoming beam—show the presence of both Fe2+ and Fe3+ phases, as already found in some of these glosses analysed in our previous work [22]. As it can be seen in Figure 2, spectra collected on Laconian and Chalcidian samples exhibit in some cases (GEL2, GEL3, GEL5, GEVN10, ME68 and ME70) Fe3+ preferentially, while in others (GEL1, GEL8, GEVN7, GEVN16, ME67 and ME133) a mixture of both phases. This is visible both in the pre-edge (panels in Figure 2a,b) and edge analysis (Figure S2).
XANES Fe-K edge maps collected on ME68, ME70, GEVN7, GEVN, GEVN16, GEL2 and GEL5 samples in cross-section geometry add further information to the point XANES spectra. We collected XRF maps at different energies across Fe K-edge. After normalization, we could discriminate whether Fe3+ is the dominant phase by differentiating energies E1 and E2 in Figure S3. The processing is shown in Figure 3, where each differential map is depicted beside its corresponding Fe maps acquired at 18 keV in cross-section geometry. GEVN7 shows a sharp gloss layer where the ratios between the abovementioned energies implies a combination of both Fe2+ and Fe3+, followed by GEVN16 where Fe2+ is present but in less proportion. It is followed by GEVN10 and GEL2, where the gloss layer is less defined (see corresponding Fe map) and finally ME68, where the ratio varies along the gloss layer indicating a slight inhomogeneity between the Fe2+ and Fe3+ distribution. In GEL2 and ME70 the ratio between the two energies is smaller, highlighting a more pronounced predominance of Fe3+ over Fe2+. Overall, the Fe XANES maps confirm the single point XANES spectra but allow a better special visualization of the distribution of the ratio between the two phases.
Zn-edge XANES spectra were also collected in cross-section mode on a sub-set of the glosses exhibiting Zn on the gloss surface. All of them show a very similar spectrum (Figure 4), which can be mainly attributed to ZnAl2O4 (Figure S4). Point XANES spectra were collected also on other glosses (ME67, ME70 and ME133). Even if the spectra turned out to be noisy due to lower Zn content they also confirm the presence of mainly ZnAl2O4.
XANES Zn-K edge maps collected on GEVN10, GEVN16, ME68—as example of the so-called Chalcidian products (southern Calabria and the Strait of Messina area)—show a predominance of ZnAl2O4 along all the gloss surface layer, as also found in [43]. Figure 5 shows the Zn XRF maps in all three samples and the obtained distribution of ZnAl2O4 phase, shown in red in panels a, b and c, respectively. The last image was obtained by differential imaging evaluating the ratios between different peaks identified from reference standards spectra (Figure S4), as successfully used in [44]. In particular we evaluated the ratios between the peaks 3 to 2, 3 to 1 and 2 to 1, which turned out to be bigger than one for the first two ratios and very close to one for the last one, confirming ZnAl2O4 phase on the surface.

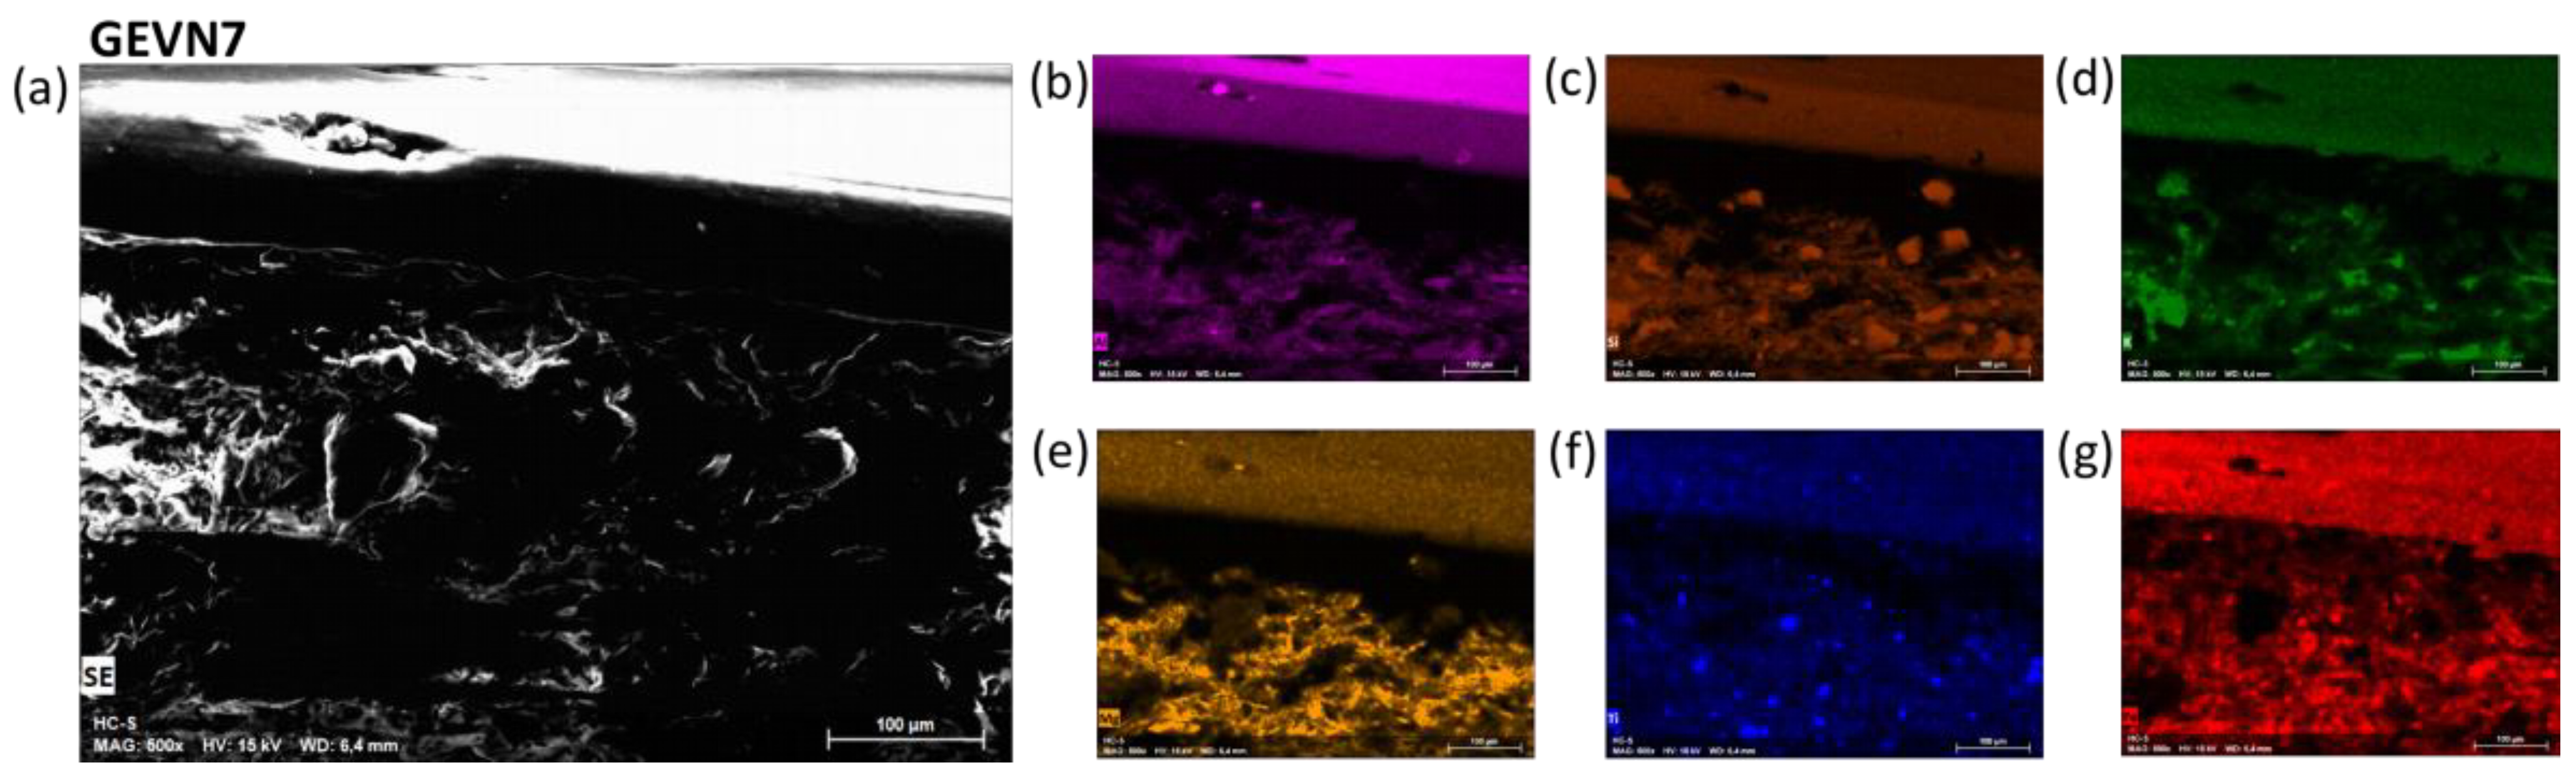
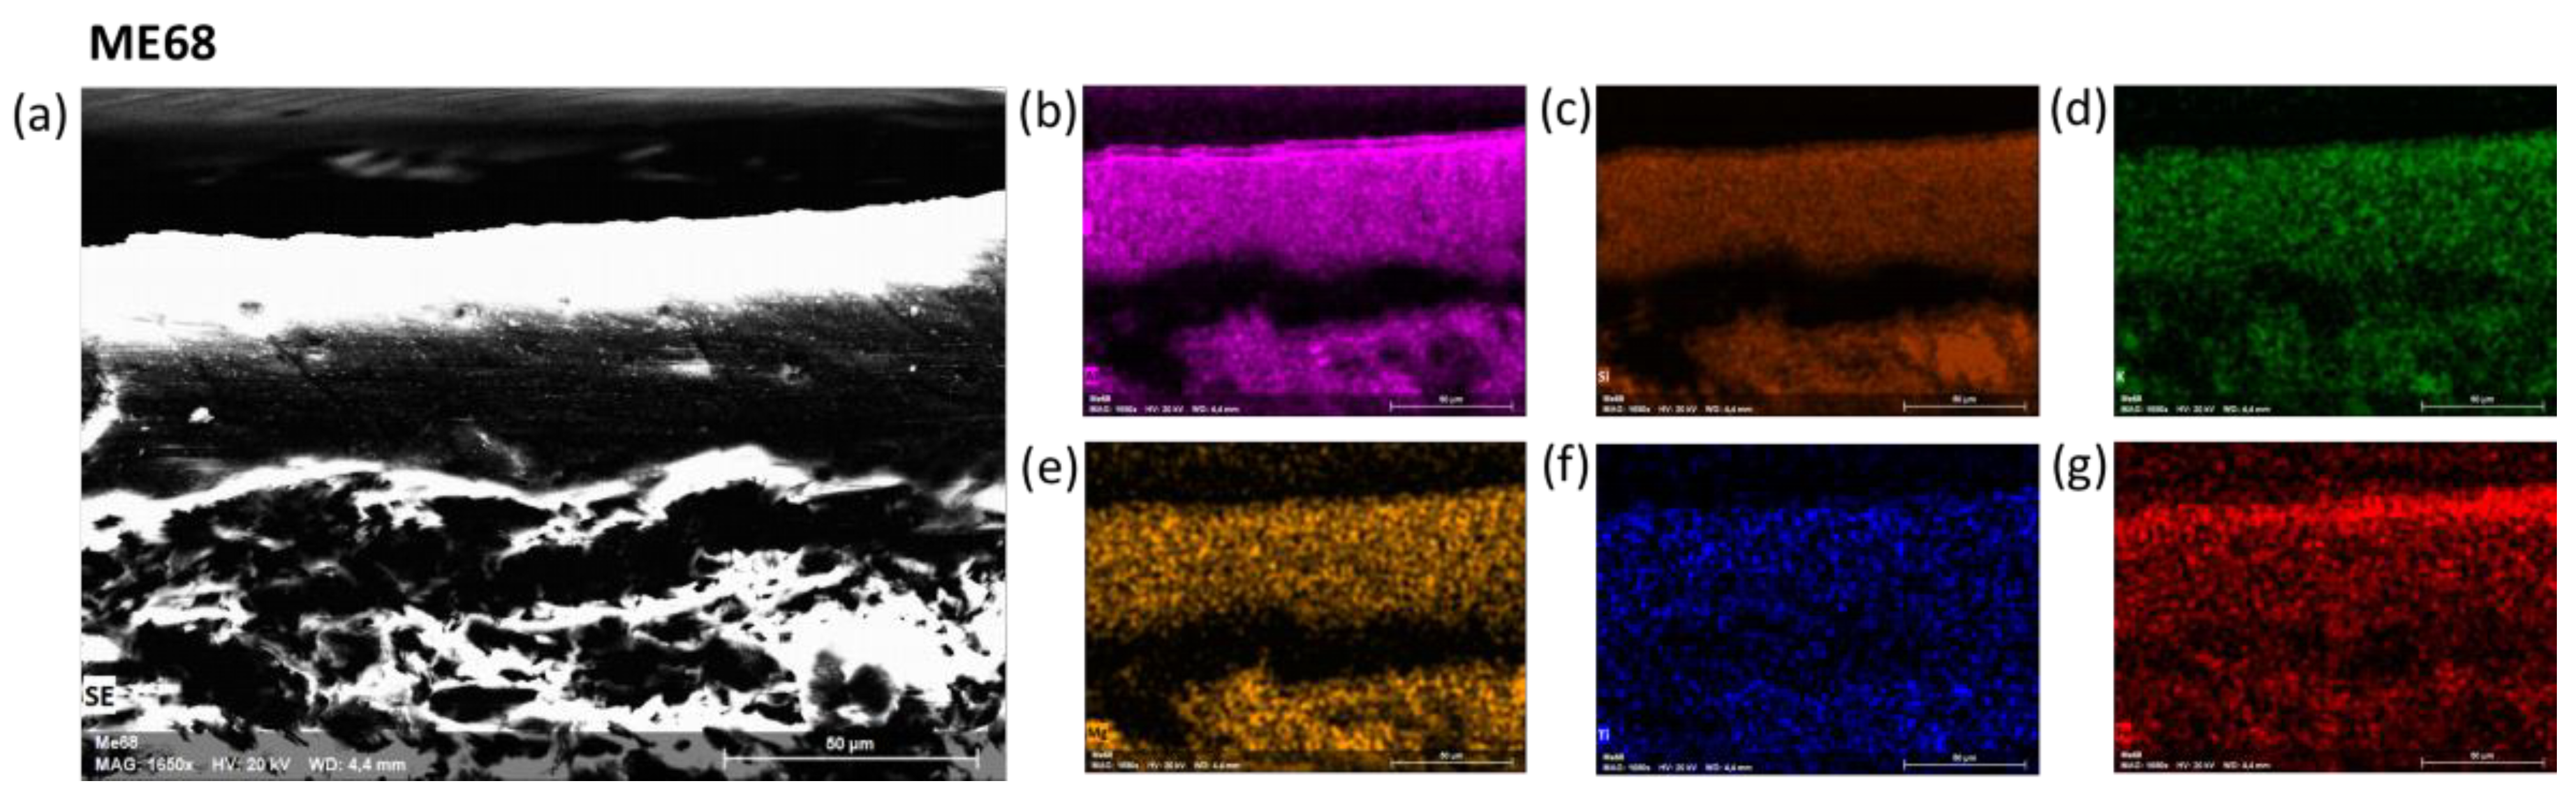
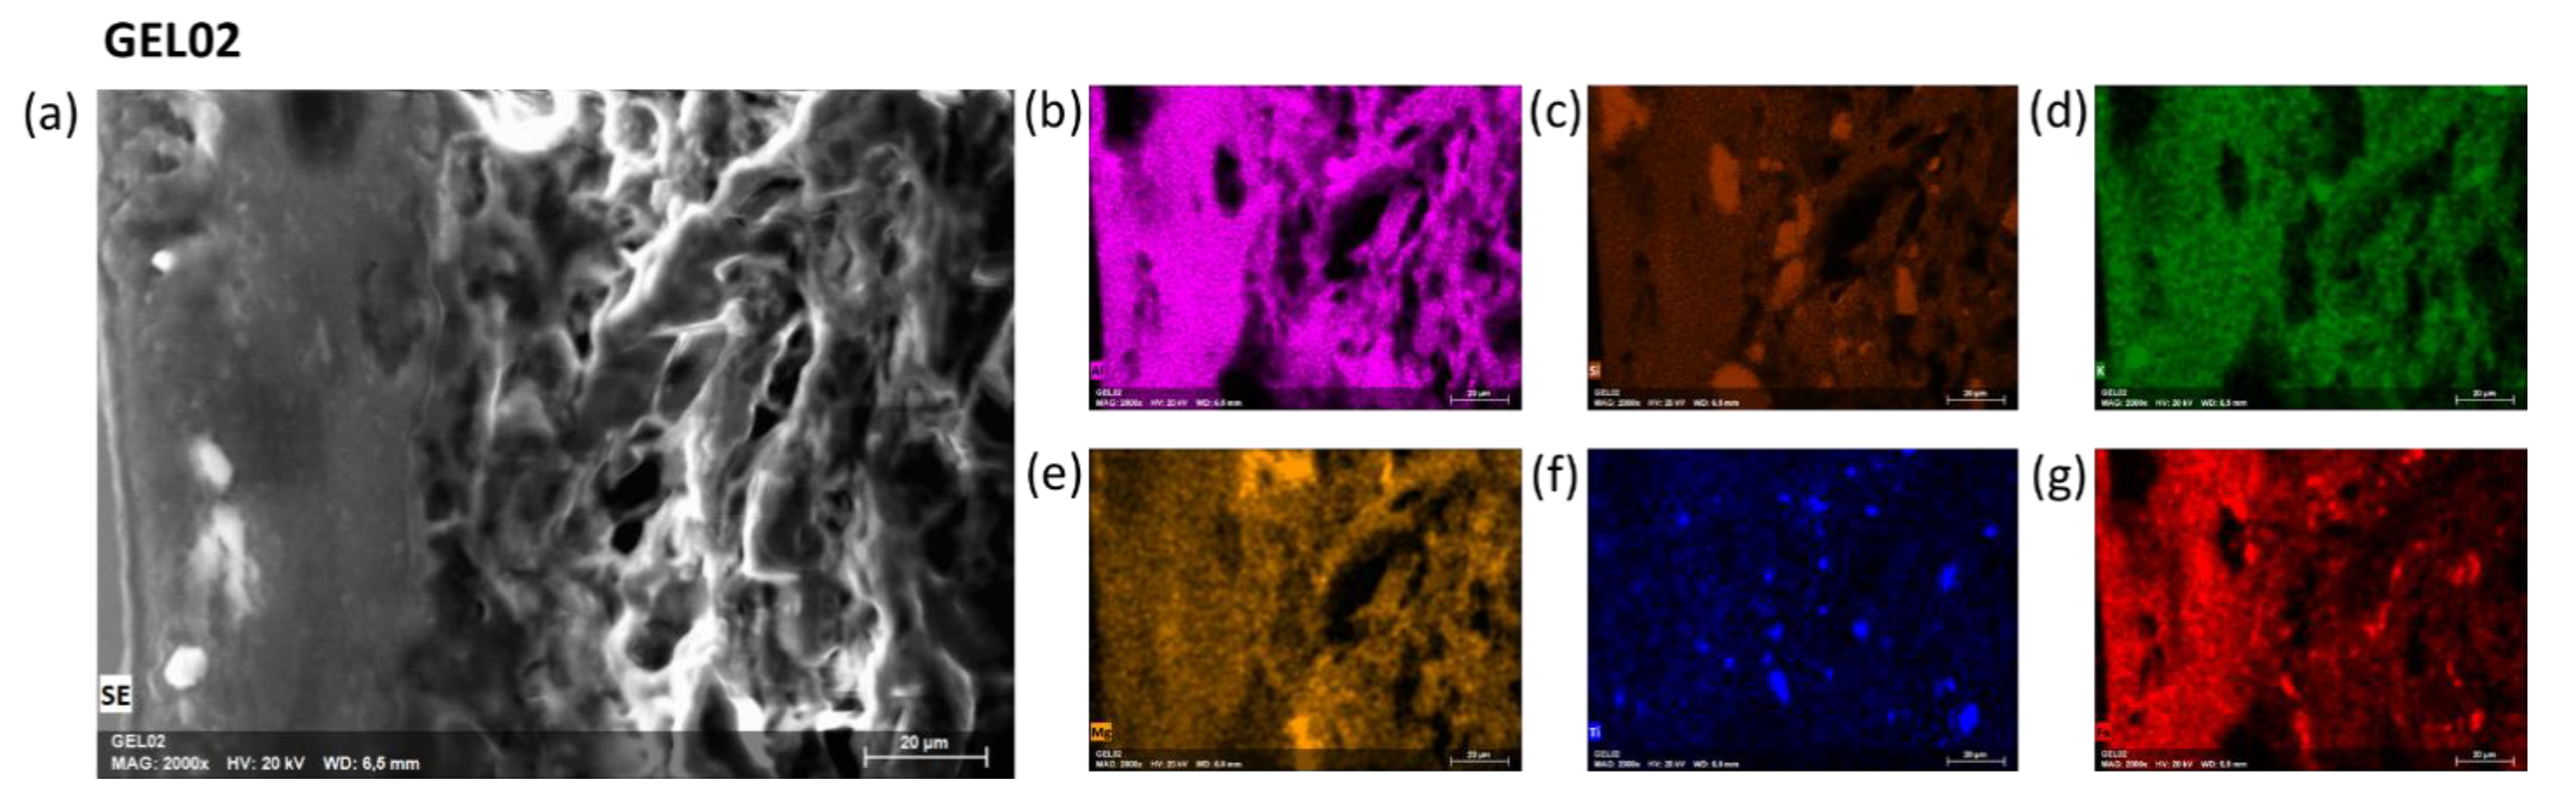
3.3. Comparative SEM-EDS Analysis

Morphological and microchemical characterization of the slip has been determined by SEM-EDS measurements. SEM images and chemical maps show the distribution of Al, Si, K, Mg, Ti and Fe both on the slip and the clay paste (Figure 6, Figure 7 and Figure 8). In all the inspected samples, the clay paste is highly vitrified, claiming for ~900–950 °C maximum firing temperature at the oxidizing conditions. The gloss is smooth and mainly composed by Si, Al, Fe and K. It is quite uniform in Attic production (Figure 6), showing a sharp separation from the body. In colonial South-Italian (southern Calabria and the Strait of Messina area; Figure 7) and Laconian (Figure 8) products the gloss layer fades out into the body, indicating a different technological routine during the first oxidizing stage. In the black-gloss, Mg and Ti are also present, possibly related to Fe-substitution. Looking at the silica, alumina and Fe contents, the Laconian products have lower tenors in these elements, which indicate the provenance of clays used for the black gloss (Figure S5). For the other products, no substantial differences can be appreciated, while groups are clearly discriminated by coupled µXRF and µXANES maps (Table 3).

4. Discussion

From experimental studies it is known that in order to obtain a good quality black gloss ceramic a multi-phase firing process it is required, with a precise control of temperature and firing duration during each ORO (oxidizing-reducing-oxidizing) phase. These parameters also affect the final appearance of the black gloss, turning from bluish to brownish red [31,45]. Generally speaking, if the slip is «well-made», no hematite or maghemite (Fe3+) is formed and only Fe2+ should be present. Otherwise, if Fe3+ phases are present, the location of the different Fe-phases inside the gloss is of interest. Fe3+ phases usually form a thin slip under/on the top of the black-gloss. When other phases are present—likely the Zn-spinel phases observed in south-Italian products—it is relevant to investigate their mineralogical nature and their location inside the gloss thickness.
The results of this investigation evidenced that in Attic vessels the Fe-based black gloss is mainly due to magnetite and hercynite, indicating an ideal and well-made production routine. On the other hand, in Sicilian colonial vessels (Geloan) prevalently hematite has been found, indicating a different technological signature for the black-gloss, which in fact appears quite different in its aesthetical features (matte and brownish red). As per South-Italian workshops and Laconian products, in some cases only hercynite has been found, indicating well-made pieces. In other cases, Fe3+—diffusely distributed on the gloss thickness—would indicate not perfectly assessed production routines or unstable conditions in ancient kilns.
Overall, South-Italian workshops (Chalcidian and probably Locrian) seem to be discriminated for their Zn signature, indicating a shared fabrication method in these colonies. In fact, as suggested by the literature, Zn could be considered not only a provenance tracer but a technological marker, related to the clay refinement methods [43]. Other studies would correlate the Zn occurrence as typical of specific Greek clays used for the black gloss [46], however, from our characterization studies, such higher Zn traces have to be considered as specific of South-Italian products. XANES spectra and maps collected on these samples revealed the nature of Zn-spinel as ZnAl2O4 (Gahnite) which is localized over the entire gloss thickness. Experimental studies would be highly useful to better understand the technological choices behind these specific colonial products.

5. Conclusions

Synchrotron X-ray microprobes offers challenging methods for ancient materials characterization studies. In the last years, numerous set-ups have been optimized for CH applications, thus enlarging the current research perspectives.
In ancient ceramics studies, X-ray SR based methods might be able to help answering relevant question related to provenance and technology. Such information can be achieved by combining at least two different methods, with the selection primarily being dependent on (i) the availability of samples/sampling allowance (e.g., entire vessels vs. micro-samples, or cross-sections and microtome samples) (ii) sample preparation and (iii) the length scale required (from the whole clay paste or glaze composition to the detection of crystallites or other textural/composition features into micro or nano layers).
µXRF and µXANES mapping at synchrotron X-ray microprobes can be an ideal combination, especially when no sample preparation is allowed, small fragments are available and a non-destructive approach of the samples is required. Samples can be scanned rapidly in different geometries, for example in cross-section to map elements localization on different layers. The 2D micro-chemical and phase-distribution maps might reveal the location of relevant geochemical tracers—both provenance and technology related—and can be also used for selecting regions of interest in XANES analysis in fluorescence mode. Then, µXANES spectra and maps can be useful in localizing mineral phase distributions and provide relevant information to the better understanding of technological issues in specific ceramic class manufacture. All this work can be carried out by the guidance and screening provided by XRF analyses, which, by being a multi-elemental technique, allows inspecting the samples and determining which sites are the most relevant for µXANES spectra and maps.
The selected case study appears quite meaningful, both in term of archaeological relevance and practical issues. Black gloss ceramics—along with red and black figures vessels—usually include particularly exquisite corpora and rare masterpieces that cannot be sampled or sacrificed for destructive analysis. In addition, classification is still based on typological or style features, thus imposing the development of a new and—hopefully—non-destructive approach for the correct production site identification, especially among the well-known colonial workshops. The combination of XRF and XANES mapping methods with micrometric resolution was able to provide geochemical fingerprints for provenance determination and phase analysis for technological studies, which would benefit by experimental archaeology tests for further information. The comparison with classical microchemical methods pointed out the merits of such an approach, suggesting that even portable X-ray methods might enable fast and preliminary classification useful in defining criteria for micro-sampling operation.
Continuous advances in X-ray microprobes associated with SR source upgrades will allow for even more powerful imaging and spectroscopic methods. In the coming future, the third and fourth generation SR sources will offer increasing opportunities for analyzing tiny and complex objects, which are typical among cultural heritage materials, in a faster way and with higher resolutions.

Supplementary Materials

The following are available online at www.mdpi.com/article/10.3390/app11178052/s1, Figure S1: portable XRF maps acquired by Elio ©Bruker. Figure S2: Fe-XANES point spectra collected on the gloss in cross-section geometry for GEVN (a), GEL (b) and ME (c) samples. The spectra were collected on a 3 µm × 5 µm area, across Fe K-edge, as detailed in materials and methods. Figure S3: Fe-XANES spectra of Fe2+ and Fe3+ standard with the indication of the two energies E1 (7127 eV) and E2 (7132 eV), used to differentiate the contribution of the two phases in the XRF Fe XANES maps shown in Figure 3. Figure S4: Zn K-edge XANES reference spectra from [43] where we indicated the energies chosen for the Zn XANES maps, later used to identify the predominant phase. Figure S5: Si/Al and Fe(Si+Al) tenors in a selection of black gloss representative of the different identified products.

Author Contributions

Conceptualization, A.G. and S.R.; methodology, A.G., S.R. and S.S.; software, A.G. and S.R.; validation, A.G., S.R. and M.L.; formal analysis, A.G., G.K. and S.R.; investigation, A.G., S.R., M.L. and S.S.; resources, A.G., S.R. and S.S.; data curation, A.G., G.K. and S.R.; writing—original draft preparation, A.G. and S.R.; writing—review and editing, A.G., S.S., A.S., G.B., P.M., S.R. and M.L.; visualization, A.G., S.S., A.S., G.B., P.M. and S.R.; supervision, A.G. and S.R.; project administration, A.G.; funding acquisition, A.G. All authors have read and agreed to the published version of the manuscript.

Funding

This research received no external funding.

Institutional Review Board Statement

Not applicable.

Informed Consent Statement

Not applicable.

Data Availability Statement

The data presented in this study are available on request from the corresponding author. The data are not publicly available due to privacy reasons including an embargo period according to the facility’s scientific data policy.

Acknowledgments

The research leading to these results has received a financial support in the framework of the EU CALIPSOplus TransNational Access programme. We acknowledge SOLEIL for provision of synchrotron radiation facilities.

Conflicts of Interest

The authors declare no conflict of interest.

References

  1. Shackley, M.S. (Ed.) X-ray Fluorescence Spectrometry (XRF) in Geoarchaeology; Springer: New York, NY, USA, 2011; ISBN 978-1-4419-6885-2. [Google Scholar]
  2. Mantler, M.; Schreiner, M. X-ray Fluorescence Spectrometry in Art and Archaeology. X-ray Spectrom. 2000, 29, 3–17. [Google Scholar] [CrossRef]
  3. Hall, M.E. X-ray Fluorescence-Energy Dispersive (ED-XRF) and Wavelength Dispersive (WD-XRF) Spectrometry. In The Oxford Handbook of Archaeological Ceramic Analysis; Hunt, A., Ed.; Oxford University Press: Oxford, UK, 2017; ISBN 978-0-19-968153-2. [Google Scholar]
  4. Maritan, L. Archaeo-Ceramic 2.0: Investigating Ancient Ceramics Using Modern Technological Approaches. Archaeol. Anthropol. Sci. 2019, 11, 5085–5093. [Google Scholar] [CrossRef]
  5. Hein, A.; Tsolakidou, A.; Iliopoulos, I.; Mommsen, H.; Buxeda i Garrigós, J.; Montana, G.; Kilikoglou, V. Standardisation of Elemental Analytical Techniques Applied to Provenance Studies of Archaeological Ceramics: An Inter Laboratory Calibration Study. Analyst 2002, 127, 542–553. [Google Scholar] [CrossRef] [Green Version]
  6. Waksman, Y. Provenance Studies: Productions and Compositional Groups. In The Oxford Handbook of Archaeological Ceramic Analysis; Hunt, A., Ed.; Oxford University Press: Oxford, UK, 2015; pp. 1–18. [Google Scholar]
  7. Barone, G.; Mazzoleni, P.; Spagnolo, G.V.; Raneri, S. Artificial Neural Network for the Provenance Study of Archaeological Ceramics Using Clay Sediment Database. J. Cult. Herit. 2019, 38, 147–157. [Google Scholar] [CrossRef]
  8. De Bonis, A.; Arienzo, I.; D’Antonio, M.; Franciosi, L.; Germinario, C.; Grifa, C.; Guarino, V.; Langella, A.; Morra, V. Sr-Nd Isotopic Fingerprinting as a Tool for Ceramic Provenance: Its Application on Raw Materials, Ceramic Replicas and Ancient Pottery. J. Archaeol. Sci. 2018, 94, 51–59. [Google Scholar] [CrossRef]
  9. Renson, V.; Slane, K.W.; Rautman, M.L.; Kidd, B.; Guthrie, J.; Glascock, M.D. Pottery Provenance in the Eastern Mediterranean Using Lead Isotopes. Archaeometry 2016, 58, 54–67. [Google Scholar] [CrossRef]
  10. Vandenabeele, P.; Donais, M.K. Mobile Spectroscopic Instrumentation in Archaeometry Research. Appl. Spectrosc. 2016, 70, 27–41. [Google Scholar] [CrossRef] [PubMed]
  11. Holmqvist, E. Handheld Portable Energy-Dispersive X-ray Fluorescence Spectrometry (pXRF). In The Oxford Handbook of Archaeological Ceramic Analysis; Hunt, A., Ed.; Oxford University Press: Oxford, UK, 2015; pp. 1–23. [Google Scholar]
  12. Gianoncelli, A.; Castaing, J.; Ortega, L.; Dooryhée, E.; Salomon, J.; Walter, P.; Hodeau, J.-L.; Bordet, P. A Portable Instrument for in Situ Determination of the Chemical and Phase Compositions of Cultural Heritage Objects. X-ray Spectrom. 2008, 37, 418–423. [Google Scholar] [CrossRef]
  13. Hunt, A.M.W.; Speakman, R.J. Portable XRF Analysis of Archaeological Sediments and Ceramics. J. Archaeol. Sci. 2015, 53, 626–638. [Google Scholar] [CrossRef]
  14. Alfeld, M.; Pedroso, J.V.; van Eikema Hommes, M.; Van der Snickt, G.; Tauber, G.; Blaas, J.; Haschke, M.; Erler, K.; Dik, J.; Janssens, K. A Mobile Instrument for in Situ Scanning Macro-XRF Investigation of Historical Paintings. J. Anal. At. Spectrom. 2013, 28, 760–767. [Google Scholar] [CrossRef]
  15. Romano, F.P.; Caliri, C.; Cosentino, L.; Gammino, S.; Giuntini, L.; Mascali, D.; Neri, L.; Pappalardo, L.; Rizzo, F.; Taccetti, F. Macro and Micro Full Field X-ray Fluorescence with an X-ray Pinhole Camera Presenting High Energy and High Spatial Resolution. Anal. Chem. 2014, 86, 10892–10899. [Google Scholar] [CrossRef]
  16. Romano, F.P.; Janssens, K. Preface to the Special Issue on: MA-XRF “Developments and Applications of Macro-XRF in Conservation, Art, and Archeology” (Trieste, Italy, 24 and 25 September 2017). X-ray Spectrom. 2019, 48, 249–250. [Google Scholar] [CrossRef]
  17. Janssens, K.; Cotte, M. Using Synchrotron Radiation for Characterization of Cultural Heritage Materials. In Synchrotron Light Sources and Free-Electron Lasers: Accelerator Physics, Instrumentation and Science Applications; Jaeschke, E.J., Khan, S., Schneider, J.R., Hastings, J.B., Eds.; Springer International Publishing: Cham, Switzerland, 2020; pp. 2457–2483. ISBN 978-3-030-23201-6. [Google Scholar]
  18. Bertrand, L.; Robinet, L.; Thoury, M.; Janssens, K.; Cohen, S.X.; Schöder, S. Cultural Heritage and Archaeology Materials Studied by Synchrotron Spectroscopy and Imaging. Appl. Phys. A 2012, 106, 377–396. [Google Scholar] [CrossRef]
  19. Adams, F.; Janssens, K.; Snigirev, A. Microscopic X-ray Fluorescence Analysis and Related Methods with Laboratory and Synchrotron Radiation Sources. J. Anal. At. Spectrom. 1998, 13, 319–331. [Google Scholar] [CrossRef]
  20. Cotte, M.; Genty-Vincent, A.; Janssens, K.; Susini, J. Applications of Synchrotron X-ray Nano-Probes in the Field of Cultural Heritage. C. R. Phys. 2018, 19, 575–588. [Google Scholar] [CrossRef]
  21. Cotte, M.; Pouyet, E.; Salomé, M.; Rivard, C.; Nolf, W.D.; Castillo-Michel, H.; Fabris, T.; Monico, L.; Janssens, K.; Wang, T.; et al. The ID21 X-ray and Infrared Microscopy Beamline at the ESRF: Status and Recent Applications to Artistic Materials. J. Anal. At. Spectrom. 2017, 32, 477–493. [Google Scholar] [CrossRef]
  22. Gianoncelli, A.; Raneri, S.; Schoeder, S.; Okbinoglu, T.; Barone, G.; Santostefano, A.; Mazzoleni, P. Synchrotron Μ-XRF Imaging and µXANES of Black-Glazed Wares at the PUMA Beamline: Insights on Technological Markers for Colonial Productions. Microchem. J. 2020, 154, 104629. [Google Scholar] [CrossRef]
  23. Bertrand, L.; Cohen, S.X.; Thoury, M.; David, S.; Schoeder, S. IPANEMA, Un Laboratoire Dédié à l’étude Des Matériaux Anciens et Patrimoniaux Par Méthodes Synchrotron. Reflets Phys. 2019, 63, 21. [Google Scholar] [CrossRef]
  24. Sciau, P.; Goudeau, P.; Tamura, N.; Dooryhee, E. Micro Scanning X-ray Diffraction Study of Gallo-Roman Terra Sigillata Ceramics. Appl. Phys. A 2006, 83, 219–224. [Google Scholar] [CrossRef]
  25. Gliozzo, E.; Kirkman, I.W.; Pantos, E.; Turbanti, I.M. Black Gloss Pottery: Production Sites and Technology in Northern Etruria, Part II: Gloss Technology. Archaeometry 2004, 46, 227–246. [Google Scholar] [CrossRef]
  26. Pradell, T.; Molera, J.; Salvadó, N.; Labrador, A. Synchrotron Radiation Micro-XRD in the Study of Glaze Technology. Appl. Phys. A 2010, 99, 407–417. [Google Scholar] [CrossRef]
  27. Farges, F.; Cotte, M. X-ray Absorption Spectroscopy and Cultural Heritage: Highlights and Perspectives. In X-ray Absorption and X-ray Emission Spectroscopy; van Bokhoven, J.A., Lamberti, C., Eds.; John Wiley & Sons, Ltd.: Hoboken, NJ, USA, 2016; pp. 609–636. ISBN 978-1-118-84424-3. [Google Scholar]
  28. Sciau, P.; Wang, T. Full-Field Transmission X-ray Microspectroscopy (FF-XANES) Applied to Cultural Heritage Materials: The Case of Ancient Ceramics; IntechOpen: London, UK, 2019; ISBN 978-1-83880-442-8. [Google Scholar]
  29. Sciau, P.; Leon, Y.; Goudeau, P.; Fakra, S.C.; Webb, S.; Mehta, A. Reverse Engineering the Ancient Ceramic Technology Based on X-ray Fluorescence Spectromicroscopy. J. Anal. At. Spectrom. 2011, 26, 969–976. [Google Scholar] [CrossRef] [Green Version]
  30. Meirer, F.; Liu, Y.; Pouyet, E.; Fayard, B.; Cotte, M.; Sanchez, C.; Andrews, J.C.; Mehta, A.; Sciau, P. Full-Field XANES Analysis of Roman Ceramics to Estimate Firing Conditions—A Novel Probe to Study Hierarchical Heterogeneous Materials. J. Anal. At. Spectrom. 2013, 28, 1870–1883. [Google Scholar] [CrossRef]
  31. Cianchetta, I.; Maish, J.; Saunders, D.; Walton, M.; Mehta, A.; Foran, B.; Trentelman, K. Investigating the Firing Protocol of Athenian Pottery Production: A Raman Study of Replicate and Ancient Sherds. J. Raman Spectrosc. 2015, 46, 996–1002. [Google Scholar] [CrossRef]
  32. Cianchetta, I.; Trentelman, K.; Maish, J.; Saunders, D.; Foran, B.; Walton, M.; Sciau, P.; Wang, T.; Pouyet, E.; Cotte, M.; et al. Evidence for an Unorthodox Firing Sequence Employed by the Berlin Painter: Deciphering Ancient Ceramic Firing Conditions through High-Resolution Material Characterization and Replication. J. Anal. At. Spectrom. 2015, 30, 666–676. [Google Scholar] [CrossRef] [Green Version]
  33. Bertrand, L.; Cotte, M.; Stampanoni, M.; Thoury, M.; Marone, F.; Schöeder, S. Development and Trends in Synchrotron Studies of Ancient and Historical Materials. Phys. Rep. 2012, 519, 51–96. [Google Scholar] [CrossRef]
  34. Iozzo, M. Ceramica “Calcidese”. Nuovi Documenti e Problemi Riproposti. Atti e Memorie della Società Magna Grecia, III s., II (1993); John Wiley & Sons, Inc.: Roma, Italy, 1994. [Google Scholar]
  35. Barone, G.; Ioppolo, S.; Majolino, D.; Branca, C.; Sannino, L.; Spagnolo, G.; Tigano, G. Archaeometric Analyses on Pottery from Archaeological Excavations in Messina (Sicily, Italy) from the Greek Archaic to the Medieval Age. Period. Mineral. 2005, 74, 11–41. [Google Scholar]
  36. Tigano, G. IsolatoS. Via Industriale. Lo scavo e i primi dati sui materiali. In Da Zancle a Messina. Un Percorso Archeologico Attraverso Gli Scavi, I; Bacci, G.M., Tigano, G., Eds.; Sicania: Palermo, Italy, 1999; pp. 123–155. [Google Scholar]
  37. Barone, G.; Ioppolo, S.; Majolino, D.; Migliardo, D.; Sannino, L.; Spagnolo, G.; Tigano, G. Contributo allo studio delle ceramiche provenienti dagli scavi di Messina. Risultati preliminari. In Da Zancle a Messina. Un Percorso Archeologico Attraverso Gli Scavi, II; Bacci, G.M., Tigano, G., Eds.; Sicania: Palermo, Italy, 1999; pp. 87–117. [Google Scholar]
  38. Stibbe, C.M. Laconian mixing-bowls: A history of the krater lakonikos from the 7th to the 5th century B.C. In Laconian Black-Glazed Pottery I; Allard Pierson Museum: Amsterdam, The Netherlands, 1989. [Google Scholar]
  39. Stibbe, C.M. Laconian drinking vessels and other open shapes. In Laconian Black-Glazed Pottery II; Allard Pierson Museum: Amsterdam, The Netherlands, 1994. [Google Scholar]
  40. Mirti, P.; Casoli, A. Analysis and classification of ceramic material excavated on a South Italian archaeological site. Ann. Chim. 1995, 85, 519–530. [Google Scholar]
  41. Mirti, P.; Gulmini, M.; Pace, M.; Elia, D. The provenance of red figured vases from Locri Epizephiri (Southern Italy): New evidence by chemical analysis. Archaeometry 2004, 46, 183–200. [Google Scholar] [CrossRef]
  42. Bertrand, L.; Languille, M.-A.; Cohen, S.X.; Robinet, L.; Gervais, C.; Leroy, S.; Bernard, D.; Le Pennec, E.; Josse, W.; Doucet, J.; et al. European Research Platform IPANEMA at the SOLEIL Synchrotron for Ancient and Historical Materials. J. Synchrotron Radiat. 2011, 18, 765–772. [Google Scholar] [CrossRef] [Green Version]
  43. Walton, M.; Trentelman, K.; Cianchetta, I.; Maish, J.; Saunders, D.; Foran, B.; Mehta, A. Zn in Athenian Black Gloss Ceramic Slips: A Trace Element Marker for Fabrication Technology. J. Am. Ceram. Soc. 2015, 98, 430–436. [Google Scholar] [CrossRef]
  44. Tack, P.; Bazi, B.; Vekemans, B.; Okbinoglu, T.; Van Maldeghem, F.; Goderis, S.; Schöder, S.; Vincze, L. Investigation of (Micro) Meteoritic Materials at the New Hard X-ray Imaging PUMA Beamline for Heritage Sciences. J. Synchrotron Radiat. 2019, 26, 2033–2039. [Google Scholar] [CrossRef] [PubMed]
  45. Aloupi-Siotis, E. Ceramic Technology: How to Characterise Black Fe-Based Glass-Ceramic Coatings. Archaeol. Anthropol. Sci. 2020, 12, 191. [Google Scholar] [CrossRef]
  46. Chaviara, A.; Aloupi-Siotis, E. The Story of a Soil That Became a Glaze: Chemical and Microscopic Fingerprints on the Attic Vases. J. Archaeol. Sci. Rep. 2016, 7, 510–518. [Google Scholar] [CrossRef]
Figure 1. RGB correlation considering relevant elemental markers in cross-section geometry for (a) Attic (GEVN9, 100 × 500 µm), (b) Laconian (GEL5, 150 × 500 µm), (c) Sicilian (GEVN15, 100 × 500 µm), (d) Chalcidian (ME68, 150 × 500 µm) and (e) Locrian (?) (GEVN10, 150 × 500 µm) products.
Applsci 11 08052 g001
Figure 2. Fe-XANES spectra acquired on a 3 µm × 4.2 µm spot on the gloss layer of the samples indicated in the legend, all mounted in cross section geometry. Samples of panels (a) exhibit a mixture of both Fe2+ and Fe3+, while samples on panel (b) mainly Fe3+.
Applsci 11 08052 g002
Figure 3. Fe XRF maps of sample GEVN7, GEVN10, GEVN16, ME68, ME70, GEL2 and GEL5 in cross section geometry, together with the corresponding distribution of the ratio between the maps collected at 7127 eV and 7132 eV. Scale bar is 50 µm and is valid for all images.
Applsci 11 08052 g003
Figure 4. Zn XANES spectra acquired on a 3 µm × 4.2 µm spot on the gloss layer of samples ME68, ME133, ME67, GEVN10 and GEVN16 in cross section geometry.
Applsci 11 08052 g004
Figure 5. Zn XRF maps of sample ME68, GEVN10 and GEVN16 in cross section geometry, together with the corresponding distribution of ZnAl2O4 phase, depicted in red in panels (ac). Scale bar is 50 µm.
Applsci 11 08052 g005
Figure 6. (a) SEM image of sample GEVN7; maps of (b) Al, (c) Si, (d) K, (e) Mg, (f) Ti and (g) Fe.
Applsci 11 08052 g006
Figure 7. (a) SEM image of sample ME68; maps of (b) Al, (c) Si, (d) K, (e) Mg, (f) Ti and (g) Fe.
Applsci 11 08052 g007
Figure 8. (a) SEM image of sample GEL02; maps of (b) Al, (c) Si, (d) K, (e) Mg, (f) Ti and (g) Fe.
Applsci 11 08052 g008
Table 1. List of synchrotron beamlines suitable for materials science applications (especially cultural heritage) with the indication of available techniques and some practical and useful set-up information.
BeamlineFacilityCountryEnergy Range [keV]Available TechniquesBeam Size [um]Sample EnvironmentApplications
PUMASOLEILFrance7–22µXRF, µXANES, µXRD3.5 × 3.5AirCH (70%), Environmental sciences (30%)
LUCIASOLEILFrance0.8–8µXRF, µXANES2 × 3VacuumLife Sciences, Materials sciences, CH
ID21ESRFFrance2–11µXRF, µXANES, µXRD0.03 × 0.07VacuumLife Sciences, Materials sciences, CH
ID16BESRFFrance6–65µXRF, µXANES, µXRD0.05 × 0.05AirLife Sciences, Materials sciences, CH
TwinMicElettraItaly0.2–2.2µXRF, µXANES, STXMcircular, diameter from 0.1 to 2.5VacuumLife Sciences, Materials sciences, CH
XFMAustralian SynchrotronAustralia4.1–27µXRF, µXANEScircular, diameter from 1 to 5AirCH, Life Sciences, Materials Science
I08DiamondUK0.2–4.2µXRF, µXANES, STXMcircular, diameter from 0.1 to 2VacuumLife Sciences, Materials sciences, CH
NanoMAXMAXIVSweden6–28µXRF, µXANES, ptychography0.05 to 0.2AirLife Sciences, Materials sciences, CH
SoftiMAXMAXIVSweden0.275–2.5µXRF, µXANES, STXM0.01 to 0.1VacuumLife Sciences, Materials sciences, CH
26-IDAPSUSA6–12µXRF, µXRD0.03 × 0.03AirLife Sciences, Materials sciences, CH
20-BM-BAPSUSA2.7–32.7µXRF, µXANES5 × 5 or 25 × 25AirLife Sciences, Materials sciences, CH
20-ID-B,CAPSUSA4.3–27 or 8–50µXRF, µXANES2 × 2AirLife Sciences, Materials sciences, CH
SMCLSCanada0.13–2.7µXRF, µXANES, STXM0.03VacuumLife Sciences, Materials sciences, CH
SGMCLSCanada0.25–2µXRF, µXANES1 × 0.1VacuumLife Sciences, Materials sciences, CH
VESPERCLSCanada6–30µXRF, µXANES, µXRDfrom 2 to 4AirLife Sciences, Materials sciences, CH
HXNNSLS IIUSA12–17µXRF, µXANES, µXRD, 3D XRFfrom 0.1 to 0.4AirLife Sciences, Materials sciences, CH
XFMNSLS IIUSA4–20µXRF, µXANESfrom 1 to 10AirLife Sciences, Materials sciences, CH
Table 3. Comparative evaluation on black gloss features (visual appearance, elemental and mineralogical markers) got from different methods (traditional vs. non-destructive and non-invasive techniques) [22].
Production SiteThickness of the Black-GlossAesthetical AppearanceSR-Based MethodsOther Non-Destructive or Non-Invasive Lab Methods on Micro-SamplesTraditional Destructive Techniques (Literature Data)
Elemental Markers in On-Glaze Geometry (SR-XRF)Elemental Markers in Cross-Section Geometry (SR-XRF)Mineralogical Composition (SR-XANES)Elemental Markers in On-Gloss Geometry (Portable XRF)Elemental Markers in Cross-Section Geometry (SEM-EDS)Chemical Bulk Tracers (Literature, Benchtop XRF and ICP-MS)Mineralogical Composition (Literature, XRD)
Attic~20 μmCompact and glossyFe-based black-gloss, no relevant markersBlack-gloss: major Fe; minor Rb, Zn
Clay paste: Ni, Cr
hercynite and magnetiteMajor: Fe. Minor: Si, KAl-silicate K rich gloss. Not relevant markers; sharp interface between gloss and bodyNi, Cr [35]Quartz, plagioclase, hematite [35]
Laconian~10 μmMatte and black, homogeneousFe-based black-gloss, no relevant makersBlack-gloss: major Fe,
Clay paste: Rb, Ca
hercynite and magnetiteMajor: Fe, Mn. Minor: Si, KLower Fe, Si and Al amountNo data availableNo data available
Central-southern Sicily (Gela colony)~15 μmmatte and brownish, local reddishFe-based black-gloss, no relevant markersBlack-gloss: major Fe, Rb, Mn
Clay paste: K
Magnetite and hematiteMajor: Fe. Minor: Mn, KAl-silicate K rich gloss. Not relevant markers. The gloss layer fades out into the bodyNo data availableNo data available
South-Italian colonies (southern Calabria and the Strait of Messina area)20–40 μmMatte and compact black/black-bluish glossZnBlack-gloss: major: Zn, Fe
Clay paste: (Locrian) Ni, Cr; (Chalcidian) Rb, K, Mn
Hercynite, magnetite (minor) and spinel gahniteMajor: Fe. Minor: Zn, Si, K, MnAl-silicate K rich gloss. Not relevant markers. The gloss layer fades out into the bodyChalcidian: Ni, Cr
Locrian: Ni, Cr [35]
Chalcidian: quartz, plagioclase, K-feldspar, illite, muscovite, hematite
Locrian: quarzt, plagioclase, pyroxene, calcite, iron oxides [35]
Publisher’s Note: MDPI stays neutral with regard to jurisdictional claims in published maps and institutional affiliations.

