
Experimental Characterization of Chemical Properties of Engine Oil Using Localized Surface Plasmon Resonance Sensing


 ,
,
Abstract
:1. Introduction
2. Materials and Methods
2.1. Oil Samples
2.2. Prototype Design
2.2.1. Deposition of AgNP in Polystyrene Cells
2.2.2. Prototype Operation
2.3. Measurement Equipment
2.3.1. FT-IR Analysis
2.3.2. Scanning Electron Microscopy and X-ray Energy Dispersive Spectroscopy
2.3.3. UV-Vis Absorption Spectroscopy
3. Results and Discussion
3.1. FT-IR Analysis
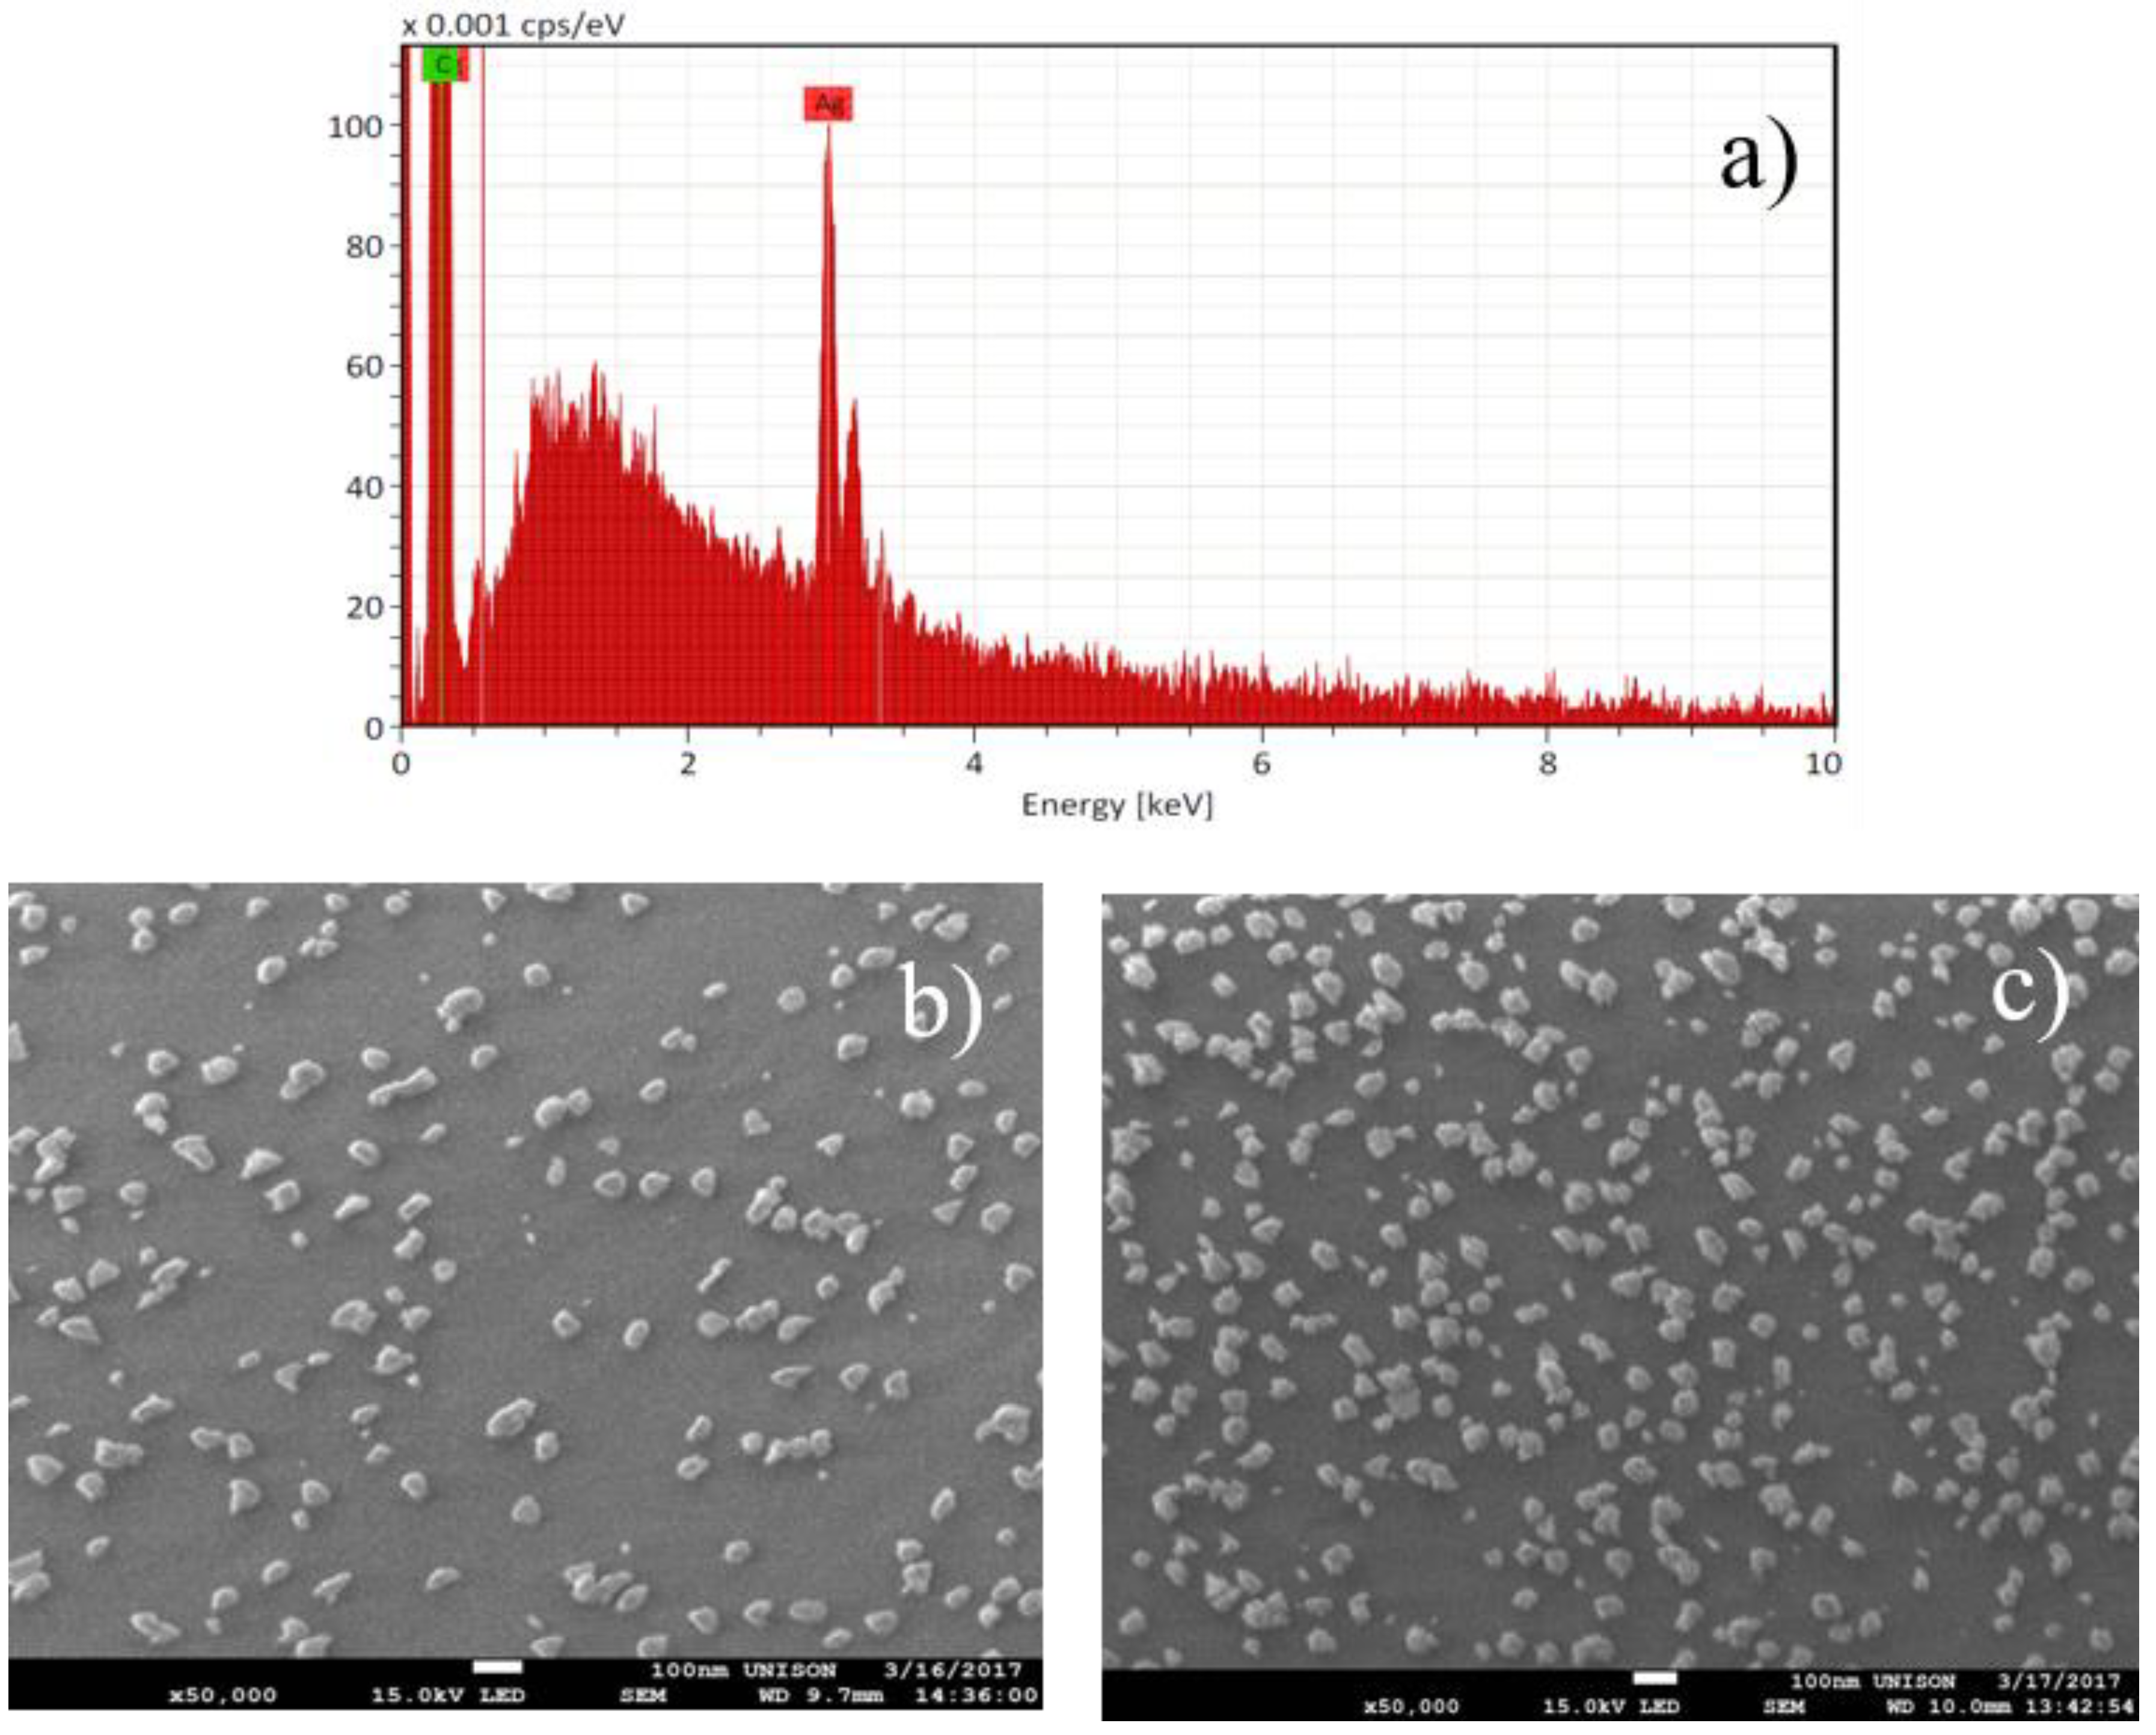
3.2. SEM and EDS
3.3. UV-Vis Spectroscopy
3.4. Correlation between FT-IR and UV-Vis Spectroscopies
4. Conclusions
5. Patents
Author Contributions
Funding
Institutional Review Board Statement
Informed Consent Statement
Data Availability Statement
Acknowledgments
Conflicts of Interest
References
- Ricciardi, A.; Colombelli, A.; Montagna, G.; Manera, M.G.; MIlanese, M.; De Risi, A.; Rella, R. Surface plasmon resonance optical sensors for engine oil monitoring. In Sensors; Springer: Cham, Switzerland, 2015; pp. 115–118. [Google Scholar]
- Heredia-Cancino, J.; Carrillo-Torres, R.; Munguía-Aguilar, H.; Álvarez-Ramos, M. An innovative method to reduce oil waste using a sensor made of recycled material to evaluate engine oil life in automotive workshops. Environ. Sci. Pollut. Res. 2020, 27, 28104–28112. [Google Scholar] [CrossRef]
- Gong, Y.-Z.; Guan, L.; Wang, L.-G.; Liu, H.-C. Dielectric submicroscopic phase characterisation of engine oil dispersed in jet fuel based on on-line dielectric spectroscopy. Lubr. Sci. 2017, 29, 335–354. [Google Scholar] [CrossRef]
- Balashanmugam, V.; Gobalakichenin, D. Development of dielectric sensor to monitor the engine lubricating oil degradation. Therm. Sci. 2016, 20, 1061–1069. [Google Scholar] [CrossRef]
- Adams, M.J.; Romeo, M.J.; Rawson, P. FTIR analysis and monitoring of synthetic aviation engine oils. Talanta 2007, 73, 629–634. [Google Scholar] [CrossRef]
- Rudnick, L.R. Lubricant Additives, Chemistry and Application; Taylor and Francis: Boca Raton, FL, USA, 2003. [Google Scholar]
- Wooton, D. The lubricant’s nemesis—Oxidation. Pract. Oil Anal. 2007, 9, 5–6. [Google Scholar]
- Collister, C.J. Electrical measurement of oil quality. U.S. Patent 6459995B1, 1 October 2002. [Google Scholar]
- ASTM E2412-10. Standard Practice for Condition Monitoring of Used Lubricants by Trend Analysis Using Fourier Transform Infrared (FT-IR) Spectrometry; ASTM International: West Conshohocken, PA, USA, 2010. [Google Scholar]
- Adbul-Munaim, A.M.; Reuter, M.; Koch, M.; Watson, D.G. Distinguishing Gasoline Engine Oils of Different Viscosities Using Terahertz Time-Domain Spectroscopy. J. Infrared Millim. Terahertz Waves 2015, 36, 687–696. [Google Scholar] [CrossRef] [Green Version]
- Soleimani, M.; Sophocleous, M.; Glanc, M.; Atkinson, J.; Wang, L.; Wood, R.J.K.; Taylor, R.I. Engine oil acidity detection using solid state ion selective electrodes. Tribol. Int. 2013, 65, 48–56. [Google Scholar] [CrossRef] [Green Version]
- Mayer, K.M.; Hafner, J.H. Localized surface plasmon resonance sensors. Chem. Rev. 2011, 111, 3828–3857. [Google Scholar] [CrossRef] [PubMed]
- Cathcart, N.; Coombs, N.; Gourevich, I.; Kitaev, V. Synthesis and sensing properties of D5h pentagonal silver star nanoparticles. Nanoscale 2016, 8, 18282–18290. [Google Scholar] [CrossRef] [PubMed]
- Mock, J.J.; Smith, D.R.; Schultz, S. Local Refractive Index Dependence of Plasmon Resonance Spectra from Individual Nanoparticles. Nano Lett. 2003, 3, 485–491. [Google Scholar] [CrossRef]
- Ma, W.; Yang, H.; Wang, W.; Gao, P.; Yao, J. Ethanol Vapor Sensing Properties of Triangular Silver Nanostructures Based on Localized Surface Plasmon Resonance. Sensors 2011, 11, 8643. [Google Scholar] [CrossRef] [Green Version]
- Zhang, T.; Song, Y.-J.; Zhang, X.-Y.; Wu, J.-Y. Synthesis of Silver Nanostructures by Multistep Methods. Sensors 2014, 14, 5860. [Google Scholar] [CrossRef] [PubMed]
- Cheng, C.S.; Chen, Y.Q.; Lu, C.J. Organic vapour sensing using localized surface plasmon resonance spectrum of metallic nanoparticles self assemble monolayer. Talanta 2007, 73, 358–365. [Google Scholar] [CrossRef] [PubMed]
- Dubas, S.T.; Pimpan, V. Green synthesis of silver nanoparticles for ammonia sensing. Talanta 2008, 76, 29–33. [Google Scholar] [CrossRef] [PubMed]
- Mack, N.H.; Wackerly, J.W.; Malyarchuk, V.; Rogers, J.A.; Moore, J.S.; Nuzzo, R.G. Optical transduction of chemical forces. Nano Lett. 2007, 7, 733–737. [Google Scholar] [CrossRef] [PubMed]
- Ahmed, S.W.; Anwar, H.; Siddiqui, A.; Shah, M.R.; Ahmed, A.; Ali, S.A. Synthesis and chemosensing of nitrofurazone using olive oil based silver nanoparticles (O-AgNPs). Sens. Actuators B Chem. 2018, 256, 429–439. [Google Scholar] [CrossRef]
- Álvarez-Ramos, M.E.; Necochea-Chamorro, J.I.; Carrillo-Torres, R.C.; Sánchez-Zeferino, R. Room temperature CO2 sensing using Au-decorated ZnO nanorods deposited on an optical fiber. Mater. Sci. Eng. B 2020, 262, 114720. [Google Scholar] [CrossRef]
- Milanese, M.; Ricciardi, A.; Manera, M.G.; Colombelli, A.; Montagna, G.; de Risi, A.; Rella, R. Real time oil control by surface plasmon resonance transduction methodology. Sens. Actuators A Phys. 2015, 223, 97–104. [Google Scholar] [CrossRef]
- Aghayan, H.R.; Bordatchev, E.V.; Yang, J. Experimental characterization of contaminants in engine lubricants using surface plasmon resonance sensing. Ind. Lubr. Tribol. 2013, 65, 61–68. [Google Scholar] [CrossRef]
- Félix-Domínguez, F.; Carrillo-Torres, R.C.; Lucero-Acuña, A.; Sanchez-Zeferino, R.; Álvarez-Ramos, M. Seedless synthesis of silver nanoparticles using sunlight and study of the effect of different ratios of precursors. Mater. Res. Express 2019, 6, 045067. [Google Scholar] [CrossRef]
- Jensen, T.R.; Duval, M.L.; Kelly, K.L.; Lazarides, A.A.; Schatz, G.C.; Van Duyne, R.P. Nanosphere Lithography: Effect of the External Dielectric Medium on the Surface Plasmon Resonance Spectrum of a Periodic Array of Silver Nanoparticles. J. Phys. Chem. B 1999, 103, 9846–9853. [Google Scholar] [CrossRef]
- Trujillo, G. Resetting Oil Analysis Parameters for Changing Diesel Engines. In Practicing Oil Analysis January 2004; Noria Publication: Tulsa, OK, USA, 2004. [Google Scholar]
- Mayer, A. Limits—The Robots of Oil Analysis; Technical Buletin; WearCheck: Westmead, Pinetown, RSA, 2010. [Google Scholar]
- Holland, T.; Abdul-Munaim, A.M.; Mandrell, C.; Karunanithy, R.; Watson, D.G.; Sivakumar, P. UV-Visible Spectrophotometer for Distinguishing Oxidation Time of Engine Oil. Lubricants 2021, 9, 37. [Google Scholar] [CrossRef]
- Mitsushio, M.; Uchiyama, E.; Kajiya, R.; Yoshidome, T.; Nakatake, S.; Higo, M. Separation and Detection of Hydrocarbons and Gasoline in Automotive Engine Oil Using a Teflon (R) AF2400-coated Gold deposited Surface Plasmon Resonance-based Glass Rod Sensor. Anal. Sci. 2018, 34, 1085–1091. [Google Scholar] [CrossRef] [PubMed] [Green Version]


| Mineral Oil 15W-40 | |
|---|---|
| Sample | Driving Distance (km) |
| 1 | 0 |
| 2 | 1500 |
| 3 | 3000 |
| 4 | 4300 |
| 5 | 6366 |
| 6 | 7000 |
| Test | Critical Limits (Abs/0.1 mm) |
|---|---|
| Oxidation | 23–25 |
| Sulfation | 30–40 |
| Nitration | 14 |
| Sample | Band Maximum (nm) | R2 |
|---|---|---|
| AgNP | 552.5 | 0.9922 |
| 0 km | 564.8 | 0.9926 |
| 1500 km | 573.0 | 0.9834 |
| 3000 km | 579.4 | 0.9860 |
| 4300 km | 583.6 | 0.9838 |
| 6366 km | 588.2 | 0.9883 |
| 7000 km | 596.0 | 0.9945 |
Publisher’s Note: MDPI stays neutral with regard to jurisdictional claims in published maps and institutional affiliations. |
© 2021 by the authors. Licensee MDPI, Basel, Switzerland. This article is an open access article distributed under the terms and conditions of the Creative Commons Attribution (CC BY) license (https://creativecommons.org/licenses/by/4.0/).
Share and Cite
Heredia-Cancino, J.A.; Carrillo-Torres, R.C.; Félix-Domínguez, F.; Álvarez-Ramos, M.E. Experimental Characterization of Chemical Properties of Engine Oil Using Localized Surface Plasmon Resonance Sensing. Appl. Sci. 2021, 11, 8518. https://0-doi-org.brum.beds.ac.uk/10.3390/app11188518
Heredia-Cancino JA, Carrillo-Torres RC, Félix-Domínguez F, Álvarez-Ramos ME. Experimental Characterization of Chemical Properties of Engine Oil Using Localized Surface Plasmon Resonance Sensing. Applied Sciences. 2021; 11(18):8518. https://0-doi-org.brum.beds.ac.uk/10.3390/app11188518
Chicago/Turabian StyleHeredia-Cancino, José Antonio, Roberto Carlos Carrillo-Torres, Francisco Félix-Domínguez, and Mario Enrique Álvarez-Ramos. 2021. "Experimental Characterization of Chemical Properties of Engine Oil Using Localized Surface Plasmon Resonance Sensing" Applied Sciences 11, no. 18: 8518. https://0-doi-org.brum.beds.ac.uk/10.3390/app11188518