Article

Automatic Hate Speech Detection in English-Odia Code Mixed Social Media Data Using Machine Learning Techniques

by
Sudhir Kumar Mohapatra
1,
Srinivas Prasad
2,
Dwiti Krishna Bebarta
3,
Tapan Kumar Das
4,
Kathiravan Srinivasan
5 and
Yuh-Chung Hu
6,*
1
Faculty of Emerging Technologies, Sri Sri University, Cuttack 754006, India
2
Department of Computer Science and Engineering, GITAM University, Visakhapatnam 530045, India
3
Department of Information Technology, Gayatri Vidya Parishad College of Engineering for Women, Vishakhapatnam 530048, India
4
School of Information Technology and Engineering, Vellore Institute of Technology, Vellore 632014, India
5
School of Computer Science and Engineering, Vellore Institute of Technology, Vellore 632014, India
6
Department of Mechanical and Electromechanical Engineering, National Ilan University, Yilan 26047, Taiwan
*
Author to whom correspondence should be addressed.
Submission received: 18 June 2021 / Revised: 5 September 2021 / Accepted: 13 September 2021 / Published: 15 September 2021
(This article belongs to the Special Issue Advances in Big Data and Machine Learning)

Abstract

:
Hate speech on social media may spread quickly through online users and subsequently, may even escalate into local vile violence and heinous crimes. This paper proposes a hate speech detection model by means of machine learning and text mining feature extraction techniques. In this study, the authors collected the hate speech of English-Odia code mixed data from a Facebook public page and manually organized them into three classes. In order to build binary and ternary datasets, the data are further converted into binary classes. The modeling of hate speech employs the combination of a machine learning algorithm and features extraction. Support vector machine (SVM), naïve Bayes (NB) and random forest (RF) models were trained using the whole dataset, with the extracted feature based on word unigram, bigram, trigram, combined n-grams, term frequency-inverse document frequency (TF-IDF), combined n-grams weighted by TF-IDF and word2vec for both the datasets. Using the two datasets, we developed two kinds of models with each feature—binary models and ternary models. The models based on SVM with word2vec achieved better performance than the NB and RF models for both the binary and ternary categories. The result reveals that the ternary models achieved less confusion between hate and non-hate speech than the binary models.

1. Introduction

Social media is changing the face of communication and culture of societies around the world [1]. Numbers of social media users in India have grown substantially in recent years, despite the low quality of internet services and the occasional interruptions or blocking of social media sites in the country. Multifarious populations in the country have been using online social media to communicate, express opinions, engage with friends, and share information [2,3,4]. However, the anonymity and mobility of online social media enable the netizens behind the screen to easily spread hateful content [5,6].
Social media platforms, like Facebook and Twitter, are criticized for not doing enough to prevent hate speech (HS) on their platform and have come under pressure to take action against hate speech [7,8]. In order to control and prohibit hate speech, governments worldwide are framing stringent regulations and keeping the implementation of such policies under surveillance in their ambit [9]. The Indian government further monitors social media content to prevent the spread of harmful information, and restricts online hate speech by interrupting the internet service from time to time and blocking access to those sites [10,11]. Furthermore, the government has already introduced a law that expands the anti-terrorism law to encompass cyberspace in order to prohibit the dissemination of any terrorizing or obscene information.
Even for humans, distinguishing whether a portion of text contains HS is not a simple task [12]. Manual judgement of HS is not only time-consuming but may also introduce subjective perceptions of HS composition [13]. Therefore, the definition of HS is crucial in clearly outlining a rule for the annotation process of the dataset, for the annotator, and in order to make the automatic model evaluation easier [14]. Most of the research on social media defines HS as a language that attacks or diminishes, and incites violence or hate against groups, based on specific characteristics, such as race, ethnic origin, religious affiliation, political views, physical appearance, gender, etc. [15] The definition points out that HS language incites violence or hatred against groups [16]. There is also an acknowledgment that it is highly probable that HS on social media is related to actual hate crimes. However, there are other kinds of speech whose definition is similar to HS, but are of a different level or effect. One example of these kinds of speech is offensive speech used to hurt someone. The indirect verbal/rhetoric disparity is the key to identifying whether something is hate speech or offensive speech [17].
Social media currently provides localization, which allows users to use different world languages on their websites. One of these languages is Odia, which is one of the oldest spoken and working languages of the Odisha state in India. This language is written from left to right and has its own unique script, which is a syllabic alphabet or an abugida, in which all consonants are embedded with an inherent vowel. Since most of the Indian population are bilingual and multilingual communities, and India is the second largest English-speaking country in the world, it follows that many communities use English–Odia code-mixed languages. The usage of such English-Odia on Facebook is very frequent. An example of the hate texts in English-Odia code-mixed data is given below:
Hate Text: Sala to rakta peijibi, you don’t know me.
Translation: You don’t know me, I will drink your blood.
Substantial research has accomplished the HS detection in English-Hindi code-mixed tweets [18,19,20], however, the study of HS detection in English-Odia code-mixed language has not yet been carried out. Nowadays, in India—and especially in Odisha—hate speech based on specific political views, ethnic origin, and religious affiliation has become widespread, and much of this HS calls for violence and attacks on specific targets of individual or groups. Therefore, monitoring or automatic detecting of hate speech on online social media platforms and preventing its spread is important for reducing violence and hate crimes that damage the lives of individuals, families, communities and, even, the entire country [21].
This paper aims to address the problem of hate speech using a new dataset that is annotated with three labels: hate, offensive and neither hate nor offensive (OK). Most of the previous literature used binary class approach to solve the HS problem, which leads to a confusion between hate and offensive speech and other types of speech. We argue that they should not be mixed with each other, because if someone uses offensive speech that differs from the definition of HS, people tend to respond with highly offensive terms for various reasons, such as joking, criticism, debate and condemnation. As such, the dualization of posts and comments into hate and non-hate leads to the conclusion that many people on social media are treated as hateful people.
The main contributions of this paper are as follows:
  • Propose the hate and offensive speech detection models for the English-Odia mixed code data by using a new dataset of posts and comments from public Facebook pages;
  • The proposed model use multiple feature extraction methods and multiple machine learning classifier algorithms;
  • The proposed system achieved good prediction accuracy on an imbalanced dataset and outperformed existing models.
The organization of this paper is as follows. Section 2 discusses the related works. Section 3 describes the methodology of data preparation for machining learning. Section 4 describes the proposed architecture of hate speech detection. Section 5 details the experiment and result analysis. The conclusion section summarizes the findings of this paper.

2. Related Works

This section presents a comprehensive review of the general techniques, methods, and results of existing research about automatic hate speech detection on social media. Mossie and Wang [22] investigated hate speech detection for the Amharic language. They created a dataset of 6120 instances of Amharic posts from Facebook, and classified the speech as “hate” and “not hate” using word2vec and term frequency-inverse document frequency (TF-IDF) feature extraction. They used the machine learning classifier algorithms, naïve Bayes (NB) and random forest (RF), to detect the features of “hate” and “not hate” speech. The NB model achieved 73.02% and 79.83% accuracy, while the RF model achieved 63.55 and 65.34% accuracy, respectively, for both of the features. The authors conclude that the result is promising for computing a large volume of data for a social network. Ibrohim et al. [23] studied hate speech for the Indonesian language on social media. The authors collected tweets and created a binary class dataset comprising HS and Non-HS (NHS), and classified them using a different combination of feature and machine learning classifier algorithms, which included a BOW model, word n-gram, character n-gram and negative sentiment with NB, support vector machine (SVM), beacon-less routing (BLR), and random forest decision tree (RFDT). They achieved a 93.5% F-measure; the best performance with the combination of word n-gram with RFDT than other combined models.
For the problem of differentiating hate from offensive speech, Davidson et al. [24] studied the characterization of hate for other instances of speech, like offensive speech, for automatic hate speech detection using 33,458 English tweets. They used hate speech lexicon from hatebase.org to label the hate speech dataset into three categories: hate, offensive, and neither. The authors then employed bigram, unigram, and trigram features with TF-IDF, and used part-of-speech, sentiment lexicon for social media. Logistic regression with Linear SVM yielded an overall precision of 0.91, recall of 0.90 and F1 score of 0.90. They concluded that high accuracy detection can be achieved by differentiating between these two classes of speech. Gambäck et al. [25] presented a deep-learning-based hate speech text classification system for Twitter. They used a dataset prepared by Benikova et al. [26], which was comprised of four categories: racism, sexism, both (racism and sexism), and NHS. They used four features for embedding, namely word2vector, random vector, character n-grams, and word vectors, combined with the deep learning of convolutional neural network (CNN). The model that was based on word2vec embedding turned out to be the best, with a 78.3% F-score.
Del Vigna et al. [27] studied an Italian online hate campaign on social network sites using the textual content of comments that appeared on a public Italian Facebook page as a source. The datasets are labeled as no hate, weak hate, and strong hate, and by merging weak and strong hate together as hate, they formed the second dataset. By leveraging morpho-syntactical features, sentiment polarity and word embedding lexicons, the authors designed and implemented two classifier algorithms for the Italian language: one is the traditional machine learning algorithm named SVM and the other is the deep learning recurrent neural network (RNN) named the long short-term memory (LSTM) algorithm. By conducting two different experiments with both datasets, in at least 70% of cases the annotator agreed on the class of the data. SVM and LSTM achieved an F-score of 80% and 79% for binary classification and 64% and 60% for ternary classification, respectively. Another study on Italian tweets-TWITA was reported by Florio et al. [6]. They used SVM and AIBERTo, the Italian BERT language model, and revealed the importance of the time difference between training and test data, because this will impact the performance of both the SVM and AIBERTo models. Another development pertaining to Italian tweets is the creation of a lexicon of hate words, known as Hurtlex, which can be used as a resource to identify hate speech [28]. Table 1 summarizes the speech detection related works.
Zimmerman et al. [39] attempted to improve hate speech detection by using an ensemble method, based on deep learning, which showed an improvement of 2% over non-ensemble approaches. MacAvaney et al. [40] presented the challenges faced by the existing systems when automatically processing hate speech. Furthermore, they designed a system employing multiple SVMs that achieved almost state-of-the-art performance.

3. Datasets

This paper is investigating the automatic detection of hate speech from Odia/Odia-English text. As such, this study requires the building of a new Odia HS dataset, because there is no published or annotated dataset for this purpose. The process of building the dataset consists of three main steps: (1) gathering the Odia/Odia-English posts and comments texts from public Facebook pages; (2) preparing, filtering or consolidating gathered data into one file dataset; and (3) annotating the data.

3.1. Data Collection

The Odia-English textual data are the posts and comments gathered from different categories of popular public pages on the Facebook platform, because Facebook’s privacy policy does not allow access to the public contents of a private page. Table 2 lists the Facebook pages that this paper used for dataset building. The sampling criteria and metrics used in this paper for selecting public pages on social media platforms are listed below:
  • The number of followers and likes has to be greater than 50,000, because such criteria allows for more active public pages to be included in categories;
  • Pages that post news or hot issues on political, ethnicity, religious, or gender issues at least once every two days;
  • Pages that use the Odia language frequently for posts and comments;
  • Pages that published more than 500 posts from April 2018 to April 2019.
This paper collects posts and comments from public pages that are in the listed categories with larger number of followers and likes than the other pages in the category. All of the selected posts and comments were posted from April 2019 to April 2020, which covers the political and socio-economic changes experienced by the country in different aspects in a year, and, in that period, the usage of social media—especially Facebook—in the country has increased significantly. Table 2 lists the selected public Facebook pages and provides information from each category. In addition, this paper collects the keywords for filtering the collected Odia text data and the annotation process of the posts and comments. These keywords are deemed as offensive words or the indicter of offensive or hate speech text, and the words used to identify a target group. This study focuses on political, ethnic, religious and gendered target groups.

3.2. Data Preparation

After the data collection is the data preparation process, which includes collecting, cleaning, filtering, and consolidating data into one file or data table. The cleaning and filtering of the raw data are primarily completed to prepare for the follow-up works—namely the annotation of the posts and comments in the dataset and the training model for Odia hate speech detection. The tasks performed in the data preparation process are listed below:
  • Remove all non-Odia, non-English, and non-textual posts and comments;
  • Remove all null, blank value, and whitespace;
  • Filter data using keywords that are an indicator of hate and offensive language;
  • Join data of each page into one dataset;
  • Remove duplication to ensure the uniqueness of each text in the dataset.
All of the above preparation tasks consider the nature and behaviors of the Odia language. The context of each text in a dataset is kept for annotation processes. The keywords and offensive words are gathered for filtering purposes, from university students, and also from different social media user pages known for using highly offensives words. The authors collected 27,422 posts. The total number of unique post and comment filtered were 27,162.

3.3. Annotation

Annotation is a procedure for adding information to the collected data or document. In this case, the annotation process needs to label a post or comment in order to build a hate speech dataset. The paper uses a simple random sampling technique to select the posts and comments to be annotated. The technique allows all of the filtered posts and comments of each page to have an equal chance of being annotated. The annotation is conducted based on the instruction guidelines provided by the researcher. The labeling is conducted by at least four annotators.

4. Proposed Hate Speech Detection Architecture

The proposed architecture for detecting Odia-English posts and comments as hate, offensive or normal speech is shown in Figure 1. It receives bilingual data as the input and then pre-process it based on the language nature, which involves removing punctuations, normalization, tokenization and another basic necessary pre-processes. Feature extraction then extracts the feature using TF-IDF, n-gram, and word2vec. The output of this task is an important feature vector (training data) of the dataset for training the model. After feature extraction, the models are trained using SVM, NB, and RF machine learning algorithms. The resulting models are then evaluated by K-fold cross-validation and, based on the validation results, the best detection model is selected. The outcome of these tasks is a detection model for detecting hate and offensive speech. The detection model is evaluated and selected, based on the results of the model evaluation method discussion. The final selected detection model is used to develop a prototype that can take new Odia-English texts as input and classify the input according to whether it contains hate, offensive or normal speech.

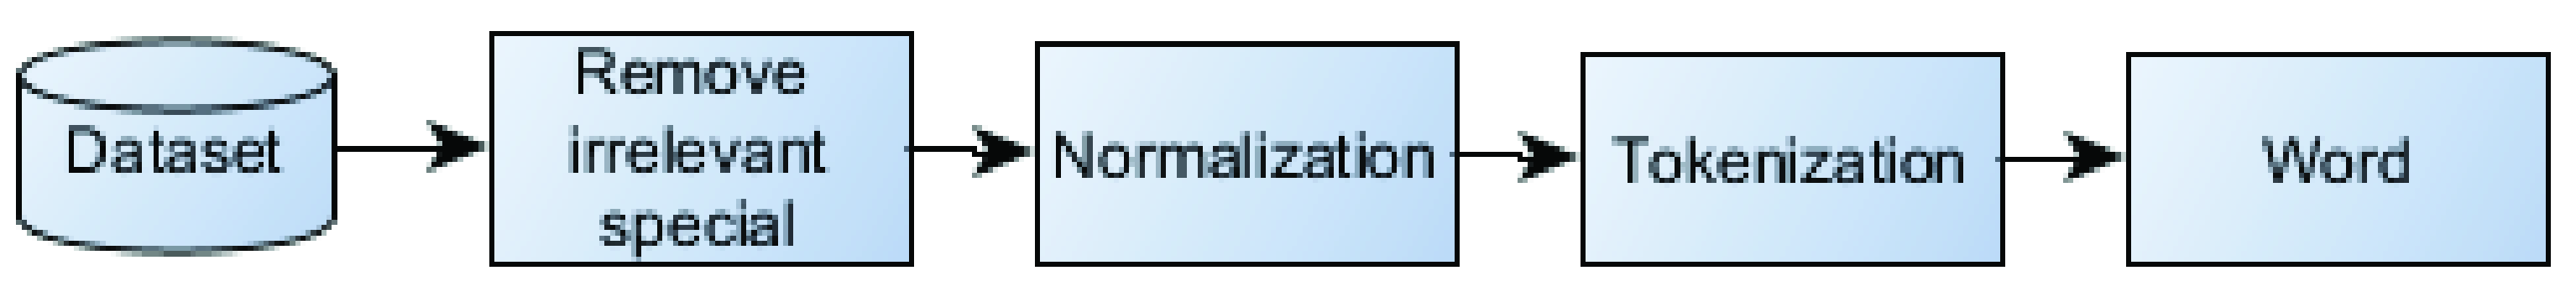
4.1. Proposed Odia-English Text Preprocessing

The pre-processing of Odia-English posts and comments is intended to prepare the data for training and testing the model. It is performed based on the Odia and English language and basic text processing techniques, such as removing the punctuations and special characters, normalization, and tokenization [41] (Figure 2).

4.1.1. Removing (Cleaning) Irrelevant Character, Punctuations Symbol, and Emoji’s

The posts and comments on social media text usually contain special characters, punctuations, symbols, and emojis to express different opinions and feelings. Therefore, the cleaning task involves removing all irrelevant special characters, symbols, and emojis. The source code of the cleaning Algorithm 1 is given below:
Algorithm 1 Cleanup Odia-English Mixed Text.
Input: Text in a dataset
Output: Clean text
Begin:
1.Read the text in the dataset;
2.While (! end of the text in a dataset):
If the text contains special_char [,’! @#$%^&*] then Remove special_char;
If the text contains symbol [<>‹›«»=፦‘~_/] then Replace symbol and add space;
If a text contains odia_Punc=[! . ?”] then Remove Odia_Punc;
If text contain number = [0–9] then Remove number;
If a text containsemoji = [ Applsci 11 08575 i001 Applsci 11 08575 i002 Applsci 11 08575 i003 ……] then Remove emoji;
If a text contains extra white space then Trim the text;
3.Return clean_text;
End:

4.1.2. Tokenization

After the cleaning and normalization tasks, the tokenization splits the post and comment text into individual words or tokens by using spaces between words or punctuation marks. This is important because the meaning of text generally depends on the relations of words in that text and this helps the feature extraction methods to obtain the appropriate features from the dataset.

4.2. Proposed Feature Extractions

The proposed feature extractions performs the extraction of important features of the dataset. It goes along with the input of prepossessed and tokenized dataset words and performs extractions, as shown in Figure 3. The extracted features are used for training the models and to predict the class of posts and comments as hate, offensive, and normal speech. The adopted feature extraction methods, word2vec, TF-IDF, and n-gram, are well known in text mining approaches [42]. Each method provides the feature vectors used to train the machine learning classifier.

4.2.1. n-Gram Feature Extraction

This paper proposes a word n-gram feature extraction method that is experimented on a different value of n that ranges from one to three where n is the number of words used in the probability sequences. An n-gram of two words is called a bigram (2-g). The feature extraction is performed by using unigram, bigram, trigram and combination n-grams. The performance of n-gram needs a proper choice of the n value. In addition, it provides a different feature model to train and compare the n-gram features with one another.

4.2.2. TF-IDF Feature Extraction

TF-IDF feature extraction is experimented in order to obtain the word frequency in the dataset by applying the TF. The importance of the word in the dataset is represented by measuring the IDF of the word in the dataset. This featured model provides the classifiers for the frequency and the importance of a word in the dataset as a feature vector for training.

4.2.3. Word2vec Feature Extraction

The proposed word2vec method performs the modeling of word to vector on a larger amount of data, due to the absence of a standard Odia word2vec model, and it is recommended that domain-related models are built to achieve better results. The word2vec model contains a vectors space and a similarity of all the words in posts and comments. These models extract features from the text in the dataset by calculating the average of all vectors using the model. This paper performs feature extraction, not only based on single methods, but also on a combination of some of these methods together, like n-grams weighted by TF-IDF and combined n-grams. Multiple feature extraction models are used in order to compare the performances of each feature extraction method.

4.3. Machine Learning Model Building

This subcomponent performs machine learning classifier training on all feature vectors constructed by the feature extraction component methods. This paper builds a classifications model by using the machine-learning algorithms SVM, RF, and NB on the dataset features and labels, as shown in Figure 4. The process of modeling is intended to find the patterns in the training dataset that maps the posts and comments with their features to the target class by using machine learning algorithms. The output of the machine learning modeling is a trained model that can be used for detecting hate speech and making predictions on newly input posts and comments.
This paper proposes the one-vs-rest (OVR) strategy of SVM classifier. This is because a simple form of the SVM algorithm is a binary classifier, which can separate a specific group from the others among the classes. In order to classify multiple groups of classes, the authors apply a modified version of the SVM algorithm, which is used for multiple class classifications. This method separates each class from the rest of the classes in the dataset. The NB classifier is a probabilistic machine learning model that is used for classification [43]. This paper uses a multinomial NB for modeling. The NB classifier is a specific instance of the classifier which uses multiple distributions for each of the features in the dataset. The RF classifier is a meta-estimator that fits a number of decision tree classifiers on a subsample of the dataset. The RF consists of a large number of individual decision trees that operate as an ensemble by bagging and feature randomness.

4.4. Model Evaluation and Testing

In order to evaluate the accuracy of the machine learning models for hate speech detection—in other words, the generalization error of the resulting models on the finite datasets—this paper adopts k-fold cross-validation (CV) and different performance evaluation metrics, such as confusion matrix, accuracy, precision, recall, and F-measure.

5. Experiment and Results

The tools mentioned in the previous section are deployed on a personal computer equipped with a processor Intel® Core™ i5-4310M, CPU 2.70GHz, 2 Core(s), 8 Gigabyte of physical memory, and 465 Gigabyte hard disk storage capacities. The operating system is Window 10 pro, 64 bits.

5.1. Dataset Description

In order to build the dataset for this paper, the authors collected posts and comments from Facebook manually. Firstly, we selected 35 different public Facebook pages, which belonged to categories that contain a range of three to six selected pages based on the selection criteria of public pages. We then collected all posts on the page from April 2019 to April 2020, and recorded the comments under each post. Next, we filtered the Odia-English mixed posts and comments by removing non-textual data. This process resulted in a total number of 837,077 posts and comments. There were, in total, 27,162 posts and comments on unique pages being filtered through the keywords. The keywords helped to filter the posts and comments which were likely to have hateful or offensive speech in the content. Finally, 5000 posts and comments were annotated and labeled as hate speech (HS), offensive speech (OFS), and neither offensive nor hate speech (OK) categories.

5.2. Preprocessing Implementation

The authors utilized a simple random sampling technique to select the posts and comments to be annotated. This technique provided an equal chance for all of the filtered posts and comments to be annotated. Because of the time limitation of the research and the resources of the annotation process for filtered posts and comments, 5000 posts and comments were selected to be annotated. There were four annotators in total and everyone labelled the posts and comments based on the same guidelines. Three of the annotators were given 500 similar instances and 1000 unique posts and comments. The same instances were used to evaluate the consistency of the annotations among the annotators. The fourth annotator was the researcher who oversaw the whole process of the annotation and annotated 1500 unique posts and comments. The process of building the dataset is tedious, challenging, and time-consuming, therefore, we consider only 500 of the same posts and comments to be annotated by the three annotators and the researcher decided the final class using the majority vote’s method.
The annotation process resulted in a distribution of classes shown in Table 3 for each annotator. The labeling result for the common 500 instances of posts and comments by the annotators is presented in Table 4. The resulting three-class distribution in dataset is shown in Table 5. The dataset used to train the machine learning models consisted of 4500 uniquely annotated posts, and the final class of 500 posts and comments were decided by the researcher using the majority vote’s method. A total of 5000 posts and comments were collected in the annotated dataset.
The inter-rater agreement for the 500 similar posts and comments annotated by three annotators is 0.54 kappa. The kappa value interpretation indicates a moderate agreement between annotators. In order to build the binary class dataset, the three-class data set is converted to two class datasets by considering all offensive language to be hate speech. Hence, all of the OFS labeled are converted to HS and this results in a dataset with 3492 HS-class. The inter-annotator agreement for two-class on the 500 similar posts and comments results in 0.66 kappa, which indicates a good agreement between the annotators.

5.3. Feature Extraction Result

The feature extraction process uses three methods, N-gram, TD-IDF, and word2vec, and produces seven different sets of features vectors for the dataset. For word2vec, the window is set to 10, the embedding size is set to 150, and the min count is taken as two. This paper uses skip-gram. To implement word2Vec, this paper utilizes a python Gensim module that is used to implement different embedding methods. It includes both skip-gram and CBOW, but the authors chose skip-gram for this experiment. Feature modeling with Gensim word2Vec is straightforward. First, the word2Vec class is imported and instantiated with the necessary parameters and the vocabulary is built. The word2Vec model is then trained using the posts and comments that are gathered from the selected pages. The resulting feature vector is also known as the embeddings. Embeddings are the features that describe the target word. The resulting word2vce model is then used to extract feature by computing the similarity for a word in the dataset and using it as a feature to train the machine learning models. The authors conducted the experiment with the embedding size varying from 100 to 300, but the optimal result occurs at the embedding size of 150, hence, the authors performed the experiment with 150.
These feature vectors are used in the training of the SVM, NB and RF models. For SVM, the parameters are multilabel classifications, *, n_jobs = None. For multinomial NB, the parameters are alpha = 1.0, fit_prior = True, class_prior = None. For RF, the parameters are estimators = 100, criterion = ‘gini’, max_depth = None, min_samples_split = 2, min_samples_leaf = 1, min_weight_fraction_leaf = 0.0, max_features = ‘auto’, max_leaf_nodes = None, min_impurity_decrease = 0.0, min_impurity_split = None, bootstrap = True, oob_score = False, n_jobs = None, random_state = None, verbose = 0, warm_start = False, class_weight = None, ccp_alpha = 0.0, max_samples = None. Table 6 shows the extracted feature vector size for the dataset.

5.4. Models Evaluation Results

The experiment results in twenty-one different models based on seven features and three classifiers for both binary and ternary classification. These trained models are tested by 5-fold cross-validation. This method randomly splits the dataset into five equal sized datasets or folds. For each unique fold, the fold is taken to be the test dataset, and the models are trained using the remaining datasets. This process is iterated for each unique fold. The results are presented in binary and ternary classification models below.

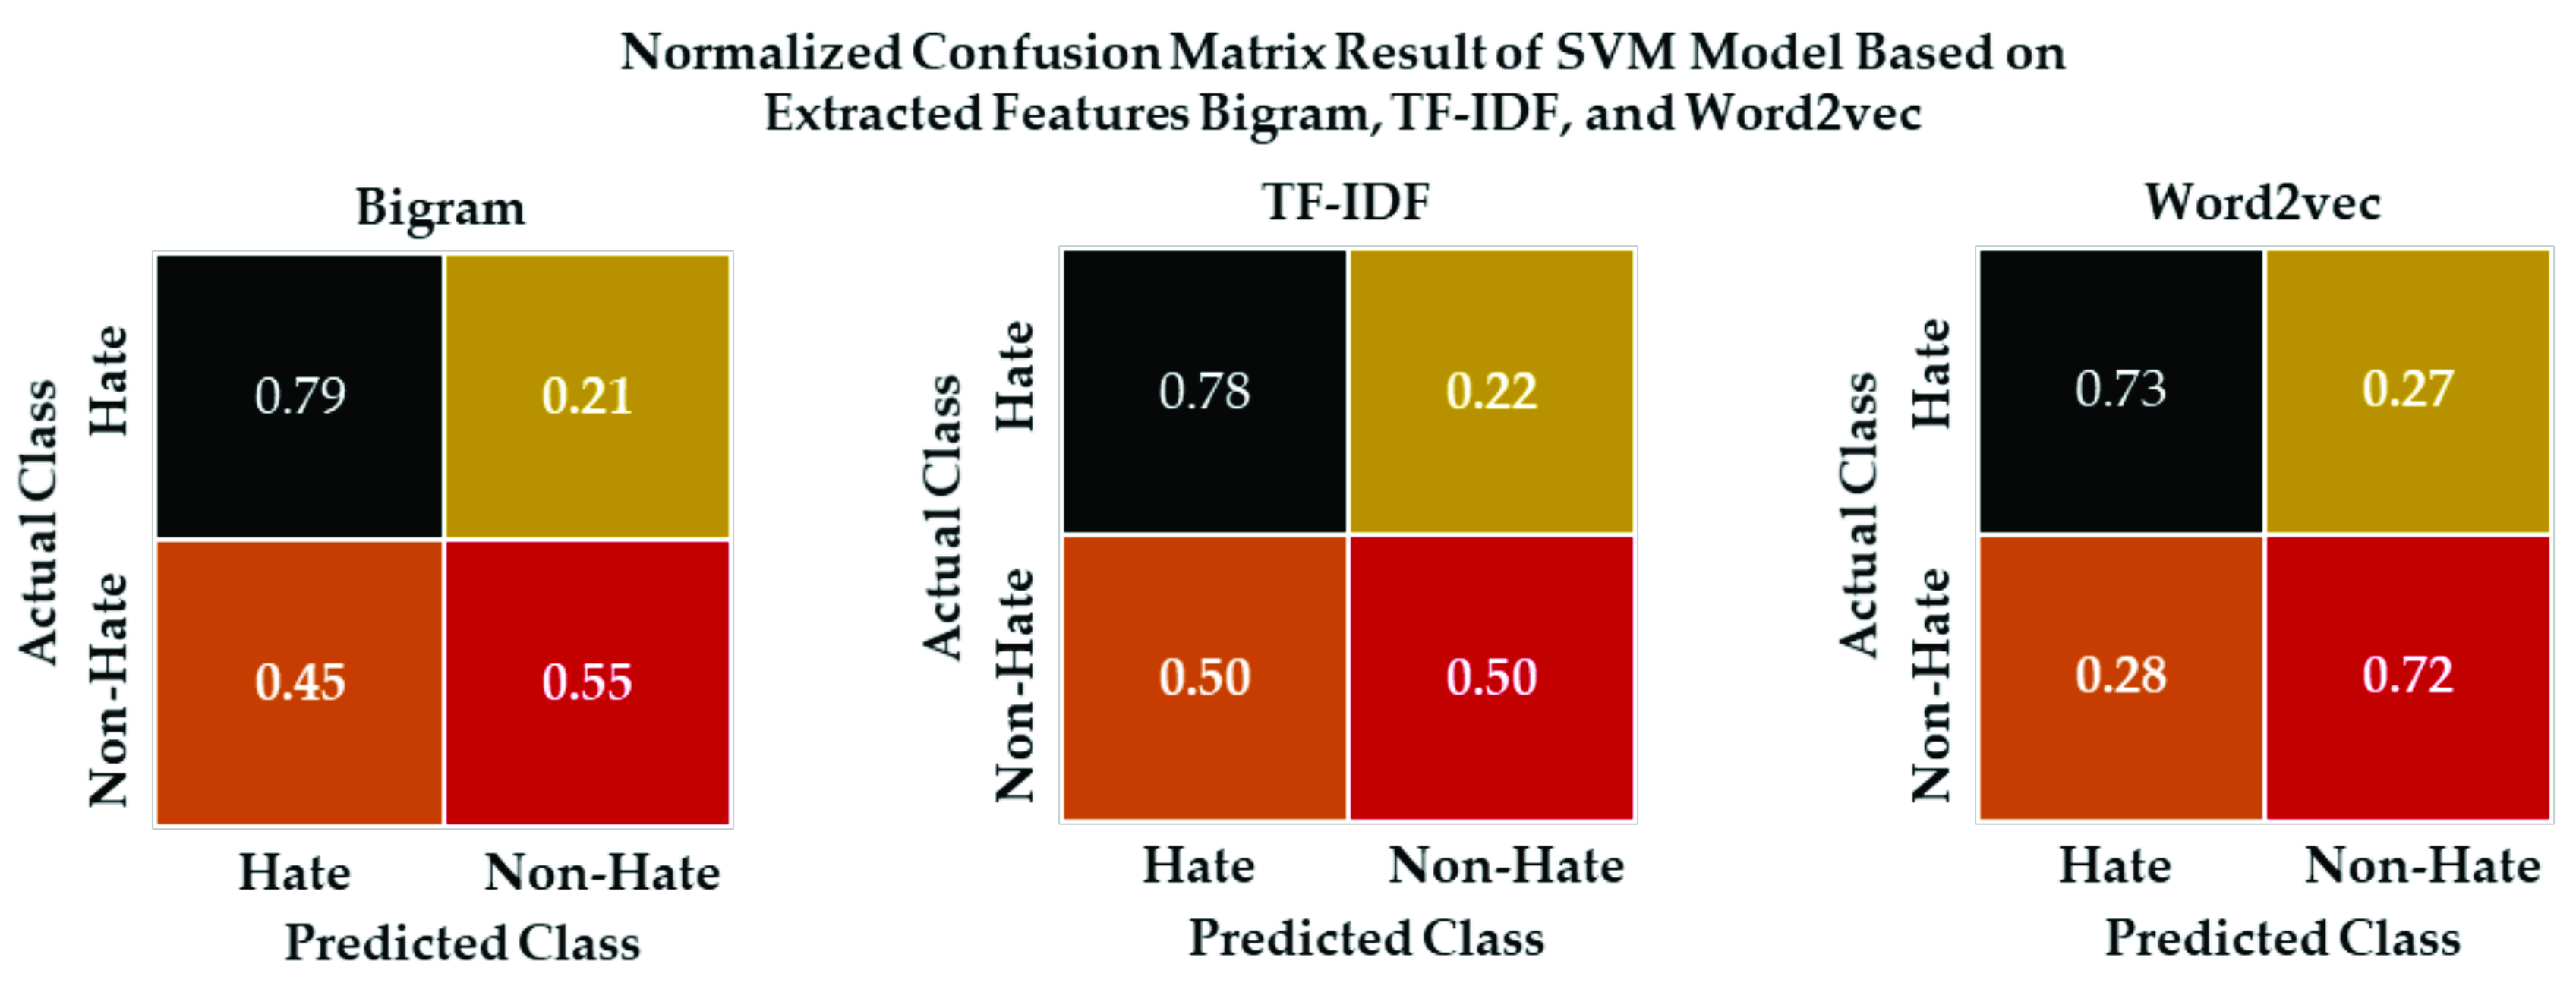
5.5. Binary Classification Models Evaluation Results

These classification models are built using the two-class dataset that is converted from the annotated three-class dataset, which means that the target classes are HS and OK. The trained models are tested using 5-fold CV. The result of each test accuracy score for the SVM, NB, and RF models based on extracted feature vectors are presented in Table 7, Table 8 and Table 9, respectively. Table 7 shows the accuracy scores of SVM model based on feature with corresponding fold tests. The average accuracy of the results recorded by the TF-IDF feature model is low, at 69.84%; while the accuracy of the results using the word2vec feature is high, at 72.54%. Table 8 shows the prediction accuracy scores of the NB model on each feature extracted with the corresponding fold tests. The lower average accuracy of the 70.78% result was recorded on the word2vec feature model and the slightly higher accuracy of 74.66% was recorded using the combined n-gram feature. Table 9 shows the prediction accuracy scores of the RF model on the extracted features with corresponding each fold test. The lower average accuracy of the 71.5% result was recorded on the TF-IDF with the combined n-gram feature. The higher accuracy of 75.39% was recorded on the model using the word2vec features. The bar chart of Figure 5 visualizes the 5-fold CV average accuracy of each model based on the features in the above three tables (Table 7, Table 8 and Table 9) for binary class experiments. It reveals that the average accuracy of the NB models is slightly greater than that of the SVM and RF models based on the n-grams feature and TF-IDF combined with n-grams. In addition, the RF obtains higher accuracy using word2vec and the TF-IDF feature.
In addition to the result accuracy score obtained by the 5-fold CV, this paper also uses other models’ performance evaluation metrics. These metrics are Precision (P), Recall(R), and F-score (F1). Table 10 shows the results of the evaluation metrics of each model based on the features extracted. It further uses the normalized confusion matrix of the models that use 5-fold prediction, with the results shown in Figure 6, Figure 7 and Figure 8 below. Based on the F1-score, the SVM model with word2vec obtains a higher score of 73% than the RF and NB models. However, the accuracy of the RF model is 75.39% which is higher than that of the SVM and NB models using the word2vec features (Figure 5). F1-score metrics are selected in order to compare the models based on the features because this is more useful than the accuracy when the dataset contains uneven class distribution. Figure 6 illustrates the sampled confusion matrix for SVM models. SVM models based on bigram classify 79% of HS and 55% of NH correctly, but 21% of HS and 45% of NH are misclassified; SVM models based on TF-IDF classify 78% of HS and 50% of NH correctly, but 22% of HS and 50% of NH are misclassified; and SVM models based on word2vec classify 73% of HS and 72% of NH correctly, but 27% of HS and 28% of NH are misclassified. Figure 7 illustrates the sampled confusion matrix for the NB models. NB models based on combined n-grams classify 91% of HS and 38% of NH correctly, but 9% of HS and 62% of NH are misclassified; NB models based on TF-IDF classify 86% of HS and 40% of NH correctly, but 14% of HS and 60% of NH are misclassified; and NB models based on word2vec classify 73% of HS and 65% of NH correctly, but 27% of HS and 35% of NH are misclassified. Similarly, Figure 8 shows the confusion matrix of the RF model. RF models based on unigram classify 89% of HS and 34% of NH correctly, but 11% of HS and 66% of NH are misclassified; RF models based on TF-IDF classify 90% of HS and 33% of NH correctly, but 10% of HS and 67% of NH are misclassified; and RF models based on word2vec classify 96% of HS and 28% of NH correctly, but 4% of HS and 72% of NH are misclassified. A normalized confusion matrix for binary classifier models based on the feature extracted using the prediction result of 5-fold CV for the models is shown in Figure 6, Figure 7 and Figure 8 respectively. The actual class is the labels post or comment in the dataset and the predicted class is the prediction labels made by the models. The heatmap represents the predicted or classified instance of posts and comments in each class. Finally, the result of the binary models demonstrates that the NB model based on n-grams shows better accuracy than the RF and SVM models. However, the RF models based on word2vec and TF-IDF show higher accuracy than the SVM and NB models. Furthermore, SVM models with word2vec give better classification results than both models.

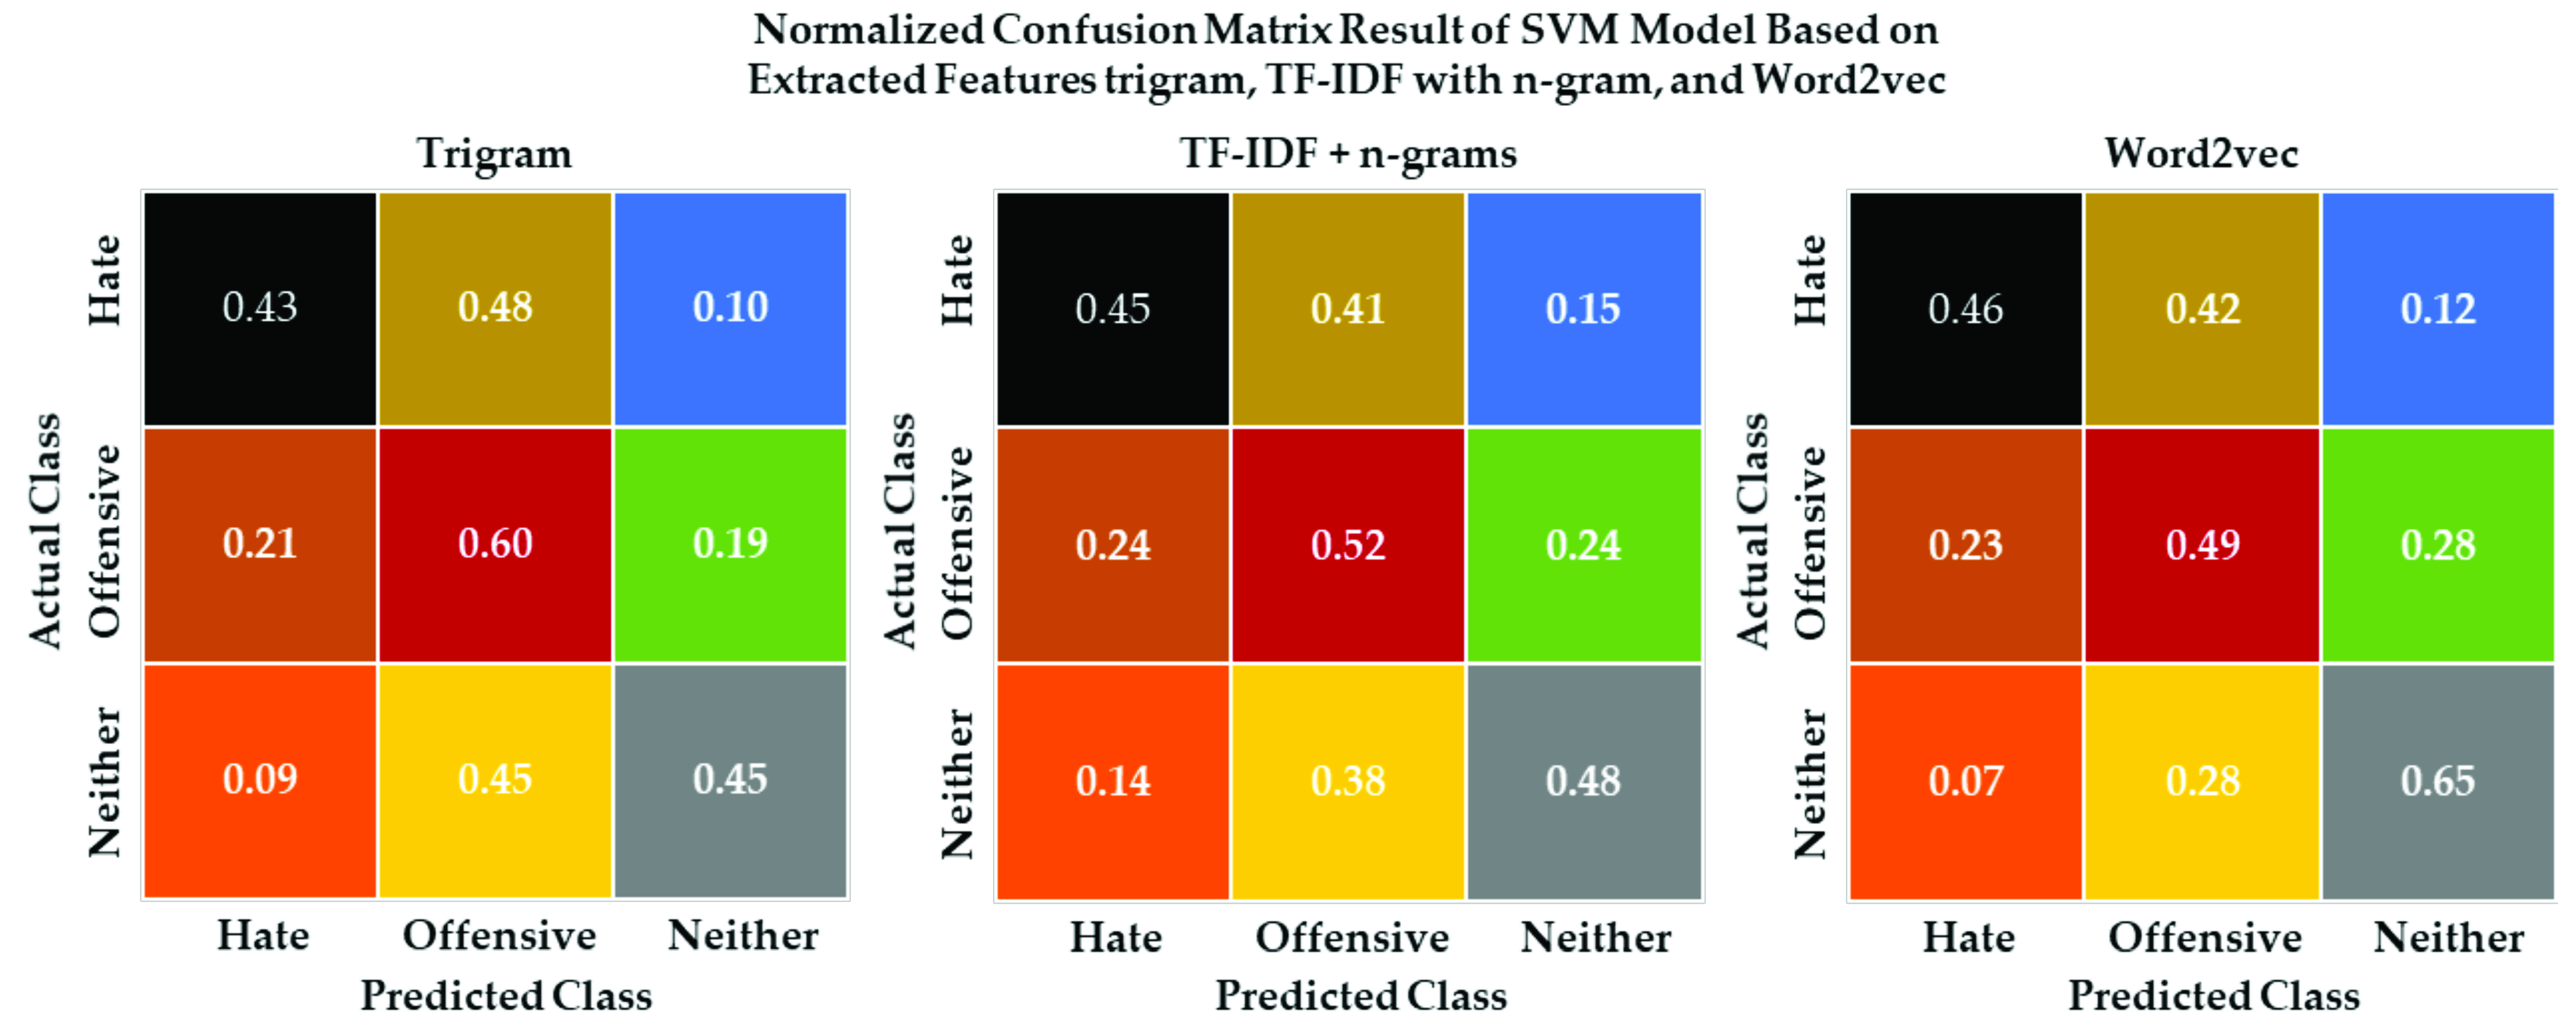
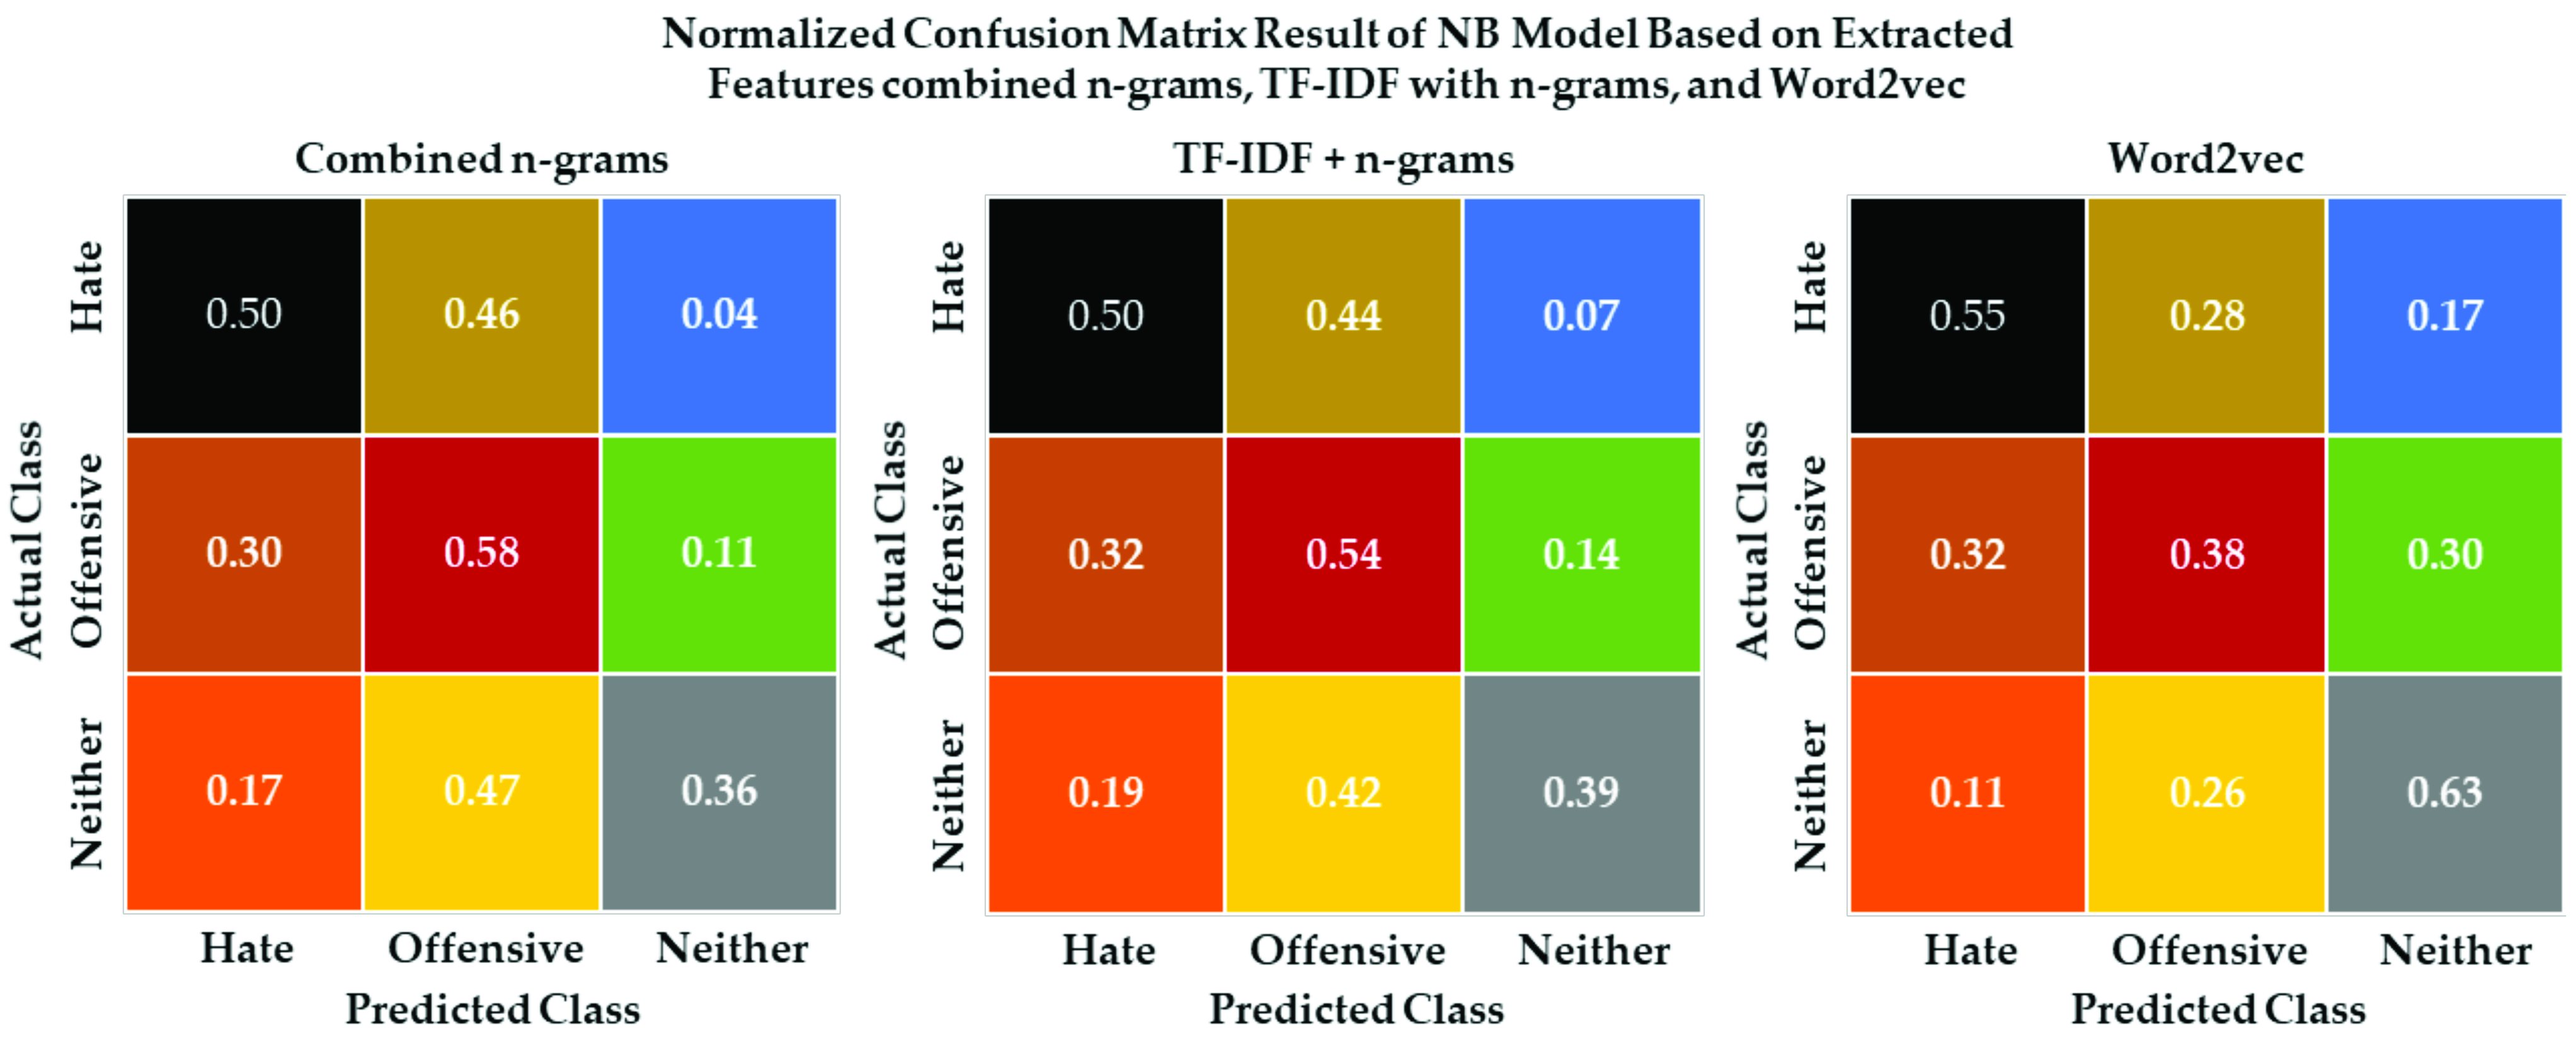
5.6. Ternary Classification Models Evaluation Results

The models were also trained based on the prepared three-class dataset. The trained models are tested using the 5-fold CV. Table 11, Table 12 and Table 13 show the accuracy scores of the models trained by SVM, NB, and RF, respectively, with various feature extraction vectors. Table 11 reveals that the SVM model using TF-IDF feature has the lower average accuracy of 48.51%, and the SVM model using word2vec feature has the higher average accuracy of 53.35%. Table 12 shows that the NB model using the unigram feature has the lower average accuracy of 41.89%, and the NB model using the word2vec feature has the higher average accuracy of 49.57%. Table 13 shows that the EF model using the bigram feature has the lower average accuracy, at 50.08%, and the EF model using the word2vec feature has the higher average accuracy, at 55.05%. The bar chart of Figure 9 visualizes the 5-fold CV average accuracy of each model based on the features in Table 11, Table 12 and Table 13 for the ternary classification experiments. It reveals that the NB models result in a lower score than the SVM and RF models. The SVM model achieves a higher score on bigram, trigram and combined n-gram. However, the RF model has the highest score using TD-IDF and word2vec based features.
Table 14 shows the results of the evaluation metric of each model, based on the features extracted and the normalized confusion matrix of the models using 5-fold CV prediction results. Comparing the result of the F1-score, the SVM model that was based on word2vec attained an F1-score of 53%; a higher score than the rest of the models. However, in terms of accuracy, the RF model (at 55.5%) was higher than the NB and SVM models with word2vec features. Figure 10 shows the confusion matrix for the SVM models. The SVM model with trigram classifies 43% of HS, 60% of OFS and 45% of the neither (OK) classes correctly, but 48% of HS and 45% of the OK class were misclassified as OFS. The misclassification rate of the HS and OK classes is 10% and 9%, respectively. The SVM model with TF-IDF+n-grams classifies 45% of HS, 52% of OFS and 48% of the OK class correctly, but 41% of HS and 38% of the OK class were misclassified as OFS. The misclassification rate of the HS and OK classes is 15% and 14%, respectively. Similarly, the SVM model with word2vec classifies 46% of HS, 49% of OFS and 65% of the OK class correctly, but 42% of HS and 28% of the OK class were misclassified as OFS. The misclassification rate of the HS and OK classes are 12% and 7%, respectively. Figure 11 shows a confusion matrix of the NB models. The NB model with combined n-gram classifies 50% of HS, 58% of OFS and 36% of the OK class correctly, but 46% of HS and 47% of the OK class were misclassified as OFS. The misclassification rate of the HS and OK classes is 4% and 17%, respectively. The NB model with TF-IDF+n-grams classifies 50% of HS, 54% of OFS and 39% of the OK class correctly, but 44% of HS and 42% of the OK class were misclassified as OFS. The misclassification rate of the HS and OK classes are 7% and 19%, respectively. In addition, the NB model with word2vec classifies 55% of HS, 38% of OFS and 63% of the OK class correctly, but 28% of HS and 26% of the OK class were misclassified as OFS. The misclassification rate of the HS and OK classes is 11% and 17%, respectively. Figure 12 shows the confusion matrix of the RF models. The RF model with unigram classifies 33% of HS, 64% of OFS and 46% of the OK class correctly, but 54% of HS and 48% of the OK class were misclassified as OFS. The misclassification rate of the HS and OK classes are 6% and 13%, respectively. The RF model with TF-IDF classifies 31% of HS, 65% of OFS and 46% of the OK class correctly, but 55% of HS and 47% of the OK class were misclassified as OFS. The misclassification rate of the HS and OK classes is 6% and 13%, respectively. In addition, the RF model with word2vec classifies 18% of HS, 83% of OFS and 40% of the OK class correctly, but 78% of HS and 59% of the OK class were misclassified as OFS. The misclassification rate of the HS and OK classes is 3% and 2%, respectively. Normalized confusion matrices for ternary classifier models based on the feature extracted are represented in Figure 10, Figure 11 and Figure 12, exhibiting the classification results of a 5-fold CV of each model. The actual class is the label’s post or comment in a dataset and the predicted class is the prediction labels by the models. The classes are hate, offensive and neither (OK). Conclusively, the SVM model with word2vec produced slightly better classification results than the NB and RF models.

5.7. Comparision with Results of Conventional ML Methods

In this section, the authors use four conventional machine learning (ML) techniques: logistic regression (LR), decision tree (DT), gradient boosting (GB) and K-nearest neighbor (KNN) for the classification of text. For comparison, the authors used the exact same dataset of Odia-English code mixed data devised by themselves. The authors reinforced the models using three classes of data: hate, offensive and neither (OK). First, the authors investigated using the unigram feature based on ML methods, followed by the bigram and trigram features. Classification performances of LR, DT, GB, and KNN by P, R and F1 score are listed in Table 15.
For accuracy, it is quite evident from Table 11 that the SVM model with the word trigram features has an accuracy of 51.4%, which is higher than the average accuracies reported by any of the four standard ML techniques. From Table 14, it can be seen that the SVM model has a precision of 0.51, which is a slight improvement on the precision of any of the methods shown in Table 15. It signifies that the false-positive cases recorded by SVM are less compared to other models. The recall value for SVM model stands at 0.51, which is also marginally higher than the precision value reported by all of the four standard techniques. This reveals that the false-negative case conveyed by our model is less compared to classic ML techniques, which signifies a drop in misclassification instances.

5.8. Discussion

The defining characteristics of the few hate detection models published in the last four years are summarized in Table 16. The first column shows the paper, and the year of publishing, and columns two to five reflect the details of the datasets used in the experiments. The subsequent columns exhibit the features considered (the features used in the best model are in bold), and the classification models tested (the best classification model is in bold). Finally, the performance of the best model found is presented using the accuracy (A) and F1-scores (F1). A dash (-) indicates that the value is not available.
Binary detection models were developed by Mossie and Wang [22] using NB and RF with the extracted features word2vec and TF-IDF. They reported performance accuracy results of 79% and 73% for NB, and 65% and 63% for RF with both features, respectively. They used a total of 6120 instances as dataset. Among those, 1821 were labeled posts and comments and a dictionary of hateful word and phrases was extracted from the annotated dataset. The dataset contains 3296 non-hate and 2824 hate speech instances, and the model used 80% of the dataset for training and 20% for testing. In contrast, the RF models of our study perform better than the RF models of Mossie and Wang’s study [22], by a margin of 10% and 9% for both features, respectively. The NB model with TF-IDF feature of this study also performs equally with Mossie and Wang; however, our NB model with word2vec falls behind by 8%. A CNN-based model for HS detection from Twitter on word2vec embeddings reported by Gambäck and Kumar [25] showed the values of the P, R and F1 scores as 0.85, 0.72 and 0.78, respectively. Furthermore, the P and F1 score values of [25] are marginally higher than our results, which were P = 0.76, R = 0.73 and F1 score = 0.73. This small marginal difference of accuracy results obtained by the same feature extraction method shows that the size of neither the dataset nor the setup used is the core problem. The problems are the ambiguity of dataset labels, which resulted in a larger percentage of non-hate class being misclassified as hate by the models. However, the SVM models with word2vec used in this study show a better classification performance than the NB and RF models.
This is the first time in the current research that a dataset on Odia-English mixed representation has been prepared. It is prepared using Facebook posts, which are in English alphabets but representing Odia phonetics. The datasets are annotated and labeled properly.

6. Conclusions

This paper proposes a solution for detecting hate speech on social media using machine learning techniques. The research attempts to develop, implement and compare machine learning and text feature extraction methods specifically for hate speech detection for the Odia-English mixed code language. To successfully execute the research, it is essential to understand and define hate and offensive speech on social media, explore the various existing techniques used to tackle the problem, and understand the Odia language. In addition, it is important to identify the different method followed to implement and design the models that have the capability of detecting hate speech. These methods include: collecting posts and comments for building the dataset; developing annotation guidelines; pre-processing and features extraction using n-gram; TF-IDF, and word2vec, models training using SVM, NB, and RF; and models testing. Finally, comparisons of the models based on 5-fold CV evaluation metric results were performed. In this paper, the authors manually annotated the posts and comments into three classes of hate (HS), offensive (OFS), and neither (OK) speeches. The annotated dataset was converted into two class labelled datasets by converting all OFS to HS classes. This resulted in two datasets with 5000 instances of posts and comments; one with binary classes and the other with ternary class dataset. Based on the two datasets, the models were developed using SVM, NB, and RF, along with seven feature extraction methods, and the models were then executed. The experiment performed using these two datasets resulted in 21 binary and ternary models for each dataset. On one hand, binary models using RF with word2vec resulted in better accuracy than both the SVM and NB models. On the other hand, the SVM model with word2vec brought about a classification with a 73% F1-score, demonstrating a better performance than the NB and RF models. The ternary models performed better in handling misclassification between the hate and non-hate posts and comments than the binary models. Furthermore, the ternary SVM model with word2vec resulted in a 53% F1-score, which showed a better performance than the models with NB and RF. Finally, the models based on SVM using word2vec yielded slightly better performances than the NB and RF models for both the datasets used in this research.

Author Contributions

Conceptualization, S.K.M. and S.P.; methodology, S.K.M.; software, S.K.M.; validation, D.K.B., S.P. and Y.-C.H.; formal analysis, S.K.M. and Y.-C.H.; investigation, S.P.; data curation, D.K.B.; writing—original draft preparation, T.K.D.; writing—review and editing, K.S. and Y.-C.H.; visualization, T.K.D.; supervision, K.S.; project administration, Y.-C.H.; funding acquisition, Y.-C.H. All authors have read and agreed to the published version of the manuscript.

Funding

This research was not funded.

Institutional Review Board Statement

Not applicable.

Informed Consent Statement

Not applicable.

Data Availability Statement

Not applicable.

Conflicts of Interest

The authors declare no conflict of interest.

References

  1. Fiok, K.; Karwowski, W.; Gutierrez, E.; Liciaga, T.; Belmonte, A.; Capobianco, R. Automated Classification of Evidence of Respect in the Communication through Twitter. Appl. Sci. 2021, 11, 1294. [Google Scholar] [CrossRef]
  2. Das, T.K.; Acharjya, D.P.; Patra, M.R. Opinion mining about a product by analyzing public tweets in Twitter. In Proceedings of the 2014 International Conference on Computer Communication and Informatics, Coimbatore, India, 3–5 January 2014; pp. 1–4. [Google Scholar]
  3. Bermingham, A.; Smeaton, A. On using Twitter to monitor political sentiment and predict election results. In Proceedings of the Workshop on Sentiment Analysis Where AI meets Psychology (SAAIP 2011), Chiang Mai, Thailand, 13 November 2011; pp. 2–10. [Google Scholar]
  4. Xu, X.; Mei, Y.; Sun, Y.; Zhu, X. Analysis of the Effectiveness of Promotion Strategies of Social Platforms for the Elderly with Different Levels of Digital Literacy. Appl. Sci. 2021, 11, 4312. [Google Scholar] [CrossRef]
  5. De Choudhury, M.; Sundaram, H.; John, A.; Seligmann, D.D. Analyzing the dynamics of communication in online social networks. In Handbook of Social Network Technologies and Applications; Springer: Boston, MA, USA, 2010; pp. 59–94. [Google Scholar]
  6. Florio, K.; Basile, V.; Polignano, M.; Basile, P.; Patti, V. Time of your hate: The challenge of time in hate speech detection on social media. Appl. Sci. 2020, 10, 4180. [Google Scholar] [CrossRef]
  7. Alshalan, R.; Al-Khalifa, H. A Deep Learning Approach for Automatic Hate Speech Detection in the Saudi Twittersphere. Appl. Sci. 2020, 10, 8614. [Google Scholar] [CrossRef]
  8. Pereira-Kohatsu, J.C.; Quijano-Sánchez, L.; Liberatore, F.; Camacho-Collados, M. Detecting and monitoring hate speech in Twitter. Sensors 2019, 19, 4654. [Google Scholar] [CrossRef] [Green Version]
  9. Gagliardone, I.; Pohjonen, M.; Beyene, Z.; Zerai, A.; Aynekulu, G.; Bekalu, M.; Teferra, Z. Mechachal: Online Debates and Elections in Ethiopia-from Hate Speech to Engagement in Social Media. Available online: https://ssrn.com/abstract=2831369 (accessed on 5 September 2021).
  10. Gagliardone, I. Mapping and Analysing Hate Speech Online. Available online: https://ssrn.com/abstract=2601792 (accessed on 5 September 2021).
  11. Stokel-Walker, C. Alt-right’s’ Twitter’is hate-speech hub. New Sci. 2018, 3167, 15. [Google Scholar] [CrossRef]
  12. Mathew, B.; Dutt, R.; Goyal, P.; Mukherjee, A. Spread of hate speech in online social media. In Proceedings of the 10th ACM Conference on Web Science, Boston, MA, USA, 30 June 2019; pp. 173–182. [Google Scholar]
  13. Malmasi, S.; Zampieri, M. Detecting hate speech in social media. arXiv 2017, arXiv:1712.06427. [Google Scholar]
  14. Zhang, Z.; Luo, L. Hate speech detection: A solved problem? the challenging case of long tail on twitter. Semant. Web 2019, 10, 925–945. [Google Scholar] [CrossRef] [Green Version]
  15. Jaki, S.; De Smedt, T. Right-Wing German Hate Speech on Twitter: Analysis and Automatic Detection. arXiv 2019, arXiv:1910.07518. [Google Scholar]
  16. Saleem, H.M. A Web of Hate Tackling Hateful Speech in Online Social Spaces. arXiv 2017, arXiv:1709.10159. Available online: http://arxiv.org/abs/1709.10159 (accessed on 5 September 2021).
  17. Al-Hassan, A.; Al-Dossari, H. Detection of hate speech in social networks: A survey on multilingual corpus. In Proceedings of the 6th International Conference on Computer Science and Information Technology, Dubai, United Arab Emirates, 4–5 May 2019; Volume 10. [Google Scholar]
  18. Bohra, A.; Vijay, D.; Singh, V.; Akhtar, S.S.; Shrivastava, M. A dataset of Hindi-English code-mixed social media text for hate speech detection. In Proceedings of the Second Workshop on Computational Modeling of People’s Opinions, Personality, and Emotions in Social Media, New Orleans, LA, USA, 6 June 2018; pp. 36–41. [Google Scholar]
  19. Kamble, S.; Joshi, A. Hate speech detection from code-mixed hindi-english tweets using deep learning models. arXiv 2018, arXiv:1811.05145. [Google Scholar]
  20. Sreelakshmi, K.; Premjith, B.; Soman, K.P. Detection of Hate Speech Text in Hindi-English Code-mixed Data. Procedia Comput. Sci. 2020, 171, 737–744. [Google Scholar] [CrossRef]
  21. Saroj, A.; Pal, S. An Indian language social media collection for hate and offensive speech. In Proceedings of the Workshop on Resources and Techniques for User and Author Profiling in Abusive Language, Marseille, France, 11–16 May 2020; pp. 2–8. [Google Scholar]
  22. Mossie, Z.; Wang, J.H. Social network hate speech detection for Amharic language. In Proceedings of the 6th International Conference on Computer Science and Information Technology, Copenhagen, Denmark, 28–29 April 2018; pp. 41–55. [Google Scholar]
  23. Ibrohim, M.O.; Budi, I. A dataset and preliminaries study for abusive language detection in Indonesian social media. Procedia Comput. Sci. 2018, 135, 222–229. [Google Scholar] [CrossRef]
  24. Davidson, T.; Warmsley, D.; Macy, M.; Weber, I. Automated hate speech detection and the problem of offensive language. In Proceedings of the Eleventh International AAAI Conference on Web and Social Media, Montreal, QC, Canada, 15–18 May 2017. [Google Scholar]
  25. Gambäck, B.; Sikdar, U.K. Using convolutional neural networks to classify hate-speech. In Proceedings of the First Workshop on Abusive Language Online, Vancouver, BC, Canada, 30 July–4 August 2017; pp. 85–90. [Google Scholar]
  26. Benikova, D.; Wojatzki, M.; Zesch, T. What does this imply? Examining the Impact of Implicitness on the Perception of Hate Speech. In International Conference of the German Society for Computational Linguistics and Language Technology; Springer: Cham, Switzerland, 2017; pp. 171–179. [Google Scholar]
  27. Del Vigna, F.; Cimino, A.; Dell’Orletta, F.; Petrocchi, M.; Tesconi, M. Hate me, hate me not: Hate speech detection on facebook. In Proceedings of the First Italian Conference on Cybersecurity (ITASEC17), Venice, Italy, 17–20 January 2017; pp. 86–95. [Google Scholar]
  28. Bassignana, E.; Basile, V.; Patti, V. Hurtlex: A multilingual lexicon of words to hurt. In Proceedings of the 5th Italian Conference on Computational Linguistics, CLiC-it 2018, Torino, Italy, 10–12 December 2018; Volume 2253, pp. 1–6. [Google Scholar]
  29. Alfina, I.; Mulia, R.; Fanany, M.I.; Ekanata, Y. Hate speech detection in the Indonesian language: A dataset and preliminary study. In Proceedings of the 2017 International Conference on Advanced Computer Science and Information Systems (ICACSIS), Bali, Indonesia, 28–29 October 2017; pp. 233–238. [Google Scholar]
  30. Djuric, N.; Zhou, J.; Morris, R.; Grbovic, M.; Radosavljevic, V.; Bhamidipati, N. Hate speech detection with comment embeddings. In Proceedings of the 24th International Conference On World Wide Web, Florence, Italy, 18–22 May 2015; pp. 29–30. [Google Scholar]
  31. Watanabe, H.; Bouazizi, M.; Ohtsuki, T. Hate speech on twitter: A pragmatic approach to collect hateful and offensive expressions and perform hate speech detection. IEEE Access 2018, 6, 13825–13835. [Google Scholar] [CrossRef]
  32. Fauzi, M.A.; Yuniarti, A. Ensemble method for indonesian twitter hate speech detection. Indones. J. Electr. Eng. Comput. Sci. 2018, 11, 294–299. [Google Scholar] [CrossRef]
  33. Kiilu, K.K.; Okeyo, G.; Rimiru, R.; Ogada, K. Using Naïve Bayes algorithm in detection of hate tweets. Int. J. Sci. Res. Publ. 2018, 8, 99–107. [Google Scholar] [CrossRef] [Green Version]
  34. Tulkens, S.; Hilte, L.; Lodewyckx, E.; Verhoeven, B.; Daelemans, W. A dictionary-based approach to racism detection in dutch social media. arXiv 2016, arXiv:1608.08738. [Google Scholar]
  35. Gaydhani, A.; Doma, V.; Kendre, S.; Bhagwat, L. Detecting hate speech and offensive language on twitter using machine learning: An n-gram and tfidf based approach. arXiv 2018, arXiv:1809.08651. [Google Scholar]
  36. Biere, S.; Bhulai, S.; Analytics, M.B. Hate Speech Detection Using Natural Language Processing Techniques; Master Business Analytics, Department of Mathematics, Faculty of Science, Vrije Universiteit Amsterdam: Amsterdam, The Netherlands, 2018. [Google Scholar]
  37. Badjatiya, P.; Gupta, S.; Gupta, M.; Varma, V. Deep learning for hate speech detection in tweets. In Proceedings of the 26th International Conference on World Wide Web Companion, Perth, Australia, 3–7 April 2017; pp. 759–760. [Google Scholar]
  38. Gitari, N.D.; Zuping, Z.; Damien, H.; Long, J. A lexicon-based approach for hate speech detection. Int. J. Multimed. Ubiquitous Eng. 2015, 10, 215–230. [Google Scholar] [CrossRef]
  39. Zimmerman, S.; Kruschwitz, U.; Fox, C. Improving hate speech detection with deep learning ensembles. In Proceedings of the 11th Edition of the Language Resources and Evaluation Conference, Miyazaki, Japan, 7–12 May 2018; pp. 2546–2553. [Google Scholar]
  40. MacAvaney, S.; Yao, H.R.; Yang, E.; Russell, K.; Goharian, N.; Frieder, O. Hate speech detection: Challenges and solutions. PLoS ONE 2019, 14, e0221152. [Google Scholar] [CrossRef]
  41. Miron’czuk, M.M.; Protasiewicz, J. A recent overview of the state-of-the-art elements of text classification. Expert Syst. Appl. 2018, 106, 36–54. [Google Scholar] [CrossRef]
  42. Roy, P.K.; Tripathy, A.K.; Das, T.K.; Gao, X.Z. A Framework for Hate Speech Detection Using Deep Convolutional Neural Network. IEEE Access 2020, 8, 204951–204962. [Google Scholar] [CrossRef]
  43. Das, T.K. A customer classification prediction model based on machine learning techniques. In Proceedings of the 2015 International Conference on Applied and Theoretical Computing and Communication Technology (iCATccT), Davangere, India, 29–31 October 2015; pp. 321–326. [Google Scholar]
  44. Salminen, J.; Almerekhi, H.; Milenkovic’, M.; Jung, S.G.; An, J.; Kwak, H.; Jansen, B.J. Anatomy of online hate: Developing a taxonomy and machine learning models for identifying and classifying hate in online news media. In Proceedings of the Twelfth International AAAI Conference on Web and Social Media, Palo Alto, CA, USA, 25–28 June 2018. [Google Scholar]
Figure 1. Hate speech detection architecture.
Applsci 11 08575 g001
Figure 2. Dataset pre-processing steps.
Applsci 11 08575 g002
Figure 3. The feature extraction flow chart.
Applsci 11 08575 g003
Figure 4. The model building flow chart.
Applsci 11 08575 g004
Figure 5. Binary models’ comparisons using CV average accuracy.
Applsci 11 08575 g005
Figure 6. Confusion matrix of sample binary SVM models based on extracted features.
Applsci 11 08575 g006
Figure 7. Confusion matrix of sample binary NB models based on extracted features.
Applsci 11 08575 g007
Figure 8. Confusion matrix of sample binary RF models based on extracted features.
Applsci 11 08575 g008
Figure 9. Ternary models’ comparison using CV average accuracy.
Applsci 11 08575 g009
Figure 10. Confusion matrix of sample ternary SVM models based on extracted features.
Applsci 11 08575 g010
Figure 11. Confusion matrix of sample ternary NB models based on extracted features.
Applsci 11 08575 g011
Figure 12. Confusion matrix of sample ternary RF models based on extracted features.
Applsci 11 08575 g012
Table 1. Summary of hate speech detection related work.
AuthorsObjectiveFeature ExtractionML Method & Accuracy
Binary Class Hate speech
Mossie and Wang [22]Detection of HS in the Amharic languageWord2Vec and TF-IDFNB and RF: 79.83% & 65.34% respectively
Alfina et al. [29]Detection of HS in the Indonesian LanguageBag-of-word (BOW), word n-gram and character n-gramNB, SVM, Bayesian LR (BLR) & (RFDT): 93.5% RFDT
Djuric et al. [30]Detection of HS with comment embeddingsParagraph2vec & BOW with TF & TF-IDFLogistic regression obtains 0.80 AUC
Watanabe et al. [31]Detection of HS on TwitterUnigrams with sentimental, semantic features and pattern featuresJ48graft, SVM and RF: accuracy 87.4% for binary and 78.4% for ternary
Fauzi et al. [32]Ensemble method for HS detection in Indonesian TwitterBOW with TF.IDF weightingNB, KNN, Maximum Entropy, RF, and SVM, and two ensemble methods: hard and soft vote, F1 measure 79.8%. (SVM, NB, and RF)
Kiilu et al. [33]Detection of HS in Kenyan tweetsSentiment analysis & N-Gram featureNB: P-0.58, R-0.62, A-0.67
Multi-class hate speech
Davidson et al. [24]Automated HS and offensive language detectionBigram, unigram, and trigram features with TF-IDFLogistic regression with L1 regularization: 90%
Tulkens et al. [34]Racism detection in Dutch social mediaWord2vec, Dictionary-basedSVM; F1: 0.46
Gaydhani et al. [35]Detecting HS and offensive language on TwitterN-gram and TF-IDFLR, NB and SVM 95.6%
Shervin and Marcos [13]Detecting HS in social mediaWord skip-gram, and surface n-gramSVM: 0.78
Binary and multi-classification with deep learning
Gambäck and Kumar [25]Convolutional neural network (CNN) to classify HSWord2vec, Random vector, character n-grams, and word2vec+character n-gramsCNN with word2vec: 0.78 F-score multi-classification
Biere and Bhulai (2018) [36]HS detection using NLPWord2vec with 300 dimensionsCNN accuracy of 91%, and a loss of 36%.
Badjatiya et al. [37]HS detection using deep learningRandom embeddings & glove embeddingsCNN, LTSM & Fast Text best accuracy is 93% f1-score CNN + Random &Glove Embeddings
Rule-based hate speech detection
Gitari et al. (2015) [38]A lexicon-based approach for hate speech detectionSemantic features, subjectivity features, and grammatical patterns featuresSubjectivity rule-based classifier called Subjclue lexicon F1-score 65.12%
Table 2. Selected Social Media Page Categories.
NoCategories NameDescription
1News media and broadcasting pagesDelivering news to the general public or a target public.
2Bloggers’ and journalists’ pagesA person who regularly writes for blogs, newspapers, magazines.
3Religious media and religious group pagesDelivering religious news, religious teachings to the followers of that religion or a target group.
4Political party, politician and government official’s pagesA group of people who come together to contest elections. A group of politicians who have held the power of government.
5Public figure: artists’ and authors’ pagesA person or public figure who creates song, painting or drawing, and a writer of a book, article, or document.
6Activists’, general or interest community pagesA person who campaigns to bring about political or social change, and pages promoting different issues on political, religious, ethnic and other social issues.
Table 3. Annotation result of unique posts and comments.
LabelAnnotator 1Annotator 2Annotator 3Annotator 4Total Unique Annotated
Offensive (OFS)4846283046192035
Hate (HS)2812021984171098
Neither (OK)2351704984641367
Total annotated10001000100015004500
Table 4. Annotation result of common posts and comments.
LabelAnnotator 1Annotator 2Annotator 3Final Class by Voting
Offensive (OFS)251227221264
Hate (HS)9311415195
Neither (OK)156159128141
Total500500500500
Table 5. The three-class distribution of the dataset.
Label or ClassNumber of Post and Comments
Offensive (OFS)2299
Hate (HS)1193
Neither (OK)1508
Total5000
Table 6. Results of the extracted features vector size.
Features Extraction MethodFeatures Vectors Size
Word unigram10,282
Word bigram14,298
Word trigram14,830
Word unigram + bigram + trigram (combined n-grams)39,410
TF-IDF10,279
TF-IDF + combined n-grams49,692
Word2vec150
Table 7. SVM models’ accuracy scores for each feature using the binary class dataset.
Features5-Folds Accuracy (%) for SVM ModelAverage Accuracy (%)
1st2nd3rd4th5th
Word unigram72.1270.7268.1073.2773.0771.46
Word bigrams73.3271.6268.5073.4772.9771.98
Word trigrams73.2271.5268.4073.4773.0771.94
Combined n-grams72.8270.7268.2072.2773.4771.50
TF-IDF70.0270.2266.8071.6770.4769.84
TF-IDF+ Combined n-gram70.1270.2267.2071.5770.6769.96
Word2vec73.1271.4270.1073.6774.3772.54
Table 8. NB models’ accuracy scores on each feature using binary class the dataset.
Features5-Folds Accuracy (%) for NB ModelAverage Accuracy (%)
1st2nd3rd4th5th
Word unigram73.7274.5274.275.2774.9774.54
Word bigrams74.6274.2272.8075.9775.3774.60
Word trigrams74.7274.2272.9075.9775.2774.62
Combined n-grams74.7274.8272.3076.0775.3774.66
TF-IDF70.6271.5271.4073.9773.7772.26
TF-IDF+ Combined n-gram73.1272.7271.9075.2775.3773.68
Word2vec71.3267.3369.572.9772.7770.78
Table 9. RF models’ accuracy scores on each feature using the binary class dataset.
Features5-Folds Accuracy (%) for RF ModelAverage Accuracy (%)
1st2nd3rd4th5th
Word unigram74.4472.1272.8073.9772.8773.24
Word bigram73.8271.6271.8074.1772.5772.80
Word trigram73.5271.9272.1073.6773.4772.92
Combined n-gram73.3272.0272.4074.9771.8772.92
TF-IDF74.5271.9271.773.8771.9772.79
TF-IDF+ combined n-gram71.2371.6370.6071.7772.2771.50
Word2vec75.3276.1274.376.0775.1775.39
Table 10. Classification performance result of binary models.
FeatureSVMNBRF
PRF1PRF1PRF1
Word unigram0.720.710.720.730.750.710.710.730.70
Word bigrams0.720.720.720.730.750.720.710.730.70
Word trigrams0.720.720.720.730.750.720.710.730.70
Combined n-grams0.720.710.720.730.750.720.700.720.70
TF-IDF0.700.700.700.700.720.710.710.730.70
TF-IDF+ combined n-grams0.700.710.700.720.740.720.700.720.70
Word2vec0.760.730.730.730.710.720.750.750.72
Table 11. SVM models’ accuracy scores on each features using three class dataset.
Extracted Feature5-Folds Accuracy Scores (%) for SVM ModelAverage Accuracy (%)
1st2nd3rd4th5th
Word unigram52.651.746.950.752.550.88
Word bigrams53.551.148.550.752.451.24
Word trigrams53.351.748.751.052.251.40
Combined n-grams53.353.248.450.152.851.56
TF-IDF50.250.045.548.048.848.51
TF-IDF+ combined50.850.445.547.850.048.73
Word2vec57.155.749.551.553.053.35
Table 12. NB models’ accuracy scores on each features using three class dataset.
Feature Models5-Folds Accuracy Scores (%) for NB ModelAverage Accuracy (%)
1st2nd3rd4th5th
Word unigram40.242.844.338.843.541.89
Word bigrams41.844.147.242.643.843.87
Word trigrams41.944.547.642.743.844.07
Combined n-grams52.751.448.847.148.649.73
TF-IDF48.448.347.445.947.447.45
TF-IDF+ combined49.549.348.446.948.048.39
Word2vec54.051.049.546.047.349.57
Table 13. RF models’ accuracy scores on each features using three class dataset.
Extracted Feature5-Folds Accuracy Scores (%) for the RF ModelAverage Accuracy (%)
1st2nd3rd4th5th
Word unigram52.650.650.452.848.951.07
Word bigrams52.950.451.151.048.750.08
Word trigrams52.451.749.051.449.050.69
Combined n-grams53.350.550.650.948.450.75
TF-IDF52.250.048.252.249.350.38
TF-IDF+ combined52.950.149.749.950.350.59
Word2vec56.056.753.054.355.255.05
Table 14. Classification performance result of ternary models.
Extracted FeatureSVMNBRF
PRF1PRF1PRF1
Word unigram0.510.510.510.430.420.420.510.510.50
Word bigrams0.510.510.510.450.440.440.510.510.50
Word trigrams0.510.510.510.450.440.440.510.510.50
Combined n-grams0.520.520.520.520.500.500.500.510.50
TF-IDF0.490.490.490.500.470.480.500.510.50
TF-IDF+ combined n-grams0.490.490.490.500.480.490.500.510.50
Word2vec0.530.530.530.510.500.490.570.540.50
Table 15. Results using conventional machine learning methods.
ModelExtracted FeaturesPRF1Average Accuracy (%)
LRWord unigram0.500.500.5050.01
Word bigrams0.500.500.5050.02
Word trigrams0.500.500.5049.65
DTWord unigram0.450.430.4443.34
Word bigrams0.470.450.4643.09
Word trigrams0.490.450.4742.17
GBWord unigram0.500.500.5049.11
Word bigrams0.490.500.4948.23
Word trigrams0.500.500.5048.52
KNNWord unigram0.440.440.4441.32
Word bigrams0.450.450.4542.31
Word trigrams0.450.450.4542.89
Table 16. Contemporary Hate speech Detection Models.
Reference/YearName/LanguageNumber of InstancesLabels in DatasetSourceFeaturesModelPerformance
AF1
[24], 2017English25000Hate, offensive and neitherTwitterUnigram, bigram, and trigram features with TF-IDFLR, NB, DT, RF and linear SVM--0.90
[29], 2017Indonesian1100HS and non-HSTwitterBOW, word n-gram and character n-gramNB, SVM, Bayesian LR, RFDT--0.935
[33], 2018English45,645—training, 22,820—testingNot labelledTwitterUnigram,
Bigram
NB0.70--
[22], 2018Ahmaric in Ethiopia6,120Hate and not hateFacebookword2vec and TF-IDFNB, RF0.7980.853
[44], 2018English5143Hate and not hateComments from videos posted in YouTube and Facebookn-grams, semantic and syntactic, TF-IDF, word2vec embeddings, doc2vec embeddingsLR, DT, RF, Adabost, SVM--0.79
[35], 2018Crowdflower (Public)14509Hateful, offensive and cleanTwitterN-gram and TF-IDFLR, NB, SVM0.9560.96
[18], 2018Hindi-English code mixed data4575Hate and normalTwitterCharacter n-gram, word n-gram, punctuations, lexicon, all featuresSVM, RF0.717--
[20], 2020Hindi-English code mixed data10000Hate and non-hateTwitter, HASOCFastText, word2vecSVM- linear, SVM-RBF, RF0.85810.8580
Publisher’s Note: MDPI stays neutral with regard to jurisdictional claims in published maps and institutional affiliations.

