
Confidence Learning for Semi-Supervised Acoustic Event Detection


1
Key Laboratory of Speech Acoustics and Content Understanding, Institute of Acoustics, Chinese Academy of Sciences, Beijing 100190, China
2
University of Chinese Academy of Sciences, Beijing 100049, China
3
National Internet Emergency Center, Beijing 100029, China
*
Author to whom correspondence should be addressed.
Appl. Sci. 2021, 11(18), 8581; https://0-doi-org.brum.beds.ac.uk/10.3390/app11188581
Submission received: 15 August 2021
/
Revised: 4 September 2021
/
Accepted: 11 September 2021
/
Published: 15 September 2021
(This article belongs to the Special Issue Selected Papers from 16th National Conference on Man-Machine Speech Communication (NCMMSC2021))
Abstract
:In recent years, the involvement of synthetic strongly labeled data, weakly labeled data, and unlabeled data has drawn much research attention in semi-supervised acoustic event detection (SAED). The classic self-training method carries out predictions for unlabeled data and then selects predictions with high probabilities as pseudo-labels for retraining. Such models have shown its effectiveness in SAED. However, probabilities are poorly calibrated confidence estimates, and samples with low probabilities are ignored. Hence, we introduce a confidence-based semi-supervised Acoustic event detection (C-SAED) framework. The C-SAED method learns confidence deliberately and retrains all data distinctly by applying confidence as weights. Additionally, we apply a power pooling function whose coefficient can be trained automatically and use weakly labeled data more efficiently. The experimental results demonstrate that the generated confidence is proportional to the accuracy of the predictions. Our C-SAED framework achieves a relative error rate reduction of 34% in contrast to the baseline model.
1. Introduction
Acoustic event detection (AED) is a task for identifying the categories and timestamps of target sound events in continuous audio recordings. As one of the core technologies in non-verbal sound perception and understanding, AED is widely deployed in various applications, such as noise monitoring for smart cities [1], nocturnally migrating bird detection [2], surveillance systems [3], and multimedia indexing [4].
Traditional approaches of AED mainly draw on the ideas of speech and the music signal process. Classic features such as Mel frequency cepstral coefficients (MFCCs) are sent into machine learning classifiers, such as the Hidden Markov Models (HMMs) and Gaussian Mixture Models (GMMs) [5,6]. Recently, deep neural networks (DNNs) [7,8], especially convolutional neural networks (CNNs) [4,9] and convolutional recurrent neural networks (CRNNs) [10], have been widely applied to AED tasks and achieve excellent performance. However, these methods are dependent on a large amount of strongly labeled training data with both types and timestamps. With the increase of acoustic event categories, high-quality manual annotations become hard to afford in terms of time and economy in practical applications. In comparison, synthetic strongly labeled data, weakly labeled data with only clip-level categories, and unlabeled data are widely available. Therefore, research and competitions [11,12] are turned to semi-supervised acoustic event detection (SAED) with the above data.
SAED inherits the paradigm of semi-supervised learning to use unlabeled data. That is, pseudo-labels are generated for unlabeled data as the training target. Therefore, the quality of pseudo-labels plays an important role. There are at least two approaches to improve the pseudo-labels quality in the SAED area. One is to improve the model that generates pseudo-labels. As high-level features with a larger compression scale are more suitable for clip-level classification, Lin [13] and Yan [14] introduce an extra branch or model with larger sampling sizes to produce high-level features with broader vision and better clip-level pseudo-labels for unlabeled data. Another way is to design a better pseudo-labels generation policy. Two effective semi-supervised learning methods are led into SAED: mean teacher and self-training. Mean teacher [15] averages model weights over steps to form a target-generating teacher model. A modified mean teacher model benefits SAED by employing both frame-level and clip-level consistency loss [14,16,17,18]. Self-training [19], a simple but effective bootstrapping semi-supervised method, cycles retraining the model with part of its predictions as pseudo-labels. Self-training methods adopted in SAED [20,21,22] retrained only once and employed a small part of unlabeled data with high probabilities. These approaches filtered unlabeled data by using the posterior distribution to ensure the quality of the pseudo-labels.
These two approaches have shown their respective strength, and their combination may bring further improvement. Nevertheless, the effect of the combination is out of the scope of this article. This paper focuses on introducing a better pseudo-labels generation and usage method. We notice that mean teacher and self-training yield impressive performance, but there are three problems with self-training. First, the probability is not a calibrated indicator for evaluating the correctness of the model predictions. As modern neural network classifiers are designed to produce output probabilities prone to extreme values, incorrect predictions can be generated with high probabilities [23]. Second, simplified self-training methods [20,21,22] lose a considerable amount of information. Third, these methods ignore true negative predictions. Nevertheless, data for SAED are extremely imbalanced. Massive correct negative predictions are beneficial to the retraining process.
To improve the training efficiency, we compress the number of iterations of the framework into two stages: in the first stage, pseudo-labels and the evaluation of pseudo-label quality are generated. In the second stage, unlabeled data are used distinguished according to the quality of pseudo-labels. Specifically, since the posterior probability cannot effectively measure the quality of the pseudo-label, we introduce a method of training confidence in the first stage without additional confidence annotation. Inspired by [24], the first-stage model is made to predict audio events and confidence value at the same time. In the second stage, we use unlabeled data discriminately, increasing the weight of the data with a more reliable label in the training process.
The contributions of this paper are as follows:
- (1)
- C-SAED realizes the co-training of classification and confidence with only classification labels in the first stage by designing a multi-task model. The experimental results show that the generated confidence can effectively measure the correctness of the label.
- (2)
- Compared with the traditional self-training method, differentiated training rather than screening strategies in the second stage effectively improves the utilization efficiency of unlabeled data. Our experiments illustrate that the training effect is significantly improved under the same number of iterations.
- (3)
- C-SAED uses the mean teacher model as the backbone of each stage model that effectively fuses two semi-supervised methods: the consistency principle and pseudo-labels. The ER decreases compared to adapting mean teacher only.
2. Proposed System
2.1. Baseline: Mean Teacher
Mean teacher is a consistency regularization method that evaluates unlabeled data with two different noises, and then apply a consistency cost between the two predictions. In this case, the model assumes dual roles of a teacher and a student. The baseline model performs the following optimization on the basis of mean teacher model in [17]: First, we introduce data augmentation by shifting input features along the time axes (forward and backward with a Normal distribution with zero mean and a standard deviation of 16 frames). Second, we adopt a set of median filter window sizes that is proportional to the average duration of different event categories [13]. Third, the 128-dimensional log Mel spectrogram is extracted at each frame. The size of the window is 2048 and the hop length is 365. Fourth, parameters of feature extractor follow the settings in [18].
2.2. C-SAED
2.2.1. Stage One: Multi-Task SAED Model (MT-SAED)
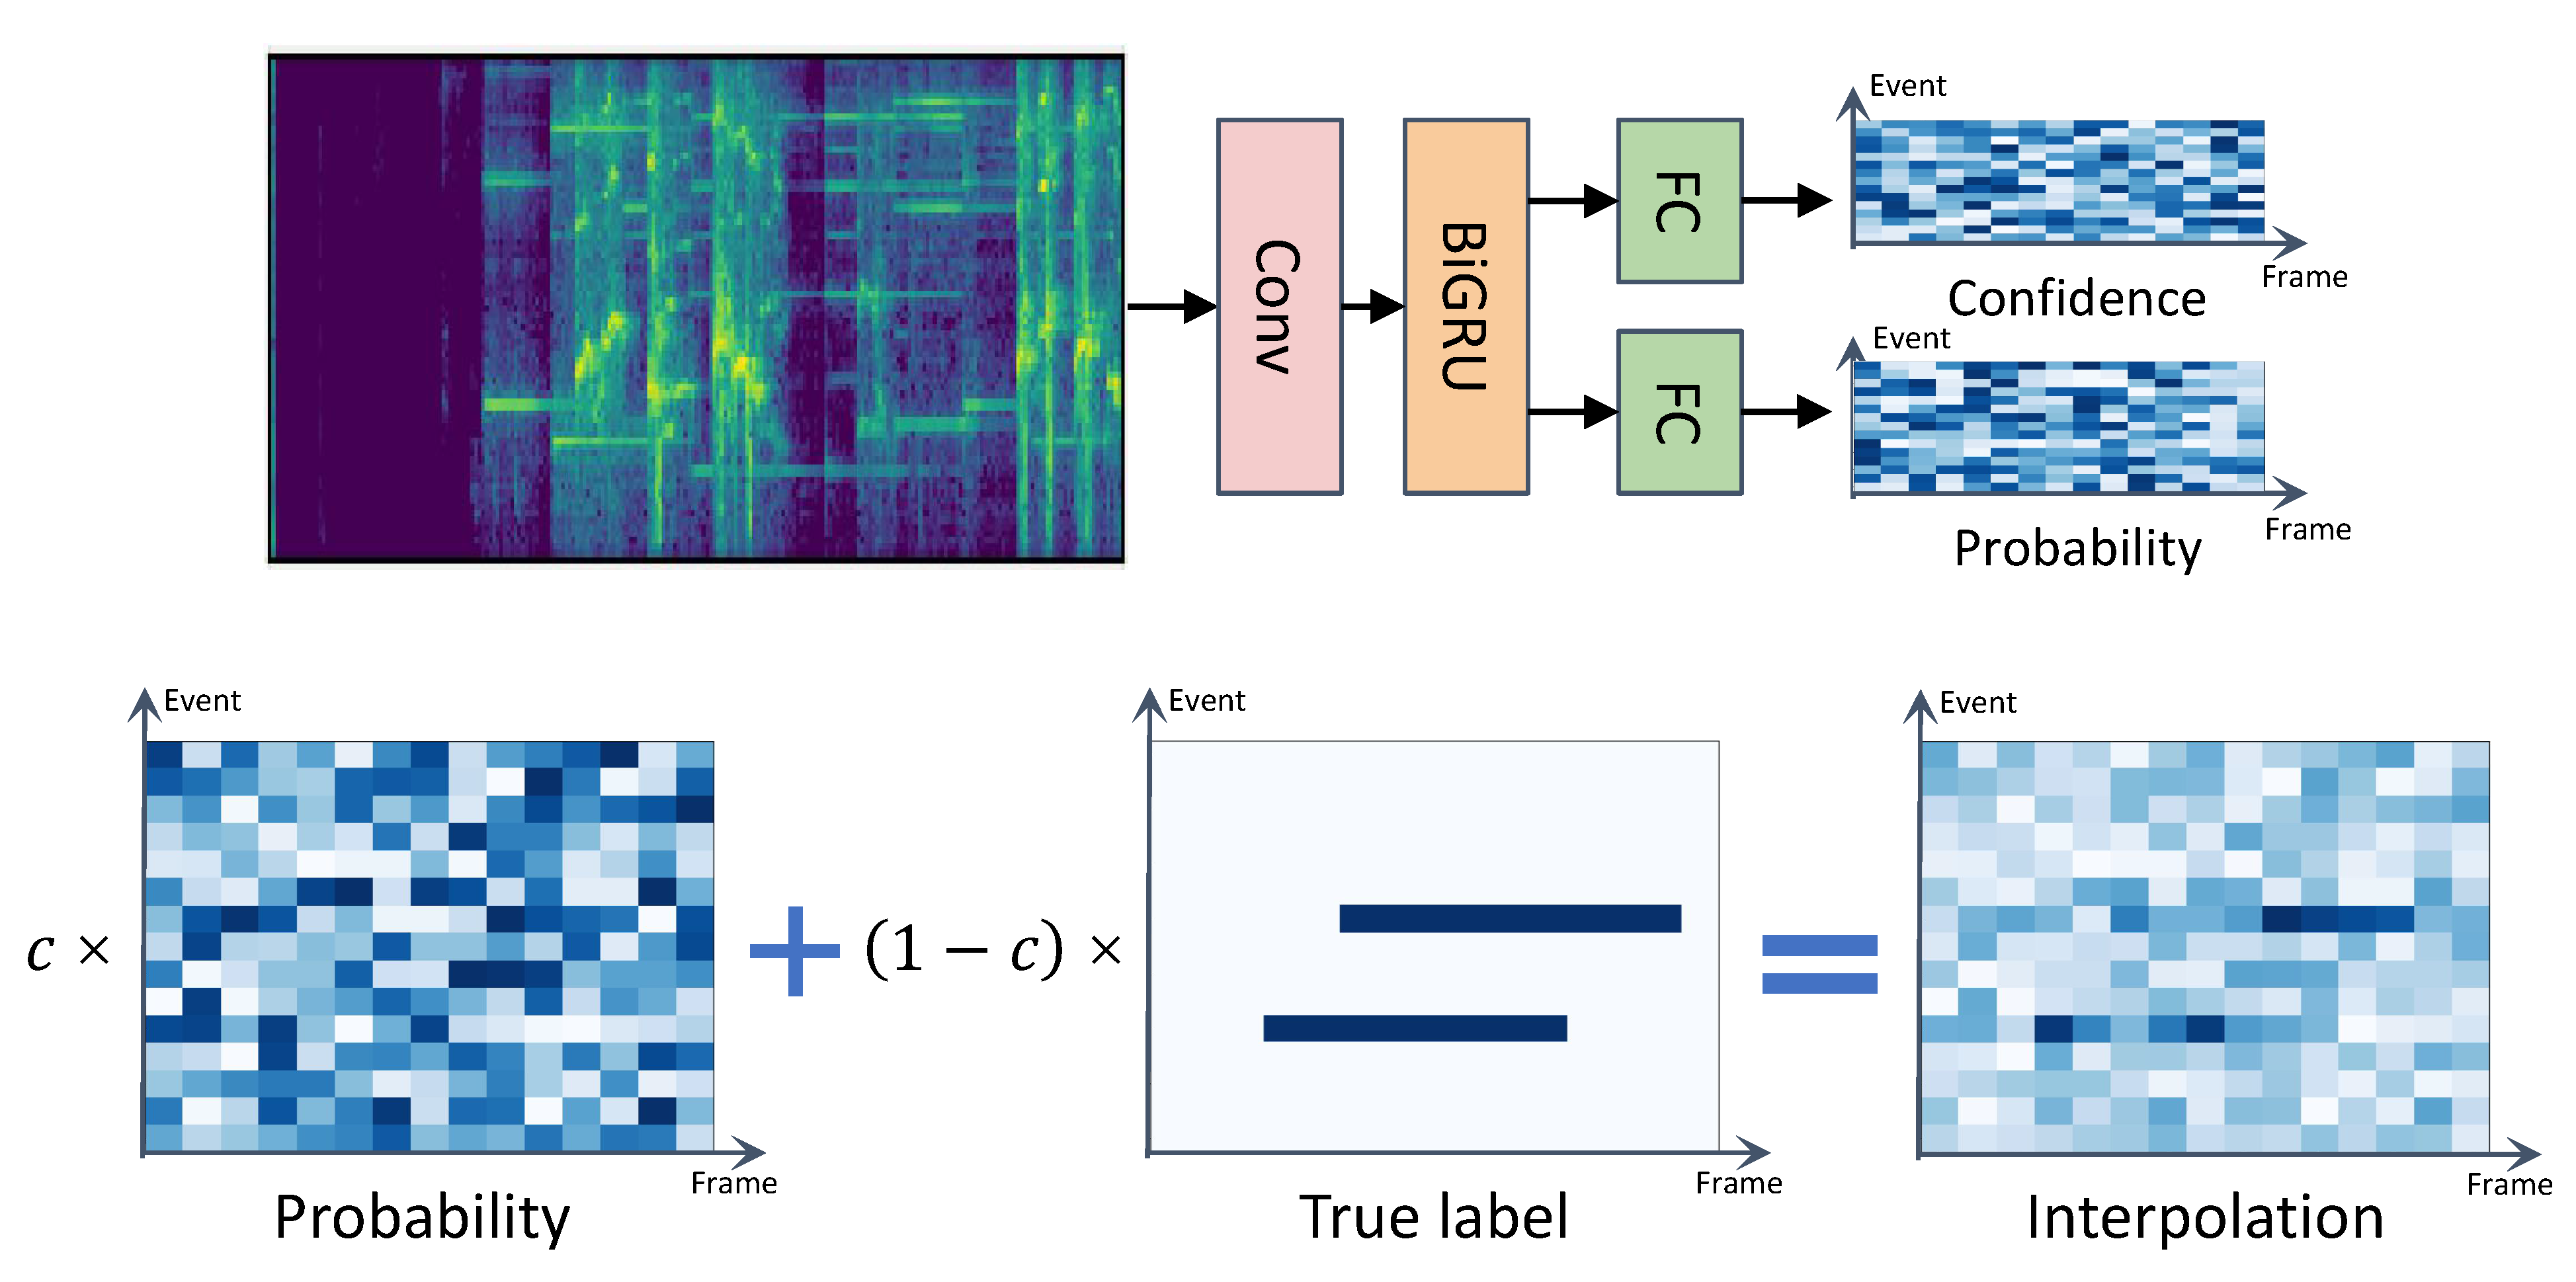
To get reliable confidence, we added a branch to train confidence in MT-SAED, as illustrated in Figure 1. When solving the issue of simultaneously generating AED predictions and their corresponding confidence without the confidence label, we draw on the successful experience in the field of out-of-distribution detection [24]. The motivation is equivalent to a special test that permits giving hints. Candidates are allowed to ask for hints according to their confidence of the questions. Furthermore, a certain penalty is carried out in order to prevent candidates from tending to ask for hints for all questions. To obtain the highest score, candidates must improve their ability to answer questions and self-assess at the same time.
MT-SAED is constructed based on the baseline model. There are four outputs in the baseline model, the frame-level output and clip-level output of the teacher model, and the frame-level output and clip-level output of the student model. For each clip, frame-level outputs and are T × C vectors containing probabilities for each frame, and clip-level outputs and are 1 × C vectors only containing probabilities for the clip, where T,C are the number of frames and types. A power pooling [25] is adopted between frame-level outputs and clip-level outputs. To make the model self-assessment, we add a confidence branch in parallel with the original class prediction branch. The confidence branch, which shares the same structure with the frame-level classification branch, applies a fully-connected layer followed by sigmoid. The confidence branch generates corresponding confidence values c for the classification results of each sound event at every frame. Output c takes values between 0 and 1. If the model is confident about the classification, output c will be closer to 1. Conversely, if the model is uncertain about the correctness of classification predictions, the value of c will be closer to 0.
A crucial issue of confidence is how to achieve the training of two tasks with just the classification labels. Following the main idea of giving hints, we construct a new frame-level output of student model with the label and two outputs and c:
The outputs of the student model and are in comparison with strong labels and utilizing the binary cross entropy (BCE) loss, as illustrated in Figure 2. The classification loss can be written as
Outputs and are compared with the outputs and by applying the mean square error (MSE) loss. The consistency loss is
Training with and loss functions, the network will be lazy at learning the differences between classes. Instead, the model tends to make c approach 0 and receives ground truth for every sample. Thus, a log penalty is added to the loss function. The confidence loss can be interpreted as a BCE loss:
The loss function of the multi-task system is
and parameter increases with epochs and is a hyperparameter. When is too small, the MT-SAED model tends to ask for hints and performs poorly in classification. When is too large, the confidence c and loses the distinction. To ensure the effects of both classification and confidence estimation, we first optimize the mean teacher model and classification branch without . Then, the trained parameters are fixed, and L is deployed to train the confidence branch separately for five epochs.
2.2.2. Stage Two: Retraining with Pseudo-Labels and Confidence
In the second stage, the weakly labeled and unlabeled data are sent to the trained MT-SAED model to yield frame-level predictions and confidence estimates. The frame-level posterior probabilities are applied as soft pseudo-labels for the above data during retraining. Confidence estimates offer an ability of self-assessment for pseudo-labels. For weakly labeled data, we regulate the outputs. Pseudo-labels are revised to 0, and confidence estimates are revised to 1 for negative clips. For strongly labeled data, all confidence estimates are set to 1. In order to guarantee the contribution of each sample under the premise of discrimination, we interpolate the confidence values with a hyperparameter to produce a new confidence:
The frame-level classification loss is weighted by as follows:
where represents the index of frames and classes. For those samples with high confidence, the accuracy of their pseudo-labels is higher. We make them more important during retraining. Conversely, the proportion of classification loss function value is relatively small for other samples. As a result, all strongly labeled, weakly labeled, and unlabeled data information are learned distinctly. and are omitted. The max pooling is adopted to produce clip-level predictions.
2.3. Pooling Functions
In C-SAED, we use different pooling functions between two-level predictions in two stages, as weak labels are only used in the first stage. To simplify, we briefly introduce two pooling functions for single event detection. Polyphonic SED can be considered as multiple binary classification problems.
In the first-stage training, the pooling function needs to complete two tasks simultaneously: one is to generate weights for frame-level predictions to form the clip-level prediction. The other is to generate frame-level gradients from clip-level gradients.
Because of the gradient backpropagation and the adaptability for sound events with various time scale, power pooling function [25] is the state-of-the-art method. Its formula and gradient formula are
is frame-level output probability, is clip-level output, and parameter n represents the exponent which should be non-negative. Here, n is a free parameter to be learned alongside the model parameters, which allows Equation (8) to automatically adapt to and interpolate between separate pooling functions for different sound events. For instance, when , Equation (8) reduces to mean pooling. When , Equation (8) simplifies to linear pooling. When , Equation (8) approaches the max aggregation.
The gradient backpropagation of power pooling is quite suitable for SED. For positive clips, larger is driven to 1 and smaller is driven to 0, benefiting the timestamps detection. For negative clips, is pushed towards . Considering that is trained towards 0, all the will converge to 0 as desired after enough iterations.
As for the second-stage training, only strong labels are applied. Then, max pooling is the default choice. After frame-level predictions are smoothed by the median filter, if at least one frame is positive, we regard that the clip is positive.
3. Experiments and Discussion
Dataset and Metrics
We carried out experiments on the DCASE 2019 Task4 dataset [12], DCASE 2018 Task4 dataset [11]. Since these two datasets contain the same ten sound events, we take the training set of DCASE 2019 as our training set, including synthetic strongly labeled (2045 clips), weakly labeled (1578 clips), and unlabeled (14,412 clips). The validation set (1168 clips) of DCASE 2019 and the evaluation set of DCASE 2018 (800 clips) are used for tests.
These two datasets consist of 10 classes of sound events in a domestic environment: Speech, Dog, Cat, Alarm/bell/ringing, Dishes, Frying, blender, Running water, Vacuum cleaner, and Electric shaver/toothbrush. The sampling rate is 44,100 Hz. The duration of each audio clip is around 10 s, and multiple audio events may occur at the same time.
In addition, we select clips with multiple events from the validation set of DCASE 2019 and name the set . This set is used to evaluate the performance for the case with two or more acoustics events in a clip. The polyset contains 331 clips.
Experiments were evaluated with event-based macro-average error rate (ER) with a 200 ms collar on onsets and a 200 ms/20% of the events length collar on offsets. The formula is
where c is the number of sound event types, , the insertion error, represents the number of sound events i generated by model outputs that do not appear in the clips actually. , deletion error, is the number of sound events i in the clips that were not identified by the model. is the number of active sound events i in the reference. A low ER indicates a more accurate SED system. The specific evaluation details can be found in [26].
4. Results and Analysis
In this section, we first compare the evaluation ability of posterior probability with confidence. Then, our methods are compared with other methods on the test sets. Finally, we analyze the effectiveness of the hyperparameter and specify a prior joint distribution for and .
4.1. Comparison of Posterior Probability and Confidence as Evaluation Criteria
Figure 3 focuses on positive predictions, as classic self-training methods choose samples with high probabilities. Figure 3 demonstrates that accuracy increases with confidence estimates. For posterior probabilities, accuracy first decreases rapidly and then flattens. The reason is that the classification outputs are trained towards 0 or 1. The number of samples with probabilities in [0.5, 0.6] is relatively small, which might result in a high accuracy. Most posterior probabilities are concentrated in [0.9, 1], but they contain many false positive frames. Figure 3 confirms that the posterior probabilities cannot evaluate the correctness of predictions. In contrast, we notice that the confidence of positive predictions is concentrated in [0, 0.1]. This behavior coincides with massive false positives produced by MT-SAED. Figure 3 indicates that the confidence can measure the accuracy of predictions.
4.2. Comparison with Other Methods
We compared the proposed model with the following approaches:
- MT18: the official baseline for DCASE2019 task4, with the mean teacher structure [17].
- Baseline: modified MT18 method with attention pooling.
- MT-SAED: the stage one model of C-SAED with power pooling.
- Prob0.9: only predictions with added to pseudo-labels, samples retrained with equal weight [20].
- Prob: all samples retrained with probabilities as weights.
- Prob0.5: only predictions with added to pseudo-labels, samples retrained with confidence.
Table 1 lists the performance of different models on the three test sets. The results illustrate that C-SAED models are significantly improved in contrast to the other models. The ER improvement is mainly due to the significant reduction of INS error. That is, the improvement comes from correcting false positives. When the model retrained with parameter , ER also decreased. Although the mean teacher method already makes use of weakly labeled and unlabeled data, applying an appropriate self-training structure can effectively reduce false alarms. However, Prob0.9 introduced massive false positive predictions as pseudo-labels and applied them equally, resulting in many insertion errors. Prob caused performance degradation due to the fact that the majority of true negatives owned small weights approximately 0.7 after applying parameter . Meanwhile, many false positives (Figure 3) were introduced with high weights. In contrast, C-SAED with confidence further improved ER by successfully strengthening the attention to true negatives and true positives. The poor results of Prob0.5 reveal the importance of true negatives. In addition, for most models, the error rate on polyset is 0.13 to 0.2 higher than results on validation 2019. This phenomenon confirms that polyphonic audio event detection is more challenging than monophonic audio event detection.
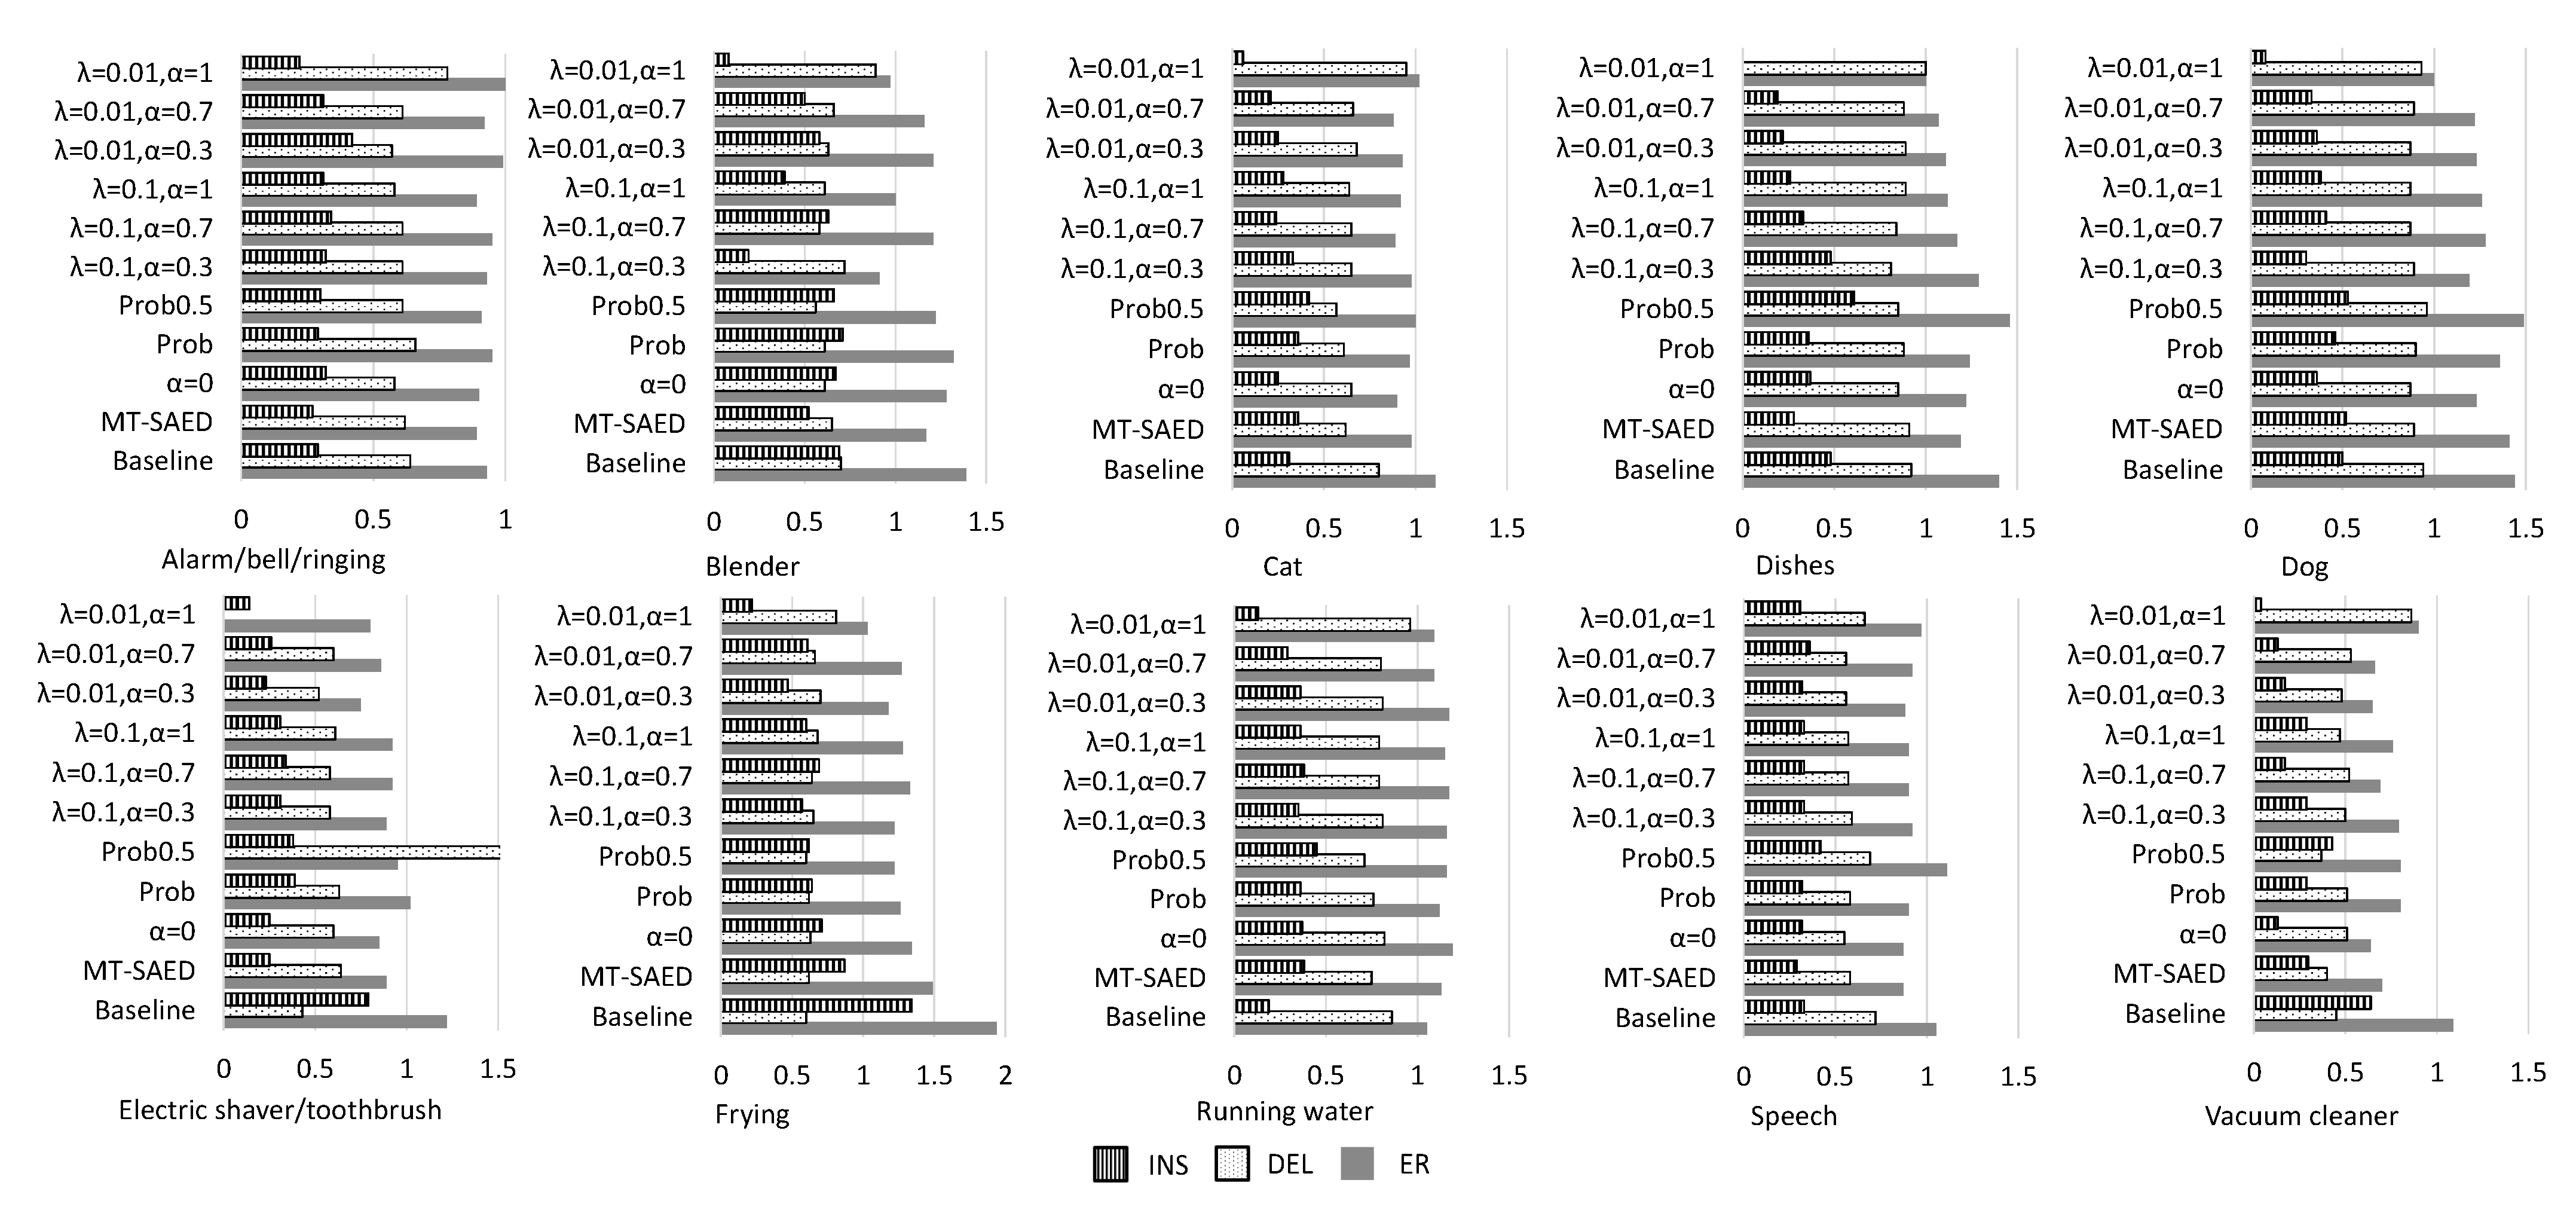
Figure 4 shows the class-wise error rates. We omit “Prob0.9” which yielded high ERs, and “MT18” whose original paper does not report its detailed error rates. Some conclusions can be drawn. First, the parameter and effect on the INS and the DEL errors—for example, when = 0.01, large ( = 1.0) gives lower INS but higher DEL compared with small ( = 0.3). The reason may be that large gives low weights on the samples with low confidences, which makes the predicted events accurate but may fail with difficult samples. Second, the proposed 2-stage scheme outperforms the baseline, MT-SAED, and self-training on most events. Third, different events have different difficulties in classification. For example, event alarm/bell/ringing, electric shaver/toothbrush, and vacuum cleaner have relatively lower ERs, while event frying gives the highest ER.
4.3. The Effect of Hyperparameter
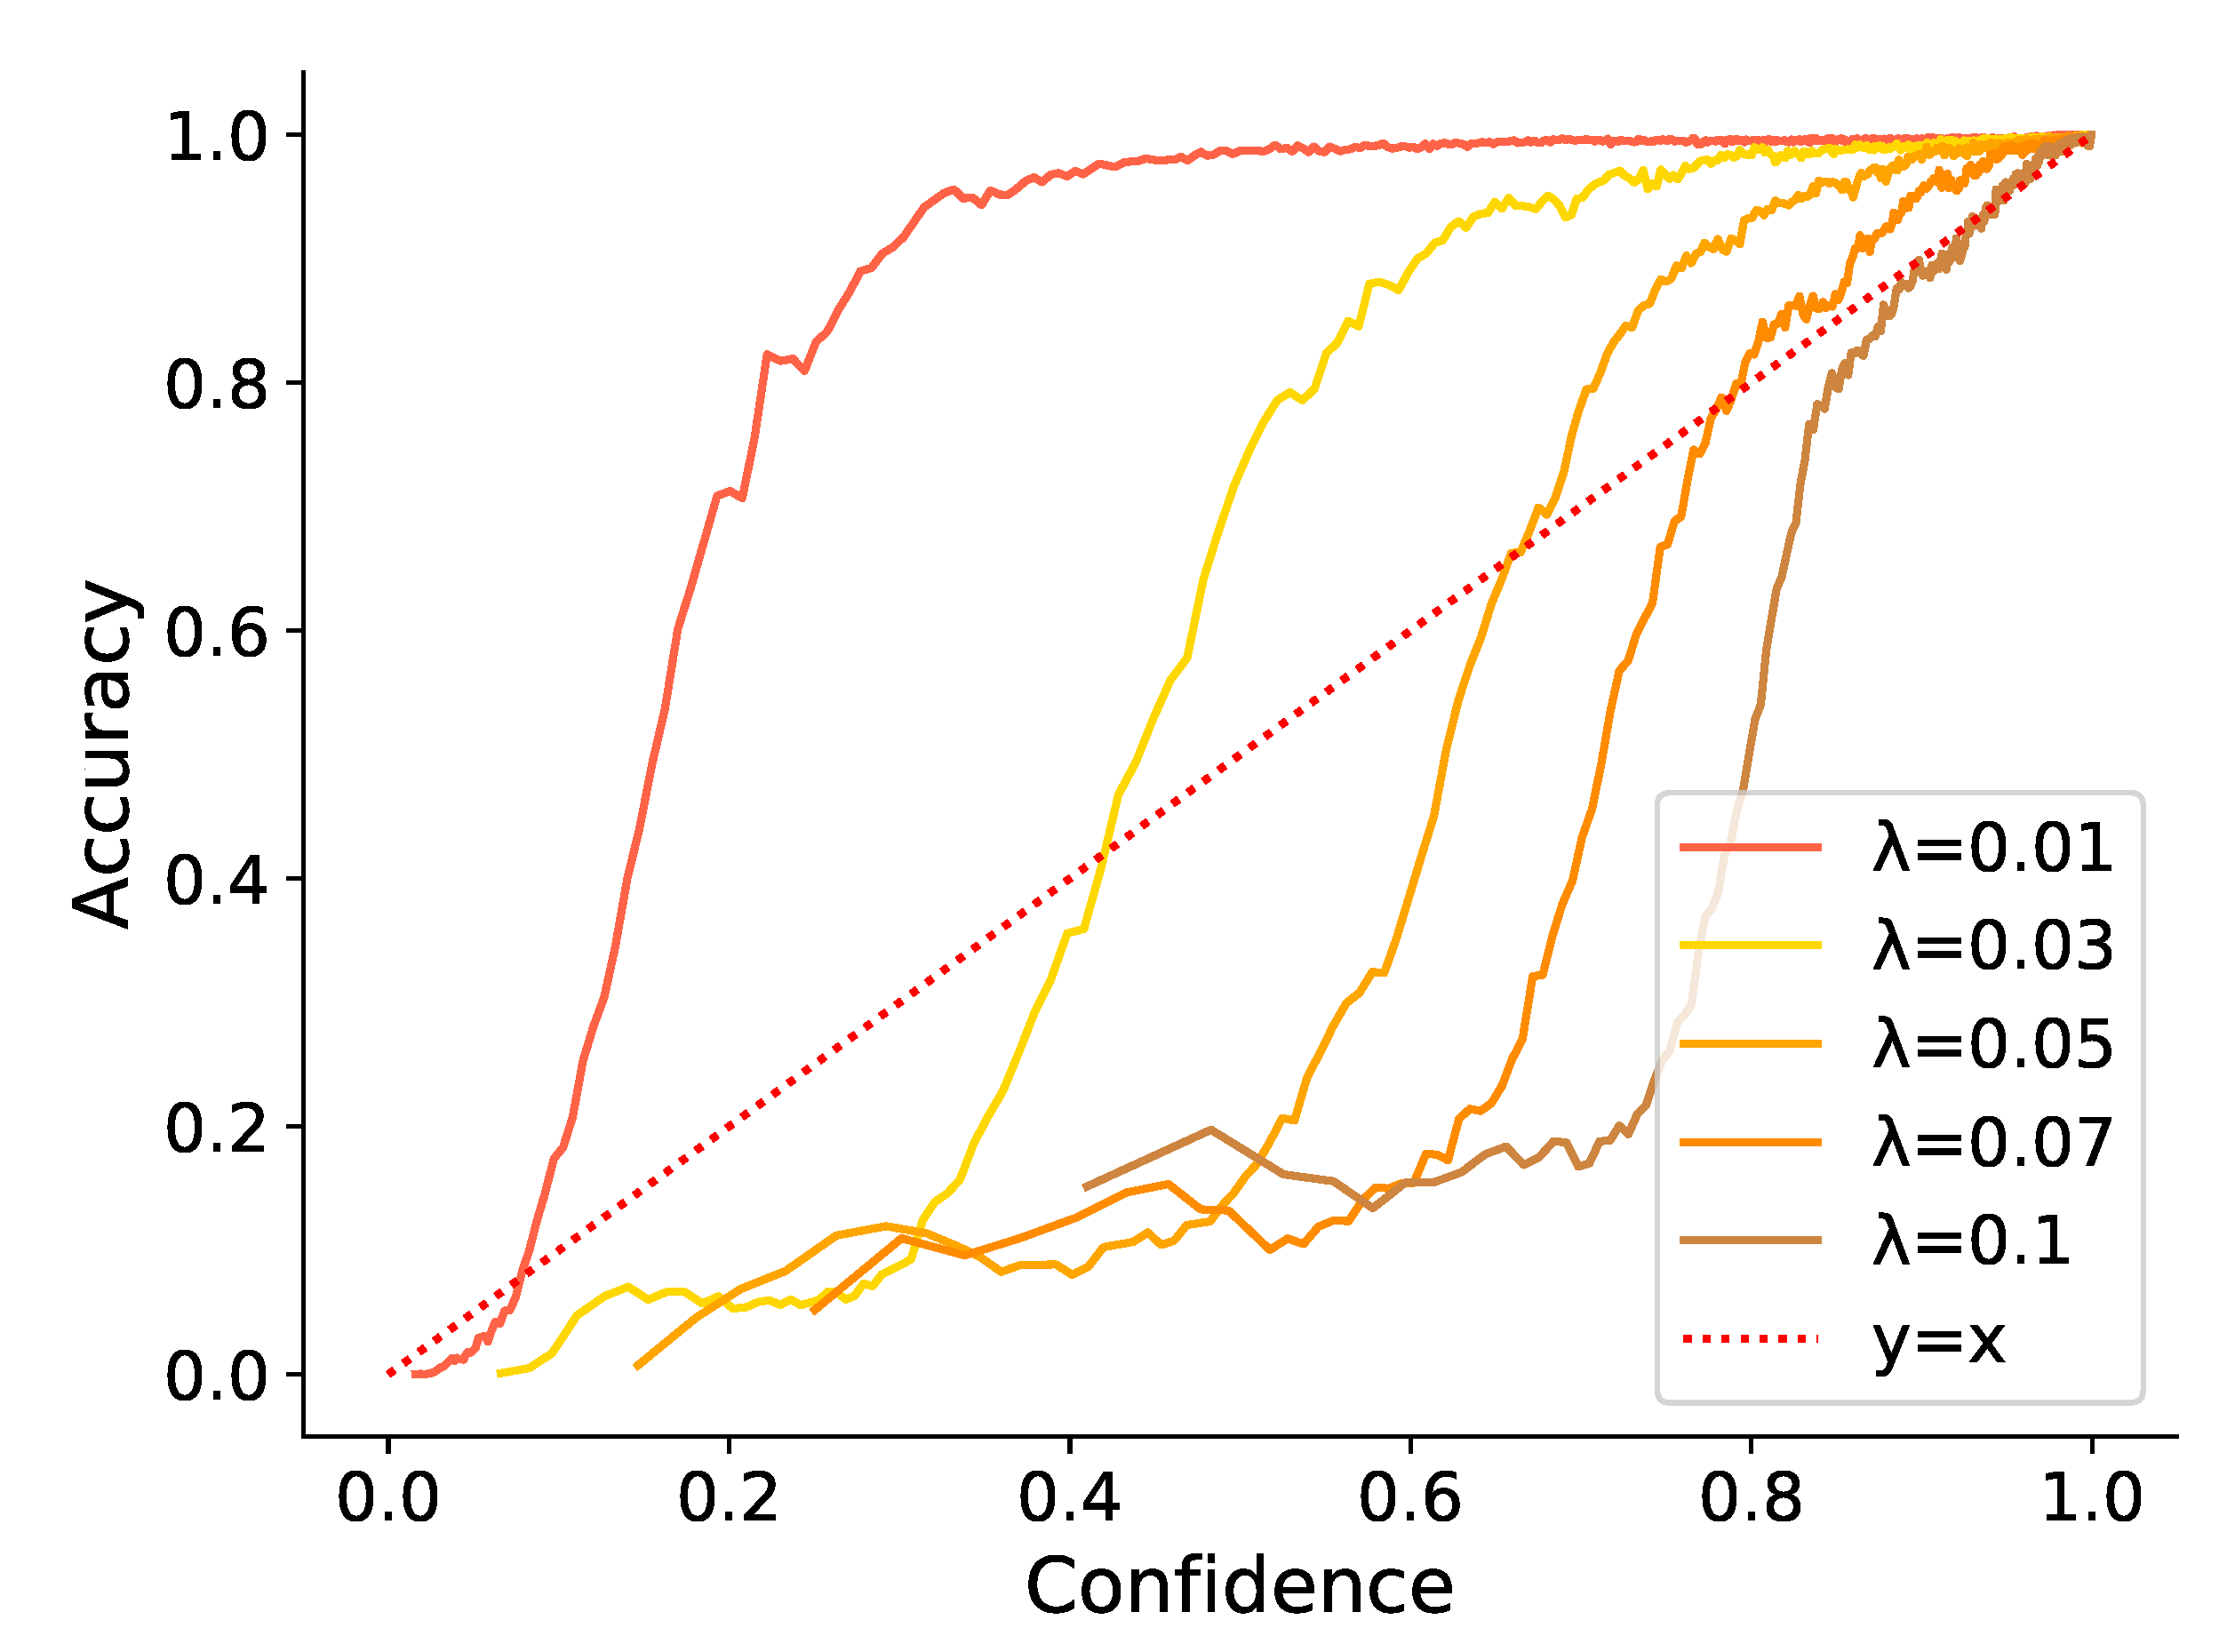
As mentioned in [24], parameter greatly influences the threshold and distinctiveness of confidence. We adjusted in a small range to explore the effect of . Figure 5 illustrates that all MT-AED models trained with could generate confidence that is positively related to the accuracy of predictions. However, if is relatively large, the confidence values are aggregated. If is relatively small, a majority of confidence estimates possess the similar accuracy. Polyline represents the ideal discrimination of prediction quality measurement. Therefore, the smaller the area between the curve and the Polyline , the better the discrimination of confidence. In our experiment, curve brought out the best distinction.
Table 1 and Figure 5 demonstrate that a suitable combination of parameters and can produce more balanced detection results. INS errors were reduced under the premise of small fluctuations in DEL errors. As an example, when , , or , , the total number of events correctly predicted did not reduce while ER decreased significantly. These combinations increase the lower bound of confidence values, ensure the information contribution of samples with low confidence, and preserve the distinction of confidence.
In practice, the joint usage of and is recommended to obey the following rules. First, is expected from 0.01 to 0.1; can be set from 0.3 to 1.0. Second, a small usually corresponds to a relative small . The reason might be that a small leads to a broader distribution of confidence and a small forces the model to pay attention to more samples. The averaging of different models with different combinations can bring further improvement. Third, under the condition of fixed , a larger is a better choice when the task is simple or the model has demonstrated relatively high performance.
5. Conclusions
In this paper, we propose a C-SAED framework with a confidence learning scheme. Our experiments verified that the proper combination of self-training and mean teacher method is better than employing mean teacher alone. Furthermore, the multi-task structure with a joint learning strategy can generate more reliable confidence values for classification probabilities. The confidence estimates are used as weights to optimize the self-training retraining process, which creates a further improvement. The C-SAED framework can also be extended to other semi-supervised tasks. In addition, this paper introduces a confidence training method to SAED, but confidence can also be applied in other scenes, such as optimizing focal loss.
Author Contributions
Conceptualization, Y.L. and H.C.; Data curation, Y.L. and J.W.; Formal analysis, Y.L. and H.C.; Funding acquisition, P.Z.; Investigation, P.W.; Methodology, Y.L. and H.C.; Resources, P.W.; Software, J.W.; Supervision, P.Z.; Validation, Y.L.; Visualization, Y.L.; Writing—original draft, Y.L.; Writing—review and editing, H.C. and P.Z. All authors have read and agreed to the published version of the manuscript.
Funding
This research was funded by the National Natural Science Foundation of China. The funder grant is No. 62071461.
Institutional Review Board Statement
Not applicable.
Informed Consent Statement
Not applicable.
Data Availability Statement
The DCASE 2019 TASK4 dataset was analyzed in this study. These data can be found: (http://dcase.community/challenge2019/task-sound-event-detection-in-domestic-environments, accessed on 14 September 2021). The evaluation dataset of DCASE 2018 TASK4 was analyzed in this study. These data can be found here: (https://github.com/DCASE-REPO/dcase2018_baseline/tree/master/task4/dataset/metadata/eval), accessed on 14 September 2021.
Conflicts of Interest
The authors declare no conflict of interest.
References
- Bello, J.P.; Silva, C.; Nov, O.; Dubois, R.L.; Arora, A.; Salamon, J.; Mydlarz, C.; Doraiswamy, H. SONYC: A System for Monitoring, Analysis and Mitigation of Urban Noise Pollution. Commun. ACM 2019, 62, 68–77. [Google Scholar] [CrossRef]
- Lostanlen, V.; Salamon, J.; Farnsworth, A.; Kelling, S.; Bello, J.P. Birdvox-Full-Night: A Dataset and Benchmark for Avian Flight Call Detection. In Proceedings of the 2018 IEEE International Conference on Acoustics, Speech and Signal Processing (ICASSP), Calgary, AB, Canada, 15–20 April 2018; pp. 266–270. [Google Scholar]
- Crocco, M.; Cristani, M.; Trucco, A.; Murino, V. Audio Surveillance: A Systematic Review. ACM Comput. Surv. 2016, 48, 1–46. [Google Scholar] [CrossRef]
- Hershey, S.; Chaudhuri, S.; Ellis, D.P.W.; Gemmeke, J.F.; Jansen, A.; Moore, R.C.; Plakal, M.; Platt, D.; Saurous, R.A.; Seybold, B.; et al. CNN architectures for large-scale audio classification. In Proceedings of the 2017 IEEE International Conference on Acoustics, Speech and Signal Processing (ICASSP), New Orleans, LA, USA, 5–9 March 2017; pp. 131–135. [Google Scholar]
- Foggia, P.; Petkov, N.; Saggese, A.; Strisciuglio, N.; Vento, M. Reliable Detection of Audio Events in Highly Noisy Environments. Pattern Recognit. Lett. 2015, 65, 22–28. [Google Scholar] [CrossRef]
- Heittola, T.; Mesaros, A.; Eronen, A.; Virtanen, T. Context-dependent sound event detection. EURASIP J. Audio Speech Music Process. 2013, 2013, 1–13. [Google Scholar] [CrossRef] [Green Version]
- Cakir, E.; Heittola, T.; Huttunen, H.; Virtanen, T. Polyphonic sound event detection using multi label deep neural networks. In Proceedings of the 2015 International Joint Conference on Neural Networks (IJCNN), Killarney, Ireland, 12–17 July 2015. [Google Scholar]
- Parascandolo, G.; Huttunen, H.; Virtanen, T. Recurrent Neural Networks for Polyphonic Sound Event Detection in Real Life Recordings. In Proceedings of the IEEE International Conference on Acoustics, Speech, and Signal Processing, Shanghai, China, 20–25 March 2016. [Google Scholar]
- Phan, H.; Hertel, L.; Maass, M.; Mertins, A. Robust Audio Event Recognition with 1-Max Pooling Convolutional Neural Networks. arXiv 2016, arXiv:1604.06338. [Google Scholar]
- Akr, E.; Virtanen, T. End-to-End Polyphonic Sound Event Detection Using Convolutional Recurrent Neural Networks with Learned Time-Frequency Representation Input. In Proceedings of the 2018 International Joint Conference on Neural Networks (IJCNN), Rio de Janeiro, Brazil, 8–13 July 2018. [Google Scholar]
- Serizel, R.; Turpault, N.; Eghbal-Zadeh, H.; Shah, A.P. Large-scale weakly labeled semi-supervised sound event detection in domestic environments. In Proceedings of the Detection and Classification of Acoustic Scenes and Events 2018 Workshop (DCASE2018), Surrey, UK, 19–20 November 2018; pp. 19–23. [Google Scholar]
- Turpault, N.; Serizel, R.; Parag Shah, A.; Salamon, J. Sound event detection in domestic environments with weakly labeled data and soundscape synthesis. In Proceedings of the Detection and Classification of Acoustic Scenes and Events 2019 Workshop (DCASE2019), New York, NY, USA, 25–26 October 2019; pp. 253–257. [Google Scholar]
- Lin, L.; Wang, X.; Liu, H.; Qian, Y. Guided Learning for Weakly-Labeled Semi-Supervised Sound Event Detection. In Proceedings of the 2020 IEEE International Conference on Acoustics, Speech and Signal Processing (ICASSP), Barcelona, Spain, 4–8 May 2020; pp. 626–630. [Google Scholar]
- Yan, J.; Song, Y.; Dai, L.; McLoughlin, I. Task-Aware Mean Teacher Method for Large Scale Weakly Labeled Semi-Supervised Sound Event Detection. In Proceedings of the ICASSP 2020—2020 IEEE International Conference on Acoustics, Speech and Signal Processing (ICASSP), Barcelona, Spain, 4–8 May 2020; pp. 326–330. [Google Scholar]
- Tarvainen, A.; Valpola, H. Mean teachers are better role models: Weight-averaged consistency targets improve semi-supervised deep learning results. arXiv 2017, arXiv:1703.01780. [Google Scholar]
- Wang, J.; Xia, J.; Yang, Q.; Zhang, Y. Research on Semi-Supervised Sound Event Detection Based on Mean Teacher Models Using ML-LoBCoD-NET. IEEE Access 2020, 8, 38032–38044. [Google Scholar] [CrossRef]
- Lu, J. Mean Teacher Convolution System for Dcase 2018 Task 4. DCASE2018 Challenge. 2018. Available online: http://dcase.community/documents/challenge2018/technical_reports/DCASE2018_Lu_19.pdf (accessed on 14 September 2021).
- Lionel, D.; Cyril, P. Mean Teacher with Data Augmentation for Dcase 2019 Task 4; DCASE2019 Challenge; Orange Labs: Lannion, France, 2019. [Google Scholar]
- McClosky, D.; Charniak, E.; Johnson, M. Effective Self-training for Parsing. In Proceedings of the Human Language Technology Conference of the North American Chapter of the Association of Computational Linguistics, New York, NY, USA, 4–9 June 2006; pp. 152–159. [Google Scholar]
- Liu, Y.L.; Yan, J.; Song, Y. Ustc-Nelslip System for Dcase 2018 Challenge Task 4. DCASE2018 Challenge. 2018. Available online: http://dcase.community/documents/challenge2018/technical_reports/DCASE2018_Liu_69.pdf (accessed on 14 September 2021).
- Elizalde, B.; Shah, A.; Dalmia, S.; Min, H.L.; Lane, I. An Approach for Self-Training Audio Event Detectors Using Web Data. In Proceedings of the 2017 25th European Signal Processing Conference (EUSIPCO), Kos, Greece, 28 August–2 September 2017. [Google Scholar]
- Kothintiu, S.; Imoto, K.; Charkrabarty, D. Joint Acoustic and Class Inference for Weakly Supervised Sound Event Detection. DCASE2018 Challenge. 2018. Available online: http://dcase.community/documents/challenge2018/technical_reports/DCASE2018_Kothinti_90.pdf (accessed on 14 September 2021).
- Guo, C.; Pleiss, G.; Yu, S.; Weinberger, K.Q. On Calibration of Modern Neural Networks. In Proceedings of the 34th International Conference on Machine Learning, Sydney, Australia, 6–11 August 2017; pp. 1321–1330. [Google Scholar]
- DeVries, T.; Graham, W.T. Learning Confidence for Out-of-Distribution Detection in Neural Network. arXiv 2018, arXiv:1802.04865. [Google Scholar]
- Liu, Y.; Chen, H.; Wang, Y.; Zhang, P. Power pooling: An adaptive pooling function for weakly labelled sound event detection. arXiv 2021, arXiv:2010.09985. [Google Scholar]
- Mesaros, A.; Heittola, T.; Virtanen, T. Metrics for Polyphonic Sound Event Detection. Appl. Sci. 2016, 6, 162. [Google Scholar] [CrossRef]
Figure 1.
The top of the figure shows that a sound event system with an extra confidence branch. The sound event model receives the input spectrogram and outputs frame-level prediction probabilities and the corresponding frame-level confidence values. The bottom of the figure illustrates the process of the generation of new probabilities with output probabilities, targets, and confidence value.

Figure 2.
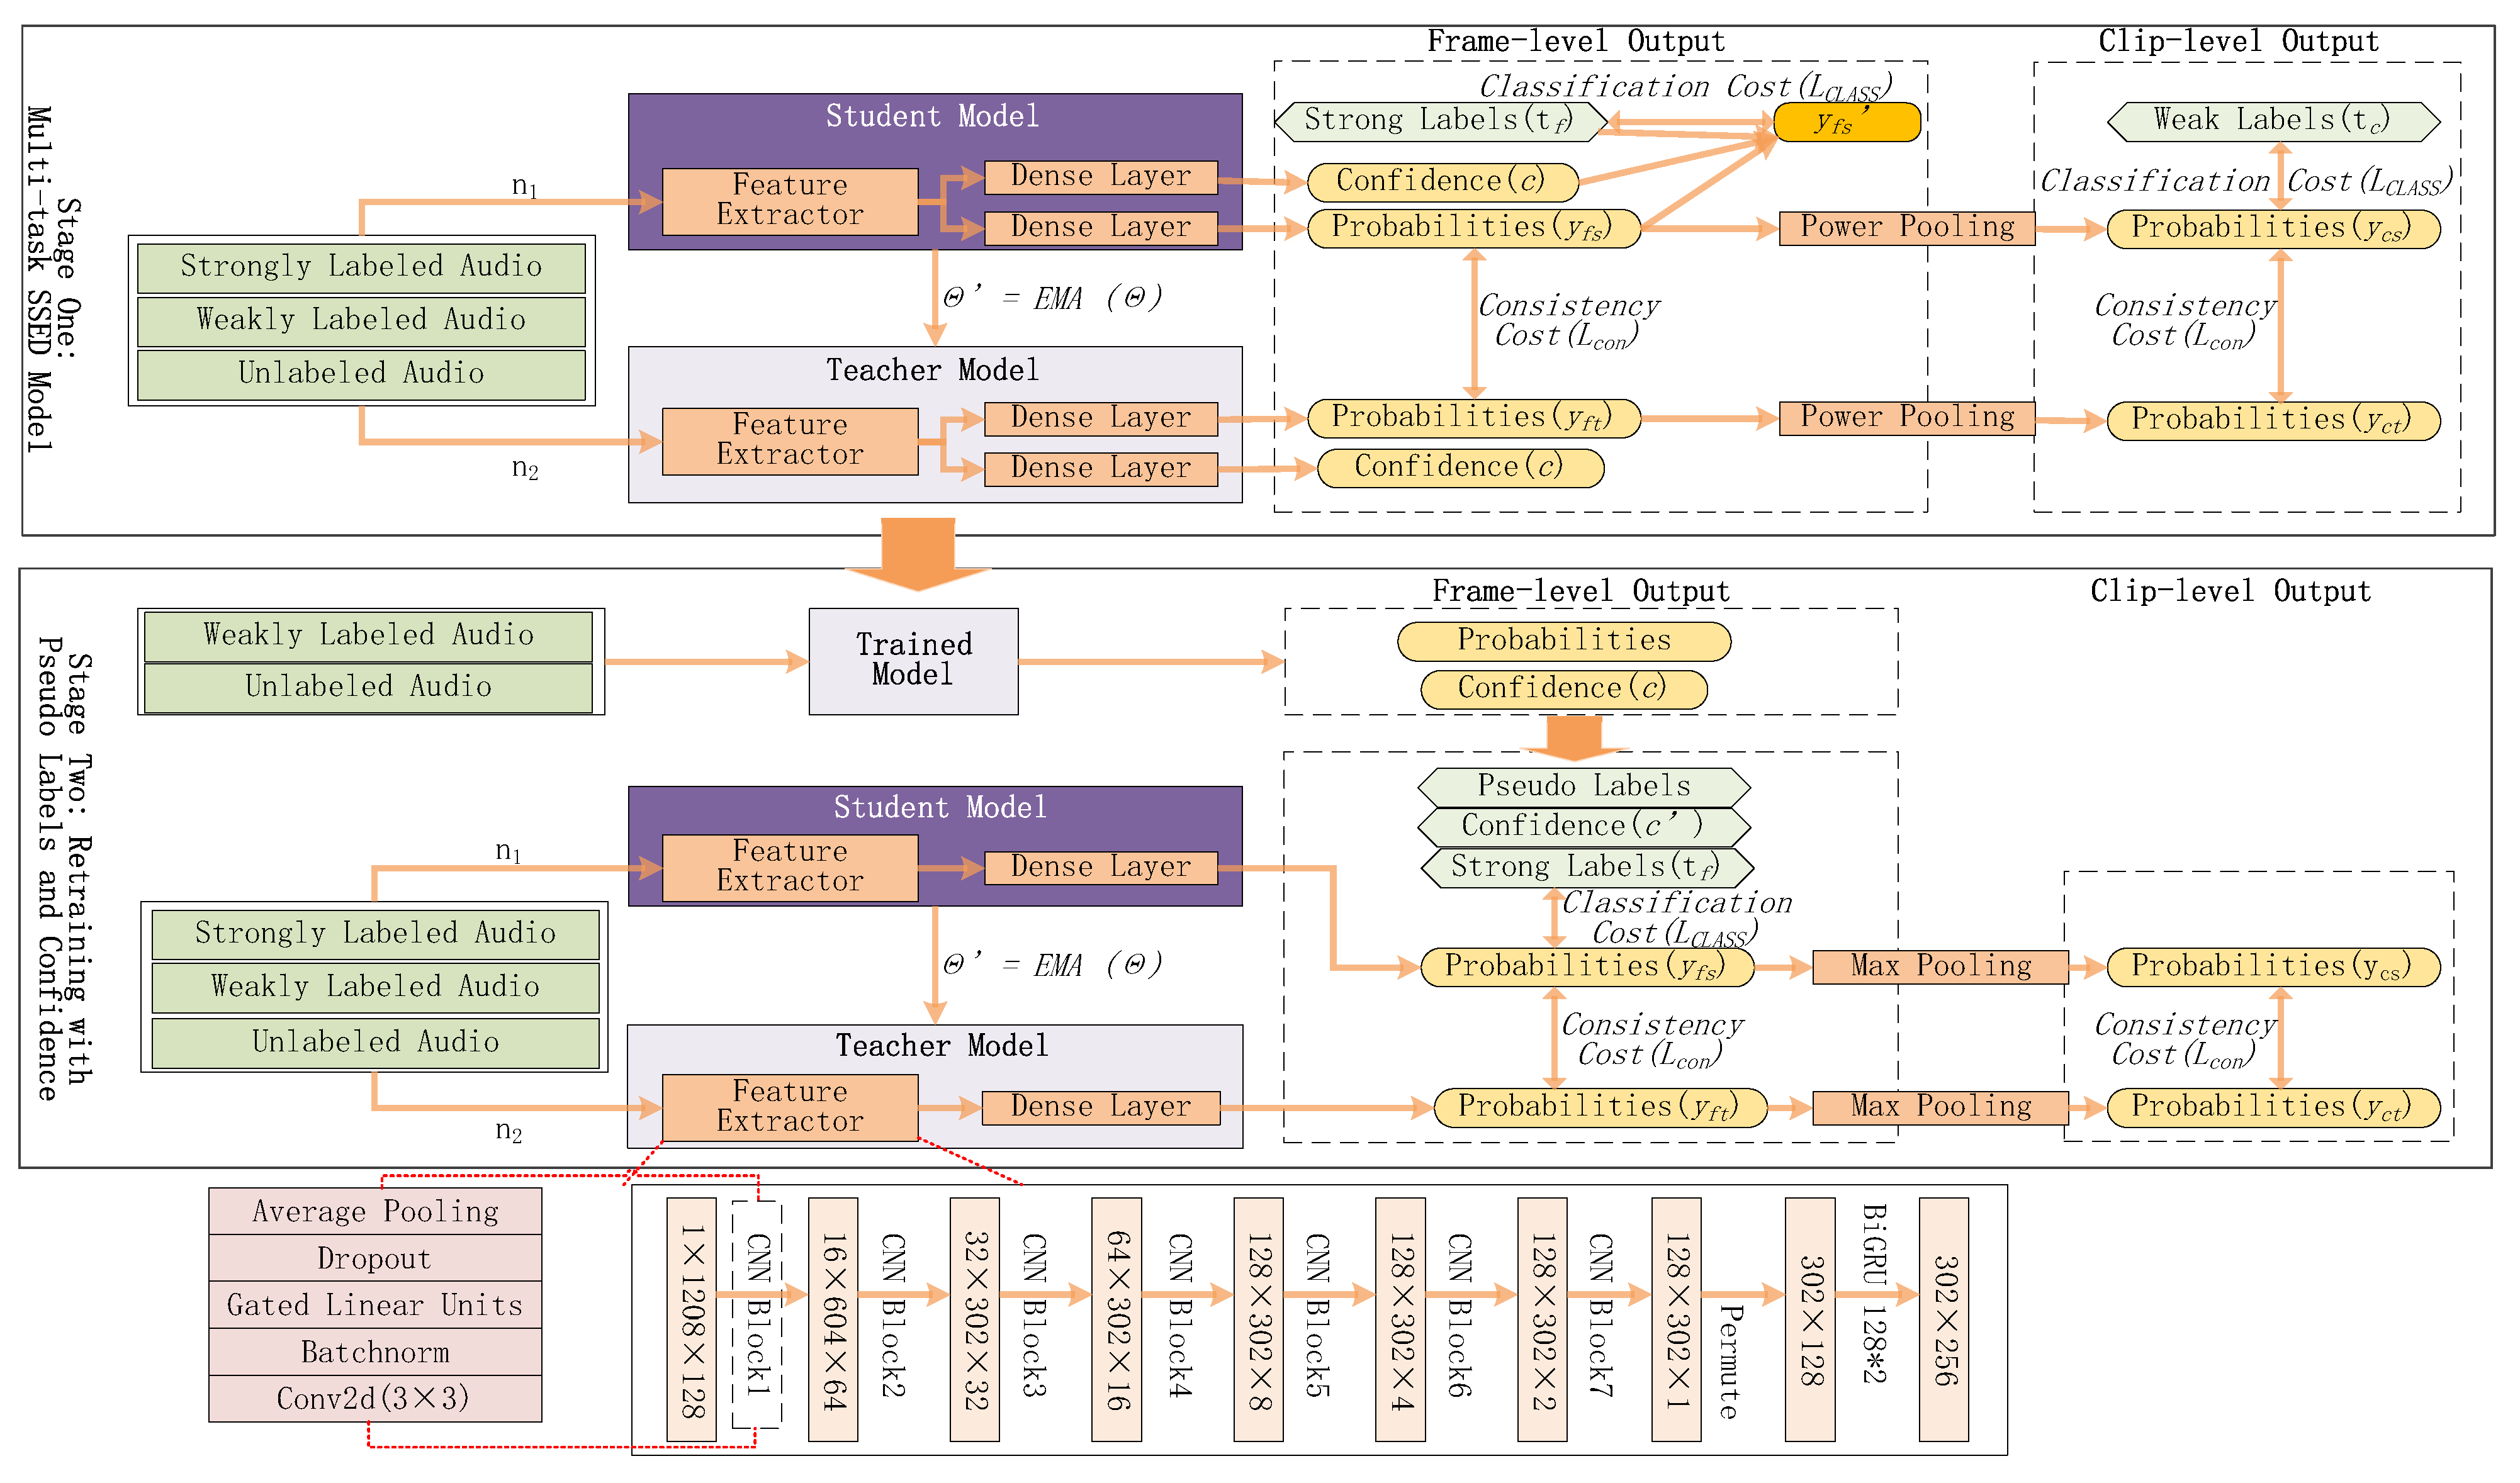
Framework C-SAED: Stage one introduces a muti-task system that can generate frame-level classification predictions and corresponding confidence estimates. The pseudo-labels and confidence for weakly labeled data and unlabeled data are produced and applied in stage two. The power pooling function is adopted in the first stage. , are noises added to the student model and the teacher model. After the weights of the student model () have been updated with a gradient descent, the teacher model weights () are updated as an exponential moving average (EMA) of the student weights.
Figure 2.
Framework C-SAED: Stage one introduces a muti-task system that can generate frame-level classification predictions and corresponding confidence estimates. The pseudo-labels and confidence for weakly labeled data and unlabeled data are produced and applied in stage two. The power pooling function is adopted in the first stage. , are noises added to the student model and the teacher model. After the weights of the student model () have been updated with a gradient descent, the teacher model weights () are updated as an exponential moving average (EMA) of the student weights.

Figure 3.
Accuracy of frame-level predictions changes with confidence estimates and probabilities. The accuracy of positive predictions () changed with learned confidence estimations and probabilities. Their polynomial fitting curves are displayed.
Figure 3.
Accuracy of frame-level predictions changes with confidence estimates and probabilities. The accuracy of positive predictions () changed with learned confidence estimations and probabilities. Their polynomial fitting curves are displayed.

Figure 4.
Results of different models for each event on the DCASE2019 dataset.

Figure 5.
The accuracy of frame-level predictions changes with confidence estimates and probabilities. The values of parameter influence confidence-accuracy curves.
Figure 5.
The accuracy of frame-level predictions changes with confidence estimates and probabilities. The values of parameter influence confidence-accuracy curves.


Table 1.
Comparison of models in terms of ER (%). Retraining with is equal to retrain without confidence. We bold the reduced ER value after retraining.
Table 1.
Comparison of models in terms of ER (%). Retraining with is equal to retrain without confidence. We bold the reduced ER value after retraining.
| Model | Evaluation 2018 | Validation 2019 | Polyset | |||||||
|---|---|---|---|---|---|---|---|---|---|---|
| ER | DEL | INS | ER | DEL | INS | ER | DEL | INS | ||
| MT18 | 1.65 | 0.78 | 0.87 | 1.56 | 0.76 | 0.80 | - | - | - | |
| Baseline | 1.34 | 0.72 | 0.62 | 1.26 | 0.70 | 0.56 | 1.45 | 0.81 | 0.64 | |
| MT-SAED | 1.13 | 0.69 | 0.44 | 1.07 | 0.67 | 0.40 | 1.26 | 0.75 | 0.51 | |
| Retrain | ||||||||||
| 0 | 1.10 | 0.68 | 0.42 | 1.04 | 0.67 | 0.37 | 1.18 | 0.75 | 0.43 | |
| Prob0.9 | 1 | 3.72 | 0.70 | 3.02 | 3.41 | 0.69 | 2.72 | 3.91 | 0.80 | 3.11 |
| Prob | 0.3 | 1.15 | 0.68 | 0.47 | 1.09 | 0.66 | 0.43 | 1.28 | 0.76 | 0.52 |
| Prob0.5 | 0 | 1.19 | 0.68 | 0.51 | 1.14 | 0.68 | 0.46 | 1.32 | 0.77 | 0.55 |
| C-SAED | 0.3 | 1.09 | 0.70 | 0.39 | 1.03 | 0.68 | 0.35 | 1.23 | 0.78 | 0.45 |
| ( = 0.1) | 0.7 | 1.13 | 0.69 | 0.44 | 1.05 | 0.67 | 0.38 | 1.17 | 0.75 | 0.43 |
| 1 | 1.06 | 0.68 | 0.38 | 1.02 | 0.67 | 0.35 | 1.19 | 0.74 | 0.45 | |
| C-SAED | 0.3 | 1.08 | 0.69 | 0.39 | 1.01 | 0.67 | 0.34 | 1.16 | 0.75 | 0.41 |
| ( = 0.01) | 0.7 | 1.06 | 0.70 | 0.36 | 1.01 | 0.69 | 0.32 | 1.14 | 0.76 | 0.38 |
| 1 | 1.00 | 0.86 | 0.14 | 0.98 | 0.85 | 0.13 | 1.02 | 0.89 | 0.13 | |
Publisher’s Note: MDPI stays neutral with regard to jurisdictional claims in published maps and institutional affiliations. |
© 2021 by the authors. Licensee MDPI, Basel, Switzerland. This article is an open access article distributed under the terms and conditions of the Creative Commons Attribution (CC BY) license (https://creativecommons.org/licenses/by/4.0/).
Share and Cite
MDPI and ACS Style
Liu, Y.; Chen, H.; Wang, J.; Wang, P.; Zhang, P. Confidence Learning for Semi-Supervised Acoustic Event Detection. Appl. Sci. 2021, 11, 8581. https://0-doi-org.brum.beds.ac.uk/10.3390/app11188581
AMA Style
Liu Y, Chen H, Wang J, Wang P, Zhang P. Confidence Learning for Semi-Supervised Acoustic Event Detection. Applied Sciences. 2021; 11(18):8581. https://0-doi-org.brum.beds.ac.uk/10.3390/app11188581
Chicago/Turabian StyleLiu, Yuzhuo, Hangting Chen, Jian Wang, Pei Wang, and Pengyuan Zhang. 2021. "Confidence Learning for Semi-Supervised Acoustic Event Detection" Applied Sciences 11, no. 18: 8581. https://0-doi-org.brum.beds.ac.uk/10.3390/app11188581
Note that from the first issue of 2016, this journal uses article numbers instead of page numbers. See further details here.