Article

Bearing Capacity and Failure Mode of a Light-Steel Tubular K-joint Connected by a Novel U-shape Connector

1
School of Civil Engineering and Architecture, Wuhan University of Technology, Wuhan 430070, China
2
Center of Science and Technology & Industrialization Development, Ministry of Housing and Urban-Rural Development, Beijing 100835, China
3
China Institute of Building Standard Design & Research, Beijing 100048, China
*
Author to whom correspondence should be addressed.
Submission received: 3 August 2021 / Revised: 10 September 2021 / Accepted: 13 September 2021 / Published: 15 September 2021
(This article belongs to the Topic Advances on Structural Engineering)

Abstract

:
This study aims to investigate the ultimate bearing capacity of a novel tubular K-joint used for light-steel structures consisting of thin-walled square hollow section members, a U-shape connector and self-drilling screws, and the effect of three patterns of stamping indentation fabricated on the U-shape connector on the ultimate bearing capacity of the proposed K-joint. Firstly, a total of 12 K-joint specimens were tested to failure under monotonic brace axial compressive loading. Secondly, failure mode and the ultimate bearing capacity of each specimen were investigated and analyzed. Finally, finite element analyses were carried out to study the effect of three key parameters, including chord axial stress ratio, half width-to-thickness ratio of the chord and brace-to-chord wall thickness ratio, on the ultimate bearing capacity of the proposed K-joints using the recommended U-shape connector. It was found that failure mode of the proposed K-joint is governed by both the deformation of the U-shape connector and the chord local plastification. Besides, the K-joint specimen using a U-shape connector with the strip stamping grooves in the horizontal direction generally has a higher bearing capacity and a much smaller connector deformation. Similar to the welded tubular joints, chord axial stresses may also significantly reduce the ultimate bearing capacity of the proposed K-joint.

1. Introduction

Tubular structure has been widely used in many buildings such as railway stations, stadiums, airports, bridges, jack-up offshore platforms, coal sheds and farm buildings due to its high bearing capacity and low weight [1]. Generally, a tubular structure is constructed by connecting different hollow section members. Therefore, connection between different hollow section members is crucial. The thickness of hollow section members used in heavy-load tubular structures is relatively thick, and thus, they are frequently welded together directly in reality. However, for light-steel tubular structures, thickness of the hollow section members is generally in between 0.6 and 2 mm, and thus, it is not preferred to use welding to connect them due to welding defects that frequently occur, such as welding penetration. Besides, welding is very time consuming and also requires high welding skill. Traditionally, screws, rivets and bolts are preferred to connect thin-walled steel sections used in light-steel structures [2,3,4,5,6,7] and the ultimate bearing capacity of the connection is one of the main concerns in engineering practice.
Many researchers have studied the bearing capacity, joint stiffness and failure mode of different connections of light-steel structures. For instance, Zaharia and Dubina [8] investigated the joint stiffness of bolted single-lap joints and cold-formed steel (CFS) trusses by conducting tests. They also proposed a theoretical model for predicting joint stiffness. Öztürk and Pul [9] carried out tests and numerical analyses on a full-scale apex connection of CFS frames. The apex connection was fabricated by connecting two CFS back-to-back double sigma rafter sections using a gusset apex plate and bolts. Similarly, Pouladi et al. [10] investigated the mechanical behavior of the eaves joint of CFS portal frames by carrying out finite element analyses (FEA). The eaves joint consisted of channel sections, screws and bolts. Far et al. [11] investigated the shear stiffness of thin-walled cold-formed storage rack frames by carrying out experiments and numerical analyses. Channel sections of storage rack frames were connected using bolts. Yan et al. [4] carried out a comparative study on the mechanical behavior and construction characteristics of 96 CFS lap shear tests, including four types of connection using the self-piercing rivet, clinching, self-drilling screw and blind rivet, respectively. Song et al. [12] investigated the flexural behavior of CFS trusses assembled by using self-piercing rivets. Song et al. [13] also carried out experimental tests to investigate the structural behavior of CFS truss composite floors in which the truss is assembled using self-piercing rivets. Similarly, Wang et al. [14] carried out cyclic loading tests on CFS truss composite floors. The steel truss consisted of C-shaped steel sections connected by self-drilling screws. Roy et al. [15] carried out tests and FEA to investigate the effect of deployment patterns of self-drilling screws on the bearing capacity of high-strength CFS joints. Fahmy et al. [16] investigated the bearing capacity of five CFS connections assembled using two types of gusset plates and self-tapping screws. Mathieson et al. [17] conducted static and cyclic loading tests to investigate the failure mechanism and structural behavior of 26 CFS trusses. The CFS truss specimens were assembled by connecting C-shaped steel sections using a novel developed Howick rivet connector (HRC). Dizdar et al. [18] experimentally investigated the strength and stiffness of floor trusses consisting of CFS lipped channels. Phan et al. [19] investigated the bimoment effects on the load transfer in CFS bolted moment connections. The lipped channel chord and braces of the CFS trusses were connected using bolts. Zagόrowska et al. [20] conducted static loading tests on five CFS joints with positive eccentricity. The chord of the five CFS joints was hat section and was connected with the C-shaped braces using bolts. Gan et al. [21] carried out tests and numerical analyses to investigate the effect of apex plate length and thickness on the CFS roof trusses. The apex plate and the C-shaped sections were connected using bolts. Güldür et al. [22] carried out experimental and numerical analyses on seven CFS floor trusses to investigate bearing capacity and structural behavior.
This study aims to propose and study a new joint for connecting thin-walled (thickness 0.6–2 mm) square hollow section (SHS) members to form a light-steel warren truss. Figure 1 illustrates the proposed joint in which two braces are connected to the chord using a patented U-shape connector and self-drilling screws. The U-shape connector is fabricated by stamping thin-walled hot galvanizing steel sheet. Screw holes are fabricated in the steel sheet before stamping it. The proposed joint has several superior advantages. Firstly, it is very easy to deliver all steel members to the construction site and assemble them together to form a warren truss using the proposed joint. No in-site welding work is required so that welding flaws can be avoided, and a high construction speed can be achieved. In addition, the pre-drilled screw holes of the U-shape connector can prevent sliding of the screw during screw drilling and expedite assembling speed; secondly, impairment to the SHS members is small as no cutting slot is required; finally, the U-shape connector can accommodate the flexibility of the brace diagonal angle from 30° to 90° and at least three self-drilling screws are guaranteed at each connecting surface of the brace. When designing a truss using the U-shape connector, pinned connection is assumed at the joint. After the axial forces of the braces are determined, the number of self-drilling screws can be calculated using the assumption that the screw swarm is under shear and takes all the force transferred from the brace. As the proposed joint has never been studied, it is necessary to investigate its bearing capacity and failure mode before it is used in reality.

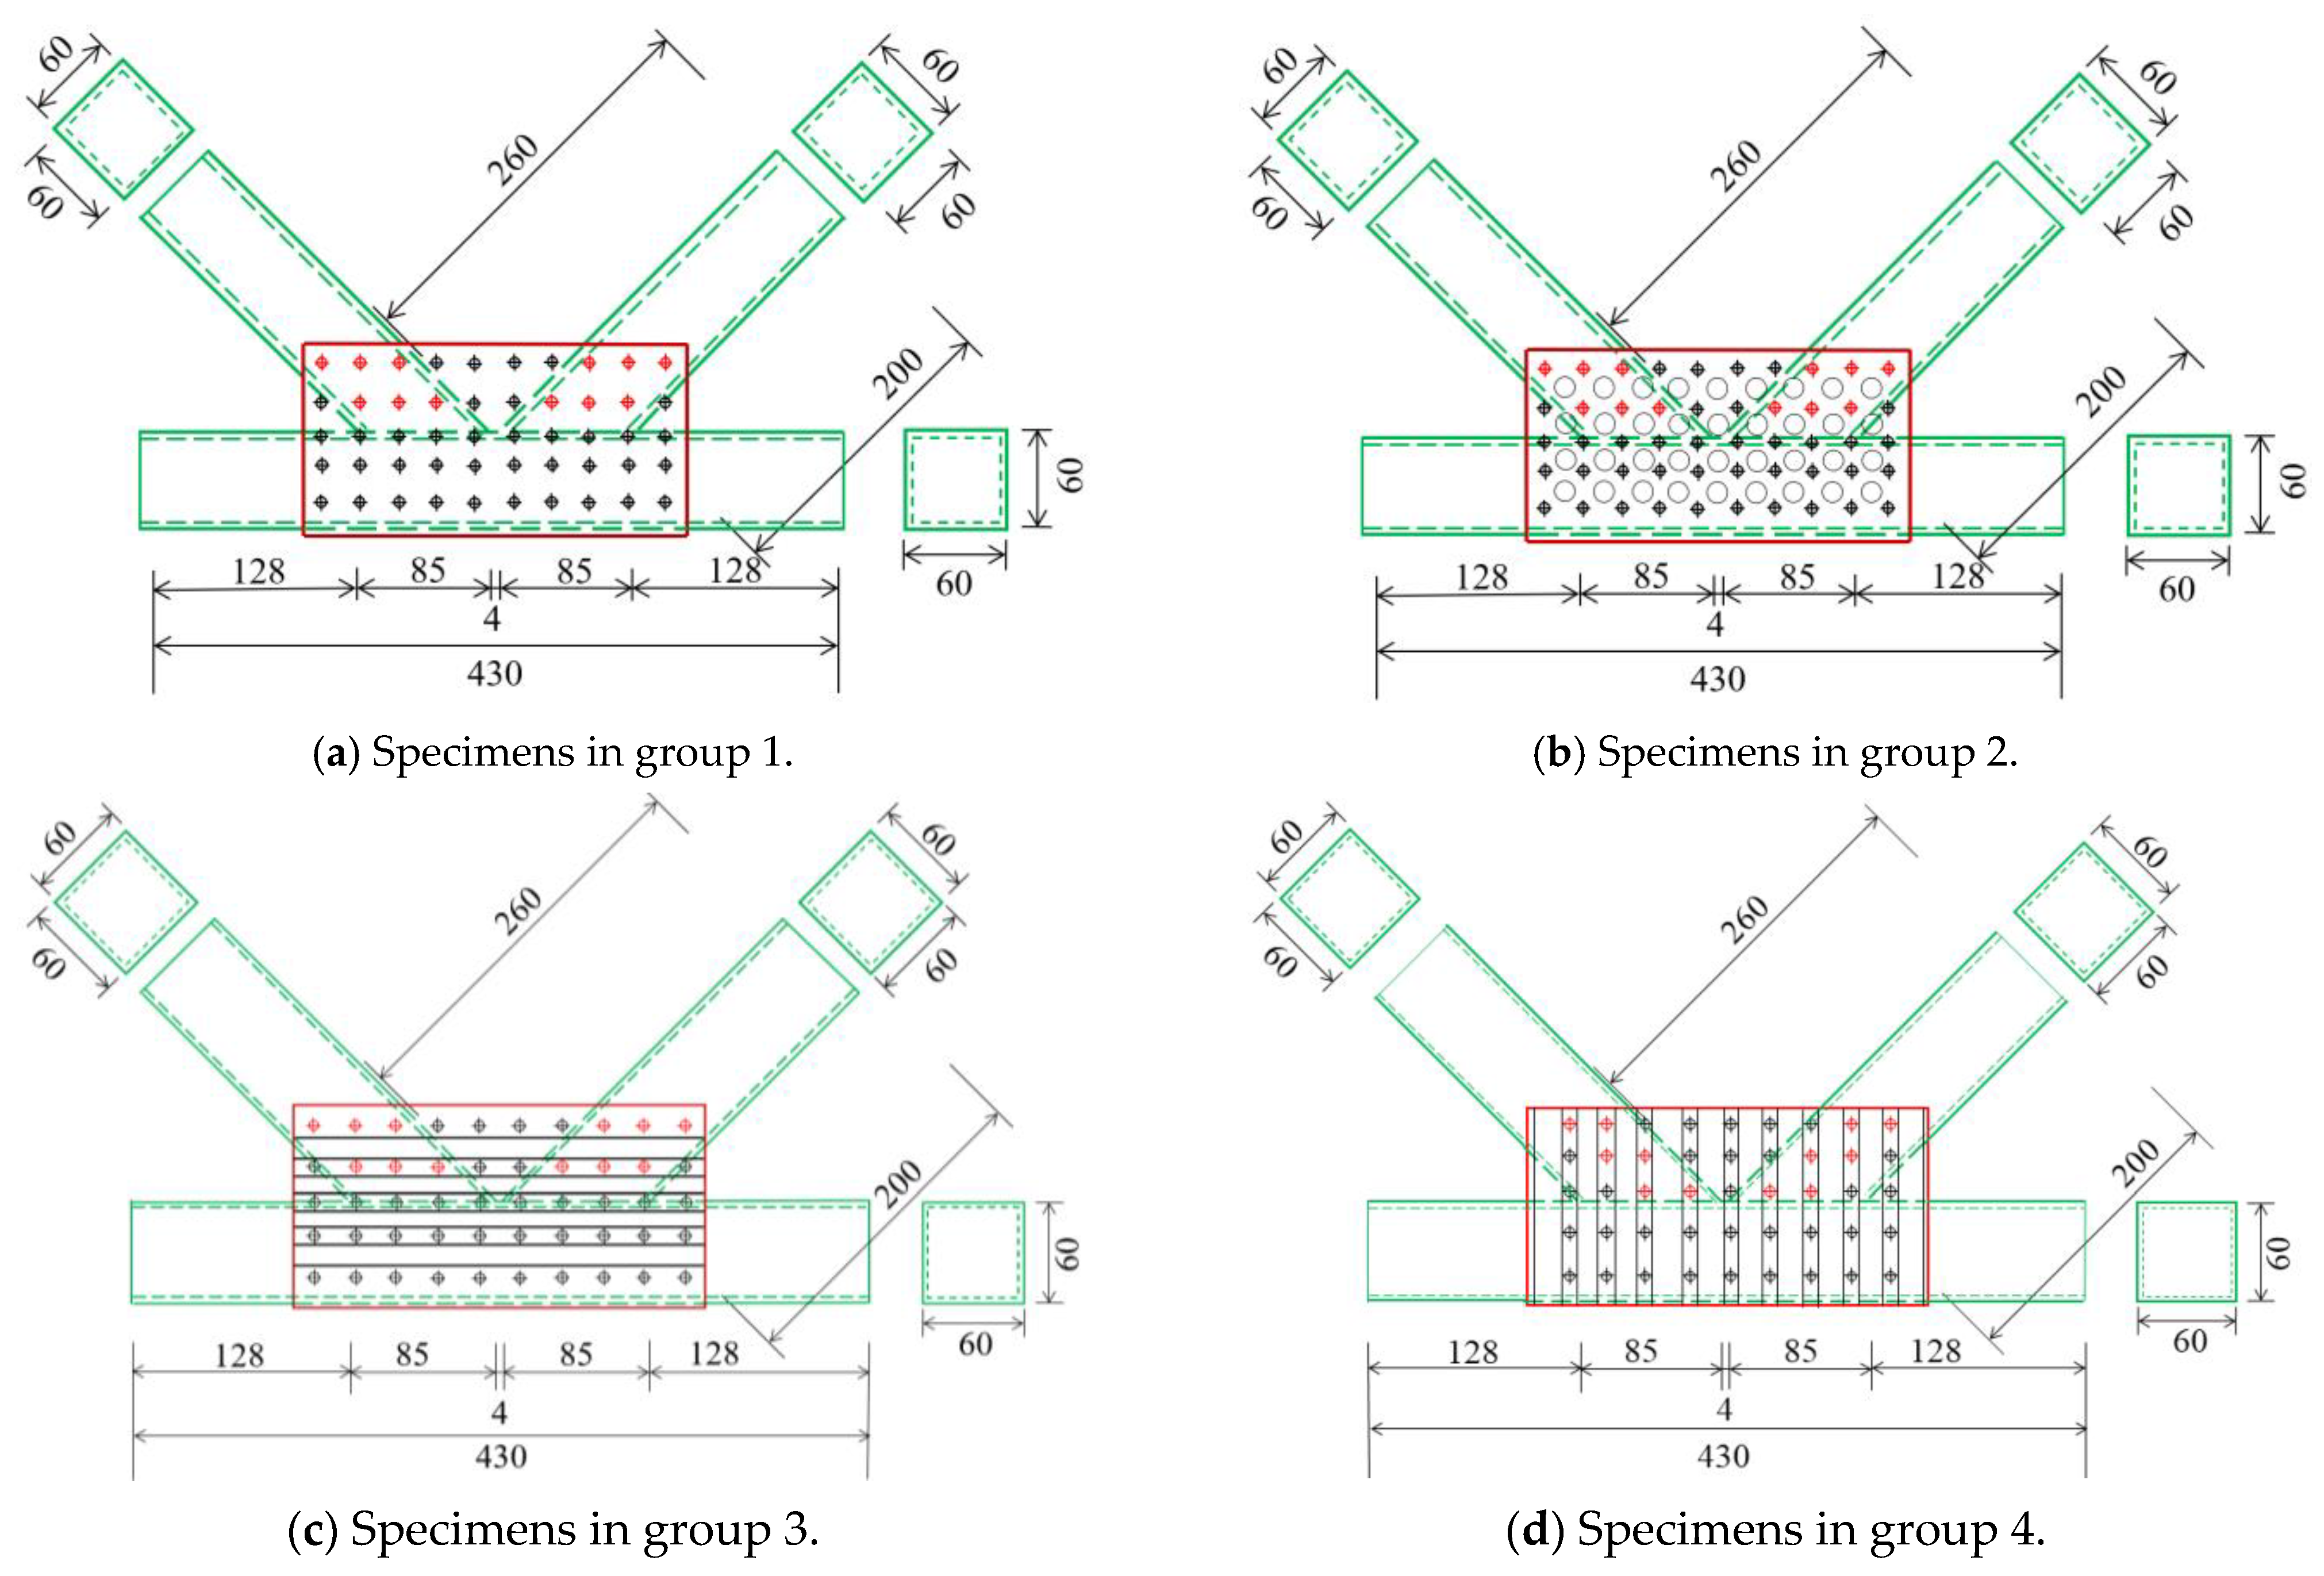
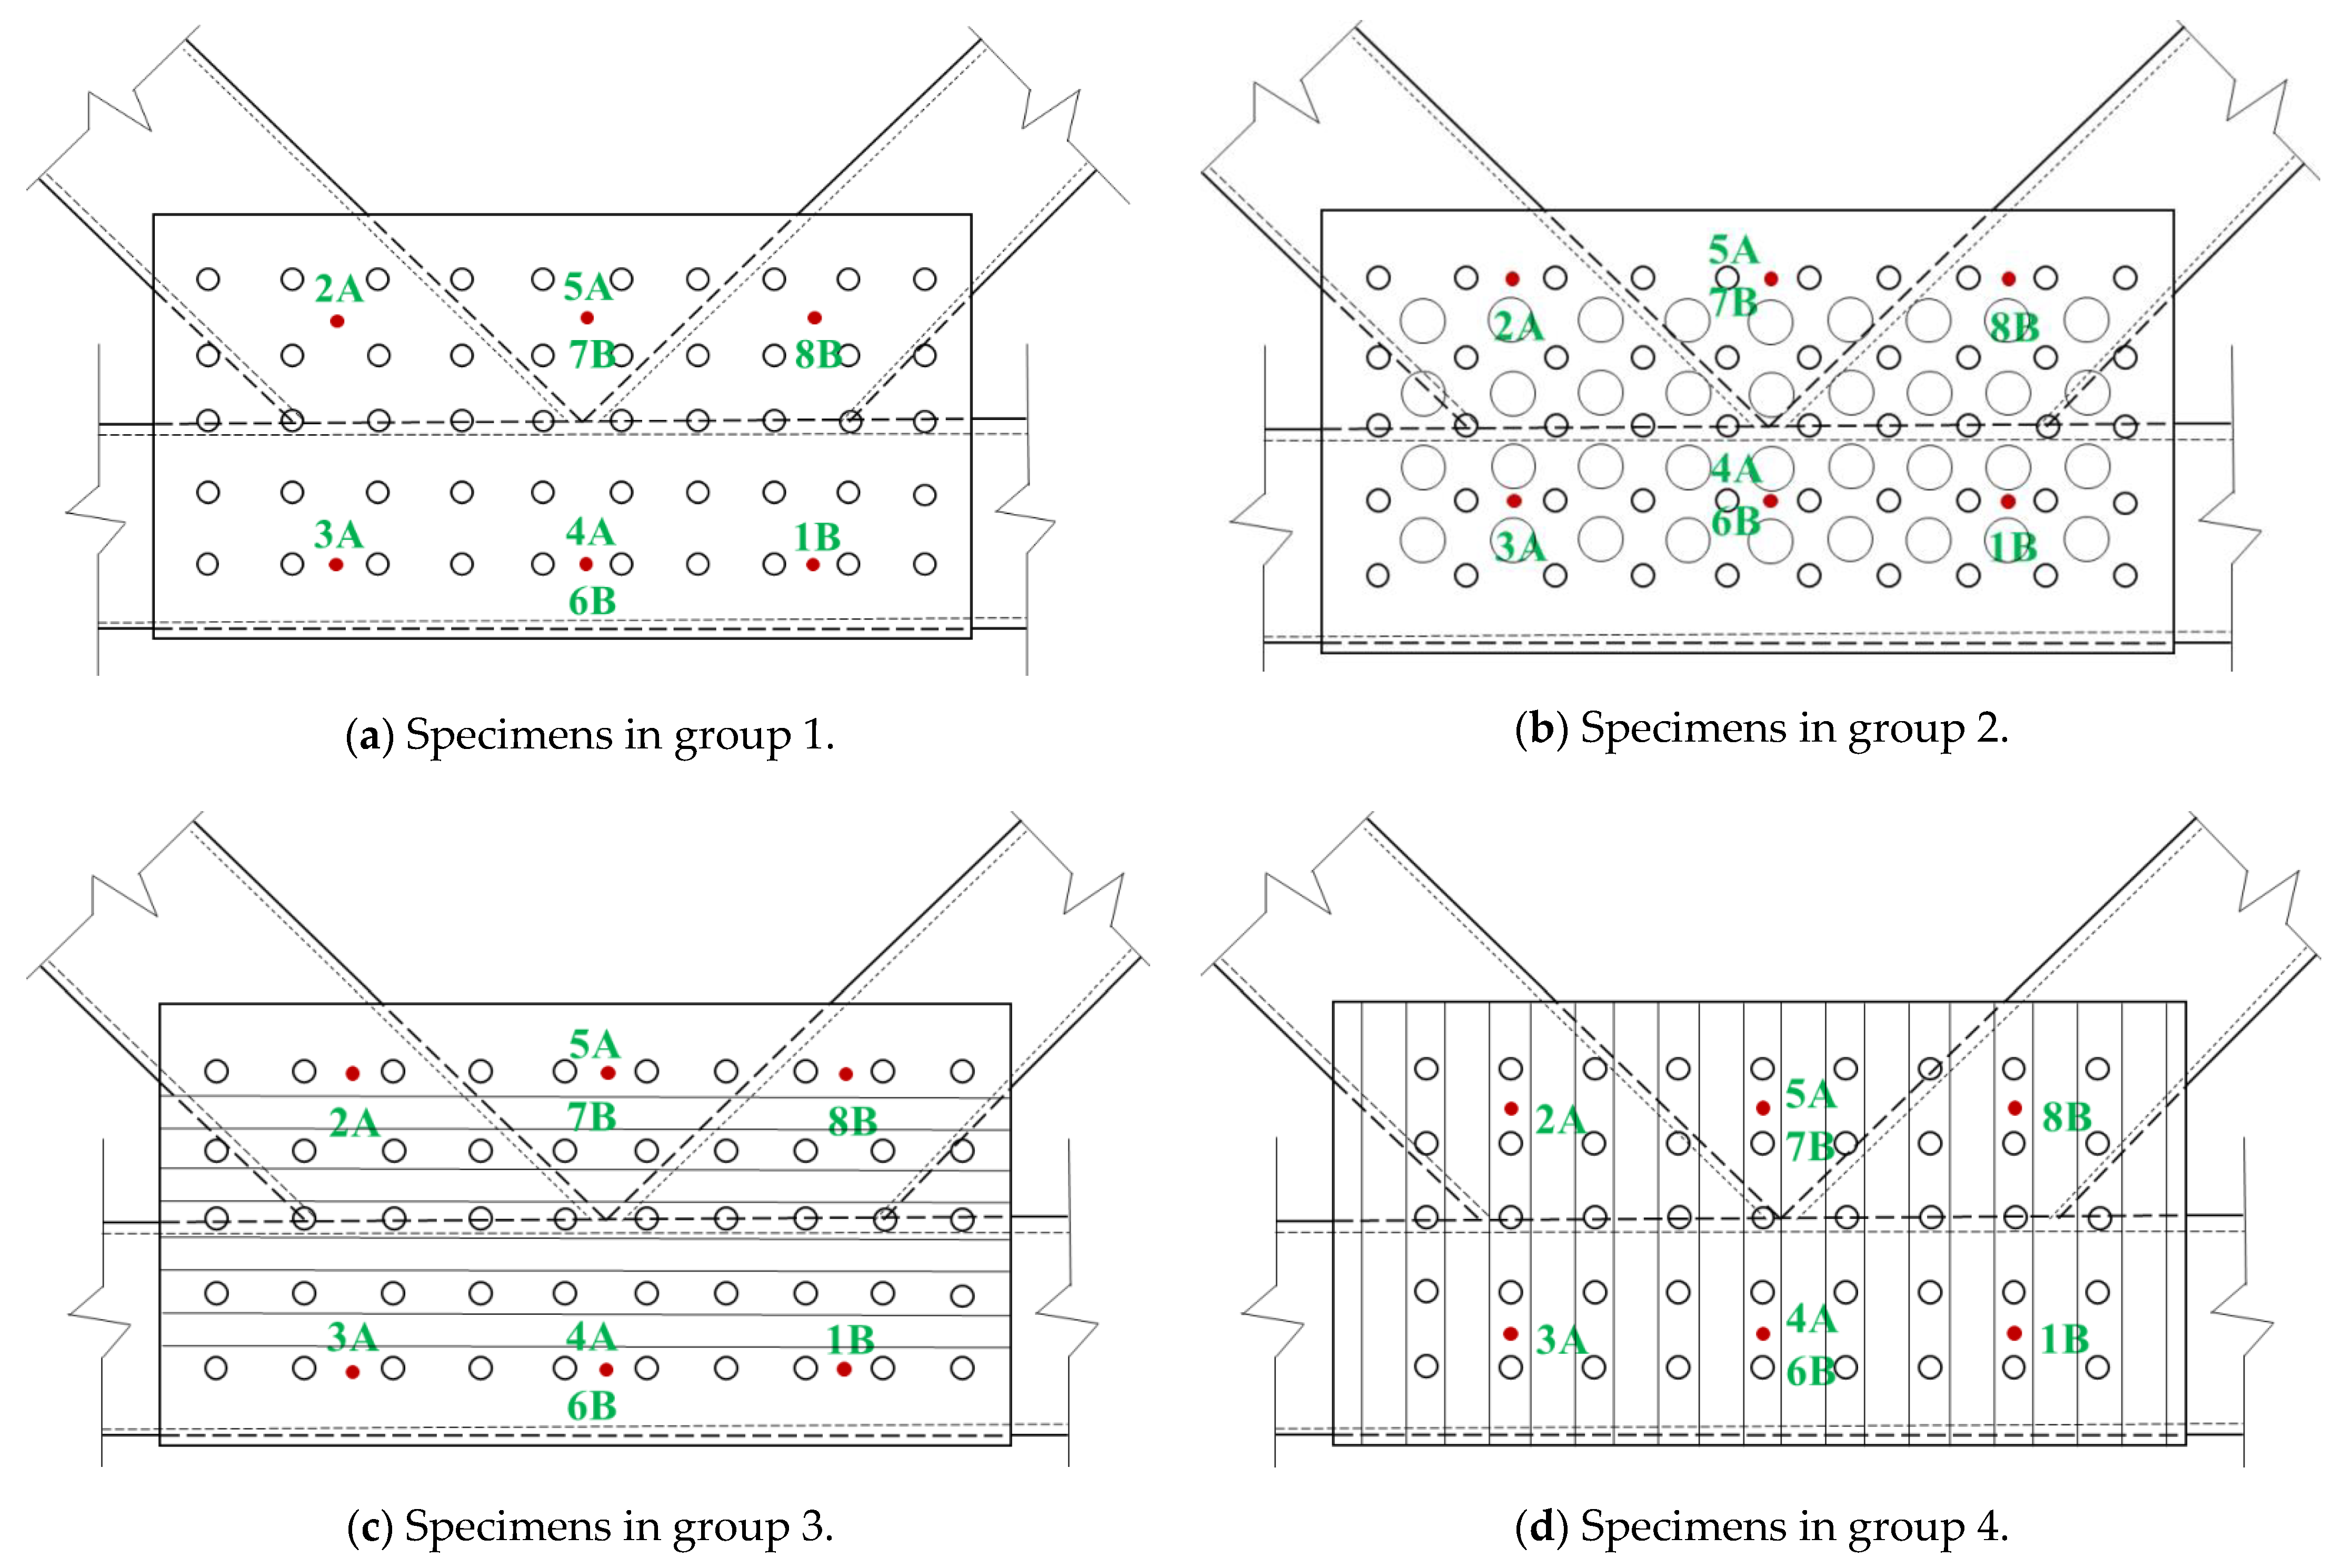
2. Specimen Fabrication

2.1. U-shape Connectors and K-joint Specimens

Four types of U-shape connectors have been used for 12 K-joint specimens tested in this study, and they are named UPL, UPU, ULW and UTW, respectively. The U-shape connector named UPL is without stamping indentation while the other three have different patterns of stamping indentation as shown in Figure 2. For U-shape connector UPU, stamping pits are fabricated; for U-shape connectors ULW and UTW, strip stamping grooves are fabricated in the vertical and horizontal direction, respectively. By making a comparison among the testing results of specimens using different U-shape connectors, the most efficient one can be found. Figure 3 provides the geometries of four types of U-shape connectors and values of the parameters are summarized in Table 1.
A total of 12 K-joint specimens were fabricated and divided into four groups according to the types of U-shape connector. Figure 4a,d show the geometries of four typical K-joint specimens. Six self-drilling screws at each connecting surface of the brace are installed and highlighted in red in Figure 4a,d. Nominal thickness of all SHS members is 1.5 mm and diagonal angle of all braces is 45°.
When assembling a K-joint specimen, firstly the U-shape connector is placed in the right position of the chord, and then it is connected to the chord using self-drilling screws as shown in Figure 5. Subsequently, the two braces are inserted into the U-shape connector and connected together using self-drilling screws. Six self-drilling screws are used for each K-joint specimen in this study. Figure 6 shows a completed K-joint specimen after self-drilling screws are installed.

2.2. Material Properties of Steel

A total of 12 coupon test specimens have been fabricated and tested to failure. Figure 7 shows the dimensions of the coupon test specimens and Figure 8 shows the corresponding testing machine. Axial tensile loading is applied to each coupon specimen at a speed of 10 N/s. Material properties including elastic modulus, yield stress, ultimate stress and elongation rate of the 12 coupon test specimens are summarized in Table 2. Names of specimens with ‘UP’ and ‘XF’ refer to the U-shape connectors and the SHS members, respectively.

3. Testing Rig, Loading Scheme and Displacement Transducer Deployment

3.1. Testing Rig and Loading Scheme

Figure 9 shows the testing rig of the K-joint specimen. Two ends of the specimen are bolted to two tubes fixed to the resisting frame. Two jacks attached to the resisting frame are connected to the two braces. The same axial compressive force is applied to two braces by using the manual oil pump shown in Figure 10. Force loading is applied to each specimen with an interval of 4 kN before 50% of the design value (about 40 kN) is reached. Subsequently, loading interval is changed to 2 kN till the end of the testing.

3.2. Displacement Transducer Deployment

A trial FEA shows that failure mode of the K-joint is severe deformation of the U-shape connector and chord local plastification. Therefore, eight displacement transducers (red points) were installed on each U-shape connector as shown in Figure 11. The displacement transducers were located either in the center of four screw holes or in the middle of two screw holes. Alphabet ‘A’ and ‘B’ indicate two opposite surfaces of the U-shape connector.

4. Experimental Results
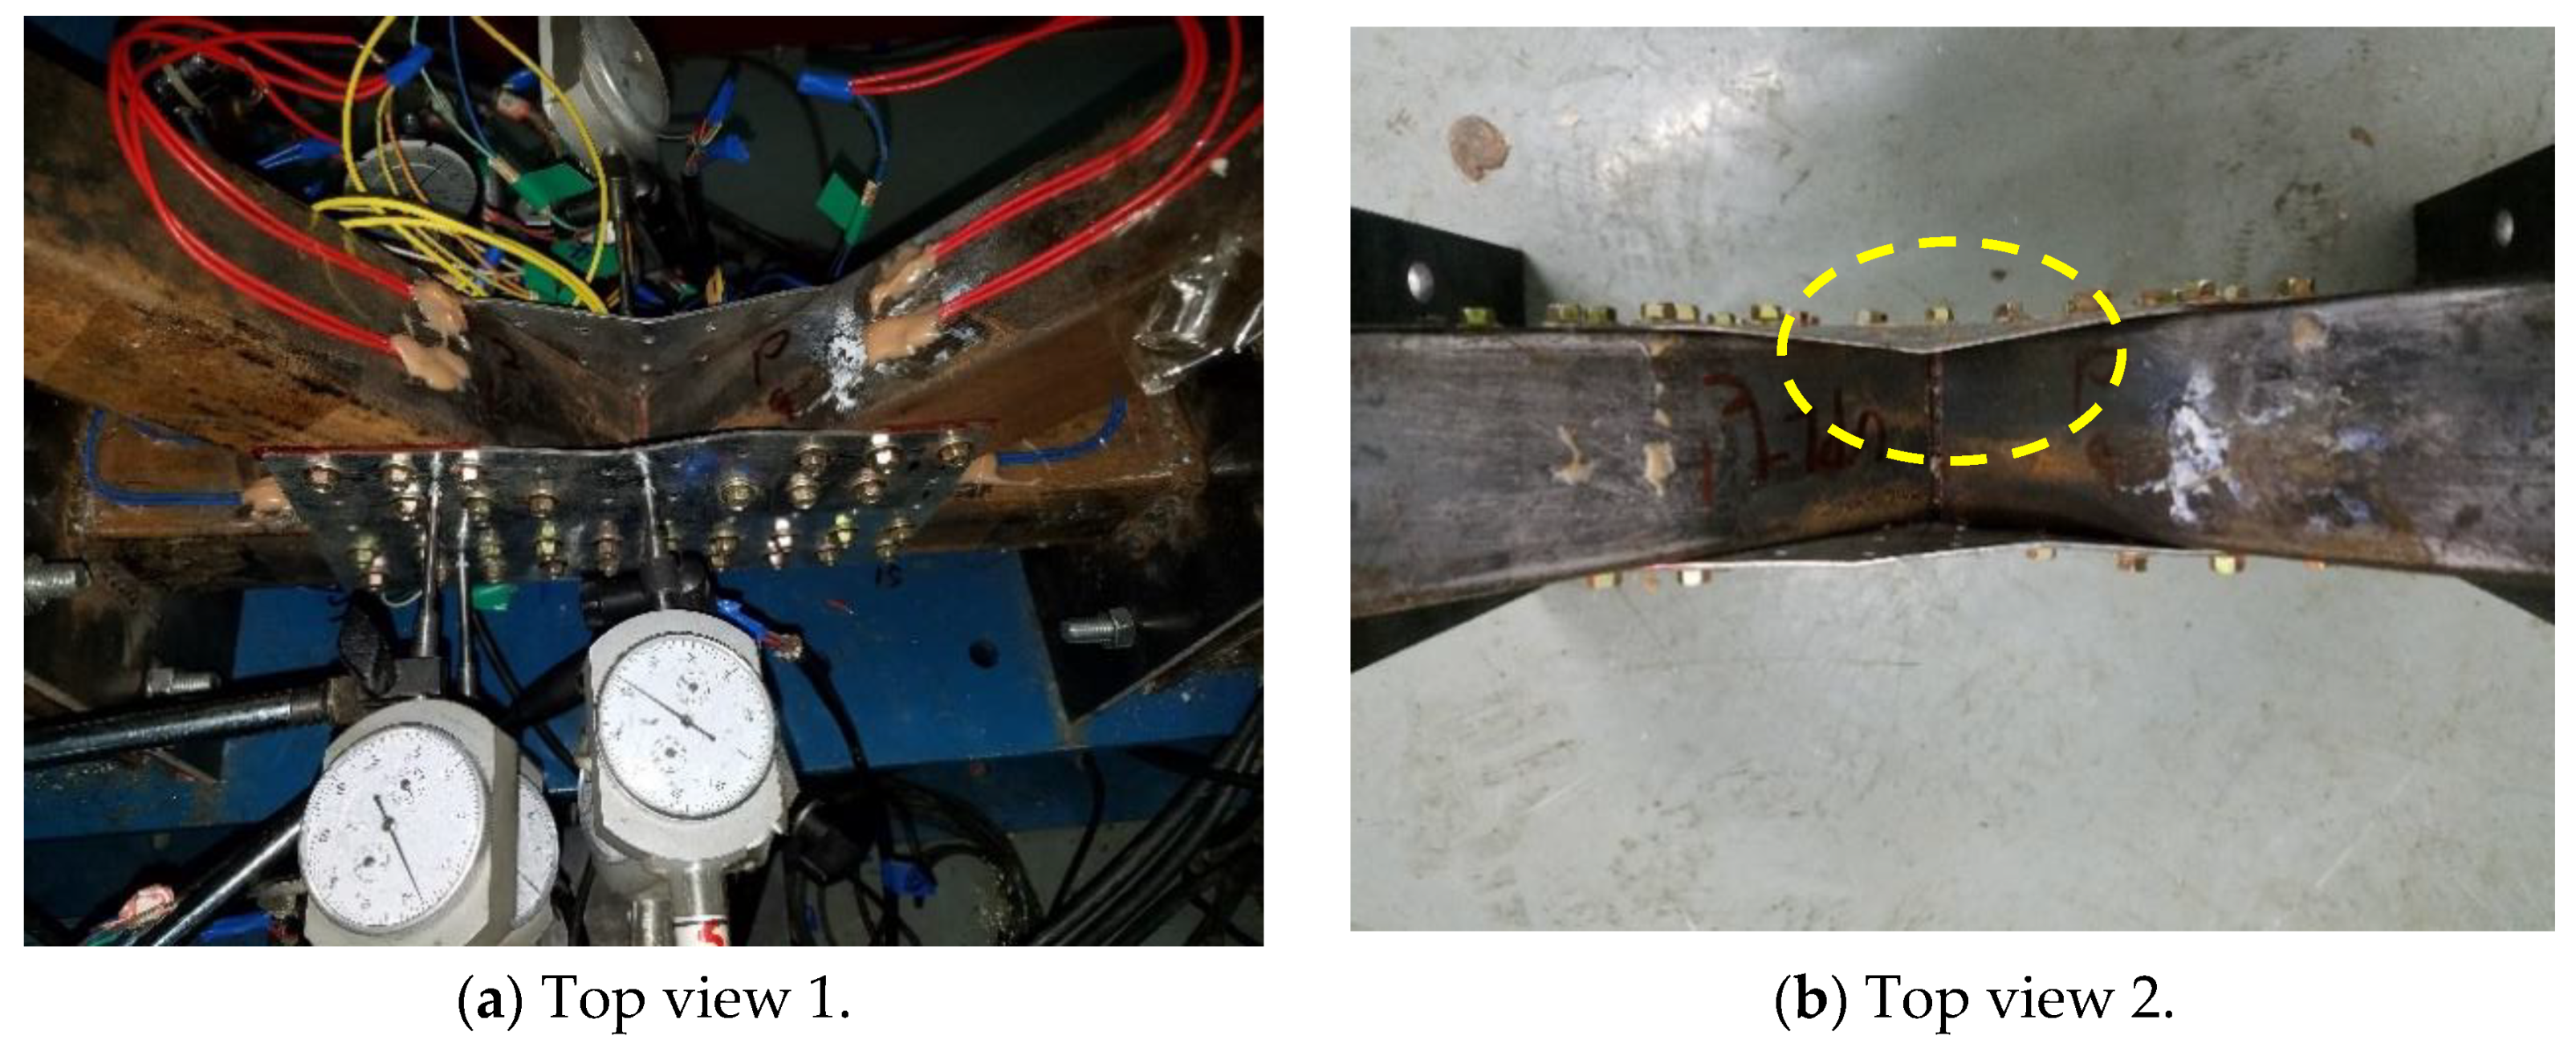
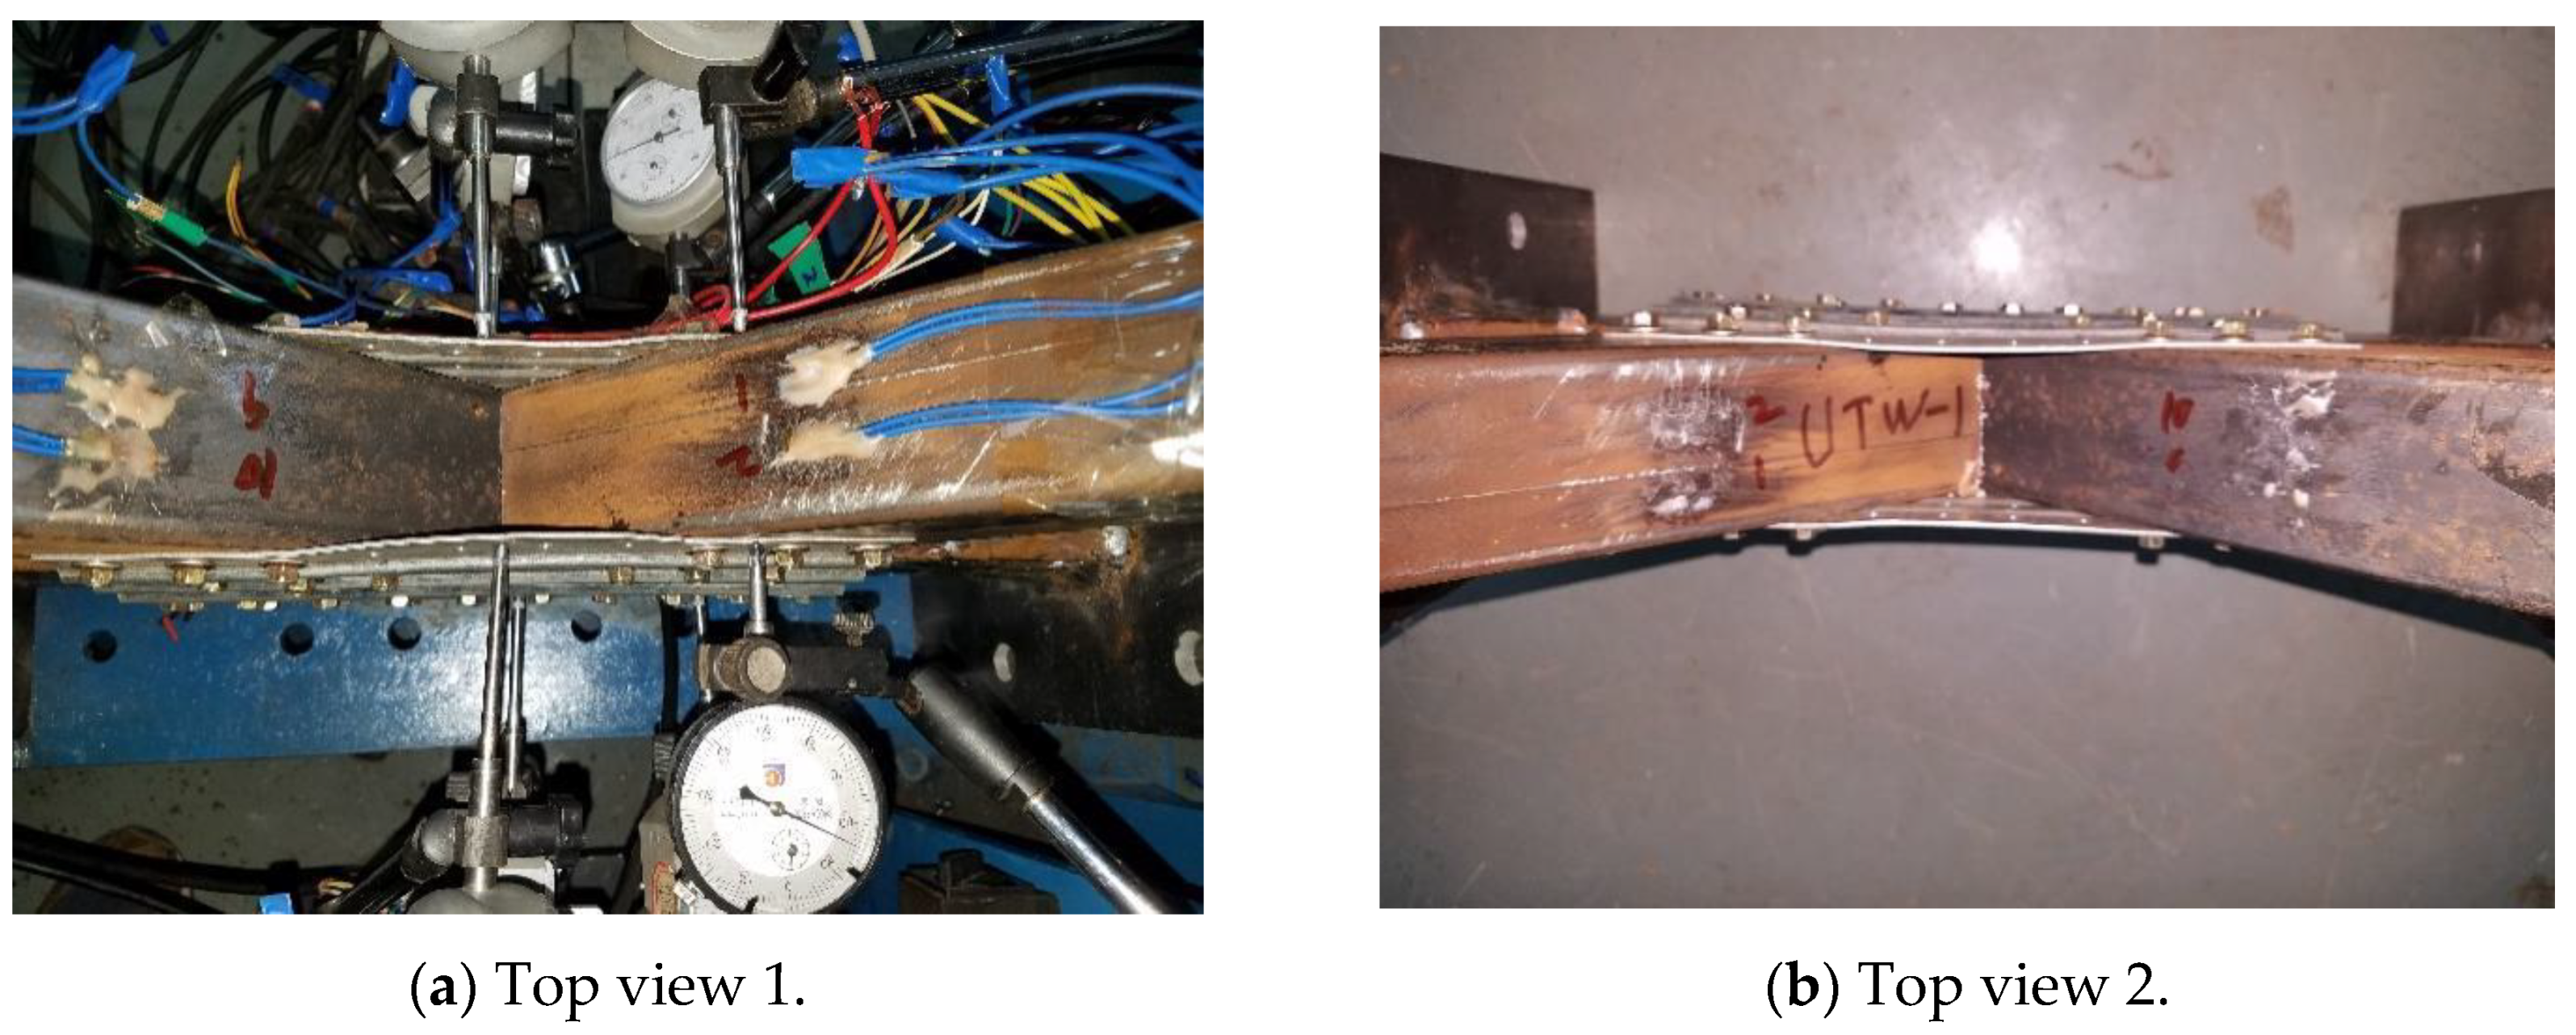
4.1. Failure Mode

Failure mode of three K-joint specimens in each group is almost the same. Therefore, failure mode of one specimen in each group is analyzed herein. Figure 12a–c show the deformation of specimen UPL-1. The U-shape connector is severely deformed. However, no separation between the U-shape connector and the SHS members is observed. Besides, all the screws are sound. The maximum deformed region of the U-shape connector is circled in Figure 12b. In addition, chord local plastification is observed as shown in Figure 12c.
Figure 13a–c show the deformation of specimen UPU-1. The U-shape connector is also severely deformed. Moreover, no separation between the U-shape connector and the SHS members is observed, and all the screws are sound. The maximum deformed region of the U-shape connector is circled in Figure 13b. Moreover, chord local plastification is observed as shown in Figure 13c.
Figure 14a–c show the deformation of specimen ULW-1. Large deformation is also observed on the U-shape connector. Moreover, no separation between the U-shape connector and the SHS members is observed, and all the screws are sound. The maximum deformed region of the U-shape connector is circled in Figure 14b. Moreover, chord local plastification is observed as shown in Figure 14c.
Figure 15a–c show the deformation of specimen UTW-1. Deformation of the U-shape connector is not very obvious and no separation between the U-shape connector and the SHS members is observed; besides, all the screws are sound. Moreover, chord local plastification is observed at the joint region as shown in Figure 15c. Different from all the specimens in the other three groups, chord local plastification also occurs at the region circled in red in Figure 15c due to the combination action of shear and bending at the chord end.
In summary, for all the 12 specimens tested, large deformation of the U-shape connector is observed. Besides, chord local plastification occurs at the region where the braces contact the chord. Therefore, it can be concluded that joint failure is governed by both the deformation of the U-shape connector and the chord local plastification. In addition, no separation between the U-shape connector and the SHS members is observed, and no damage is found for all the screws. Different from all the specimens in group 1–3, chord local plastification also occurs at the region near to the chord end due to the combination action of shear and bending for specimens in group 4.

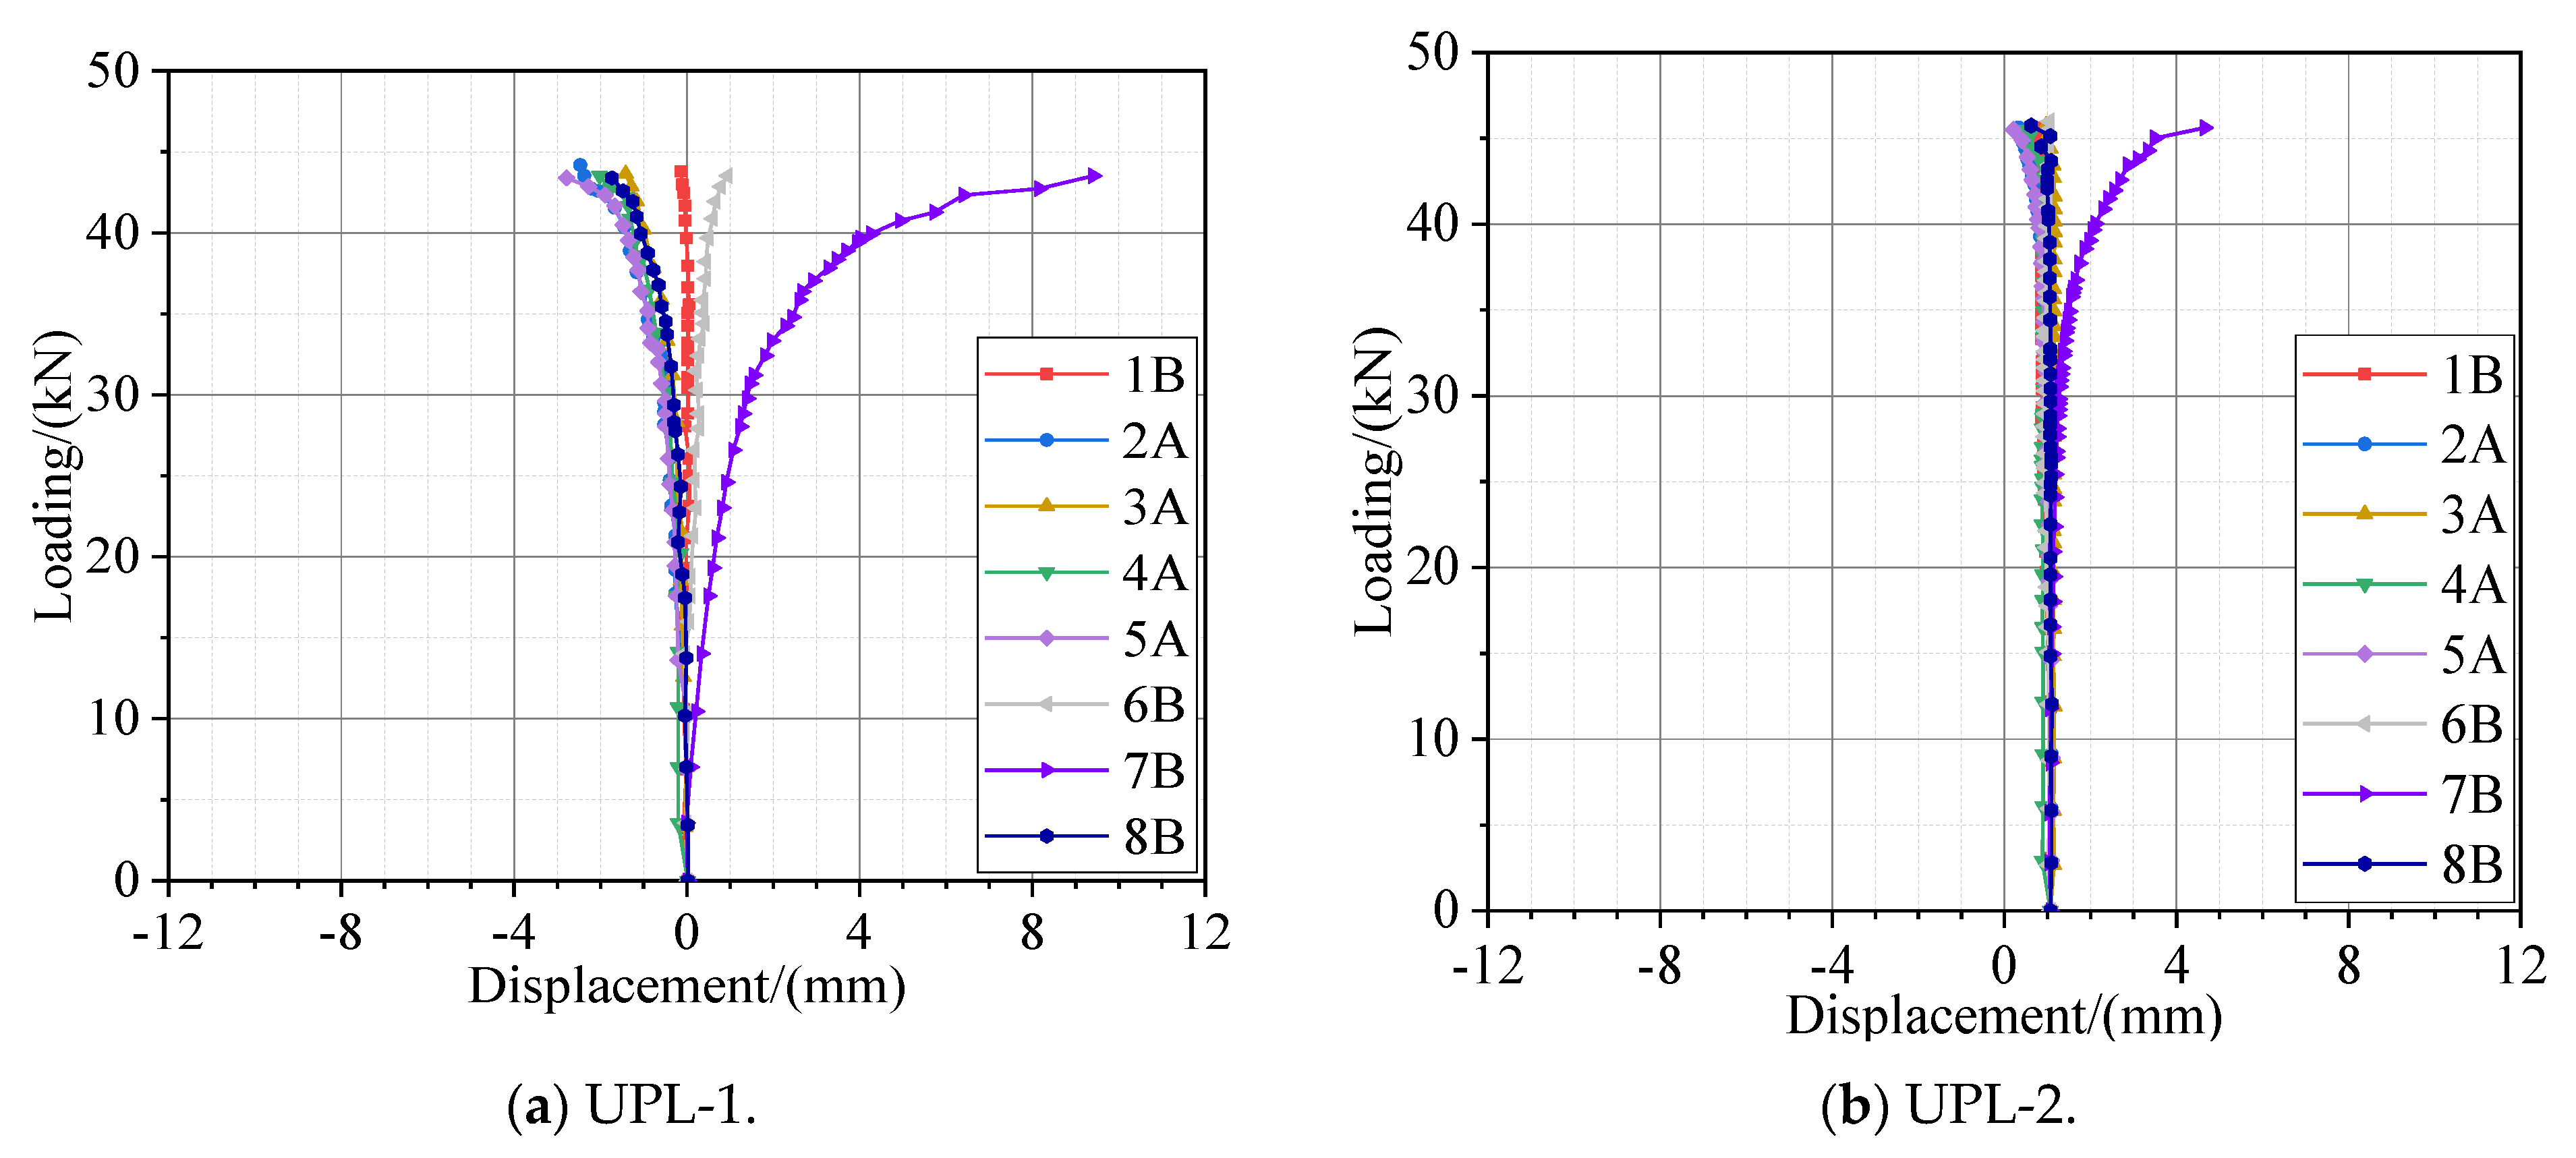
4.2. Loading-Displacement Curves

Loading-displacement curves of specimens in group 1 are shown in Figure 16a–c. Displacement in this study refers to the out-of-plane displacement of the U-shape connector. For the three specimens, the maximum displacement is from displacement transducer ‘7B’ (refer to Figure 11) and is in between 4.7 and 9.5 mm. Peak load of all loading-displacement curves is close.
Loading-displacement curves of specimens in group 2 are shown in Figure 17a–c. For specimen UPU-1, the maximum displacement is from displacement transducer ‘5A’, while for specimens UPU-2 and UPU-3, the maximum displacement is also from displacement transducer ‘7B’ (refer to Figure 11). The maximum displacement of three specimens is in between 3.8 and 11.2 mm.
Loading-displacement curves of specimens in group 3 are shown in Figure 18a–c. For the three specimens, the maximum displacement is also from displacement transducer ‘7B’ (refer to Figure 11) and is in between 5.6 and 9.5 mm.
Loading-displacement curves of specimens in group 4 are shown in Figure 19a–c. It can be seen that the maximum displacement is not at a fixed position. For the three specimens in group 4, out-of-plane displacement of the connector is much smaller compared to that in other specimens and is less than 3 mm.
Overall, the ultimate bearing capacities of the 12 K-joint specimens are close, within the range of 37.1–45.6 kN. It appears that the stamping indentation slightly affects the ultimate bearing capacity of the proposed K-joint. However, strip stamping grooves in the horizontal directions can significantly reduce the deformation of the U-shape connector.

4.3. Ultimate Bearing Capacity

The ultimate bearing capacity of each specimen is taken as the peak load of the corresponding loading-displacement curves shown in Section 4.2. The ultimate bearing capacity of three specimens in each group is not identical. This may be due to the fact that the thickness and strength of all the U-shape connectors are not exactly the same. Overall, the ultimate strength of three specimens in each group is close. The ultimate bearing capacities of the 12 K-joint specimens are summarized in Table 3.
By making a comparison among the average of the ultimate bearing capacity of three specimens in each group, it can be concluded that the pattern of stamping indentation has a negligible effect (it causes a maximum 16.9% difference between specimen UTW-2 and UPL-3) on the ultimate bearing capacity of the K-joint. Comparing three specimens in group 1, specimens using the UTW connector have a higher average ultimate bearing capacity and other specimens using the ULW and UPU connectors have a lower average ultimate bearing capacity. This implies that the stamping indentation patterns used in the ULW and UPU connectors may have a negative effect on the ultimate bearing capacity of the proposed K-joint. In reality, the UTW connector is preferred for the proposed K-joint.

5. Finite Element Analyses of Specimens Using UTW Connector

In this section, finite element (FE) parametric study is carried out on the K-joint using the UTW connector as it has the highest ultimate bearing capacity and minimum connector deformation. The effect of three key parameters, including chord stress ratio n, half width-to-thickness ratio of the chord γ and brace-to-chord wall thickness ratio τ1, on the ultimate bearing capacity of the targeted K-joint is investigated.

5.1. FE Modelling

The FE model is created in ABAQUS software. Solid element C3D8R is used for the FE model. All the self-drilling screws are not modelled because they are sound in the test and tie the U-shape connector and the SHS members tightly during the whole testing. In order to model the interaction between the U-shape connector and the SHS members caused by the screws, a ring-shaped surface shown in Figure 20 is created on both the U-shape connector and the SHS members at the screw region. The two red surfaces are tied together in the FE modelling whereas hard contact with normal and tangential behavior is defined at other physical contact areas (blue surfaces in Figure 20) of the U-shape connector and SHS members. Because a surface cannot be defined as contact and tie interactions simultaneously in ABAQUS software, it has to create an untreated region (green surfaces in Figure 20) between the tied and contacted regions. Untreated surfaces in Figure 20 mean no contact or tie is defined between the two of them. Figure 21 shows a completed mesh model of a K-joint using the UTW connector and mesh density is increased for the connector.
Boundary conditions of the FE models are shown in Figure 22a,b. As shown in Figure 22a, for the FE models used for investigating the effect of chord stress ratio n, one end of the chord is fixed, and the other end is constrained only in X- and Y-directions so that axial force can be applied in Z-direction. For the free end of two braces, only axial displacement is allowed. For other FE models, two ends of the chord are fixed (no axial force applied to the chord), and also only axial displacement is allowed for the free end of two braces as shown in Figure 22b. A general static analysis has been run for each FE model in this study. For the brace axial loading, it is applied using the ‘Risk’ method in ABAQUS software.

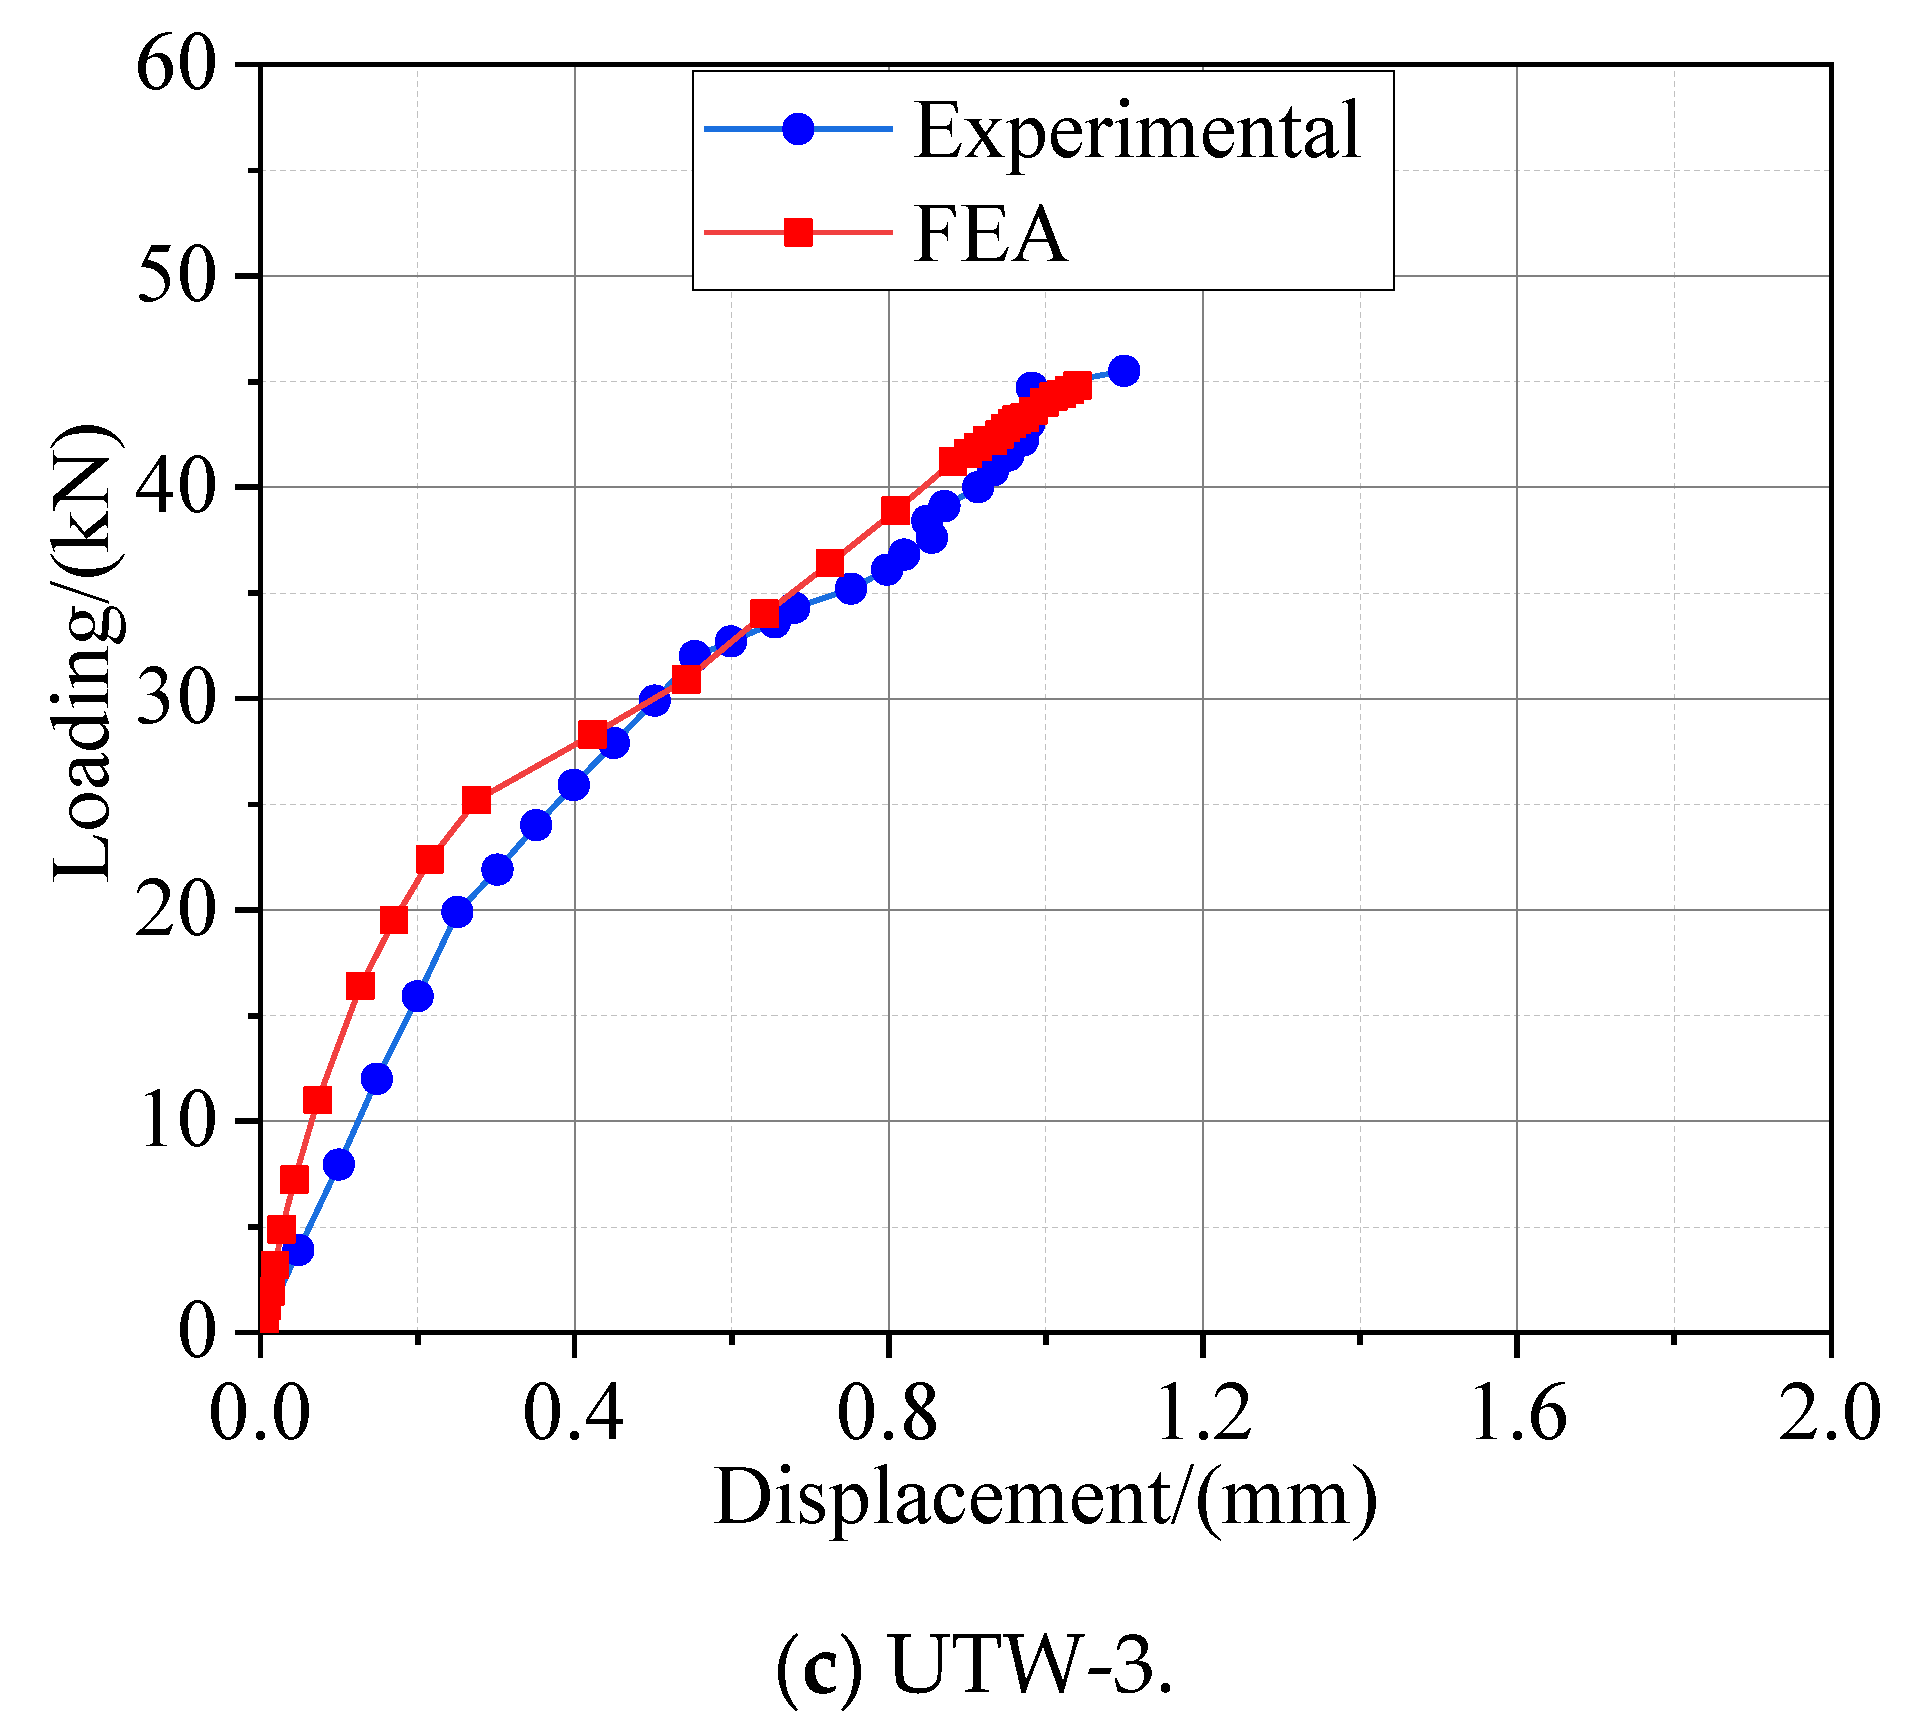
5.2. Validation of FE Modelling

Figure 23a–c show the comparison of loading-displacement curves of three specimens including UTW-1, UTW-2 and UTW-3. Displacement for the experimental curve in this section refers to the value obtained from the displacement transducer ‘7B’ (refer to Figure 11). It can be seen that accuracy of the FE modelling in this study is acceptable.
Figure 24a,b show the deformation of the U-shape connector and the displacement contour of the chord of the FE model UTW-1, respectively. It can be seen that deformation of the U-shape connector is small, similar to the observation in the test (Figure 15a,b). For the chord in the FEA, large local displacement (circled in black) can be observed at the region where the brace is connected to the chord. It is also the same as the observation in the test (Figure 15c).

5.3. Parametric Study

A total of 27 K-joint models using the UTW connector have been investigated. Dimensionless parameters of each model and the corresponding ultimate bearing capacity are summarized in Table 4. The ultimate bearing capacity values in Table 4 are defined as the peak value of the loading-displacement curves obtained from FEA.
Chord axial stresses, including the compression and the tension, have a significant effect on the ultimate bearing capacity of welded tubular joints [1,23,24]. Therefore, it is also necessary to investigate the effect of chord axial stresses on the proposed K-joint. Parameter n is defined as the ratio of the applied chord axial stress to the chord yield stress. Negative and positive values of n mean that the chord is under axial compression and tension, respectively. Figure 25 shows the effect of n on the ultimate bearing capacity of the proposed K-joints. It can be seen that the ultimate bearing capacity of the K-joint generally decreases as the chord axial tension stress increases from 0 to 0.6n. For the FE models with γ is 15 and 20 under chord axial compression, the ultimate bearing capacity firstly decreases and then increases a little. For the FE models with γ is 30, the ultimate bearing capacity decreases as chord axial tension stress increases.
Figure 26 shows the effect of half width-to-thickness ratio of the chord γ on the ultimate bearing capacity of the K-joint investigated. It can be seen that the ultimate bearing capacity of the K-joint decreases as γ increases, the same as the welded tubular joints [1].
Figure 27 shows the effect of brace-to-chord wall thickness ratio τ1 on the ultimate bearing capacity of the K-joint investigated. It can be seen that the ultimate bearing capacity of the K-joint increases as τ1 increases; in other words, increasing the brace thickness can enhance the ultimate bearing capacity of the K-joint when the chord section is fixed.

6. Conclusions

This study aims to investigate the ultimate bearing capacity of a novel K-joint consisting of thin-walled SHS members, a U-shape connector and self-drilling screws, and the effect of three patterns of stamping indentation fabricated on the U-shape connector on the ultimate bearing capacity of the proposed K-joint. A total of 12 specimens were tested to failure under monotonic brace axial compressive loading. Failure mode and the ultimate bearing capacity of each specimen have been analyzed. Finally, finite element analyses were carried out to study the effect of three key parameters, including chord stress ratio, chord radius-to-thickness ratio and brace-to-chord thickness ratio, on the ultimate bearing capacity of proposed K-joints using the UTW connector. Based on the testing and FE results in the present study, the conclusion below may be drawn:
(1)
Through investigating all K-joint specimens, it can be concluded that joint failure is governed by both the deformation of the U-shape connector and the chord local plastification. Besides, the U-shape connector and the wall of SHS members keep in contact tightly during the testing for all the specimens, and all the screws are sound.
(2)
Some patterns of stamping indentation fabricated on the U-shape connector may bring an unfavorable effect to the ultimate bearing capacity of the proposed K-joint, such as the stamping pits (UPU connector). For all the specimens investigated, those with the UTW connector, i.e., connectors with strip stamping grooves in the horizontal direction, generally have a higher ultimate bearing capacity and a much smaller connector deformation.
(3)
Similar to the welded SHS joints, chord axial stresses, including the compression and the tension, can significantly reduce the ultimate bearing capacity of the proposed K-joint using the UTW connector. Moreover, a larger half width-to-thickness ratio of the chord γ will result in a smaller ultimate bearing capacity of the proposed K-joint using the UTW connector.
(4)
The ultimate bearing capacity of the K-joint using the UTW connector increases with the brace-to-chord wall thickness ratio τ1 when the chord section is fixed.

Author Contributions

Conceptualization, X.W.; software, X.Y.; investigation, H.Z.; writing—original draft preparation, T.L.; writing—review and editing, X.W.; supervision, Y.Y.; project administration, Y.L. and X.G.; All authors have read and agreed to the published version of the manuscript.

Funding

This study was funded by the National Key Research and Development Program of China (2017YFC0703702) and Major Technical Innovation Projects of Hubei Province (2018ACA131).

Institutional Review Board Statement

Not applicable.

Informed Consent Statement

Not applicable.

Data Availability Statement

The data used to support the findings of this study are available from the corresponding author upon request.

Acknowledgments

The authors express their great gratitude towards the Structural Test Center of Wuhan University of Technology. The authors also appreciate all assistance from the master students in the research team during the testing and simulation processes.

Conflicts of Interest

The authors declare that they have no conflict of interest.

Nomenclature

γHalf width-to-thickness ratio of the chord
τ1Brace-to-chord wall thickness ratio
nChord stress divided by chord yield stress

References

  1. Wardenier, J.; Paker, J.A.; Zhao, X.L.; van der Vegte, G.J. Hollow Sections in Structural Applications; CIDECT: Geneva, Switzerland, 2010. [Google Scholar]
  2. Mills, J.; LaBoube, R. Self-drilling screw joints for cold-formed channel portal frames. ASCE J. Struct. Eng. 2004, 130, 1799–1806. [Google Scholar] [CrossRef]
  3. Lee, Y.H.; Tan, C.S.; Mohammad, S. Review on cold-formed steel connections. Sci. World J. 2014, 2014, 951216. [Google Scholar] [CrossRef] [PubMed]
  4. Yan, W.; Mu, T.; Xie, Z.; Yu, C. Experimental investigation of typical connections for fabricated cold-formed steel trusses. Adv. Struct. Eng. 2019, 22, 141–151. [Google Scholar] [CrossRef]
  5. Li, Q.Y.; Young, B. Tests of cold-formed steel built-up open section members under eccentric compressive load. J. Constr. Steel Res. 2021, 184, 106775. [Google Scholar] [CrossRef]
  6. Zou, Y.; Zhou, X.; Shi, Y. Shear resistance of cold-formed thin-walled steel inter-story connections. J. Constr. Steel Res. 2021, 183, 106757. [Google Scholar] [CrossRef]
  7. Chen, X.; Blum, H.B.; Roy, K. Cold-formed steel portal frame moment-resisting joints: Behaviour, capacity and design. J. Constr. Steel Res. 2021, 183, 106718. [Google Scholar] [CrossRef]
  8. Zaharia, R.; Dubia, D. Stiffness of joints in bolted connected cold-formed steel trusses. J. Constr. Steel Res. 2006, 62, 240–249. [Google Scholar] [CrossRef]
  9. Öztürk, F.; Pul, S. Experimental and numerical study on a full scale apex connection of cold-formed steel portal frames. Thin Walled Struct. 2015, 94, 79–88. [Google Scholar] [CrossRef]
  10. Pouladi, P.; Ronaldson, J.; Clifton, G.C. Finite-element assisted design of eaves joint of cold-formed steel portal frames having single channel sections. Structures 2019, 20, 452–464. [Google Scholar] [CrossRef]
  11. Far, H.; Saleh, A.; Firouzianhaji, A. A simplified method to determine shear stiffness of thin-walled cold formed steel storage rack frames. J. Constr. Steel Res. 2017, 138, 799–805. [Google Scholar] [CrossRef]
  12. Song, L.; Yan, W.; Yu, C. Flexural behavior investigation of the CFS truss beams with self-piercing riveted connection. J. Constr. Steel Res. 2019, 156, 28–45. [Google Scholar] [CrossRef]
  13. Song, L.; Yan, W.; Zhang, X. Feasibility research on the application of self-piercing riveted connection in cold-formed steel structures. J. Constr. Steel Res. 2020, 168, 105957. [Google Scholar] [CrossRef]
  14. Wang, J.F.; Wang, W.Q.; Xiao, Y.; Guo, L. Cyclic behavior tests and evaluation of CFS truss composite floors. J. Build. Eng. 2020, 35, 101974. [Google Scholar] [CrossRef]
  15. Roy, K.; Lau, H.H.; Ting, T.C.H. Experiments and finite element modelling of screw pattern of self-drilling screw connections for high strength cold-formed steel. Thin-Walled Struct. 2019, 145, 106393. [Google Scholar] [CrossRef]
  16. Fahmy, A.S.; Swelem, S.M.; Mussttaf, H.H. Beam-column connections behavior of cold-formed steel members: New experimental configuration. KSCE J. Civil Eng. 2020, 24, 2147–2159. [Google Scholar] [CrossRef]
  17. Mathieson, C.; Roy, K.; Clifton, G.C. Failure mechanism and bearing capacity of cold-formed steel trusses with HRC connectors. Eng. Struct. 2019, 201, 109741. [Google Scholar] [CrossRef]
  18. Dizdar, Ç.; Baran, E.; Topkaya, C. Strength and stiffness of floor trusses fabricated from cold-formed steel lipped channels. Eng. Struct. 2019, 181, 437–457. [Google Scholar] [CrossRef]
  19. Phan, D.T.; Mojtabaei, S.M.; Hajirasouliha, I.H. Design and optimization of cold-formed steel sections in bolted moment connections considering bimoment. ASCE J. Struct. Eng. 2020, 146, 04020153. [Google Scholar] [CrossRef]
  20. Zagόrowska, M.G.; Galewska, E.U.; Deniziak, P. Experimental investigation of joint with positive eccentricity in CFS truss. Thin Walled Struct. 2020, 157, 106998. [Google Scholar] [CrossRef]
  21. Gan, J.C.; Lim, J.H.; Lim, S.K.; Lin, H.S. Experimental and numerical study on the effect of heel plate length and thickness on the structural integrity of cold-formed steel roof trusses. Int. J. Steel Struct. 2021, 21, 22–34. [Google Scholar] [CrossRef]
  22. Güldür, H.; Baran, E.; Topkaya, G. Experimental and numerical analysis of cold-formed steel floor trusses with concrete filled compression chord. Eng. Struct. 2021, 234, 111813. [Google Scholar] [CrossRef]
  23. Choo, Y.S.; Qian, X.D.; Wardenier, J. Effects of boundary conditions and chord stresses on static strength of thick-walled CHS K-joints. J. Constr. Steel Res. 2006, 62, 316–328. [Google Scholar] [CrossRef]
  24. Li, T.; Lie, S.T.; Cong, P.W. Effect of chord axial stresses on the static strength of cracked tubular T/Y-joints under out-of-plane and in-plane bending. Adv. Struct. Eng. 2019, 22, 1698–1710. [Google Scholar] [CrossRef]
Figure 1. Proposed K-joint.
Applsci 11 08587 g001
Figure 2. Four types of U-shape connector used.
Applsci 11 08587 g002
Figure 3. Dimensions of four U-shape connectors.
Applsci 11 08587 g003
Figure 4. Geometries of four typical K-joints (unit in mm).
Applsci 11 08587 g004
Figure 5. Connection between the U-shape connector and the chord.
Applsci 11 08587 g005
Figure 6. A completed K-joint specimen.
Applsci 11 08587 g006
Figure 7. Dimensions of the coupon test specimen (unit in mm).
Applsci 11 08587 g007
Figure 8. Setting up of the coupon test.
Applsci 11 08587 g008
Figure 9. Testing rig of K-joint specimen.
Applsci 11 08587 g009
Figure 10. Manual oil pump.
Applsci 11 08587 g010
Figure 11. Deployment of displacement transducers of the K-joint specimen.
Applsci 11 08587 g011
Figure 12. Deformation of the specimen UPL-1.
Applsci 11 08587 g012aApplsci 11 08587 g012b
Figure 13. Deformation of specimen UPU-1.
Applsci 11 08587 g013
Figure 14. Deformation of specimen ULW-1.
Applsci 11 08587 g014
Figure 15. Deformation of specimen UTW-1.
Applsci 11 08587 g015aApplsci 11 08587 g015b
Figure 16. Loading-displacement curves of specimens in group 1.
Applsci 11 08587 g016aApplsci 11 08587 g016b
Figure 17. Loading-displacement curves of specimens in group 2.
Applsci 11 08587 g017
Figure 18. Loading-displacement curves of specimens in group 3.
Applsci 11 08587 g018
Figure 19. Loading-displacement curves of specimens in group 4.
Applsci 11 08587 g019
Figure 20. Illustration of interactions between the connector and the SHS member.
Applsci 11 08587 g020
Figure 21. Mesh model of typical K-joint specimens using the UTW connector.
Applsci 11 08587 g021
Figure 22. Boundary conditions of FE models.
Applsci 11 08587 g022
Figure 23. Comparison of loading−displacement curves.
Applsci 11 08587 g023aApplsci 11 08587 g023b
Figure 24. Deformation of the U-shape connector and displacement contour of the chord of FE model UTW-1.
Applsci 11 08587 g024
Figure 25. Effect of n.
Applsci 11 08587 g025
Figure 26. Effect of γ.
Applsci 11 08587 g026
Figure 27. Effect of τ1.
Applsci 11 08587 g027
Table 1. Dimensions of U-shape connectors.
No.UPL1UPL2UPL3UPU1UPU2UPU3ULW1ULW2ULW3UTW1UTW2UTW3
L243238241242241242239242241240240242
H123.50124123.50123123123119120120123124124
B646563666664666463656665
t1.741.711.751.751.731.731.751.771.761.751.751.74
t1///666666666
a1312.5012.5016.501716.5091010.50131213
b23.50232325252523.502323242424
c21.5021.502220.50212122222120.5020.5020
d22.50222221.502121.502322.5022.50202020
e2322.5022.5024242423232323.5023.5023
f22.502322.516.50161621.50212123.502424
a141214.501412151213.5012.50232425
b25252523.5023.5023252525.50242423.50
c24.502424.5024.5024.5024.502424.502424.502423.50
d2524.502524.5024.502424.502524.502323.5023
e2423.50242424.5024.5023.502424252324
f24.50242424.5024.50242423.5023.502423.5024
g2524.5024.5025252524.5025252423.5024
h2524.502424.5024.5024.502525252423.5023.50
i232323242424222323242424
j2524.50252323232525252424.5024.50
k10.5081012.514119.5010.5011///
R555555555555
R1///121212//////
Note: unit in mm.
Table 2. Material properties of U-shape connectors and SHS members.
Specimen No.ThicknessElastic ModulusYield StressUltimate StressElongation Rate (%)
(mm)(GPa)(MPa)(MPa)
UP-11.79172280.10372.6727.10
UP-21.78180275.46402.8327.30
UP-31.79176286.52355.5631.80
UP-41.79175273.20380.3332.70
UP-51.79182290.14376.5725.10
UP-61.79175274.32386.233000
XF-11.44202327.23390.422300
XF-21.47216350.20360.562100
XF-31.48209315.46390.332300
XF-41.50194344.87400.012300
XF-51.45205300.00385.662200
XF-61.50210331.97380.452100
Table 3. Ultimate bearing capacity of each specimen.
Group
No.
Specimen
No.
Thickness of the ConnectorUltimate Bearing CapacityThe Average
(mm)(kN)(kN)
Group 1UPL11.7443.4042.60
UPL21.7145.60
UPL31.7538.90
Group 2UPU11.7537.1039.90
UPU21.7342.70
UPU31.7339.90
Group 3ULW11.7544.8042.40
ULW21.7740.00
ULW31.7642.40
Group 4UTW11.7543.2044.50
UTW21.7545.60
UTW31.7444.60
Table 4. Details of the FE models investigated.
No.γτ1nUltimate Bearing Capacity (kN)
1151.0−0.638.2
2151.0−0.434.1
3151.0−0.238.2
4151.00.047.9
5151.00.221.8
6151.00.417.4
7151.00.615.5
8201.0−0.628.7
9201.0−0.426.4
10201.0−0.233.5
11201.00.045.0
12201.00.225.0
13201.00.420.8
14201.00.619.1
15301.0−0.617.5
16301.0−0.419.2
17301.0−0.221.0
18301.00.031.0
19301.00.220.4
20301.00.416.2
21301.00.615.3
22151.00.047.9
23251.00.033.2
24301.00.031.0
25201.20.046.2
26201.40.048.0
27201.60.051.1
Publisher’s Note: MDPI stays neutral with regard to jurisdictional claims in published maps and institutional affiliations.

