
Assessment of Laser Galvanometer Scanning System Accuracy Using Ball-Bar Standard


Laboratory of Coordinate Metrology, Cracow University of Technology, al. Jana Pawła II 37, 31-864 Kraków, Poland
*
Author to whom correspondence should be addressed.
Appl. Sci. 2021, 11(19), 8929; https://0-doi-org.brum.beds.ac.uk/10.3390/app11198929
Submission received: 17 August 2021
/
Revised: 14 September 2021
/
Accepted: 22 September 2021
/
Published: 25 September 2021
(This article belongs to the Special Issue New Trends in Manufacturing Metrology)
Abstract
:The laser projector based on the laser galvanometer scanning system enables the projection of CAD-based laser images onto geometrical objects. Furthermore, the system can perform a scan of components in order to control proper positioning (e.g., welded structures). We decided to conduct research aimed at determining the suitability of such systems for length measurements and assess their accuracy. These systems are commonly calibrated with the use of flat calibration boards, although their capability of projecting and scanning 3D objects. For this reason, a new method based on ISO 10360 has been proposed. Analysis of the system’s ability to perform length measurements, selection of a reference standard, and the tested device accuracy were the main objectives of the study. A ball-bar with a nominal length of 3000 mm was chosen as a reference standard. Positions of the reference element in the workspace were determined, and three series of five measured deviations were performed in each setting. The obtained values of measurement errors prove that it is possible to use ball-bar standards to assess the accuracy of the described systems, which is defined by the equation MPE(E0) = ±0.5 mm. The proposed method could be adapted to perform more complex analyzes in this area.
1. Introduction
Performing measurements with the use of laser technology has been known for many years. For a long time, laser interferometers have been used in the field of metrology, mainly as systems for setting and checking coordinate measuring machines. The rapid advancement of computers and laser techniques has resulted in the development of modern distance sensors, which allowed for the use of such technology to perform scans of 3D objects in various industries. Because of this, it was possible to develop Terrestrial Laser Scanning (TLS) or laser projectors. The first group of those systems uses laser technology to scan objects far away from the device. On this basis, a point cloud is generated, which is used for further analysis. Thanks to the high speed and long range, attempts have been made to use laser scanners to determine the Unmanned Aerial Vehicle’s position and perform terrain mapping. This topic is also related to the issue of improving the accuracy of the point cloud mapping, which has been described in many publications [1,2,3].
Laser projection systems, which display templates and perform scans of geometrical objects, operate using galvanometer laser scanners. These devices are built from two mirrors placed orthogonally and projecting a laser spot onto an object [4]. The rapid movement of the galvanometers provides the illusion of more complex shapes such as lines, arcs, and circles. Example applications of laser projection systems are detailed in [5].
Galvanometer laser scanners are also used in applications such as laser Doppler vibrometers [6] or Laser Machining System [7]. Studies on improving the accuracy of those systems, are described in [6,7,8,9,10]. In [6], the authors present the calibration of the galvanometers’ angles calibration using cosine-law relationships. The line structured light measurement model based on a galvanometer scanner and the proposal of a height calibration method are described in [7]. Field distortion, which strongly influences accuracy, and its compensation methods are described in [8,9]. The proposal of calibration of galvanometer laser scanners using flat calibration boards is described in [10].
The use of virtual techniques displaying templates on objects allows speeding up positioning (e.g., welded structures) and some control processes. Virtual support of the marking out process makes it possible to minimize the impact of human error on positioning precision. Eliminating or significantly reducing the use of manual measuring devices and tools used for marking out is possible. The time required to perform positioning and control operations is reduced, and there is no need for physical templates.
However, there are also some disadvantages of using methods with a higher level of complexity than traditional approaches. It requires a more skilled operator with knowledge of CAD techniques and the basis of coordinate metrology. Moreover, the virtual positioning system must be treated in an appropriate manner as it is more susceptible to damage under industrial conditions than traditional templates.
One of the main factors determining the usability of a measuring system is its accuracy. In the field of Coordinate Metrology, the accuracy of the system is usually referred to as Maximum Permissible Error (MPE) [11,12]. The tested Faro laser projector is a device composed of two main components: a projection head, which is responsible for the projection of appropriate features, and an image-recording head, which enables the positioning of the entire system in relation to the tested object and simple metrological measurements. Until now, interim checks have been performed with the use of flat calibration boards. We found no publications on the use of CMM-typical standards for the accuracy testing of galvanometer laser scanners. Therefore, it was decided to perform such tests proposing a procedure based on the recommendations of ISO 10360.
The following aims and objectives were defined:
- Analysis of the use of the Galvanometer Laser Scanner as a coordinate measuring system.
- Selection of a reference standard.
- Analysis of the system’s ability to measure 2D and 3D standards.
- Analysis of system repeatability.
- System accuracy assess based on the ISO 10360 group of standards—the procedure adaptation due to hardware and software limitations.
2. Materials and Methods
2.1. Specification of the Tested Device
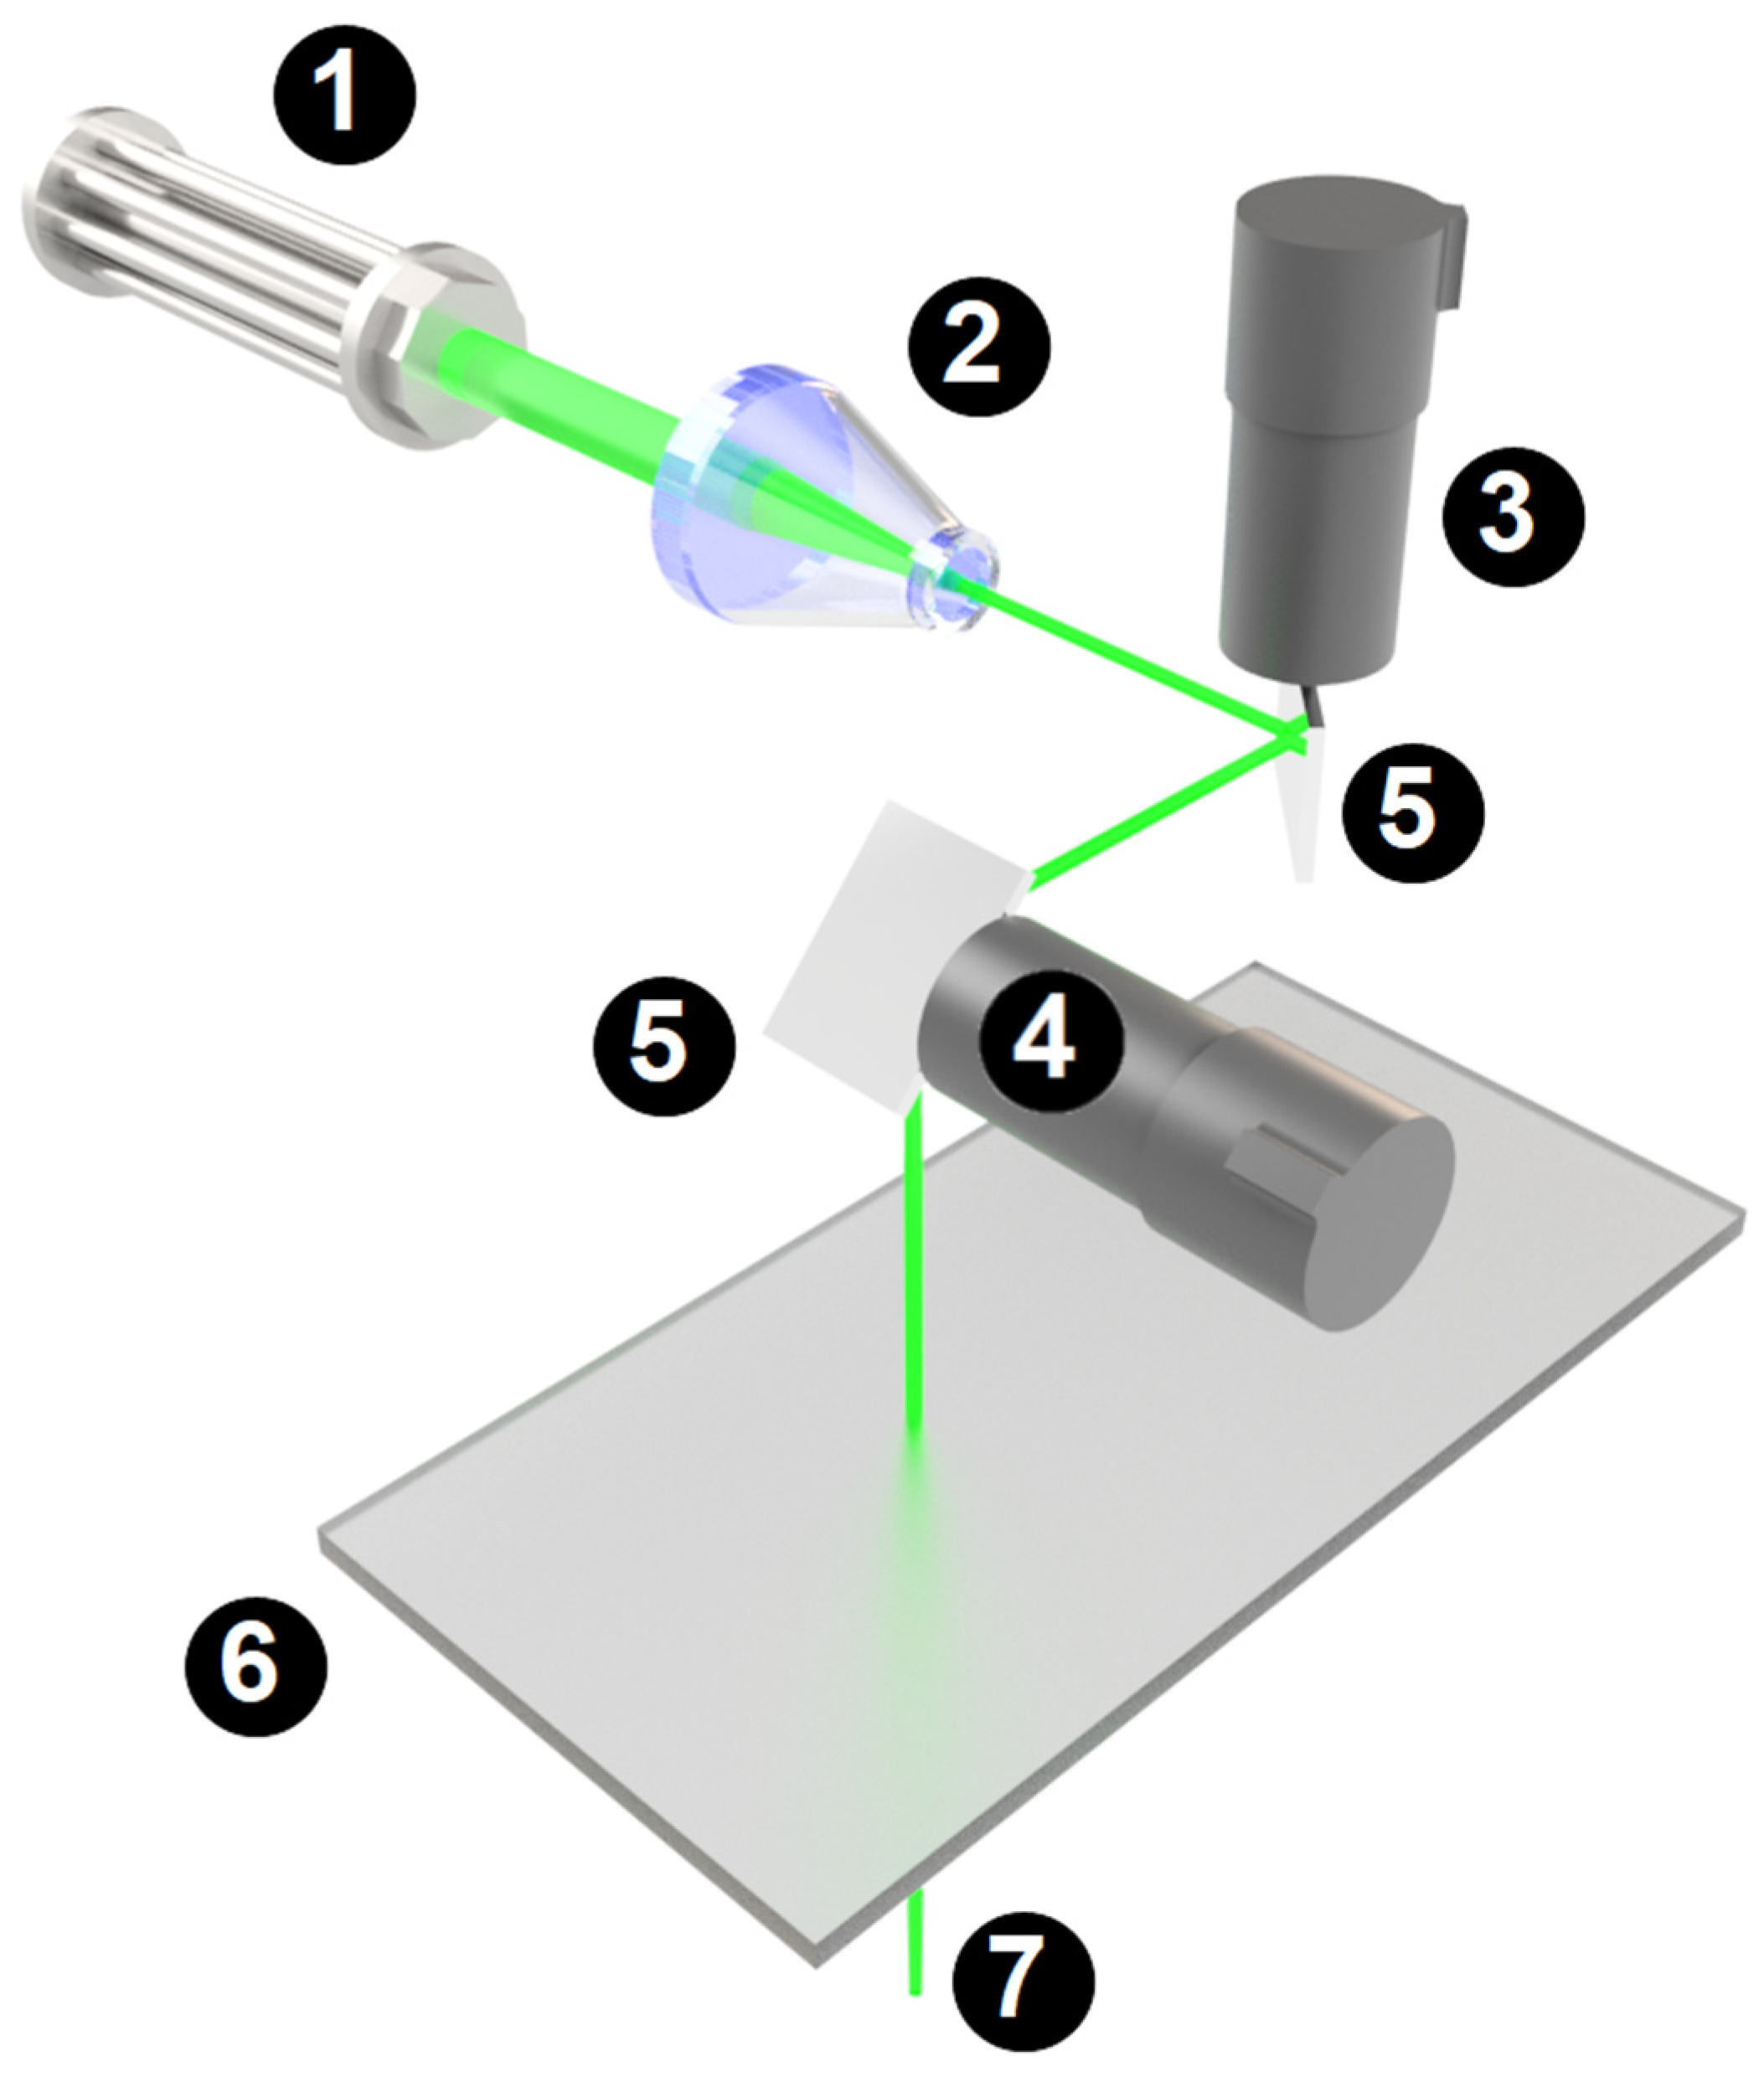
Virtual templates are created by laser spot projection on the object. The laser beam is focused and hits a pair of mirrors located on precise galvanometers positioned in X and Z axes (Figure 1). Then, the beam leaves the housing through the protective glass and is projected onto the object’s surface. Due to the rapid movement of galvanometers, the human eye perceives a laser spot as a complex projection of predetermined figures.
The system of laser projectors (Figure 1) includes the following,
- Laser
- Focusing optic
- Galvanometer X
- Galvanometer Z
- Mirrors
- Protective glass
- Laser output beam
In addition to performing projections, the system can also perform scans of a selected area of the object and compare the position of recognized features against the CAD model. It gives the basis for conducting the accuracy tests described below.
2.2. Selection of the Reference Standard
The selection of applicable standards that meet metrological traceability requirements is crucial for carrying out laser projectors’ accuracy. The measurement capabilities and operating conditions of the system under test should also be taken into consideration. The standards confirming the metrological accuracy of the systems must have a calibration certificate proving their geometrical characteristics. Different types of standards are presented in [14].
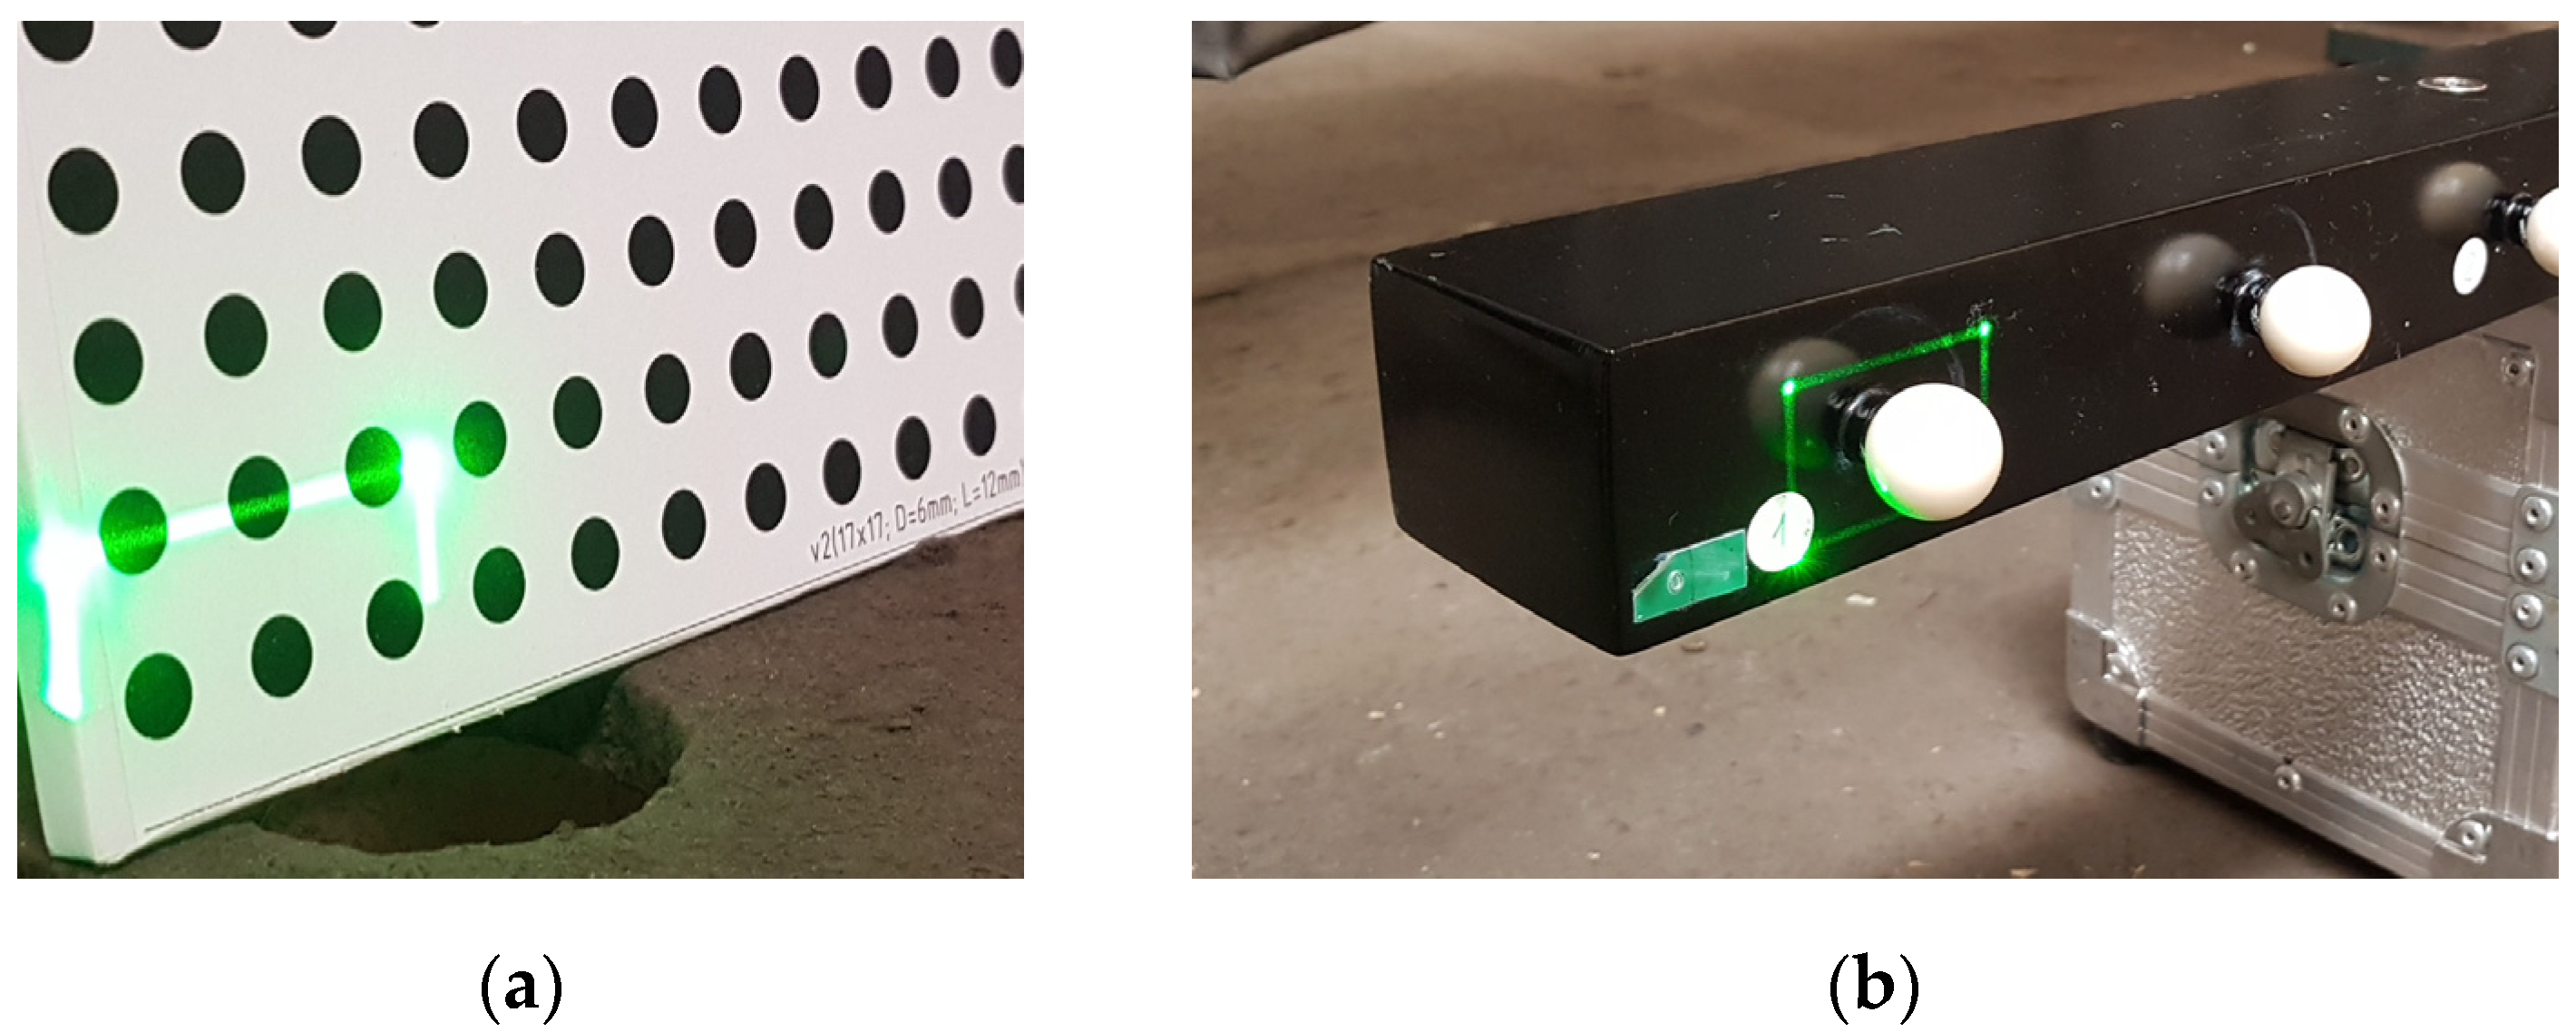
After reviewing the available standards, it was concluded that the system accuracy test would be performed using a ball-bar type standard. The ability of the system to acquisition and recognize the reference spheres images was verified prior to measurements. The image obtained during the ball-bar scan was compared with the image obtained during the scan of the calibration board (Figure 3). For the compared standards, no significant differences were observed. Due to the target range of dimensions tested and the lack of differences in recognizing reference features, the ball-bar standard made of carbon fiber with the near-zero thermal expansion factor (α = 0.2 × 10⁻⁶ K−1) and with a nominal length of L = 3000 mm was selected to assess the system accuracy.
2.3. Determination of Reference Standard Placement in the Test Space
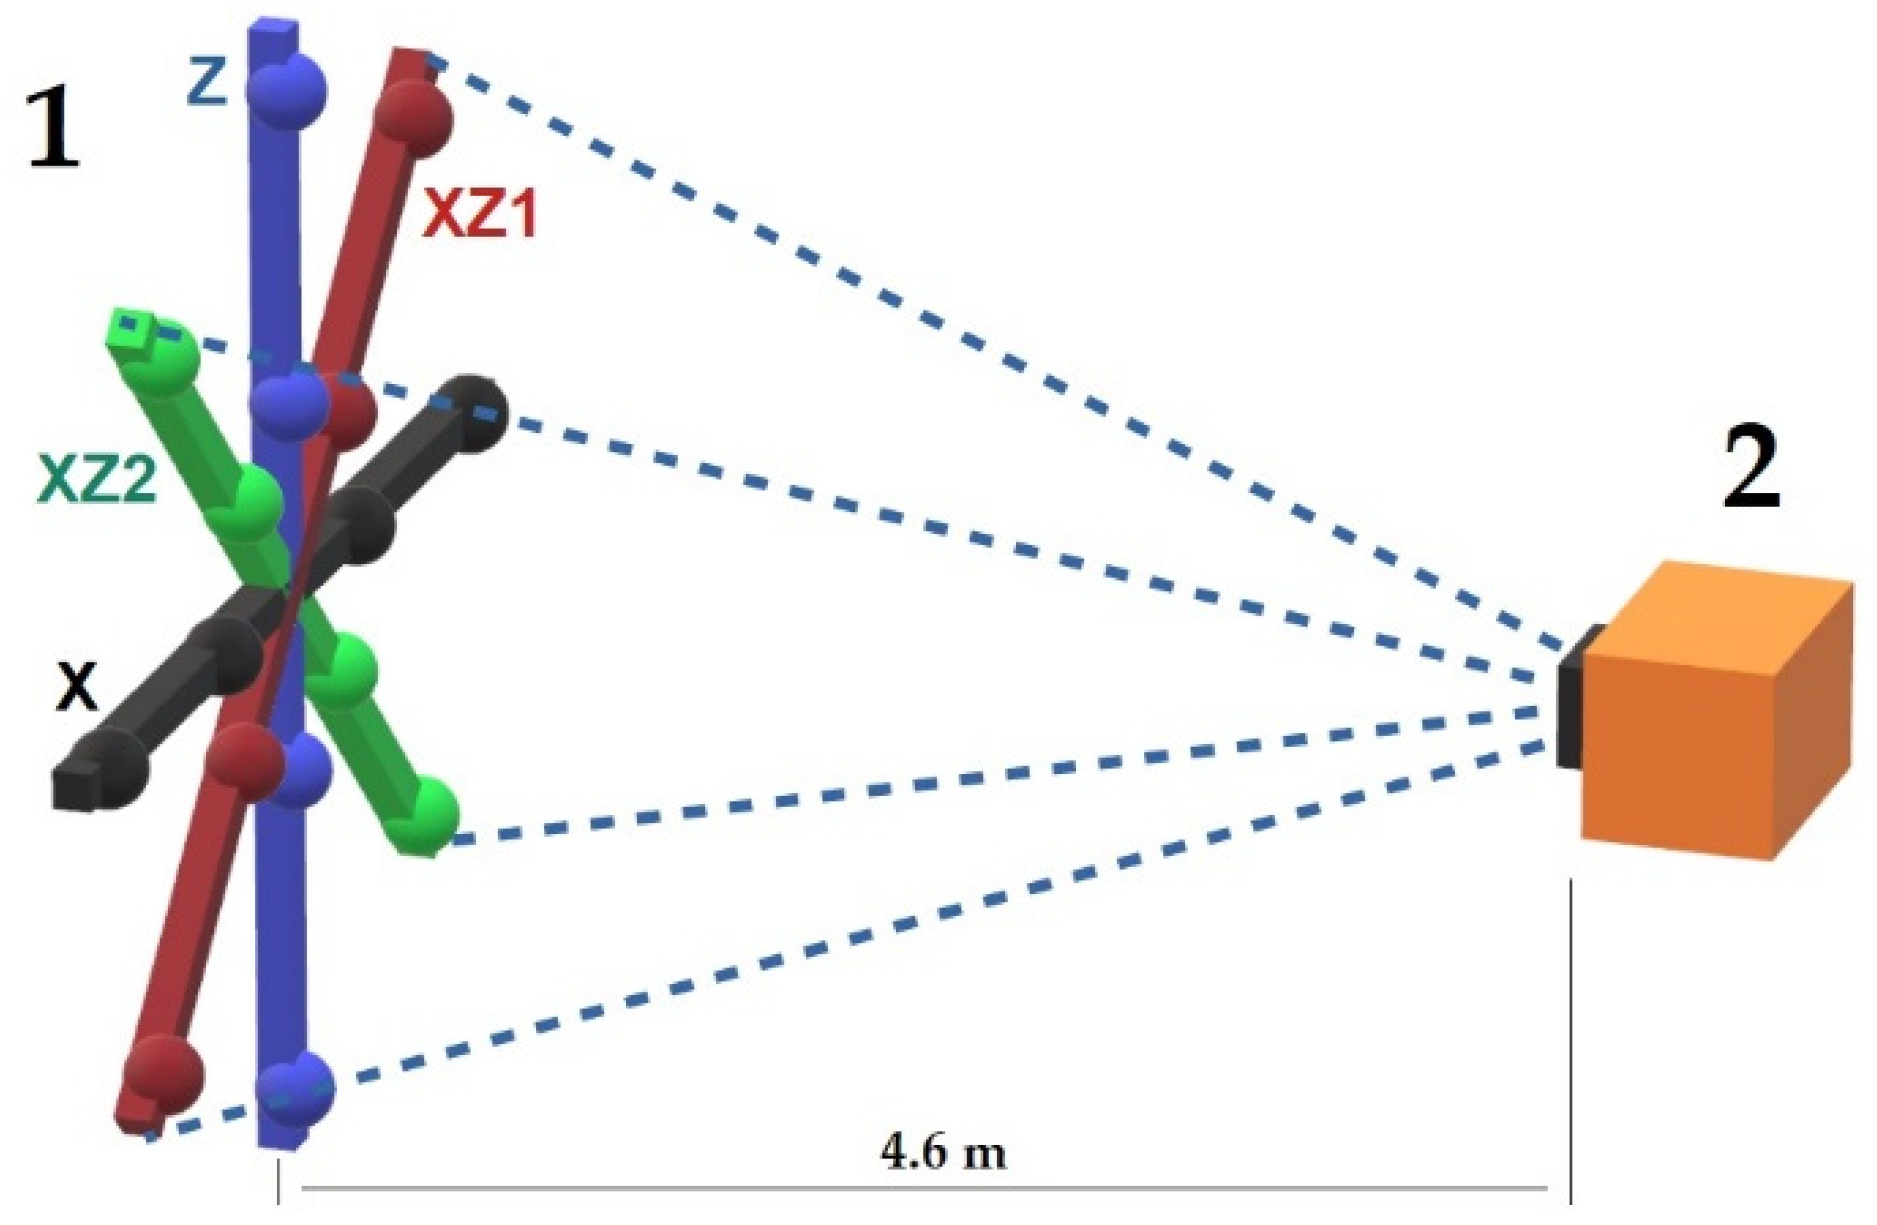
The ball-bar standard placement in the workspace of the laser projector was designed considering the ISO 10360 group recommendations. Two axial settings were defined: X and Z and two diagonal two-dimensional settings: XZ1 and XZ2. The layout of the standard is shown in Figure 4.
3. Results and Discussion
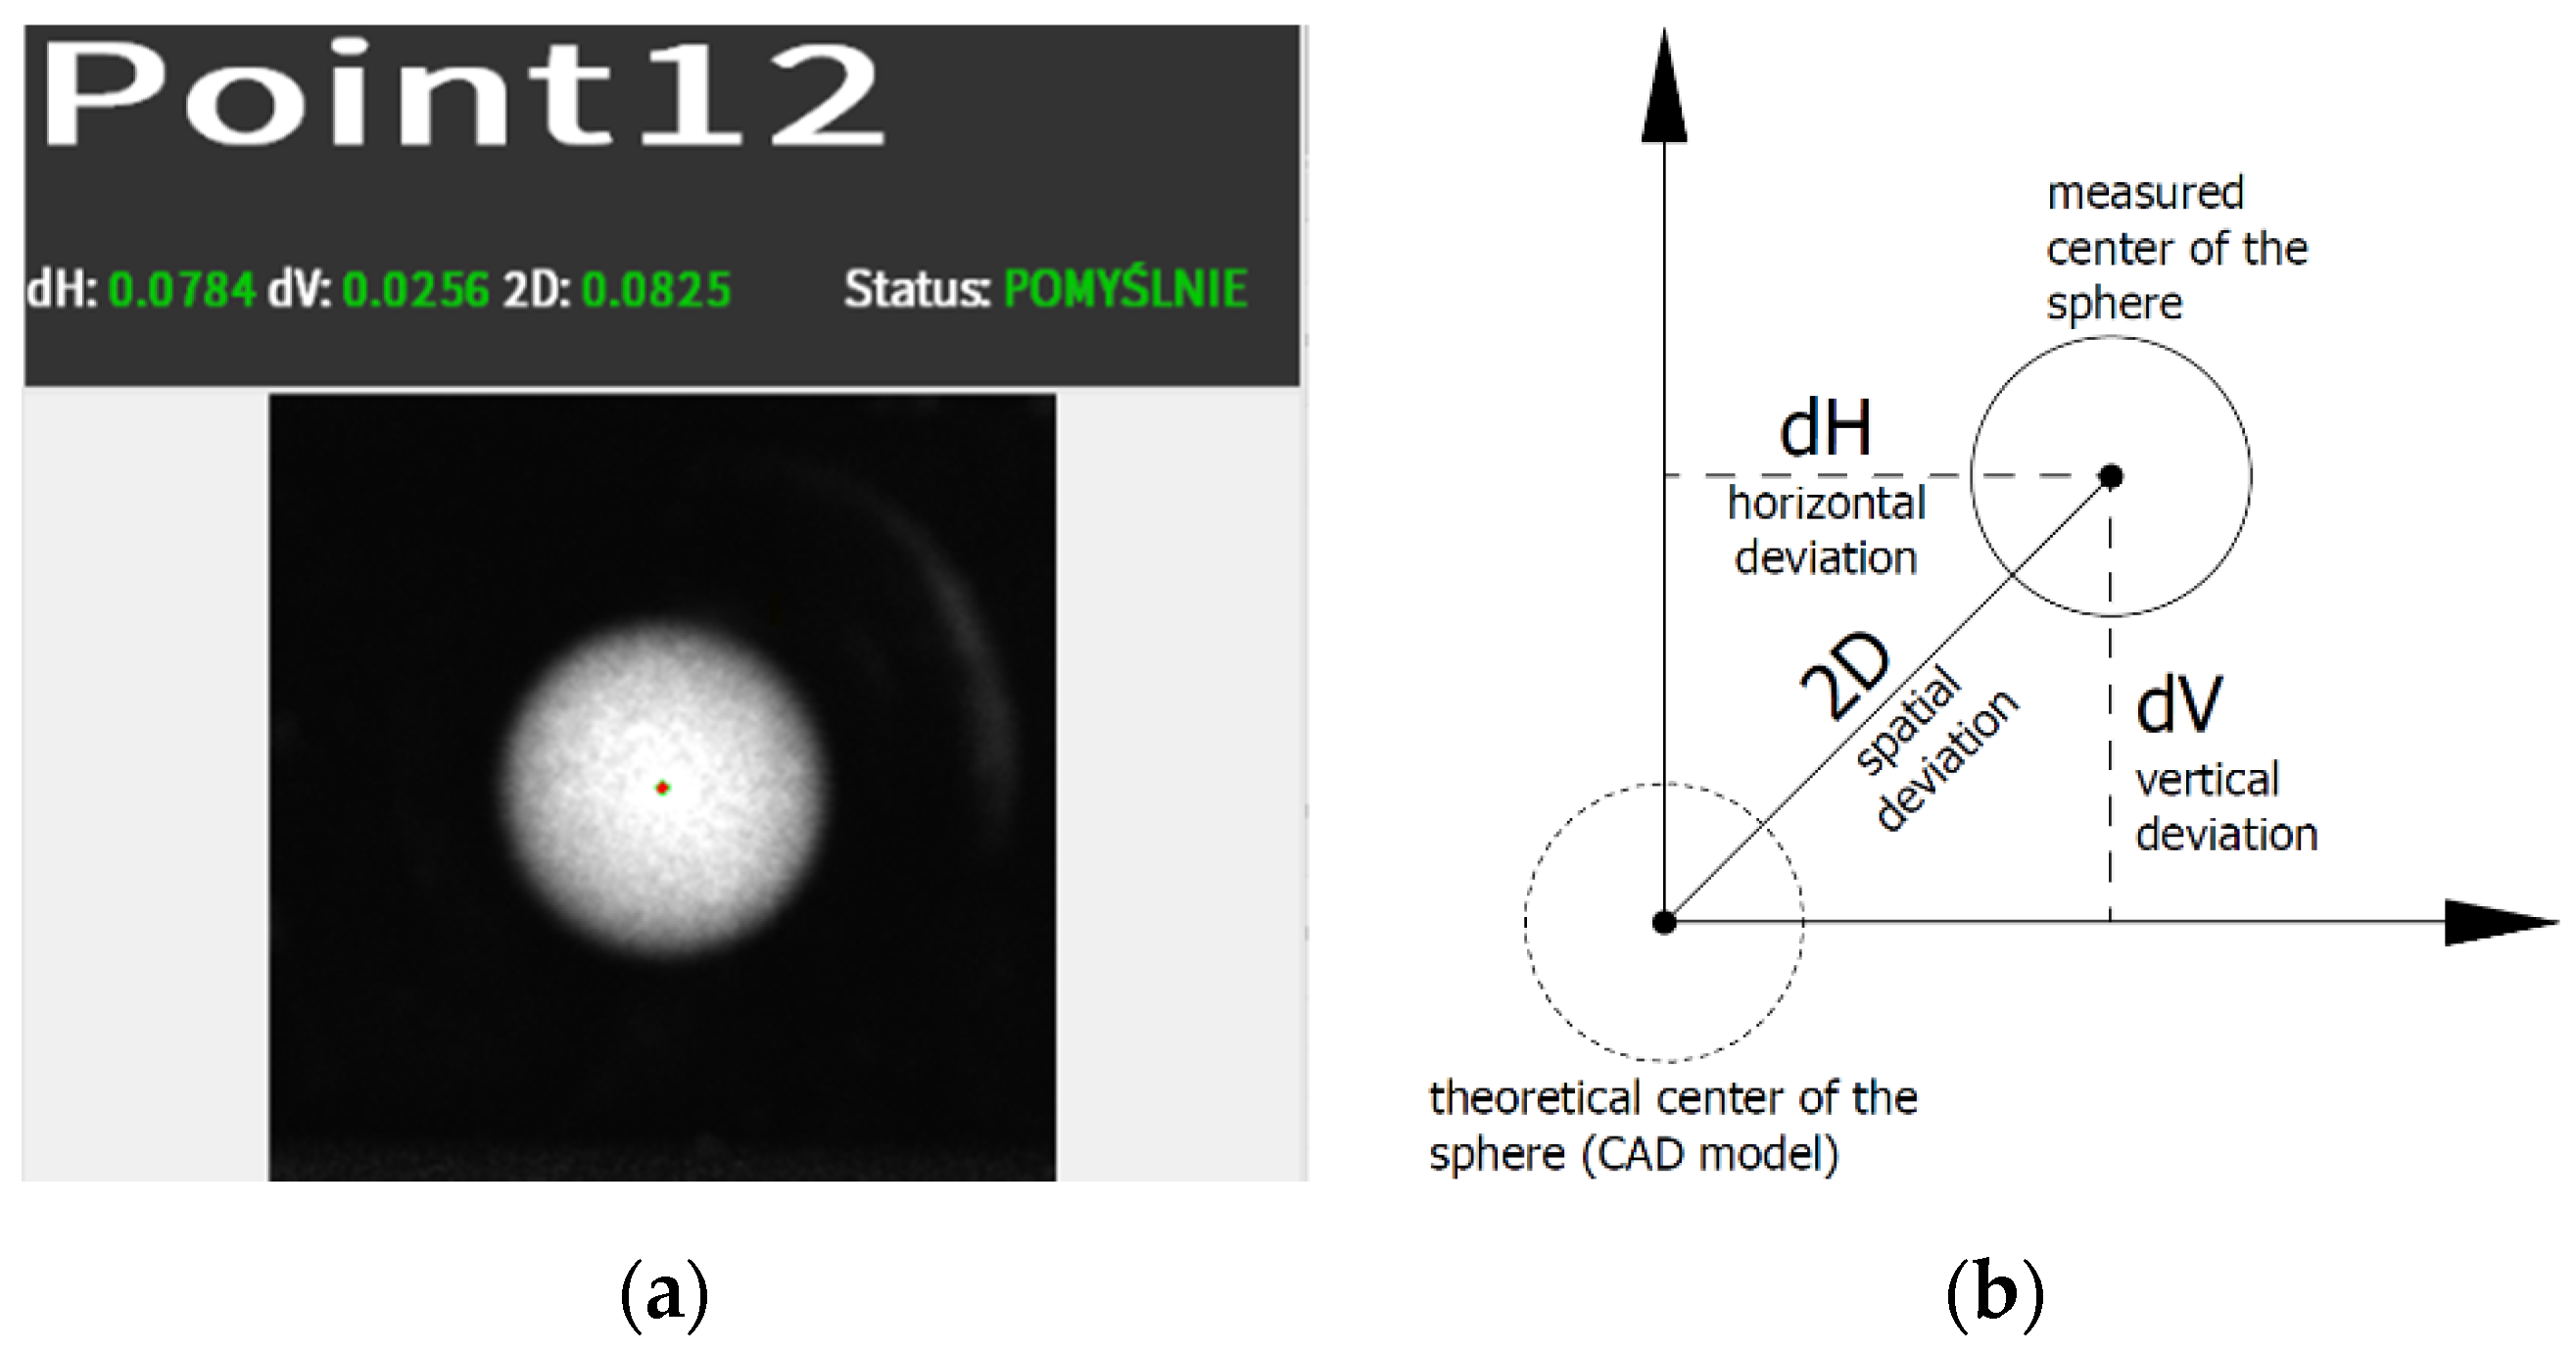
Projector software provided the position error value of the reference spheres as vertical (dV) and horizontal (dH) deviations in the local coordinate system and their combination. Deviations were calculated as the difference between measured and nominal positions of spheres and given as absolute values. Nominal positions were taken directly from the CAD and could not be modified. Thus, the CAD model of the reference object must be built based on the calibrated positions of references spheres in the local coordinate system. The view of the control window with the listed deviations and the geometric error representation is shown in Figure 5. The spatial deviation, defined as 2D in Figure 5, was used to assess the system’s accuracy. Figure 6 represents the CAD model of the used ball-bar standard in the laser projector software.
After uploading the model, it was necessary to define the ball-bar alignment in the projector’s virtual space. It is done by linking the chosen features of the CAD model with the corresponding elements of the object. It is recommended by the manufacturer to choose at least six alignment points. The spheres 0, 9, 14, 15, 19, 30, and the outer sphere (off the axis of the others) were used for the coordinate system alignment.
The alignment is performed by scanning specific spheres and fitting the object to the CAD model. By identifying the same features on the CAD model and the object, the system performs a least squares method to fit the object to the model. According to the CAD model, the projector software takes the directions and zero point of the local coordinate system. Further measurements are carried out in the local coordinate system.
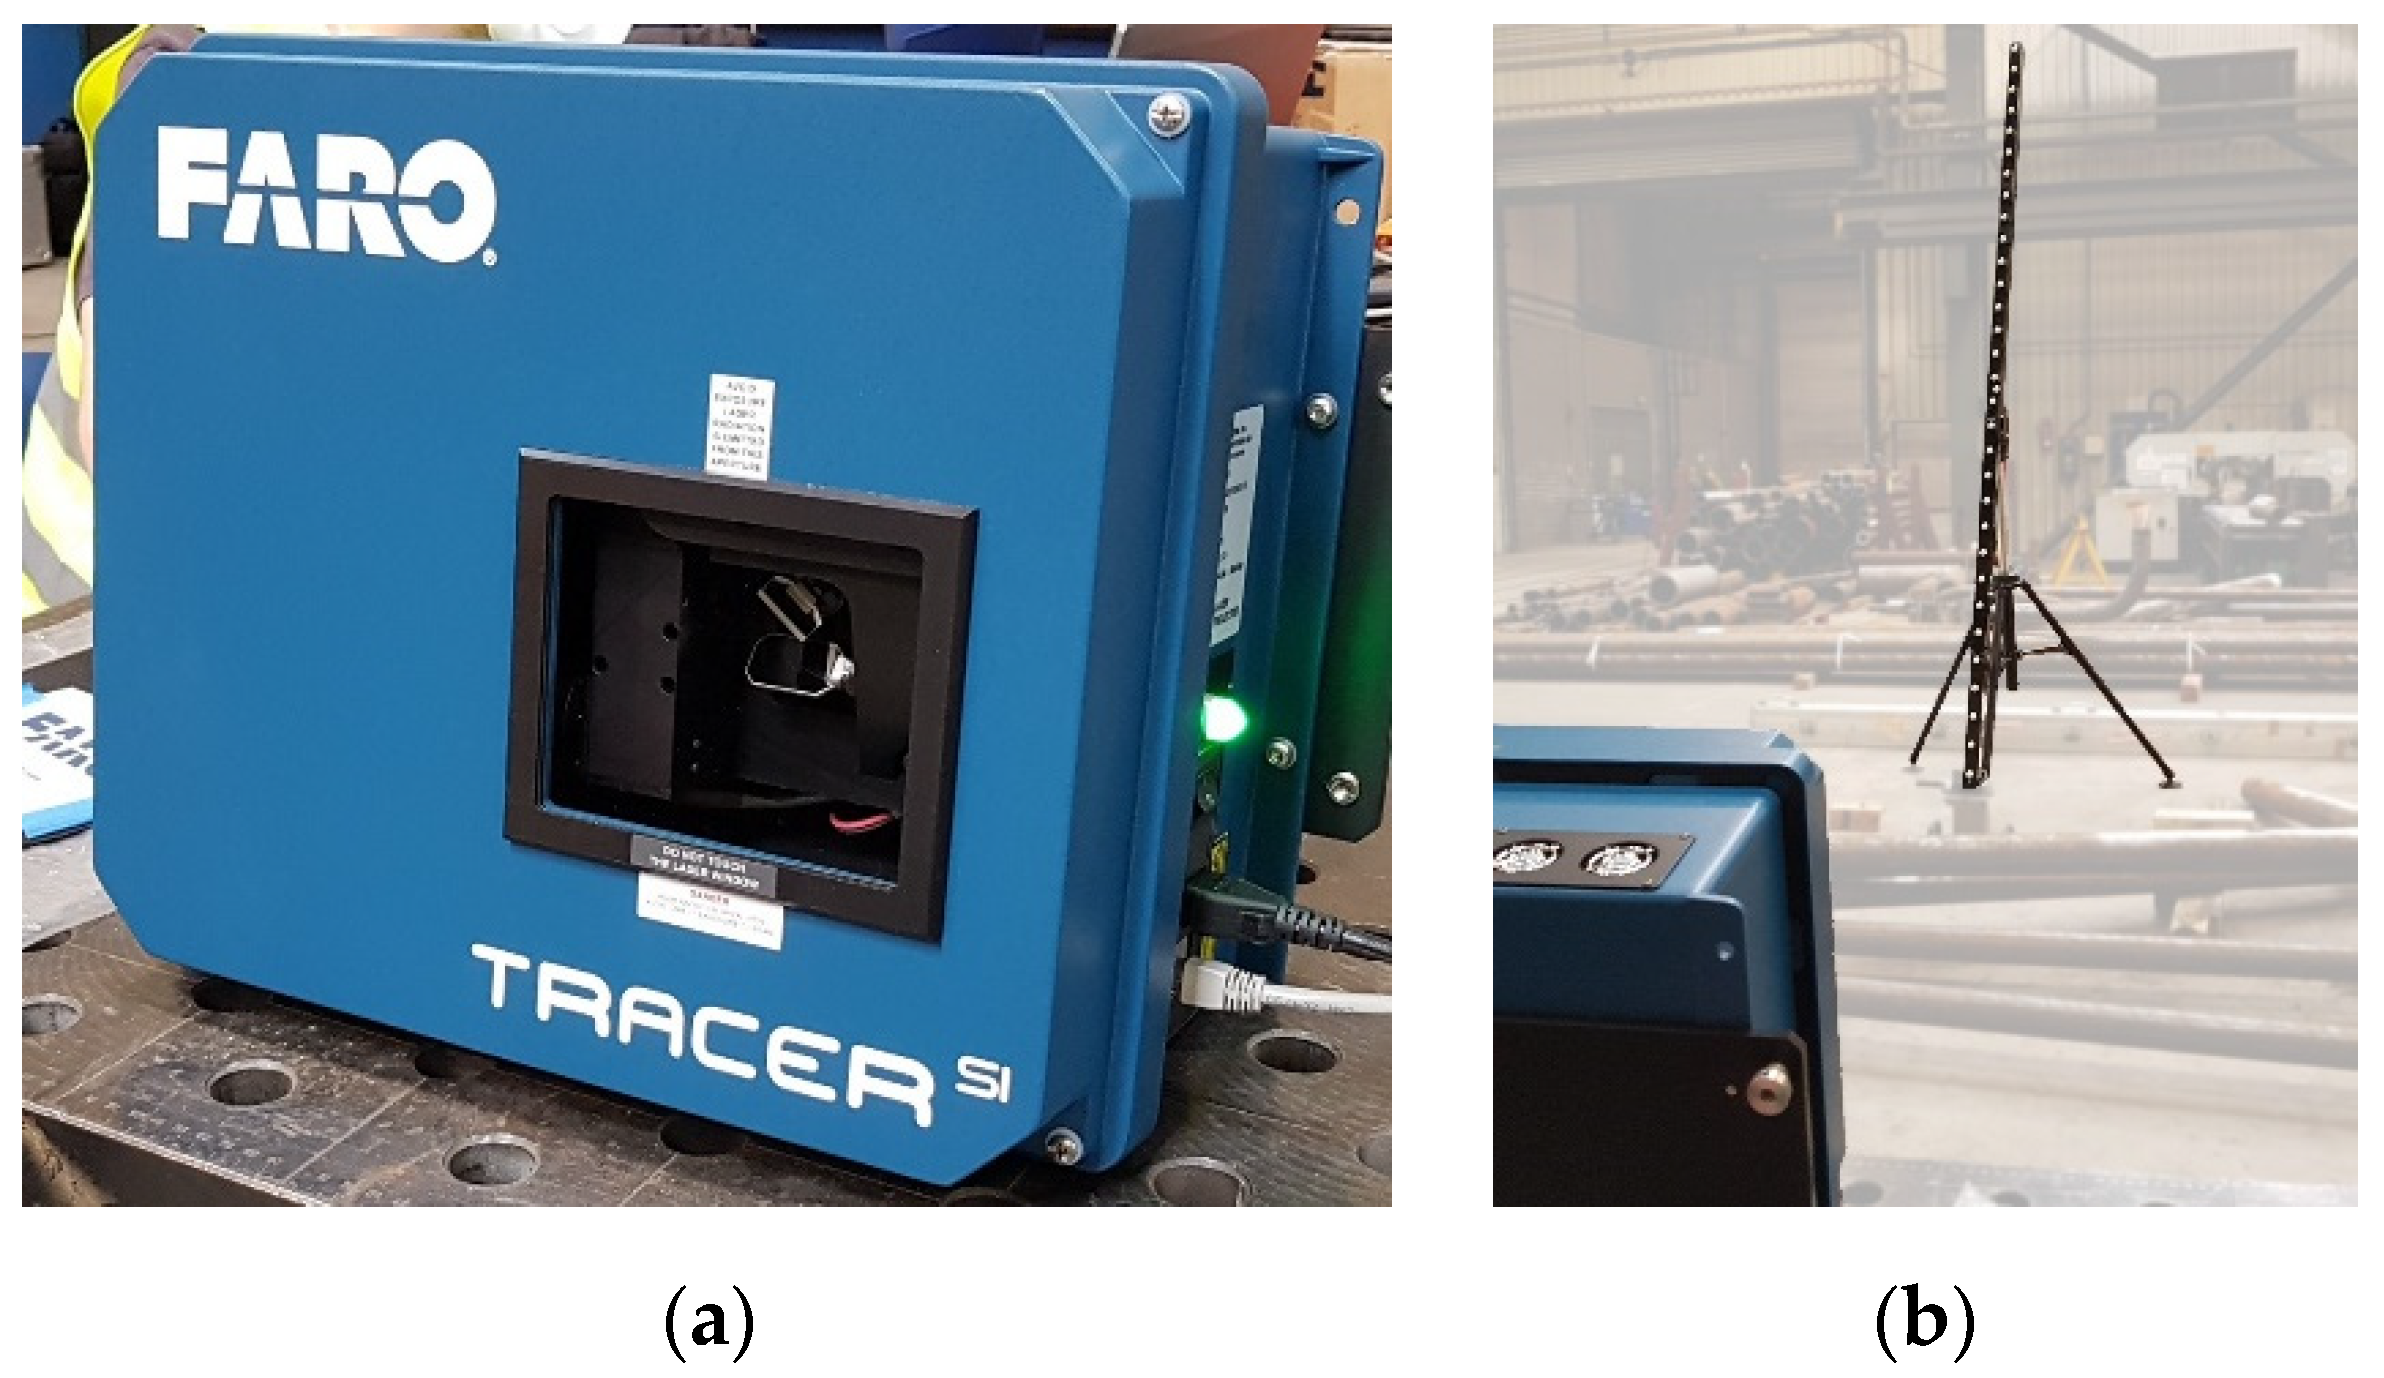
The research involved measuring a selected length standard following the recommendations of ISO 10360. The measuring station consisted of a Faro laser projector model TracerSI with BuildIT 2019 software, a 3000 mm ball-bar length standard, and a temperature data logger. First, the workspace of the system was defined and marked. The projector was mounted on a dedicated tripod which remained stationary throughout the experiment. Each time the ball-bar was repositioned so that the positioning requirements were met as closely as possible. Due to limitations in the operation of the image capturing head and limitations of the software used, not all the required standard positions were measured.
Spheres numbered 0, 2, 9, 16, 23, and 30 were used to measure errors. The sequence and the method of determining the length follow the recommendations of the ISO 10360:1–12 standard. In order to improve the optical properties, the scanning spray was used. This makes it possible to obtain a non-reflective surface while not affecting the measurement results’ quality.
The ambient temperature during the test was 24 ± 2 °C. For each tested position, the standard was placed in the center of the projector’s field of view at a distance of 4.6 m from the system (Figure 4). The results of the measurements are presented graphically (Figure 7, Figure 8, Figure 9, Figure 10 and Figure 11) and in tabular form (Table 2, Table 3, Table 4 and Table 5). An error measurement was performed on six reference spheres for each of the projector workspace axes tested. Three series of such measurements were made. The following values can be found in the tables:
- Nominal—nominal value of the position of the test sphere (in line with the standard main direction)
- Error—measurement error
- R—range:
R = max(Ei) − min(Ei);
- MPE—Maximum Permissible Error:
MPE(E0) = ±B
where B—maximum error value.
The analysis of the results has shown that the increase of the tested length does not cause the error increase. Therefore, the following presentation of the accuracy of the system was accepted:
MPE(E0) = ±0.5 mm
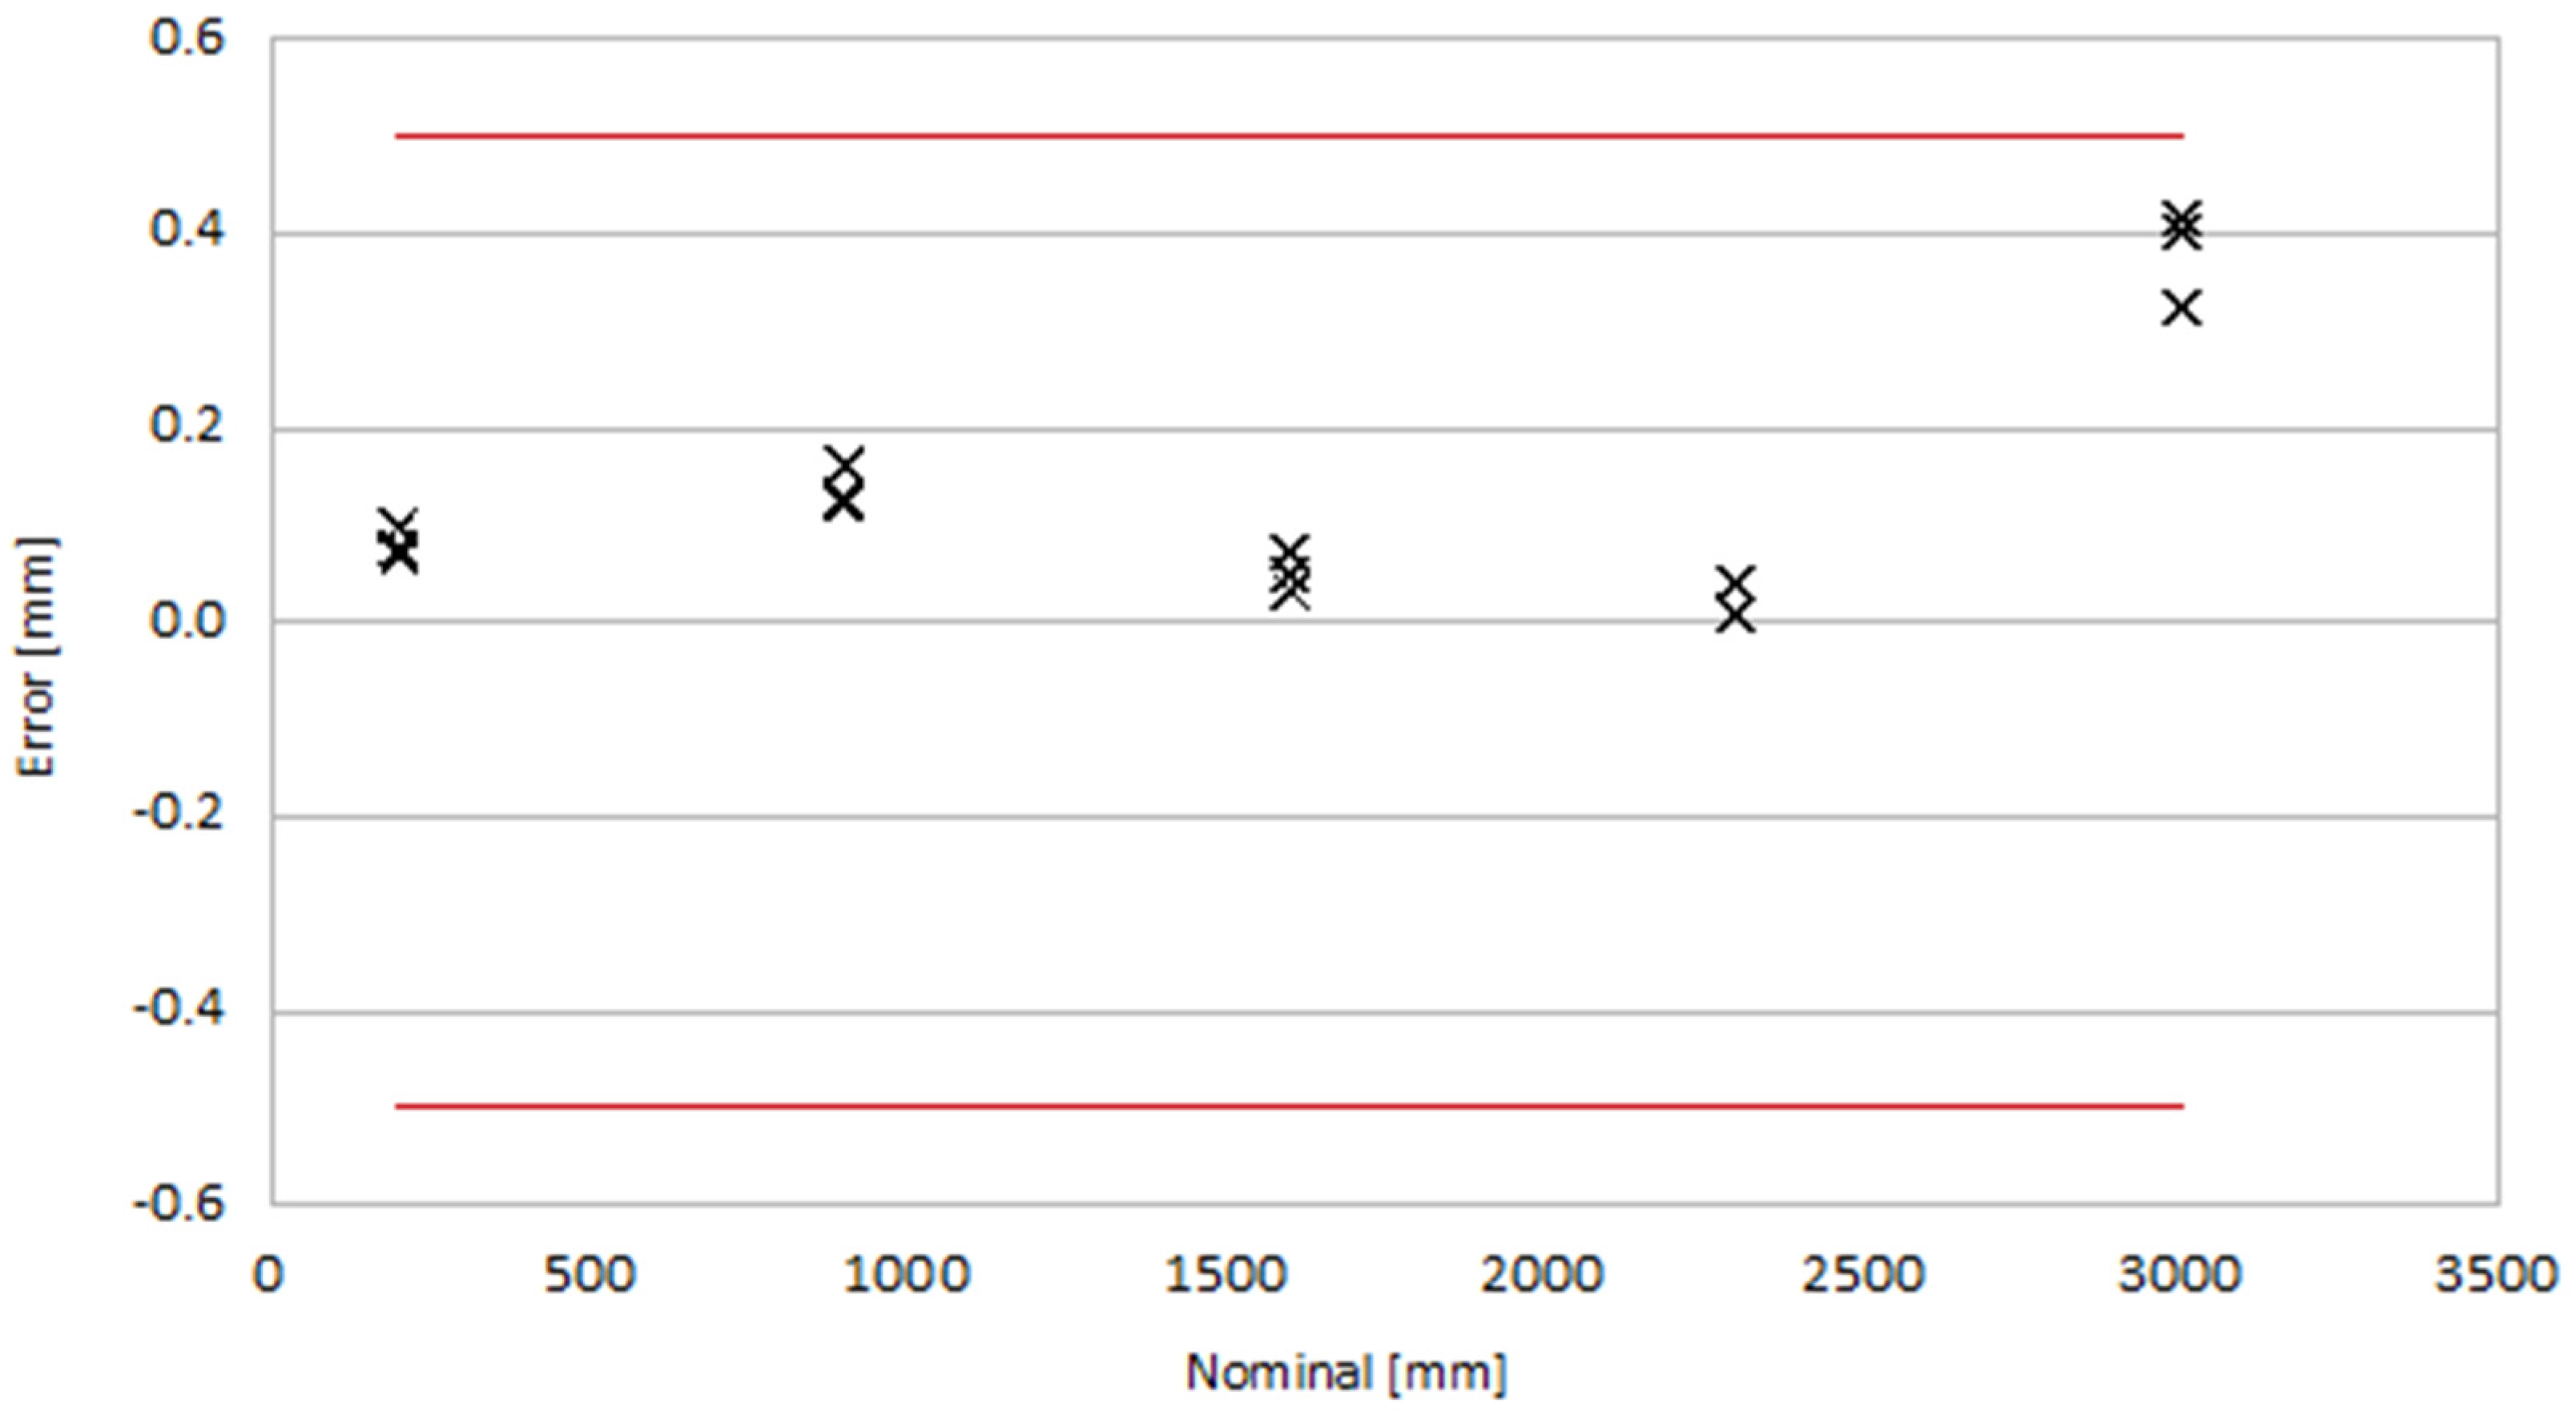
For the X-axis, the minimal average error of 0.02 mm was obtained for the 2300 mm nominal. Below this length, the error was up to 0.2 mm. The range of results remained between 0.03 mm and 0.04 mm. Error increases significantly to 0.4 mm, also the range nearly triples to 0.09 mm for the 3000 mm nominal. The characteristic of the X-axis measurement errors is shown in Figure 7.
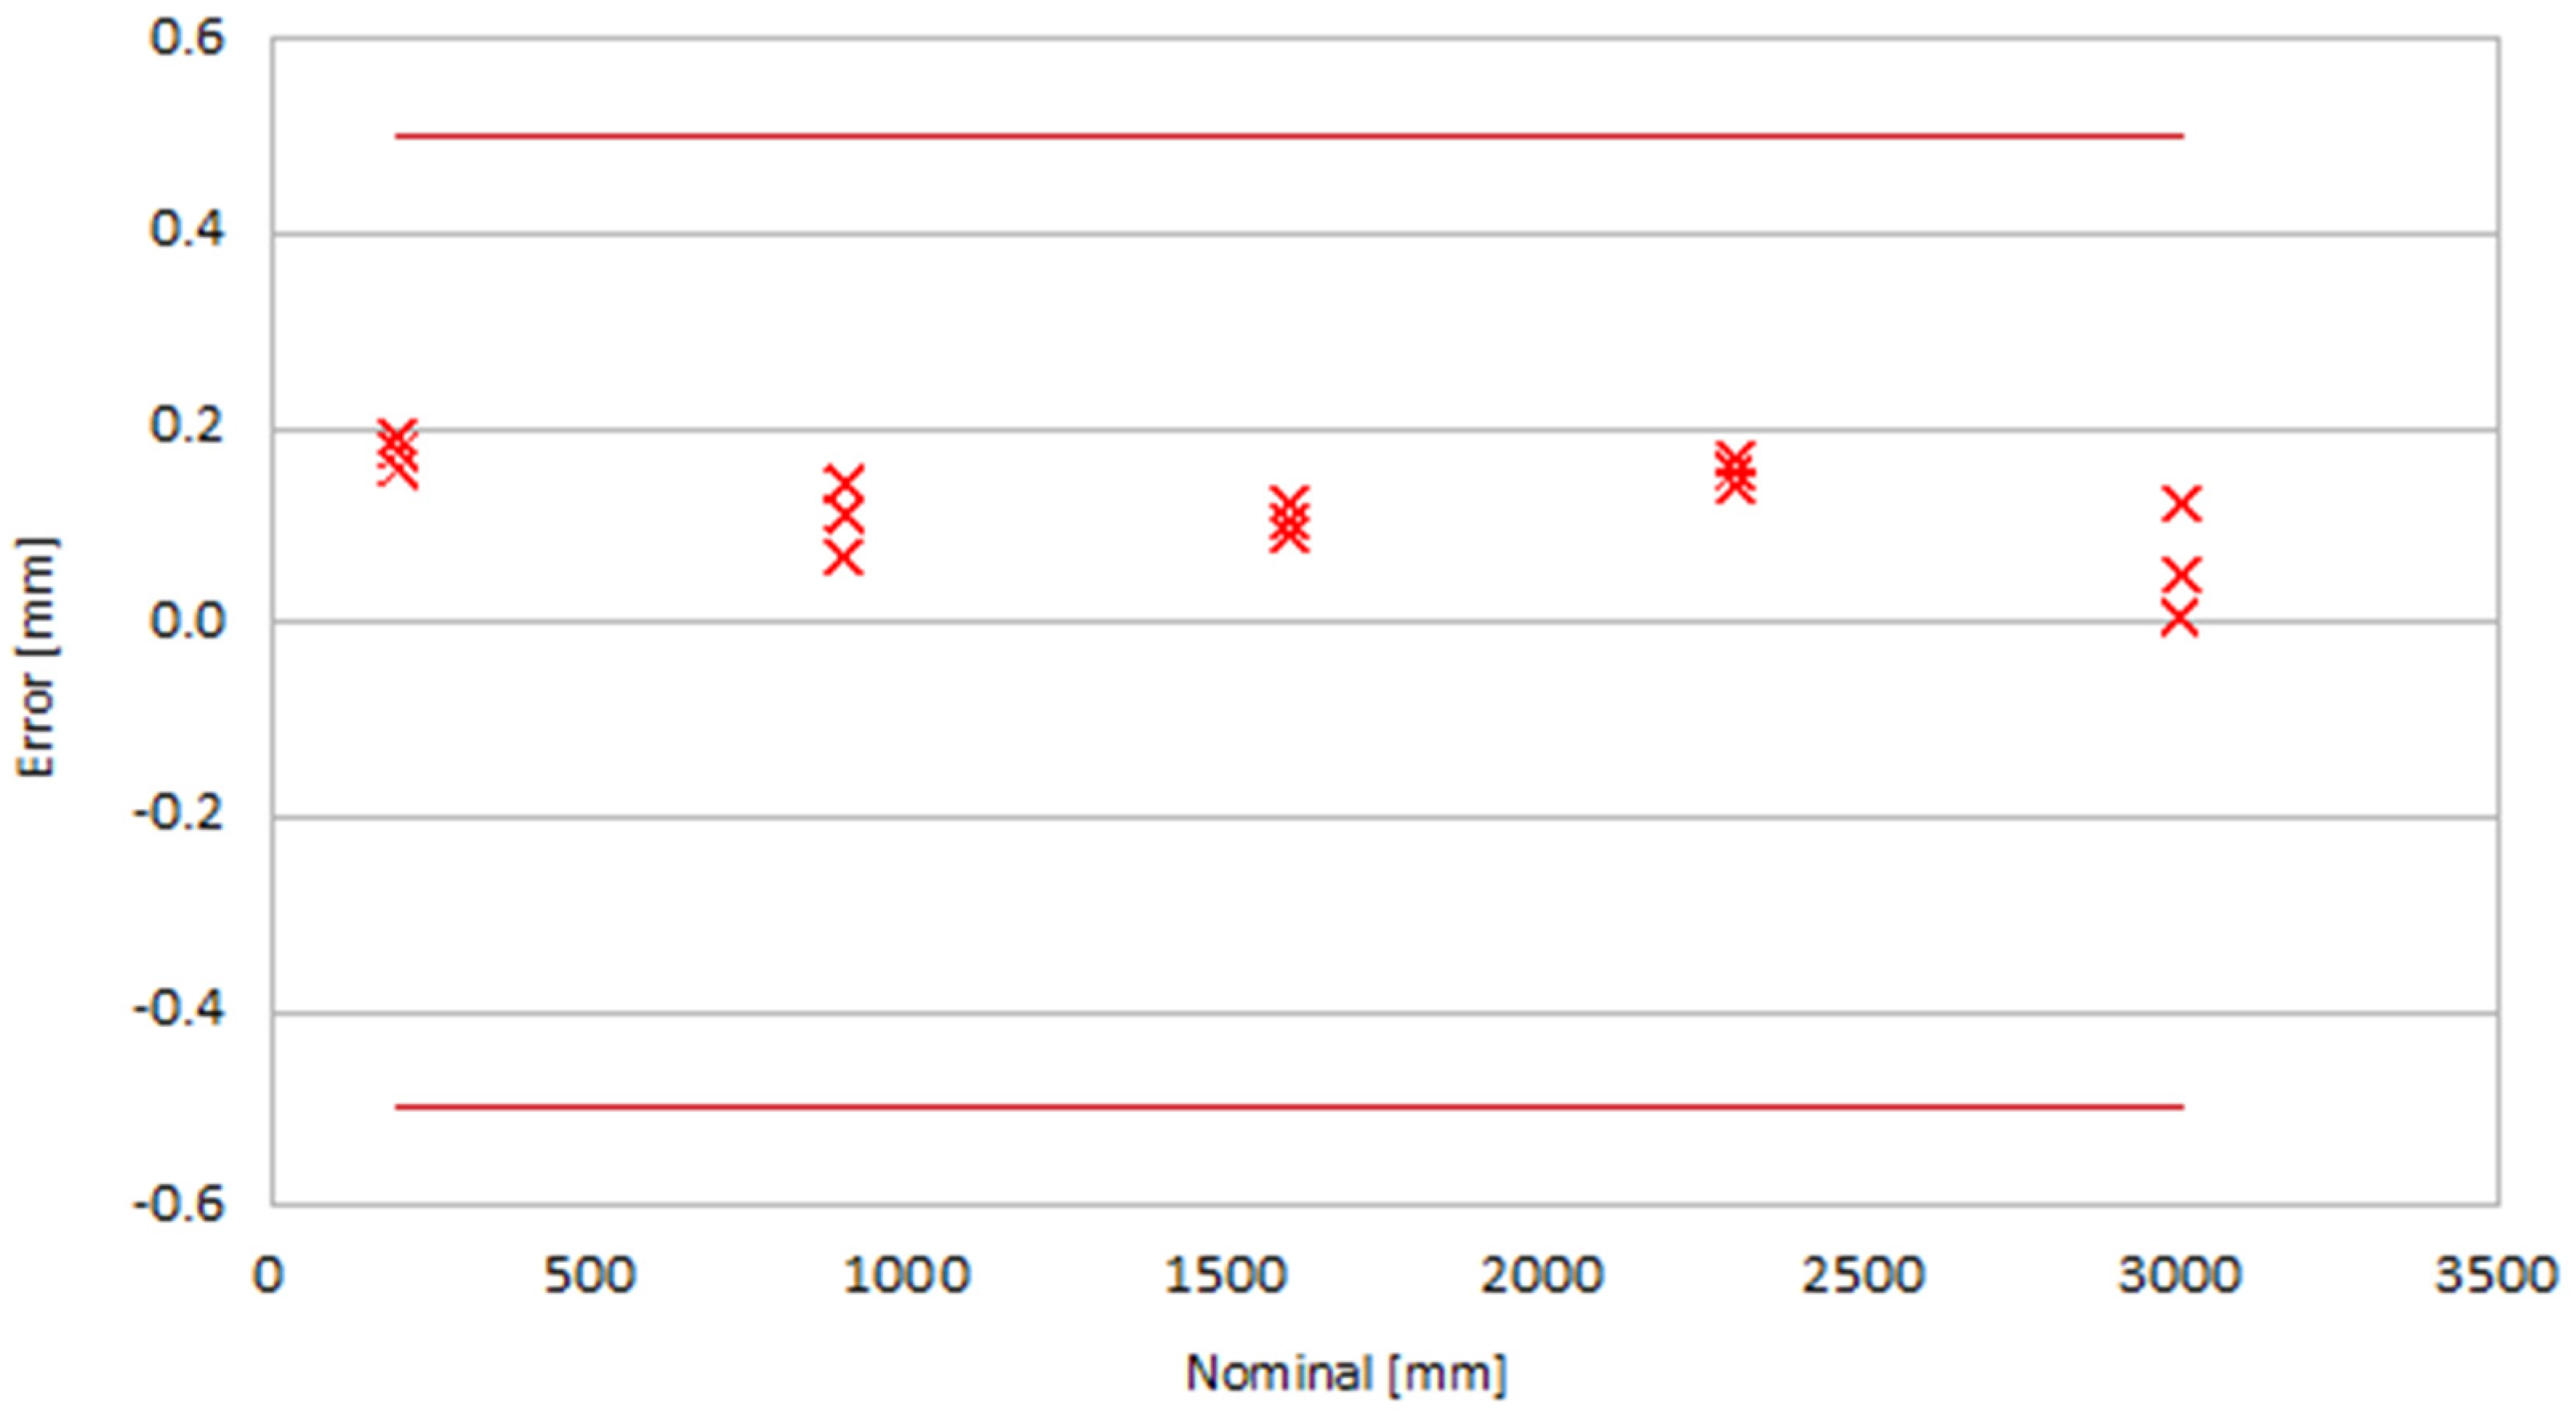
The minimal average error of 0.1 mm was obtained for the Z-axis for 1600 mm and 3000 mm lengths. The range of the results remained at 0.04 mm and 0.03 mm, respectively. For the other checked lengths, the average range was 0.07 mm. The characteristic of the Z-axis measurement errors is shown in Figure 8.
For the diagonal XZ1, the error characteristics oscillated between 0.1 mm and 0.2 mm. The minimal average error of 0.06 mm was obtained at the end of the standard. The range of results remained at the level of 0.03 mm. For the lengths 900 mm and 3000 mm, the value increased to 0.08 mm and 0.1 mm, respectively. The obtained characteristic (Figure 9) has the most stable form in relation to the other axes characteristics.
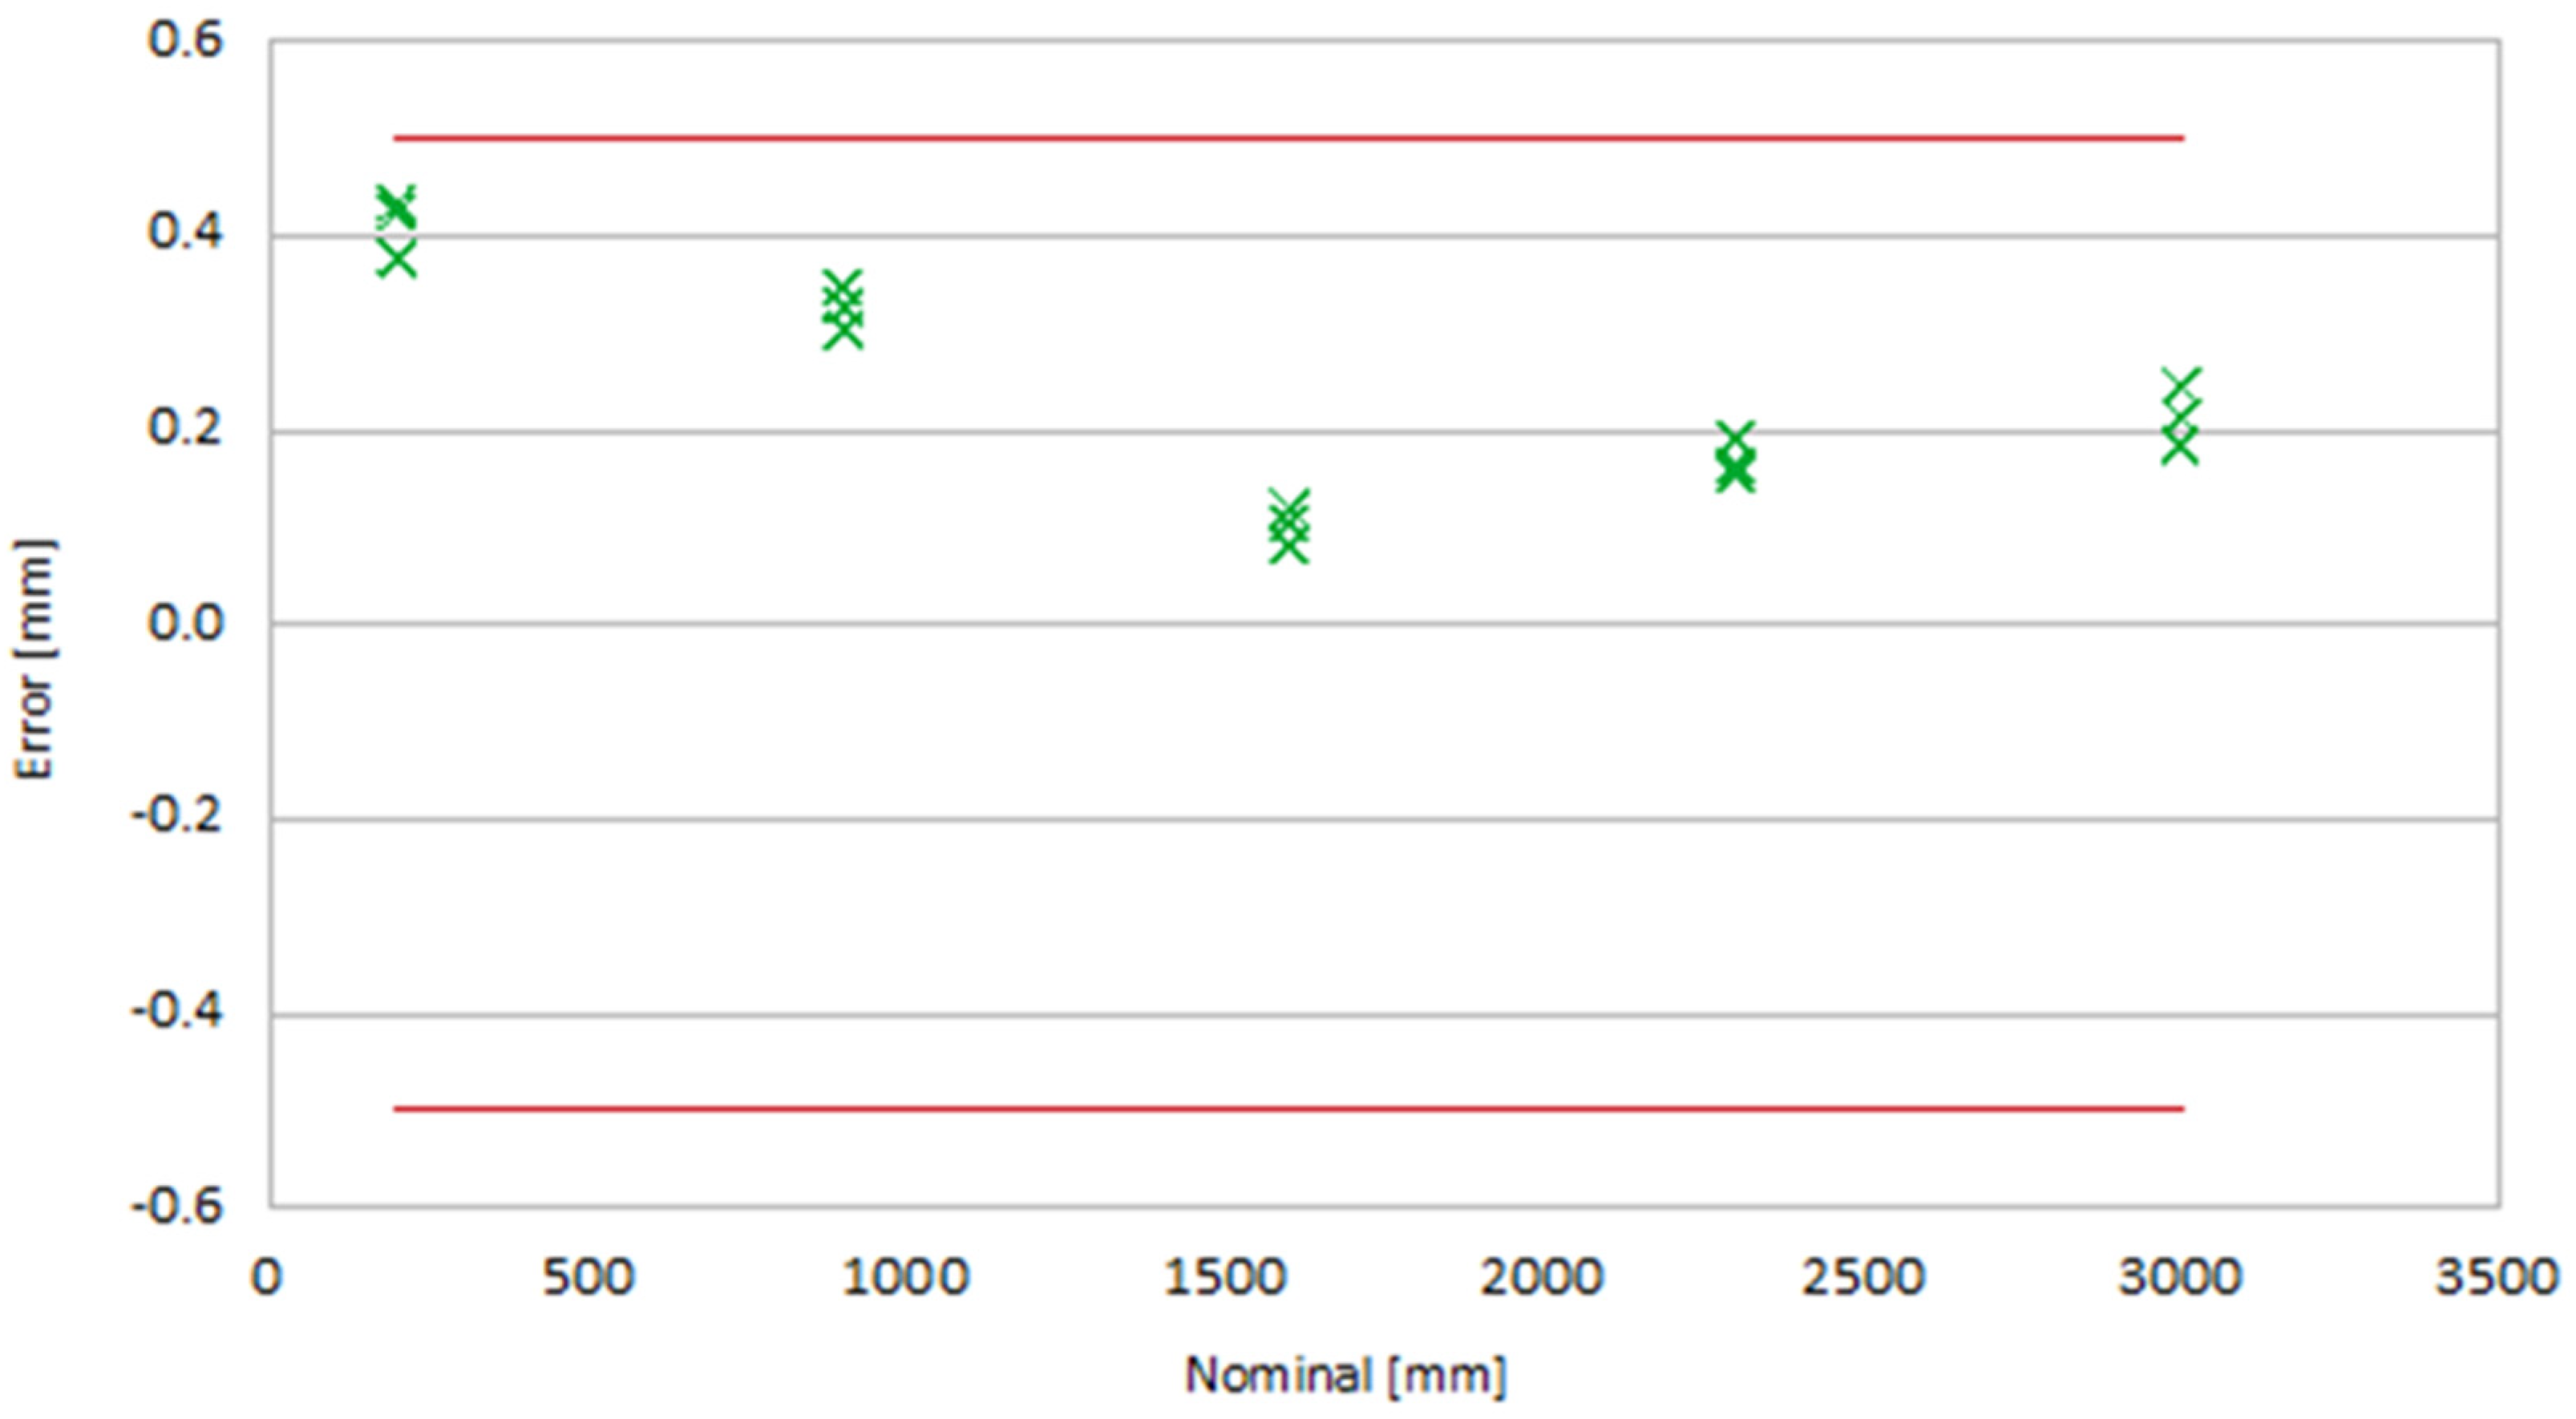
The results for the XZ2 diagonal showed the most significant error values for the 200 mm nominal, averaging 0.4 mm. The error decreased to 0.1 mm as the center of the measurement space neared. Further into the measuring range, the average error remained at 0.2 mm. The range of values was between 0.04 mm and 0.06 mm. The measurement error characteristic of the XZ2 axis is shown in Figure 10.
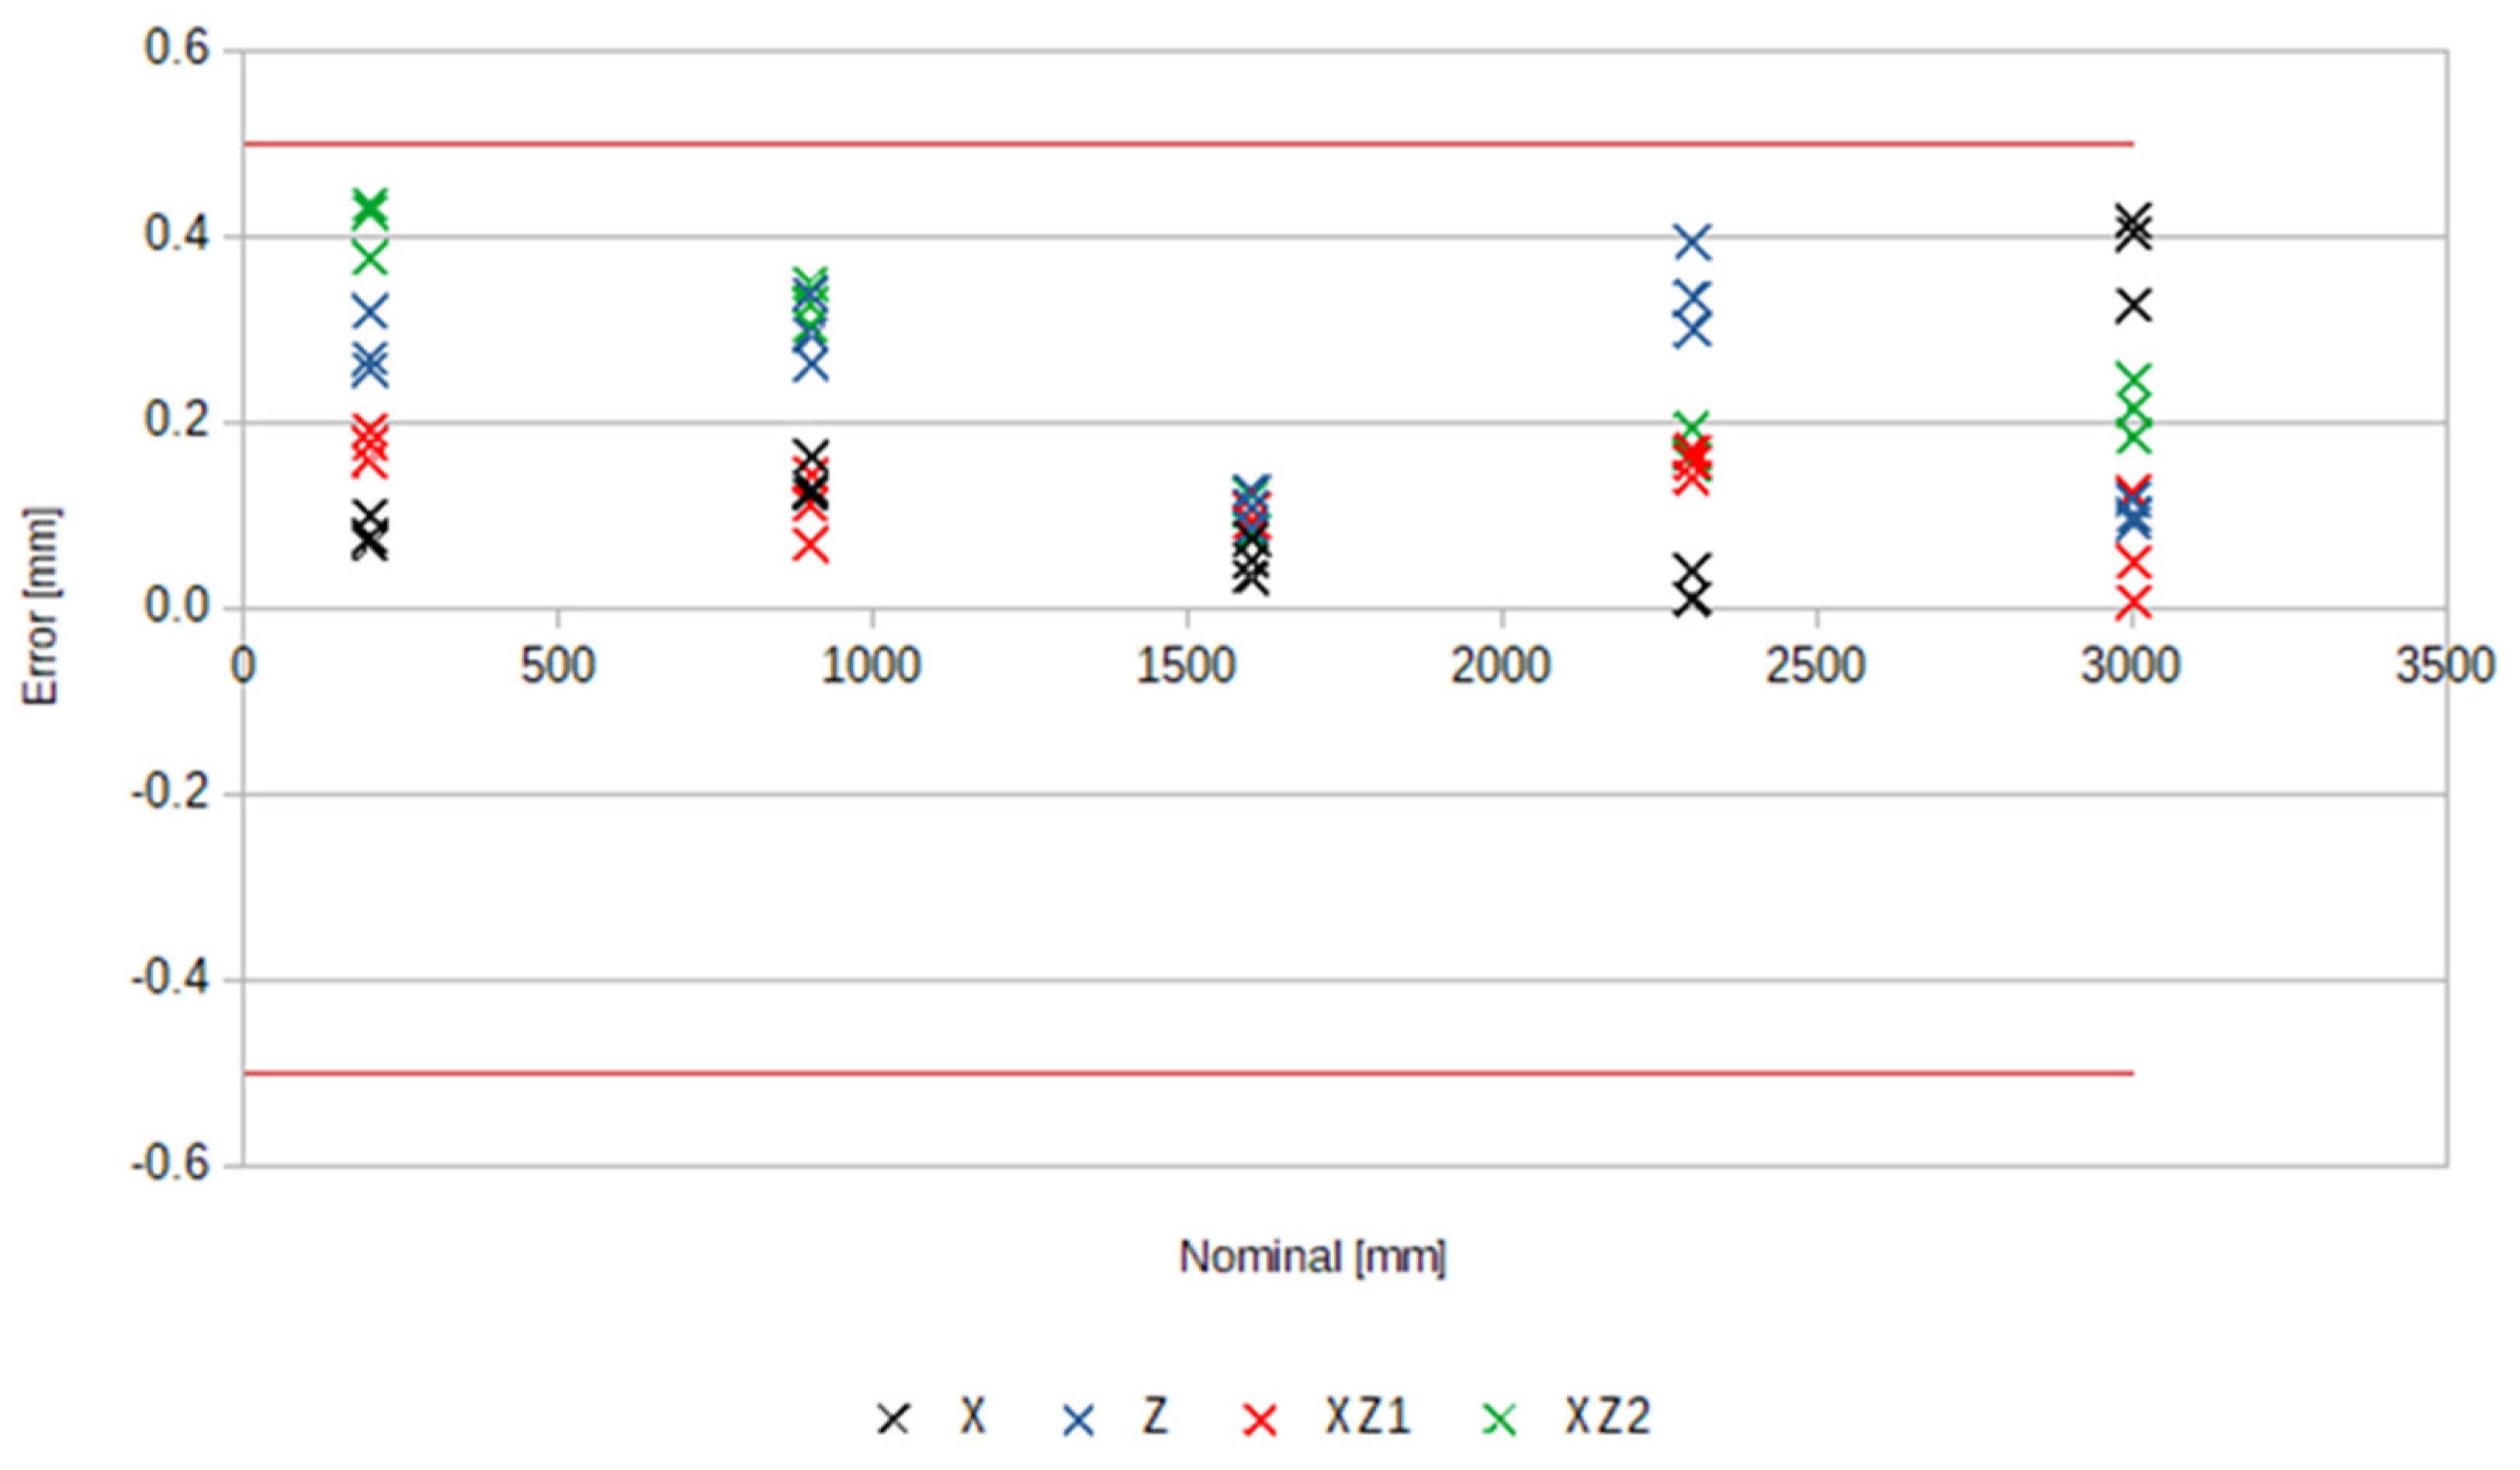
The system obtained the best accuracy in the center of the working space, where the error reached an average value of 0.1 mm. The measurement error increased near the field of view edge. The error results at the edge of the verified range are almost four times higher than those in the middle. For the XZ1 and XZ2 axes, which are diagonals of the analyzed space, the obtained error values composite the vertical and horizontal axis errors. Figure 11 shows the combined characteristics of the indication errors. The average range of results for all the axes remained at 0.05 mm.
4. Conclusions
The results obtained within the presented research indicate that Laser Galvanometer Scanning Systems are capable of performing simple coordinate measurements referenced to a CAD model. After reviewing the standards available in the laboratory, two of them were selected and compared: a calibration board as commonly used for adjusting this type of system and a ball-bar type standard as a new approach to system accuracy. No significant difference was observed between the acquisition of the 2D markers and the ball-bar reference spheres. Following the recommendations of ISO 10360, several measurements were carried out to determine the accuracy and repeatability of the laser projection system. An accuracy of MPE(E0) = ±0.5 mm was estimated. The maximum result range of Rmax = 0.117 mm was observed for a length of 2999.249 mm of the XZ1 axis.
On the basis of the conducted research, it was concluded that the methods of testing the accuracy of coordinate measuring systems coming from the field of coordinate metrology could be applied to assess the accuracy of galvanometric laser scanner-based systems for laser projection of the virtual templates.
The accuracy of the tested system was estimated only at a certain distance (4.6 m) from the system. To comprehensively assess the accuracy of the entire workspace, further studies shall be carried out. The development of a dedicated reference sphere-based standard is under discussion.
The proposed method can be used as an interim accuracy check. However, in the course of further research, there is still a need to develop a method to estimate the measurement uncertainty. Estimating the measurement uncertainty using laser projectors can be complex and challenging because performing measurements differ from coordinating measuring systems techniques.
Furthermore, note that the tested device cannot perform measurements on the principles of coordinate measuring systems. The results obtained strongly depend on the selection of alignment points between the CAD model and the physical object. Moreover, the tested system only compares the detected features to the CAD model and cannot measure geometric deviations as understood by ISO 1101 [15].
Author Contributions
Conceptualization and measurements, K.K. and W.H.; methodology, K.K. and M.J.; validation, K.K. and M.J.; formal analysis, M.K.; investigation, K.K.; resources, M.J. and K.K.; data curation, K.K.; writing—original draft preparation, K.K. and M.J.; writing—review and editing, W.H. and M.K.; visualization, M.J.; supervision, J.A.S. All authors have read and agreed to the published version of the manuscript.
Funding
This research received no external funding.
Institutional Review Board Statement
Not applicable.
Informed Consent Statement
Not applicable.
Data Availability Statement
The data presented in this study are available on request from the corresponding author.
Conflicts of Interest
The authors declare no conflict of interest.
References
- Urbančič, T.; Roškar, Ž.; Fras, M.K.; Grigillo, D. New Target for Accurate Terrestrial Laser Scanning and Unmanned Aerial Vehicle Point Cloud Registration. Sensors 2019, 19, 3179. [Google Scholar] [CrossRef] [PubMed] [Green Version]
- Huang, J.; Wang, Z.; Gao, J.; Huang, Y.; Towers, D.P. High-Precision Registration of Point Clouds Based on Sphere Feature Constraints. Sensors 2017, 17, 72. [Google Scholar] [CrossRef] [PubMed] [Green Version]
- Rashidi, M.; Mohammadi, M.; Kivi, S.S.; Abdolvand, M.M.; Truong-Hong, L.; Samali, B. A Decade of Modern Bridge Monitoring Using Terrestrial Laser Scanning: Review and Future Directions. Remote Sens. 2020, 12, 3796. [Google Scholar] [CrossRef]
- Marshall, G.; Stutz, G. Handbook of Optical and Laser Scanning, 2nd ed.; CRC Press Taylor & Francis Group: Boca Raton, FL, USA, 2012. [Google Scholar]
- Rieckmann, A. Laser projectors benefit turbine blade manufacture. Reinf. Plast. 2011, 55, 34–37. [Google Scholar] [CrossRef]
- Stafne, M.A.; Mitchell, L.D.; West, R.L. Positional calibration of galvanometric scanners used in laser Doppler vibrometers. Measurement 2000, 28, 47–59. [Google Scholar] [CrossRef]
- Li, X.; Liu, B.; Mei, X.; Wang, W.; Wang, X.; Li, X. Development of an In-Situ Laser Machining System Using a Three-Dimensional Galvanometer Scanner. Engineering 2020, 6, 68–76. [Google Scholar] [CrossRef]
- Delgado, M.; Lasagni, A. Reducing field distortion for galvanometer scanning system using a vision system. Opt. Lasers Eng. 2016, 86, 106–114. [Google Scholar] [CrossRef]
- Jigang, H.; Qin, Q.; Jie, W.; Hui, F. Two Dimensional Laser Galvanometer Scanning Technology for Additive Manufacturing. Int. J. Mater. Mech. Manuf. 2018, 6, 332–336. [Google Scholar]
- Yeung, H.; Lane, B.M.; Donmez, M.A.; Moylan, S. In-situ calibration of laser/galvo scanning system using dimensional reference artefacts. CIRP Ann. 2020, 69, 441–444. [Google Scholar] [CrossRef] [PubMed]
- ISO 10360-2:2009; International Organization for Standardization (ISO): Geneva, Switzerland, 2009.
- Sładek, J. Coordinate Metrology. Accuracy of Systems and Measurements; Springer Tracts in Mechanical Engineering: Berlin/Heidelberg, Germany, 2016. [Google Scholar]
- Technical Specification Sheet for the Tracer Laser Projector. Available online: https://knowledge.faro.com/Hardware/Laser_Projector/Tracer/Technical_Specification_Sheet_for_the_Tracer_Laser_Projector (accessed on 17 August 2021).
- Carmignato, S.; De Chiffre, L.; Bosse, H.; Leach, R.K.; Balsamo, A.; Estler, W.T. Dimensional artefacts to achieve metrological traceability in advanced manufacturing. CIRP Ann. 2020, 69, 693–716. [Google Scholar] [CrossRef]
- ISO 1101:2017; International Organization for Standardization (ISO): Geneva, Switzerland, 2017.
Figure 1.
Principle of operation of the laser scanning system.

Figure 2.
The tested system: (a) galvanometer Scanning System and (b) experimental setup.

Figure 3.
Compared standards: (a) calibration board and (b) ball-bar standard.

Figure 4.
Ball-bar positions in the projector workspace: 1—positions of the standard; 2—position of the device.
Figure 4.
Ball-bar positions in the projector workspace: 1—positions of the standard; 2—position of the device.

Figure 5.
System deviations: (a) software output and (b) geometrical interpretation of the result.

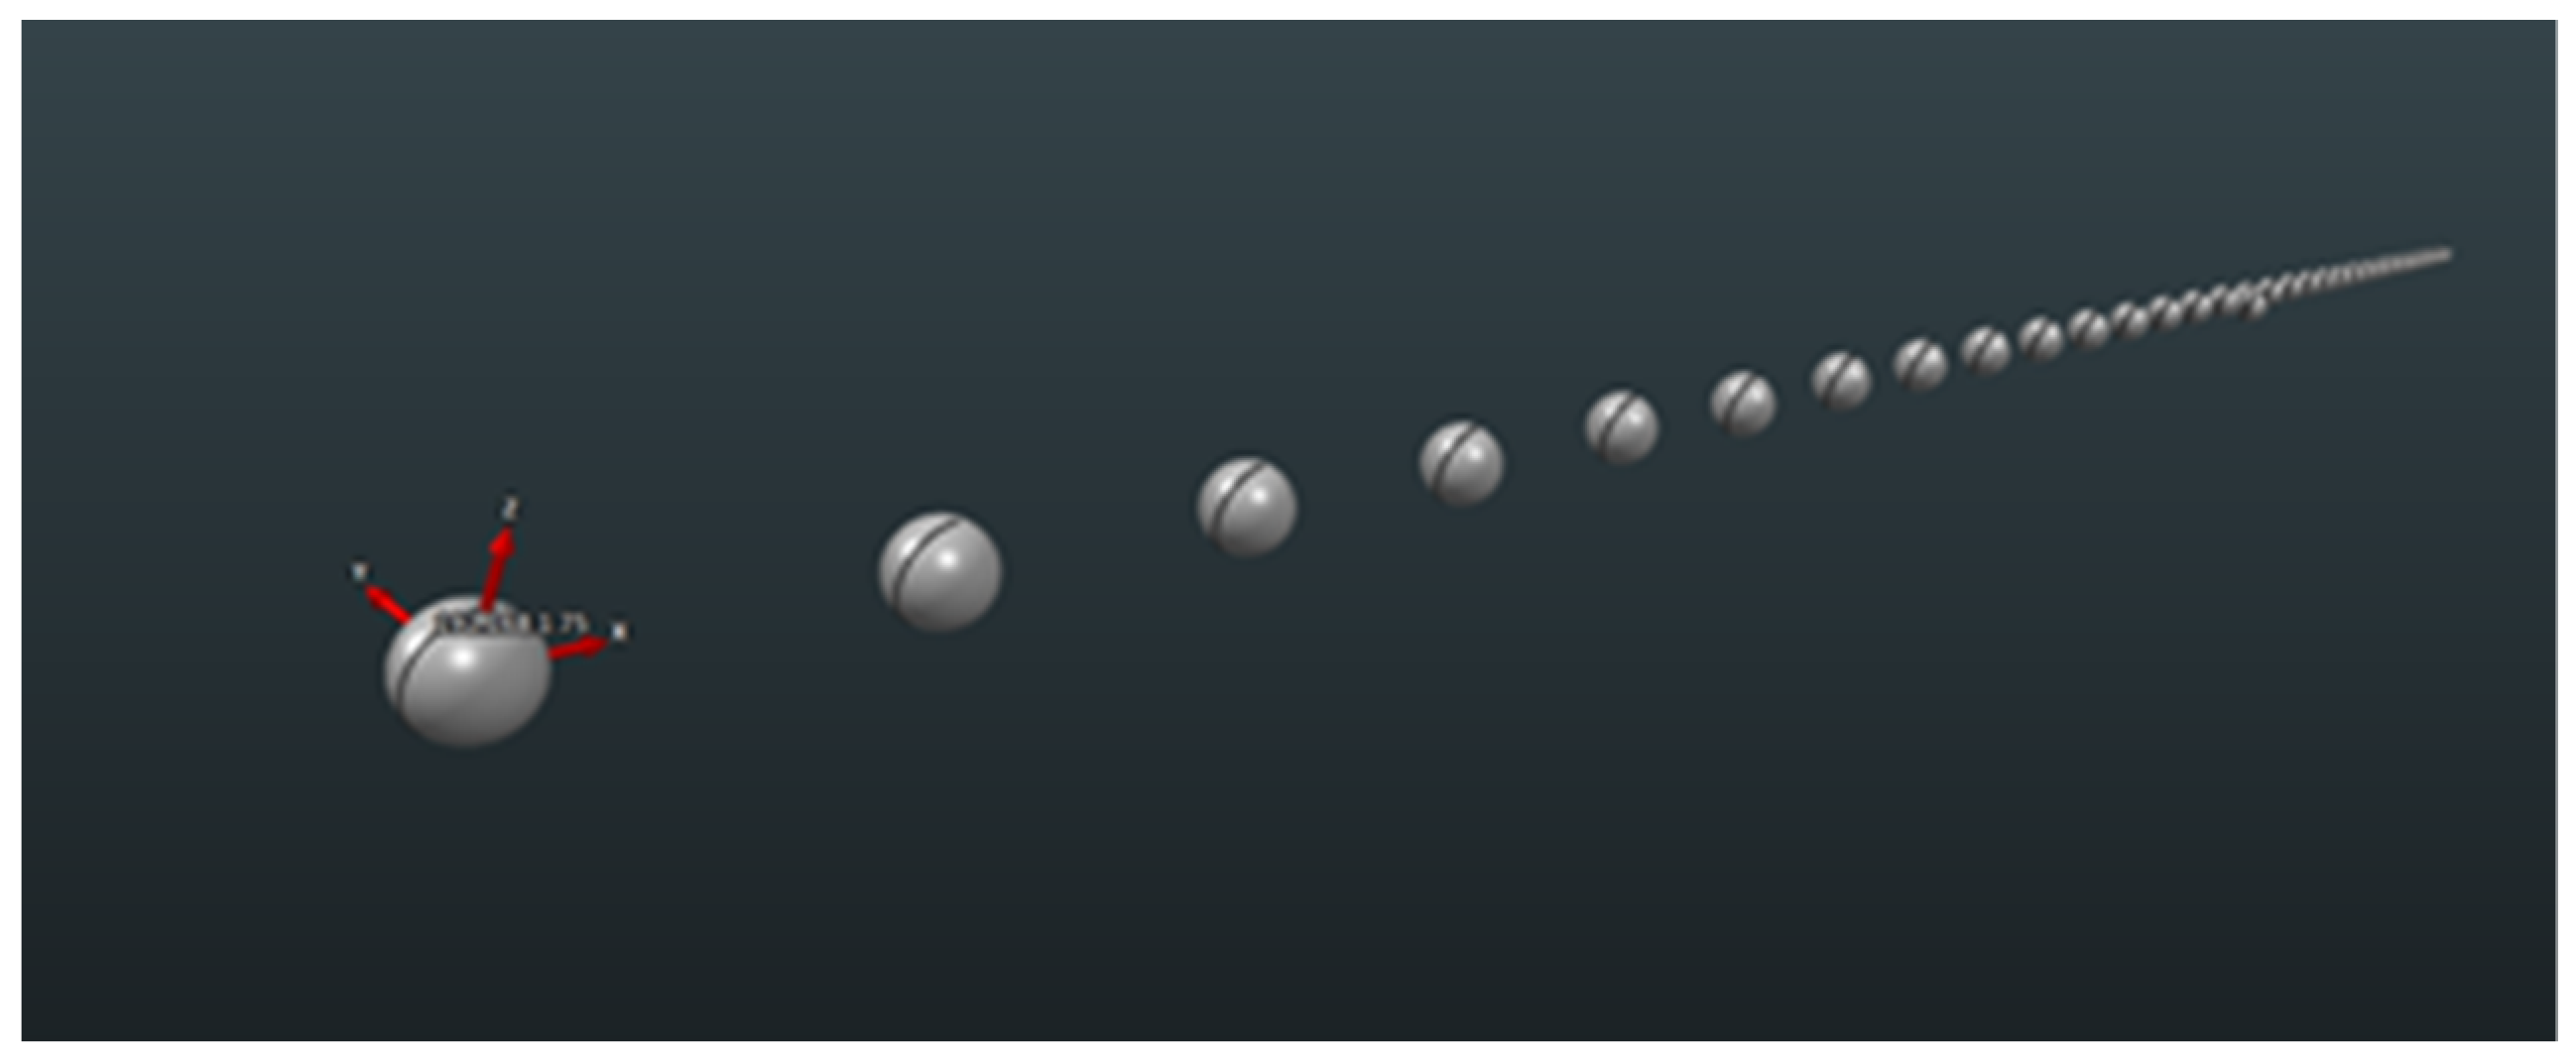
Figure 6.
CAD model of ball-bar standard.

Figure 7.
X−axis measurement error characteristic.

Figure 8.
Z−axis measurement error characteristic.

Figure 9.
XZ1−axis measurement error characteristic.

Figure 10.
XZ2−axis measurement error characteristic.

Figure 11.
Error characteristic for all the tested axes combined.


Table 1.
Technical specification of the tested device [13].
Table 1.
Technical specification of the tested device [13].
| Parameter | Value |
|---|---|
| Projection Distance Range | 1.8–15.25 m |
| Projection Angular Range | 60° Az × 60° El |
| Focused Line Width | 0.5 mm |
| Positional Accuracy | ±0.25 mm at 4.6 m |
| Operating Temperature Range | 10–35 °C |
Table 2.
Measurement errors of the X-axis (horizontal direction).
| Nominal [mm] | Error [mm] | R [mm] | MPE [mm] |
|---|---|---|---|
| 199.833 | 0.076 | 0.029 | 0.500 |
| 0.070 | |||
| 0.099 | |||
| 899.812 | 0.162 | 0.040 | |
| 0.122 | |||
| 0.127 | |||
| 1599.690 | 0.033 | 0.040 | |
| 0.050 | |||
| 0.073 | |||
| 2299.351 | 0.040 | 0.030 | |
| 0.010 | |||
| 0.009 | |||
| 2999.249 | 0.325 | 0.091 | |
| 0.402 | |||
| 0.416 |
Table 3.
Measurement errors of the Z-axis (vertical direction).
| Nominal [mm] | Error [mm] | R [mm] | MPE [mm] |
|---|---|---|---|
| 199.833 | 0.256 | 0.064 | 0.500 |
| 0.268 | |||
| 0.319 | |||
| 899.812 | 0.262 | 0.075 | |
| 0.294 | |||
| 0.337 | |||
| 1599.690 | 0.125 | 0.041 | |
| 0.085 | |||
| 0.109 | |||
| 2299.351 | 0.299 | 0.094 | |
| 0.393 | |||
| 0.334 | |||
| 2999.249 | 0.100 | 0.025 | |
| 0.116 | |||
| 0.091 |
Table 4.
Measurement errors of the XZ1 axis.
| Nominal [mm] | Error [mm] | R [mm] | MPE [mm] |
|---|---|---|---|
| 199.833 | 0.158 | 0.033 | 0.500 |
| 0.177 | |||
| 0.191 | |||
| 899.812 | 0.068 | 0.075 | |
| 0.143 | |||
| 0.112 | |||
| 1599.690 | 0.124 | 0.032 | |
| 0.106 | |||
| 0.092 | |||
| 2299.351 | 0.168 | 0.028 | |
| 0.140 | |||
| 0.156 | |||
| 2999.249 | 0.050 | 0.117 | |
| 0.006 | |||
| 0.123 |
Table 5.
Measurement errors of the XZ2 axis.
| Nominal [mm] | Error [mm] | R [mm] | MPE [mm] |
|---|---|---|---|
| 199.833 | 0.424 | 0.056 | 0.500 |
| 0.433 | |||
| 0.377 | |||
| 899.812 | 0.303 | 0.045 | |
| 0.327 | |||
| 0.348 | |||
| 1599.690 | 0.082 | 0.038 | |
| 0.104 | |||
| 0.120 | |||
| 2299.351 | 0.192 | 0.037 | |
| 0.165 | |||
| 0.154 | |||
| 2999.249 | 0.245 | 0.061 | |
| 0.213 | |||
| 0.184 |
Publisher’s Note: MDPI stays neutral with regard to jurisdictional claims in published maps and institutional affiliations. |
© 2021 by the authors. Licensee MDPI, Basel, Switzerland. This article is an open access article distributed under the terms and conditions of the Creative Commons Attribution (CC BY) license (https://creativecommons.org/licenses/by/4.0/).
Share and Cite
MDPI and ACS Style
Kobiela, K.; Jedynak, M.; Harmatys, W.; Krawczyk, M.; Sładek, J.A. Assessment of Laser Galvanometer Scanning System Accuracy Using Ball-Bar Standard. Appl. Sci. 2021, 11, 8929. https://0-doi-org.brum.beds.ac.uk/10.3390/app11198929
AMA Style
Kobiela K, Jedynak M, Harmatys W, Krawczyk M, Sładek JA. Assessment of Laser Galvanometer Scanning System Accuracy Using Ball-Bar Standard. Applied Sciences. 2021; 11(19):8929. https://0-doi-org.brum.beds.ac.uk/10.3390/app11198929
Chicago/Turabian StyleKobiela, Konrad, Michał Jedynak, Wiktor Harmatys, Marcin Krawczyk, and Jerzy A. Sładek. 2021. "Assessment of Laser Galvanometer Scanning System Accuracy Using Ball-Bar Standard" Applied Sciences 11, no. 19: 8929. https://0-doi-org.brum.beds.ac.uk/10.3390/app11198929
Note that from the first issue of 2016, this journal uses article numbers instead of page numbers. See further details here.