
UAV-Based Evaluation of Rockfall Hazard in the Cultural Heritage Area of Kipinas Monastery, Greece


1
Laboratory of Engineering Geology & Hydrogeology, Aristotle University of Thessaloniki (AUTH), 54124 Thessaloniki, Greece
2
Geotechnical Division, School of Civil Engineering, National Technical University of Athens (NTUA), Zographou, 15780 Athens, Greece
3
Department of Civil Engineering, Democritus University of Thrace (DUTH), 67100 Xanthi, Greece
*
Author to whom correspondence should be addressed.
Appl. Sci. 2021, 11(19), 8946; https://0-doi-org.brum.beds.ac.uk/10.3390/app11198946
Submission received: 26 August 2021
/
Revised: 19 September 2021
/
Accepted: 22 September 2021
/
Published: 25 September 2021
(This article belongs to the Special Issue 3D Jointed Rock Mass Structural Analysis and Evaluation of Rockfall Potential)
Abstract
:Rockfall events consist one of the most hazardous geological phenomena in mountainous landscapes, with the potential to turn catastrophic if they occur near an anthropogenic environment. Rockfall hazard and risk assessments are recognized as some of the most challenging surveys among the geoengineering society, due to the urgent need for accurate foresight of likely rockfall areas, together with their magnitude and impact. In recent decades, with the introduction of remote sensing technologies, such as Unmanned Aerial Vehicles, the construction of qualitative and quantitative analyses for rockfall events became more precise. This study primarily aims to take advantage of the UAV’s capabilities, in order to produce a detailed hazard and risk assessment via the proposition of a new semi-quantitative rating system. The area of application is located in the cultural heritage area of Kipinas Monastery in Epirus, Greece, which is characterized by the absence of pre-existing data regarding previous rockfall events. As an outcome, it was shown that the suggested methodology, with the combination of innovative remote sensing technologies with traditional engineering geological field surveys, can lead to the extraction of all the necessary quantitative data input for the proposed rating system for any natural slope.
1. Introduction
Rockfalls, in general, are classified as a type of landslide that consists of a detachment of a rock block (or several individual blocks) from a vertical or even sub-vertical cliff, followed by rapid downward motion characterized by four main phases: free-falling, bouncing, rolling and sliding [1]. Although rockfalls have a much lower level of economic risk than large-scale landslides, the rapid velocities associated with rockfall events result in a similar number of fatalities (in the same order of magnitude) as ones caused by all other landslide types [2]. Therefore, rockfall events consist one of the most hazardous geological phenomena in mountainous landscapes, with the potential to turn catastrophic if they occur near an anthropogenic environment. Thus, the accurate foresight of likely to rockfall areas and also their magnitude and impact is of high significance. In general, the above terms can be expressed with the parameters of susceptibility, hazard and risk, respectively.
Firstly, susceptibility is described as the likelihood of an event to occur in a specific area based on the local terrain conditions [3]. The term susceptibility represents the natural tendency of an area to be affected by a potential future hazardous event, and results in a spatial-based estimation of where rockfalls are more likely to occur [4,5,6,7].
In rockfall terminology, rockfall hazard refers to the probability of occurrence of a hazardous event with a specific magnitude or severity within a given area during a predefined time period [1,8,9]. Hence, the concepts of magnitude (volume of the blocks), severity (amount of developed energy), location (spatial probability of occurrence) and frequency (temporal recurrence of the event) are included.
At last, rockfall risk is a more comprehensive term which involves all of the above fused with the human factor. It can be defined as a measure of the probability and severity of an adverse effect to health, property or the environment [10,11,12]. In other words, risk is given by three basic components: the hazard, the exposure of the elements at risk and their vulnerability. These terms are characterized by both spatial and non-spatial attributes.
As rockfalls represent a special type of landslide hazard due to their rapid movements with various trajectories, the accurate prediction of their potential hazard constitutes a very difficult task [13,14]. Thus, rockfall hazard and risk analyses are inherently some of the most elaborate and challenging assessments in geoengineering. Their complexity as a natural phenomenon has resulted in the proposition of several different methodologies regarding stability assessments for rock cliffs [15]. These approaches rely mainly on (i) the accurate precognition of the failure mechanism and (ii) on the prediction of potential displacements of rock masses as a whole [16,17,18], or, in some cases, the displacement of individual prone rock blocks [19]. Hence, the proposed methodologies for rockfall hazard assessments vary from the probabilistic modeling of potentially unstable rock block trajectories [20,21,22,23], to qualitative approaches via the implementation of a rating system [24]. A common area between all of the proposed methodologies of rockfall hazard assessments, regardless of their approach to the subject (i.e., quantitative or qualitative), is their substantial need for data concerning the critical slope profiles, the material properties, the discontinuity surfaces that can potentially contribute to slope instabilities and the size of possibly unstable rock blocks [25]. In the past decades, due to the confined available means, all of these important data for rockfall hazard and risk assessments were extracted completely by traditional engineering geological field obtained measurements and geoengineering assumptions. Therefore, the difficulties and the complexity of these assessments derive mainly from the lack of accurate data (spatial- and temporal-based), the site-specific rockfall properties, the limited capabilities in the quantification and the visual interpretation of rockfall spatial distribution and the heterogeneity of vulnerability of various elements at risk [26,27,28,29].
Most of the above deterring factors have been eased in recent decades and, in many cases, surpassed by the introduction of innovative remote sensing technologies as a common practice in hazard and risk assessments. Two of the most well-known technologies, which can be classified based on their sensors, are the active, such as Terrestrial Laser Scanners (TLS), and the passive, such as photogrammetric surveys via Remotely Piloted Aircraft Systems (RPAS), also known as Unmanned Aerial Vehicles (UAV). The latter uses flexible multicopters equipped with digital cameras and other various sensors [30,31,32,33] and is considered a flexible and powerful tool with many applications in geosciences, and especially in rockfall investigations [34,35,36,37,38,39,40,41,42,43,44,45,46,47,48,49,50]. This occurred mainly due its low cost and ease of transportability in harsh environments, in conjunction of course with the reduction in the human risk factor during rockfall-related surveys. Specifically, the utilization of the Structure from Motion (SfM) methodology enabled the production of ultra-high-resolution orthomosaic and Digital Terrain Models (DTMs) of hazardous regions by intersecting the matched features between the overlapping offset images [51] and interpreting them as detailed 3D point clouds. This dense 3D visual interpretation allows the main discontinuities to be identified and mapped with either a manual or a semi-automatic approach [52,53,54,55,56,57,58,59,60,61,62], and consequently volume displacements to be calculated in order to predict future movements, in areas prone to rockfall events, via computer-based methodologies. Hence, the compound of these innovative remote sensing technologies with traditional engineering geological field surveys can lead to an accurate, precise and time-effective local scale modeling of rockfall events.
The principal aim of this research is to perform an in-depth qualitative rockfall hazard analysis and a preliminary approach of risk analysis, based on a UAV-derived dataset of the area. In order to achieve this goal, a new rockfall hazard and risk rating system is presented, by reviewing and modifying the existing ones from the literature, based on morphological and structural information of the rock mass derived from the analysis of the 3D point cloud. The factors of vulnerability and commercial impact were also taken into account for the risk estimation.
In order to achieve these goals, this study focuses on the cultural heritage area of Kipinas Monastery in Epirus, Greece, situated in northern Tzoumerka, south of Kalarites village. The morphology of the site consists of high (≥60 m), very steep slopes (≥80°). The topography is characterized as mountainous in general (altitude from 580 m up to 730 m). The geological setting, where Kipinas Monastery is located, consists of only one formation, Jurassic limestones [63]. These grey limestones range from thick to medium bedded along the cliff but in some distinctive locations, alongside the bedding, some zones of the formation can be identified more as thin bedded up to foliated due to increased regional tectonic strain. Additionally, an important aspect of this formation is the influential karst development in it. As the monastery is built on this limestone, within the walls of it a large entrance to a karst cave (cupola) can be identified. In this unwelcoming location, Kipinas Monastery was literally chiseled and built into the surrounding rock mass around 1212 A.D., constituting one of Greece’s most beautiful and impressive churches. However, in this location, various rockfall events have occurred in past years, with fallen blocks identified near the tarmac of the road that leads to the monastery. In general, the impact of rockfall events on archaeological sites, historical monuments and generally on cultural heritage areas in the Greek territory is significant, since most of the landscapes are mountainous and the sites are usually found near steep rock slopes. Considering the significant tourist activity in such locations, the risk adds up to be significantly increased.
The principal reason leading to the implementation of a qualitative approach instead of a quantitative one, in this area, is the absence of pre-existing data, mainly temporal data related to rockfall events. Hence, the current research demonstrates a powerful approach to conduct a detailed hazard and risk assessment, by using data that were obtained incredibly fast via the UAV, and with the least possible prior information about former rockfall-related events in an area of interest.
2. Methods and Data
The methodology that was followed in this study led to the extraction of all the important quantitative data that could be used for rockfall hazard and risk assessment of any natural slope where negligible to no data from former rockfall-related events exist, via the implementation of a new rating system. A brief presentation of this study’s workflow is displayed in Figure 1.
2.1. Engineering Geological Field Survey
The first and most important method used was an in-depth engineering geological survey in the area of interest. The necessity of detailed and intense field work is derived from the urgent need to gain a primary understanding of the engineering geological model of the site. This enables the identification of failure modes and possible volumes and of their possible impact. With the engineering geological model established, the evaluation of all the computer-based measurements from the UAV-derived data can be achieved and potential errors can be revised. Furthermore, via the field survey, many important parameters for the hazard assessment, which could not be obtained remotely, were estimated.
From an engineering geological point of view, the limestone rock mass is moderately jointed, intersected by numerous major vertical fractures, which ultimately form the local face of the cliff. As mentioned before, the limestone is karstified and voids of large dimensions are formed, undermining the rock slope.
According to the findings of the engineering geological field survey, two (2) main orientations were detected for the slope’s face, due to its constant dip direction alternations, alongside the investigated area. Additionally, mainly three (3) major discontinuity sets and the bedding were identified, as presented in the Schmidt stereographic projection in Figure 2. The three major discontinuity sets are characterized as very steep in general (dip angle ≥80°) and two of them are transversal to the slope plane; thus, they form the rock slope face in most places. The bedding is presented as very mild up to horizontal in some (dip angle ≤15°) sub-regions of the slope.
It is worth noting that due to the difficult terrain of the study area and the large scale of the hazardous regions, it was decided that the capabilities of the UAV should be taken advantage of, thus the estimation of both the spacing and the distance of the discontinuities were taken from the 3D point cloud model in accordance of course with the field-based observations. The spacing of the discontinuities has relatively high values (more than 5 m only in specific locations), hence the sizes of the rock blocks vary from moderate to very large (1.5 m3 up to larger than 5.5 m3). In places, mainly due to stress relief, the size of the rock blocks is significantly smaller (0.5 m3 up to 2.5 m3), especially on the eastern part of the slope. The distance of the discontinuity planes varies significantly depending on the degree of fracturing of the rock. In general, it varies in a range between 2 m and 5 m, although locally the distance can be lower than 2 m.
The joint wall compressive strength is high (estimated up to 24 MPa), while the roughness of the discontinuity planes can be characterized as rough (JRC ranges between 8 and 10). In general, there is no infilling material in the discontinuities’ surfaces and the basic angle of friction along the discontinuities was adopted to be equal to φ = 30°.
Studying the engineering geological conditions that control the investigated slope, the face of the slope is generally characterized by relaxation of the rock mass, due to its high inclination. In conjunction with the spacing and the distance of discontinuities, moderate-to-large prone blocks are formatted. The main reason that these instabilities are not widespread across the slope is the “nature” of the rock mass itself and its superior mechanical properties, which restrain the prone-to-failure blocks, causing a temporal stability on the slope.
2.2. Development of the 3D Model
Considering the unique location of the monastery and the steep morphology of the rock slope, it was decided to conduct a photogrammetry survey via a manually flown UAV in September of 2020, in order to construct an accurate and detailed 3D model of the investigated site.
The camera view direction for the UAV-based photogrammetric survey was implemented as [64] proposed for steep slopes. In [64], it is suggested that for steep slopes (slope angle > 40°, usually rock slopes), an oblique or even horizontal camera view should be applied in order to achieve the optimal results during the acquisition of the imagery data.
The UAV gear, via which the imagery data were collected, was a DJI Phantom 4 Pro V2.0 equipped with a 1-inch 20-megapixel sensor and an FC6310 camera of 8.8 mm focal length and a manually adjustable aperture from F2.8 to F11. A total of 362 images were acquired, in order to cover the whole slope face. The derived images from the UAV were processed using the Pix4Dmapper software v. 4.5.6. (Pix4D, Lausanne, Switzerland), resulting in a dense 3D point cloud dataset consisting of about 104 million points with a ground resolution of 1.27 cm/pixel and a reprojection error of 0.157 pixels. Further processing of the data enabled the construction of a detailed DEM (Digital Elevation Model) with the same pixel dimensions as the point cloud. The generated point cloud was georeferenced using the UAV sensor GPS data and a set of 5 artificial GCP (Ground Control Points) according to the methodology proposed by [41,65]. Considering the steep geometry of the slope and the relevant hazard to access higher parts, the GCP were placed in accessible lower parts across the road that leads to the monastery in some distinctive areas, as shown in Figure 3.
Following the extraction, the point cloud was processed using the CloudCompareTM software v.2.11.1 (Anoia). In order to proceed to the structural analysis, the whole 3D model was trimmed of vegetation, constructions and “noise” in general. This prevented their presence in the final point cloud from affecting the correct recognition of discontinuities.
Then, the point cloud was segmented into four (4) different sub-regions depending on two (2) main criteria. The sub-regions were divided in order for each to preserve a consistent dip direction at the face of the slope and their downstream area to sustain a similar impact level, in the potential event of rockfall. This segmentation of the 3D point cloud into the 4 sub-regions is shown in Figure 4. The main characteristics of each area that the initial point cloud was segmented into are listed in Table 1.
2.3. Structural Analysis
For each sub-region of the point cloud, a supervised automated analysis was performed with the open-source DSE (Discontinuity Set Extractor) software (developed by [66]). This approach, proposed by [66], calculates the normal vector for each point and its “knn” closest neighbor points. The visual representation of this procedure is via their corresponding poles in a stereographic projection. Then, statistical analysis was carried out for these poles, providing the stereogram and enabling the extraction of the principal discontinuity sets.
Specifically, the PCA (Principal Component Analysis) algorithm was used to calculate these normal vectors and a tolerance (n) test was performed in order to define if each set of points could be considered as a candidate of a planar area, or as non-planar and be discarded. Afterwards, in order to estimate the principal orientation, the Kernel Density Estimation [67] was used. The density function was estimated automatically, and with a manual identification of the peaks of the most represented orientations, the number and the orientation of principal planes was determined. Consequently, a discontinuity set was assigned to each input point from point cloud, enabling that way the isolation of all the co-belonging points to a specific set. Then, a spatial cluster analysis was performed with the DBSCAN (Density-Based Spatial Clustering of Applications with Noise) algorithm. This resulted in clusters of points, belonging to the same set, forming plane continuous surfaces which, hence, could be considered as planes, so that the automatic calculation of planes’ equations (spacing [66] and persistence [68]) was enabled.
In this particular analysis, the used parameters for all 4 sub-regions were the same. Specifically, for the calculation of the normal vectors of each point and its corresponding poles, two parameters were defined; the number of nearest neighbors (knn = 30) and the tolerance for the coplanarity test (n = 0.2). For the calculation of the density of the poles, the number of bins for the kernel density estimation (nbins = 64) and the minimum angle between normal vectors of discontinuity sets (φ = 20°) were determined. Then, for the assignment of a discontinuity set to each point, the parameter that was imported was the minimum angle between the normal vector of a discontinuity set and the normal vector of the point (cone = 30°). Lastly, for the cluster analysis, an assumption was made about all cluster members of a discontinuity set having the same normal vector, and the parameter used for test if two clusters should be merged (ksigma = 1.5) was defined.
The discontinuity sets, for each sub-region, as they were semi-automatically extracted based on DSE, numbered four (4) and are presented visually in Figure 5, Figure 6, Figure 7, Figure 8 and Figure 9 for each sub-region separately, while their main characteristics are listed in Table 2.
It is important to underline that three of them comprise major joint sets (J1, J2 and J3) and one (1) the bedding (Β).
3. Stability Analyses
3.1. Kinematic Analysis
In general, from the field survey, it is preliminarily comprehended that the main failure mode in the whole area comprises rock block detachment followed mainly by toppling or wedge failure and secondarily by planar sliding failure. The fallen blocks reveal fresh surfaces and as a result, the lateral blocks exhibit a lack of confining stress. Consequently, new cracks emerge and the same process accelerates.
In order to determine the optimal failure model for each sub-region, a kinematic analysis was performed based on the calculated major discontinuity sets from DSE software, which were previously validated according to the field-obtained structural data [60,62]. This analysis was executed, for each area, via DIPS v.7 software (RocScience Inc., Toronto, ON, Canada). The geometrical characteristics of each slope and of each discontinuity set were imported, in addition to the friction angle of the bed rock, which was estimated as φ = 30°, and a stereographic projection occurred for every failure type. These produced stereonet plots, identified any potential failures and highlighted the discontinuity set(s) which contributed to those. The results of this process are demonstrated in Table 3 and the stereographic projections for each sub-region are shown in Figure 10, Figure 11, Figure 12 and Figure 13.
3.2. Rockfall Susceptibility Analysis
After the generation of the optimal failure models for each sub-region, the monitoring and, subsequently, the quantification of two (2) important elements for this hazard assessment were made possible. These were the already failed rock blocks and the potentially unstable ones for each sub-region. With the spatial distribution of these blocks monitored, important measures were exported regarding their magnitude (volume, mass) and therefore, the frequency of each magnitude was calculated per sub-region. Additionally, the density of each category of rock blocks in every sub-region was estimated with the combination of each slope’s size and the number of the monitored blocks.
The followed methodology was based initially on the approach in [69], but it was further developed to utilize the maximum of the detailed UAV-derived dataset’s capabilities. Specifically, the proposed methodology started with the processing of every sub-region’s point cloud, with the CloudCompareTM software v.2.11.1 (Anoia), in order to perform two separate semi-automated detections for the failed and the likely-to-fail rock blocks, respectively. These detections were based on the visual interpretation of the main discontinuity sets (DSE exports) and their contribution to each slope’s failure model (Kinematic Analysis exports). Hence, the geometric characteristics, the spatial distribution, the magnitude and the density of presence of each rock block were specified. Due to the lack of available rock block volumes to be analyzed, the identification and the quantification of the already failed blocks were extracted via the analysis of the fresh surfaces across each sub-region’s face slope, that attested to the existence of a prior failure. In total, 455 rock blocks were detected, 326 of them as already detached and 129 as potentially unstable. Their detailed allocation per sub-region is demonstrated in Table 4 and their visual interpretation is shown in Figure 14.
A supervised automated analysis was then performed for the calculation of each block’s volume via the 2.5D Volume Tool, provided by the CloudCompareTM software v.2.11.1 (Anoia). In order to estimate the credibility and highlight potential outliers in these automated calculations, the manual calculation of 20% of the total rock block volumes for each sub-region via the extracted point clouds was decided. The followed methodology was inspired by relevant previous surveys, such as [70], and was further developed.
In this particular case, the volumes of both the already failed and the potentially unstable rock blocks varied. In general, their volumes fluctuated in moderate-to-large ranges (≤4 m3), but it is noteworthy to highlight the existence of some individual cases in which these values were surpassed. Of course, these excesses have not occurred extensively along the slopes, but they comprise isolated cases. In particular, most of these isolated cases were identified in sub-region U3, where many of the potentially unstable block volumes were estimated to have greater values than the average.
On the contrary, the spatial distribution of the examined rock blocks (both the already failed and the potentially unstable) seems to follow certain directions across the face of each slope. This could easily be understood with the predetermined optimal failure models for each sub-region, as the formation of these rock blocks followed the directions of the discontinuity set(s) which contributed to any of the potential failures.
Specifically, for sub-region U1, the main potentially unstable block volumes that were identified, across the slope’s profile, ranged from small to moderate with values between 0.5 m3 and 1.6 m3. In sub-region U2, the potentially unstable block’s volume distribution mainly fluctuated between 0.6 m3 and 1.3 m3. In the third sub-region (U3), the volume distribution mode displayed its highest range for any of the investigated slopes, with values mainly varying from 1.2 m3 up to 5.2 m3. Of course, as mentioned before, some of those volume excesses (>5.1 m3) comprised isolated cases and they were not considered as a distinctive feature for this sub-region. At last, for sub-region U4, the main potentially unstable block volumes that were identified, across the slope’s profile, varied from very small to small with values mainly between 0.2 m3 and 1.1 m3.
Overall, the correlation of both the spatial distribution and the estimated volumes between the already failed and the potentially unstable rock blocks seemed successful by the results of this analysis. Thus, the identification and the quantification of the potentially unstable rock blocks, which had the biggest margin of error in this particular case, appeared to be well-established. In Figure 15, Figure 16, Figure 17 and Figure 18 is shown the volume distribution (frequency %) for each investigated sub-region analytically and in Figure 19 the cumulative volume distribution for the whole investigated site.
After the identification of the population, the magnitude and the spatial distribution of the potentially unstable rock blocks with a 3D approach, a rockfall analysis based on trajectometry simulations was executed via RocFall software v.8.0.12 (RocScience Inc., Toronto, ON, Canada), in order to predict the potential rockfall hazards in the area. RocFall software can be characterized as a 2D statistical analysis program designed to assist with the assessment of slopes at risk for rockfalls. Energy, velocity and “bounce height” were determined by using the software for each sub-region. Distributions and comprehensive statistics of these parameters were automatically calculated along each slope’s profile and projected as graphs. This software can also assist in determining remedial measures. Information about the kinetic energy and location of impact on a barrier can help determine the effectiveness (capacity, size and location) of barriers [71]. The barriers can be custom, user–defined or predefined from the software’s library. As a result, the extracted information is vital for the estimation of each sub-region’s hazard level, based on the proposed Rockfall Hazard and Risk Rating System.
In general, a detached block descends very rapidly through the air by falling, bouncing and rolling [72], while its trajectory mainly depends on the geometry of the slope. In order to model the trajectory of the falling rocks and design the rockfall barriers, it was necessary to determine some parameters for all four (4) sub-regions. These were the normal and tangential coefficients of restitution (Rn and Rt, respectively) of the bed rock and each slope’s most critical profile. The values of two coefficients of restitution (Rn and Rt) for the limestone were based on previous publications, for limestone rocks found in similar geological settings with similar properties as the one in the investigated site, estimated as 0.5 and 0.5, respectively [73]. The critical slope profile for each of the four (4) sub-regions was extracted from the georeferenced 3D point-cloud via CloudCompareTM software v.2.11.1 (Anoia). Specifically, a polyline was constructed for each profile followed the morphology. Then, from the attribute table, the 3D coordinates of every point, that consisted of each polyline (X–Y–Z), were converted to 2D (X–Y). The 2D information could then be imported to RocFall software v.8.0.12 (RocScience Inc., Toronto, ON, Canada) in order to achieve the most precise visual interpretation of each slope’s profile.
In this particular case, for sub-region U1 three (3) main rockfall release points were identified across the slope’s profile. The result of the simulation indicates that the failure from two (2) of them (point a and point b) cannot threaten the monastery, and, consequently, the rockfall risk can be neglected. The third identified release point can be harmful for the monastery and the maximum total kinetic energy of the rockfall at the location of impact with the monastery was estimated as 69 kJ. In sub-region U2, there were identified two (2) main rockfall release points that could both, potentially, produce threatening events for the road below the slope. The maximum total kinetic energy of the rockfall at the location of impact with the road was estimated to be 429 kJ for the first release point (point a) and 747 kJ for the second (point b). In the third sub-region (U3), two (2) main detachment points for rockfalls were identified as potentially harmful (point a and point b), and one (1) cannot threaten the road below (point c). The maximum total kinetic energy of the rockfall at the location of impact with the road was estimated as 3621 kJ for the first release point (point a) and 1386 kJ for the second (point b). These were the highest values for any of the investigated slopes. At last, in sub-region U4, two (2) main rockfall release points were identified. Both of them could potentially threaten the road below the slope. The maximum total kinetic energy of the rockfall at the location of impact with the road was estimated as 290 kJ for the first release point (point a) and 102 kJ for the second (point b). The detailed results from this analysis, per sub-region, are demonstrated in Table 5, while a visual interpretation of the rock blocks trajectories is presented in Figure 20.
4. Rockfall Hazard and Risk Assessment
4.1. General
The assessment of rockfall hazards and risks along roads and in other human-related locations is of great importance [24]. In order to determine the value of these parameters, a number of rating systems have been developed based on either qualitative or quantitative criteria. These approaches differ entirely in terms of input data, adopted analysis procedure and of course the final outputs.
Qualitative-based methods define hazards, elements at risk and their vulnerabilities with the usage of qualitative descriptors, such as ranked attributes, weighted indices, rating systems, scoring schemes and classifications [74]. This type of evaluation can be based on either objective (statistical or mathematical) estimates, subjective (judgments or assumptions) estimates, or even a combination of both. Detailed ratings usually use several judging factors to provide an evaluation and/or score for the slope. The results of this method usually are expressed using relative terms, such as high, moderate and low. Qualitative analyses provide useful information for hazard and risk management, for relative comparisons of different sites and for facilitating the prioritization of mitigation measures [75].
On the contrary, quantitative-based methods use numerical values or ranges of them instead of qualitative relative terms. Generally, quantitative hazard and risk analyses approach the evaluation of hazard in the form of a numerical probability method, which estimates the frequency of failures, including the intensity of a specific spatial distribution and attempts to quantify risk with the monetary expression of the potential damage. Even though the hazard evaluation, in qualitative terms, seems prevalent and the reliability of its results occur from the availability, quantity, quality and credibility of the derived data, the same do not apply for quantitative risk analysis. Several recent efforts have attempted to establish standard procedures for quantifying risk in terms of official national recommendations or guidelines [76]. In most quantitative risk analyses, in order to quantify the probability of potential losses that are related to the occurrence of a hazardous event, such as rockfalls, the parameters that are taken into consideration are the number of demolished structures, injured people and fatalities. However, this does not constitute a standard procedure for every risk analysis because it depends on the researcher’s approach. Furthermore, the significance of the exported results varies as the acceptable and tolerable risk thresholds differ between countries and regulations.
In general, qualitative analyses are more commonly used because they are easy to use and can be performed quickly [77]. For this reason, most rockfall hazard and risk assessments start with a qualitative approach to the investigated site as a whole and then adopt a detailed quantitative character, with thorough ratings to numerically differentiate the hazard and/or risk, respectively, at the predetermined specific region of the site. In other words, qualitative analysis represents an initial analysis step of the dominant hazards at a given site to evaluate the most dangerous areas further via quantitative methods. Despite this, nowadays, quantitative rockfall hazard and risk assessments are only possible when a detailed historical inventory of the rockfall events that have occurred in the study area is available [78]. However, the documentation of prior rockfall events is usually poorly made or even absent at most sites. Furthermore, complete rockfall inventories are rare in most parts of the world, due to the lack of reporting of small and medium events, which are usually not related to significant impacts [79]. Moreover, due to shortage of available data (geomechanical, statistical and historical) of previous rockfall activities, the accuracy of the results in quantitative-based assessments varies. The accuracy of a rockfall hazard and risk assessment depends on the quality of the “components” that constitute the analysis, and their processing refinement, whether the data consist of qualitative relative descriptors or absolute numerical values. Hence, a quantitative evaluation may not be more precise than a qualitative one [80].
Consequently, determining which method best suits a specific site is not an easy task. For this paper, a qualitative-based approach was implemented and a new rockfall hazard and risk rating system was proposed.
4.2. Background
The first rockfall hazard assessment methodology was proposed for railway networks by [81] in 1976. This method was based on a qualitative approach to evaluate the hazard level and prioritize the remediation need with alphabetical descriptors from “A” (the most hazardous regions which require immediate intervention) up to “F” (the most stable regions which do not require any intervention). This first attempt at a rating system was initially applied along the Canadian Pacific Railroad [81] and was then used as the cornerstone for any rating system methodology, related to rockfall hazards and risks, ever developed afterwards.
One of the first and most well-known rockfall hazard rating methods is called the Rockfall Hazard Rating System (RHRS) and was developed by [82] in Oregon (USA), in order to provide the local Department of Transportation with a simple, repeatable and easy-to-use standard rockfall hazard system along railways [83]. This system is considered as the basis for most rating systems, which further developed it in order to satisfy the requirements of variable transportation departments. Just to mention a few, the most widely used modified RHRS methods are: the Rock Slope Rating Procedure for New York (USA) [84,85,86,87], the mRHRS for Italy [24], the MORFH RS for Missouri (USA) [88,89,90], the TRHRS for Tennessee (USA) [91,92,93,94], the CRHRS for Colorado (USA) [95,96,97] and the RHRON for Ontario (Canada) [98,99,100].
Other important rating systems include the Rock Slope Hazard Index (RSHI) system, which was developed for rock slope inspection in highways in Scotland from [101]. The authors in [10] applied a quantitative hazard and risk methodology for the highways and railways in British Columbia, which was based on the magnitude and frequency distribution of rockfall events. The authors in [102] also proposed a new rockfall hazard rating system for use along a railway, named Quantitative Risk Assessment (QRA). This system was developed to quantify the probability of potential losses that are related to a hazardous event, with absolute results that can be used to compare different locations, thus providing a benchmark for prioritizing mitigation measures [102]. To this day, QRA constitutes one of the most popular quantitative methodologies.
A common ground between all the systems that were mentioned above is that all of them are orientated to anthropogenic cut slopes for highways and railways and not to natural ones. Some researchers have proposed systems that are applicable to natural slopes, but most of them are constructed for specific locations only. The authors in [103] proposed a hazard estimation methodology, specifically for a part of the transportation network across Central Italy, with 3D rockfall trajectories and their spatial distribution in order to estimate the risk. In a related way, [104] presented another quantitative approach with 3D rockfall trajectories for risk evaluation at the Sola d’Andorra slope (Andorra Principality) before and after the implementation of risk mitigation works. Lastly, [105] proposed a qualitative rockfall risk rating system, applicable for the estimation of risk for both natural and anthropogenic slopes, which was developed for a case study at the historical site of Monemvasia, Greece.
4.3. Rockfall Hazard and Risk Rating System
In the present study, a qualitative rockfall hazard and risk rating system is proposed. This rating system was designed with an emphasis on the rating of natural rock slopes, which indicate a susceptibility to rockfall events with a significant impact on human structures and activities. The above criteria in this particular case were fulfilled by the investigated site, the cultural heritage area of Kipinas Monastery in Epirus, Greece.
In general, four (4) major parameter categories are defined, which consist of a variety of different ranking values, in order for the total risk level for each sub-region to be estimated. Three (3) of these categories are related to the hazard level and one (1) to the impact of a potential rockfall event. In this assessment, every rating parameter has a different weight, which is based on the significance of each individual contribution to either the hazard and/or the risk level for every sub-region. The four main categories are presented in Table 6.
In particular, the first category (A) of the rating system is related to the geometry and the morphology of the slope in general. It involves parameters such as the height, the angle, the roughness and the vegetation of the slope, the main height of the rockfall source area and the availability of obstacles and vegetation in the catchment zone at the footway of the slope. Category B involves the engineering geological factors of each slope. These factors describe the condition of the rock discontinuities, the intact rock strength, the rock mass structure, the weathering level of the rock mass, the spatial distribution of the predetermined rock blocks (already fallen and prone) per slope, the volume of the dominant rock blocks (already fallen and prone) and the potential kinetic energy of a rockfall at the location of impact with the ground. The parameters in the third major category (C) are related to the potential triggering factors, and feature the rainfall conditions and their severity, the drainage conditions of the rock mass and the seismicity of the area. The last category (D) refers to the impacts of a potential rockfall event and contains factors related to the human presence and the value of the pre-existing structures. As mentioned before, the weight for each category varies, depending on the importance of the parameters involved. Specifically, in this assessment, category A, B and D are given a weight of 30% each and category C 10% to the total risk score for every investigated sub-region. The factors of each category and their individual weights are presented in Table 7.
Each examined factor can be evaluated between 10 and 100, as the conditions evolve from favorable to adverse, and then is multiplied by a respective predetermined weight. The total hazard score is calculated by summing the individual score of each factor, from the first three (A, B and C) major categories. At last, the total risk score is calculated by adding the fourth category (D) to the hazard score. Therefore, a slope with the highest hazard level will have a total weighted score of 70 and, one with the highest risk level a total weighted score of 100. The final result of this assessment is the construction of two (2) separate classifications, one hazard and one risk related, with five categories each (very low up to very high) for all four distinct sub-regions in the investigated site. Based on these classifications, both a hazard and a risk zonation of the whole investigated cliff against rockfall occurrence were made possible to be constructed. These classifications are shown in Table 8 and Table 9.
Lastly, it is important to highlight that the proposed rating system was developed on an empirical basis, with the involved parameters, their rating and their weight ranges based on the available data, reasonable geoengineering judgment and the known facts.
4.4. Results
The proposed Rockfall Hazard and Risk Rating System was applied at the four (4) predetermined sub-regions (U1 to U4, Figure 3) along the rock cliff of Kipinas Monastery. Since these locations are in the same area, some of the factors (mostly spatial related) have the same rating for all four, whereas some differ for each slope section. In particular, 12 out of 23 factors have the same rating. After extensive application of this rating system to the investigated site, the total scores were categorized, according to Table 8 for hazard and Table 9 for risk estimation. The final result of the application is a hazard and risk zonation of the cliff against rockfall occurrence, presented in Table 10 and in Figure 21.
Sub-region U1 is categorized in the moderate hazard zone, mainly due to the low height of the potential rockfall release zone and also due to the small sizes of the prone blocks. However, due to the high human presence and the high structure of the involved structure (in this sub-region is located the monastery), the total risk is high. The hazard levels in the area U2 are high, mainly as a result of the moderate-to-large volume of the prone blocks and their notable total kinetic energy at the location of impact with the road. However, the lack of significant structures in this location (only a road is located in U2) and the medium human presence (location of a resting area along the main road) result in a moderate total risk level. Sub-region U3 is the only one with both a high hazard level and high risk level. This occurs primarily from the notable large volume of the prone rock blocks which could be released from a significant height (47 m) which is greater than 2/3 of the total slope height. Additionally, the residencies of the monks are located in U3; the impacts of a potential rockfall event in this area would be very important. In the last investigated location (U4), both the hazard level and the risk level are moderate. The size of the prone unstable blocks is not large, in contrast with the dense spatial distribution shown, which occurs from the small dimensions of the area. Additionally, in this area there is a catchment zone, even if it is very restricted. The value of the structures is low, because only the road is located there, and the human presence is below moderate levels.
5. Discussion
In this study, a new Rockfall Hazard and Risk Rating System has been proposed and the implementation of a methodology has been suggested in order for all the critical parameters of the system to be estimated. Through this, a semi-quantitative rockfall hazard and risk assessment was performed.
As presented above, many rating systems for rockfall assessment have been proposed during the past decades, but nowadays, with the rise of remote sensing technologies in the field of geohazards, it is believed that there is still margin for improvement. Therefore, the construction of a new rating system based in quantitative parameters, exported from the UAV-derived data, was considered as an appropriate evolution in rockfall hazard and risk assessments.
The qualitative-based approach (i.e., rating system) was selected over a quantitative one, in order to cover a wider range of applications in areas susceptible to rockfall events with negligible to nonexistent data from former rockfall-related events. The main target of the proposed methodology is not to replace the detailed quantitative analyses of rockfall events, but to be considered as the initial step towards rockfall hazard and risk assessments with the implementation of it to the investigated site as a whole in order to classify it to sub-regions regarding their hazard and/or risk level, respectively. Through its application, useful information for hazard and risk management will be provided, for relative comparisons of different sites and also for facilitating the prioritization of mitigation measures. Then, of course, if it is deemed necessary, a detailed quantitative character, with thorough ratings to numerically differentiate the hazard and/or risk, respectively, could be adopted at the already predetermined susceptible regions of the site [75].
The main point that sets the current approach apart from its predecessors is the type of the value of the implemented factors. Generally, rating systems constitute a qualitative type of assessment, but this does not mean that the value of the factors that comprise them have to be qualitative-based. The main disadvantage of qualitative-based values is that they are subjective. This means that in the same area, with the same available data, the results could vary significantly between different researchers. On the contrary, the value of the factors of this proposed rating system are quantitative-based. The UAV-derived data, in accordance with the appropriate computer-based processing, enabled the calculation of important parameters in order for the properties of the complicated phenomena of rockfalls to be understood and expressed in absolute values. Factors regarding the Total Kinetic Energy, the rock block distribution across the slopes (fallen and potentially unstable) and the mode rock block volumes (fallen and potentially unstable) that are absent in most of the prior well-established rating systems such as RHRS [82] and its modifications [24,84,85,86,87,88,89,90,91,92,93,94,95,96,97,98,99,100], RHI [11] and the rockfall risk rating systems proposed by [105], comprise the cornerstone of this newly proposed Rockfall Hazard and Risk Rating System.
The methodology that was followed in this particular study and the parameters that were decided to form the rating system may seem to be related to a quantitative-based analysis at first glance. Specifically, the detection of potentially unstable rock blocks, the estimation of their potential volumes and the probabilistic analysis of them based on trajectometry simulations are very common approaches that are followed in quantitative analysis, in sites with extensive rockfall-related multi-temporal inventories [106,107,108]. In such cases, a multi-temporal change detection procedure between the different datasets is performed, in order for topographical changes between different epochs to be monitored and characterized for modeling of the rockfall’s dynamics. Consequently, the aforementioned values can be estimated. In this study, the identification of the population, the magnitude and the spatial distribution of the potentially unstable rock blocks was executed with a 3D approach, based on the accuracy of the point cloud and the knowledge of the optimal failure model.
It should be underlined that due to the absence of data from former rockfall-related events, limitations and uncertainties of this approach have been recognized. Firstly, the limitations could occur from the specifications of the 3D point cloud dataset (i.e., points density, ground resolution, reprojection error, etc.) and of course the inexperience of the user. When it comes to the uncertainties of the proposed methodology, these are subsequent to the lack of pre-existing data which could be used to validate the results. As was shown in the Kipinas Monastery case study, no limitations regarding the quality of the constructed point cloud (consisting of about 104 million points with a ground resolution of 1.27 cm/pixel and a reprojection error of 0.157 pixels) have been identified, according to the standards set by previous related analyses [46,47,48,49,50,109]. In order for the aforementioned uncertainties to be mitigated, it was decided to identify and analyze an additional parameter, the already failed rock blocks. The monitoring of the previously fallen rock blocks and the estimation of their volumes enabled the construction of a substitute for the previously non-existent inventory of prior rockfall events in the area of interest. With the establishment of this preliminary rockfall-related dataset, the distribution and volumes of the potentially unstable rock blocks were validated and, in some cases, calibrated. As a result of the reduction in the analysis incertitude, a more accurate simulation of reality is achieved.
To conclude, it is important to highlight that this proposed rating system reflects the result of an initial attempt, and further development and validation by back-analyses is encouraged for the optimum adjustment of the weight for various contained factors. Specifically, its potential application in different areas and rock slopes, where most of the parameters may have a greater range, could help to evaluate the sensitivity of each factor in the final estimation of the hazard and risk level.
6. Conclusions
Rockfall hazard and risk assessments consist some of the most elaborate and challenging surveys in geoengineering. The complexity of the event’s nature, combined with the importance of what is comprised in a potential failure, automatically pose their assessment as a top priority. With the introduction of remote sensing technologies, such as UAVs, some of the previous formidable deterring factors have been eased. The construction of qualitative and quantitative analyses for rockfall events became more precise and their results produce a more accurate simulation of the reality.
In general, UAVs constitute effective and efficient low-cost tools for data collection in many aspects of engineering geology [33]. Due to their ability to provide detailed information about the surface ground conditions, especially on difficult-to-access sites, many prior limitations in hazard and risk assessments can be now surpassed. With the use of digital photogrammetric techniques in the UAV-derived data, it is now possible to produce ultra-high spatial resolution datasets of hazardous regions, combined with the elimination of human risk. The further appropriate computer-based analysis of these datasets could lead to the construction of a detailed 3D visual interpretation (3D point cloud) of the investigated region that allows real-time applications and measurements of the rockfall phenomenon, which would not be attainable in that scale otherwise.
This study primarily aims to take advantage of the aforementioned capabilities that Unmanned Aerial Vehicles have to offer, in order to produce a hazard and risk assessment, with a qualitative approach, via the proposition of a new rating system. The qualitative approach was selected over a quantitative one, in order to cover a wider range of applications in areas susceptible to rockfall events with negligible to non-existent data from former rockfall-related events.
The followed methodology led to the extraction of all the necessary quantitative data that can be used for rockfall hazard and risk assessment of any natural slope, via the implementation of a new rating system. The area of application of the proposed methodology is the cultural heritage location of Kipinas Monastery in Epirus, Greece, an area characterized by the absence of pre-existing data regarding previous rockfall events, their spatial distribution along the cliff, their frequency (or the return period) of occurrence and their impact in the area of interest. Hence, this method can be suggested as a powerful approach to conduct a detailed hazard and risk assessment, in areas where negligible to no data from former rockfall-related events exist.
Initially, traditional field survey methods have been applied at the lower accessible part of the rock face, aiming to define the geometrical characteristics of the joints. Simultaneously, a photogrammetry survey via a manually flown UAV was performed. A total of 362 images were acquired from the UAV in order to cover the whole slope face. Then, the utilization of Structure from Motion (SfM) methodology enabled the production of ultra-high-resolution orthomosaic by intersecting the matched features between the overlapping offset images and interpreting them as detailed 3D point clouds. This 3D point cloud model, which consists of about 104 million points with a ground resolution of 1.27 cm/pixel, was georeferenced using the UAV sensor GPS data and a set of five artificial GCPs, and then segmented into four (4) sub-regions in order to proceed to the structural analysis. The structural analysis was performed, in a supervised, automated manner, with the open-source DSE software [66]. The result of this analysis was the extraction of the principal discontinuity sets and their main characteristics (dip, dip direction, persistence, spacing). With the geometrical characteristics of the four slopes and from the principal discontinuity sets known, a kinematic analysis was performed in order to estimate the optimal failure model for each sub-region. With the optimal failure model determined for each sub-region, a semi-automated procedure was performed in the 3D point cloud in order to monitor and quantify the magnitude (volume, mass) of both the already detached and fallen rock blocks and the prone ones for each sub-region. The final step before the implementation of the rating system was the conduction of a rockfall analysis based on trajectometry simulations. This probabilistic analysis was performed via RocFall software v.8 (RocScience Inc., Toronto, ON, Canada) for four (4) different slope profiles, one for each sub-region, in order to determine the total kinetic energy of a potential rockfall event at the moment of impact, the velocity of the rock blocks and their “bounce height”.
With this methodology, all the essential data were obtained in order to provide values to all of the factors of the proposed rockfall hazard and risk rating system. In general, the proposed rating system defines four (4) major parameters categories which consist of a variety of different ranking values, in order to estimate the total risk level for each sub-region. Three (3) of these categories are related to the hazard level (geometry factors, geoengineering factors and triggering factors) and one (1) to the impact of a potential rockfall event. Every rating factor has a different weight, which is based on the significance of each individual contribution to either the hazard and/or risk level for every sub-region. Each examined factor can be evaluated between 10 and 100, as the conditions evolve from favorable to adverse, and then should multiplied by its respective predetermined weight. The total hazard score is calculated by summing the individual score of each factor, from the first three (A, B and C) major categories. At last, the total risk score is calculated by adding the fourth category (D) to the hazard score.
Lastly, in a subsequent step, in order to estimate the outcome of this rockfall hazard and risk assessment and also gain important feedback for the proposed rating system, research should continue to be performed in the cultural heritage area of Kipinas Monastery. In particular, regular monitoring of the slope, ideally per six months or annually, with a UAV is suggested in order to compare the obtained data. Through this multi-temporal change detection procedure between the different datasets, topographical changes between different epochs could be monitored and characterized for robust modeling of rockfall dynamics, as suggested by [70,106,107]. With these results, mitigation measures could be quantified and suggested for the unique needs of each sub-region. Additionally, via these outcomes, an immediate evaluation and calibration, if needed, could be performed of the proposed rating system in order be as precise and accurate as possible. This constant evaluation is necessary because the main target of this proposed rockfall hazard and risk rating system is to be considered as the transitional step between qualitative and quantitative assessments.
Author Contributions
Conceptualization, I.K., V.M. and G.P.; methodology, I.K.; software, I.K.; validation, I.K., V.M. and G.P.; formal analysis, I.K.; investigation, I.K., V.M. and G.P.; data curation, I.K., V.M. and G.P.; writing—original draft preparation, I.K.; writing—review and editing, I.K., V.M. and G.P.; visualization, I.K.; supervision, I.K., V.M. and G.P.; project administration, I.K. All authors have read and agreed to the published version of the manuscript.
Funding
This research received no external funding.
Conflicts of Interest
The authors declare no conflict of interest.
References
- Varnes, D.J. Slope movement types and processes. In Transportation Research Board; Schuster, R.L., Krizek, R.J., Eds.; National Academy Sciences: Washington, DC, USA, 1978; Special report 176; pp. 11–33. [Google Scholar]
- Hoek, E. Analysis of rockfall hazards. In Practical Rock Engineering; Rocscience: Toronto, ON, Canada, 2000; pp. 117–136. [Google Scholar]
- Brabb, E.E. Innovative approaches to landslide hazard mapping. In Proceedings of the 4th International Symposium on Landslides, Toronto, ON, Canada, 23–31 August 1985; pp. 307–323. [Google Scholar]
- Guzzetti, F.; Reichenbach, P.; Cardinali, M.; Galli, M.; Ardizzone, F. Probabilistic landslide hazard assessment at the basin scale. Geomorphology 2005, 72, 272–299. [Google Scholar] [CrossRef]
- Guzzetti, F. Landslide Hazard and Risk Assessment. Ph.D. Thesis, Mathematisch–Naturwissenschaftlichen Fakultät der Rheinischen Friedrich-Wilhelms–Universität, University of Bonn, Bonn, Germany, 2006; 389p. [Google Scholar]
- Rossi, M.; Guzzetti, F.; Reichenbach, P.; Mondini, A.C.; Peruccacci, S. Optimal landslide susceptibility zonation based on multiple forecasts. Geomorphology 2010, 114, 129–142. [Google Scholar] [CrossRef]
- Volkwein, A.; Schellenberg, K.; Labiouse, V.; Agliardi, F.; Berger, F.; Bourrier, F.; Dorren, L.K.A.; Gerber, W.; Jaboyedoff, M. Rockfall characterisation and structural protection—A review. Nat. Hazards Earth Syst. Sci. 2011, 11, 2617–2651. [Google Scholar] [CrossRef] [Green Version]
- Fell, R. Landslide risk assessment and acceptable risk. Can. Geotech. J. 1994, 31, 261–272. [Google Scholar] [CrossRef]
- Guzzetti, F.; Carrara, A.; Cardinali, M.; Reichenbach, P. Landslide hazard evaluation: A review of current techniques and their application in a multi-scale study, Central Italy. Geomorphology 1999, 31, 181–216. [Google Scholar] [CrossRef]
- Hungr, O.; Evans, S.; Hazzard, J. Magnitude and frequency of rockfalls and rock slides along the main transportation corridors of south-western British Columbia. Can. Geotech. Journey 1999, 36, 224–238. [Google Scholar] [CrossRef]
- Zhang, L.Q.; Yang, Z.F.; Liao, Q.L.; Chen, J. An application of the rock engineering systems (RES) methodology in rockfall hazard assessment on the Chengdu-Lhasa Highway, China. Int. J. Rock Mech. Min. Sci. 2004, 41, 833–838. [Google Scholar] [CrossRef]
- Fell, R.; Corominas, J.; Bonnard, C.; Cascini, L.; Leroi, E.; Savage, W.Z. Guidelines for landslide susceptibility, hazard and risk zoning for land-use planning. Eng. Geol. 2008, 102, 99–111. [Google Scholar] [CrossRef] [Green Version]
- Crosta, G.B.; Agliardi, F. A methodology for psysically based rockfall hazard assessment. Nat. Hazards Earth Syst. Sci. 2003, 3, 407–422. [Google Scholar] [CrossRef]
- Manconi, A.; Giordan, D. Landslide failure forecast in near–real–time. Geomat. Nat. Hazards Risk 2016, 7, 639–648. [Google Scholar] [CrossRef] [Green Version]
- Török, Á.; Barsi, Á.; Bögöly, G.; Lovas, T.; Somogyi, Á.; Görög, P. Slope stability and rockfall assessment of volcanic tuffs using RPAS with 2–D FEM slope modelling. Nat. Hazards Earth Syst. Sci. 2018, 18, 583–597. [Google Scholar] [CrossRef] [Green Version]
- Pappalardo, G.; Mineo, S.; Rapisarda, S. Rockfall hazard assessment along a road on the Peloritani Mountains (northeastern Sicily, Italy). Nat. Hazards Earth Syst. Sci. 2014, 14, 2735–2748. [Google Scholar] [CrossRef] [Green Version]
- Stead, D.; Wolter, A. A critical review of rock slope failure mechanisms: The importance of structural geology. J. Struct. Geol. 2015, 74, 1–23. [Google Scholar] [CrossRef]
- Mateos, R.M.; García–Moreno, I.; Reichenbach, P.; Herrera, G.; Sarro, R.; Rius, J.; Aguiló, R.; Fiorucci, F. Calibration and validation of rockfall modeling at regional scale: Application along a roadway in Mallorca (Spain) and organization of its management. Landslides 2016, 13, 751–763. [Google Scholar] [CrossRef]
- Martino, S.; Mazzanti, P. Integrating geomechanical surveys and remote sensing for sea cliff slope stability analysis: The Mt. Pucci case study (Italy). Nat. Hazards Earth Syst. Sci. 2014, 14, 831–848. [Google Scholar] [CrossRef] [Green Version]
- Crosta, G.B.; Agliardi, F. How to obtain alert velocity thresholds for large rockslides. Phys. Chem. Earth Parts ABC 2002, 27, 1557–1565. [Google Scholar] [CrossRef]
- Abbruzzese, J.M.; Sauthier, C.; Labiouse, V. Considerations on Swiss methodologies for rock fall hazard mapping based on trajectory modeling. Nat. Hazards Earth Syst. Sci. 2009, 9, 1095–1109. [Google Scholar] [CrossRef] [Green Version]
- Copons, R.; Vilaplana, J.M.; Linares, R. Rockfall travel distance analysis by using empirical models (Solà d’Andorra la Vella, Central Pyrenees). Nat. Hazards Earth Syst. Sci. 2009, 9, 2107–2118. [Google Scholar] [CrossRef] [Green Version]
- Samodra, G.; Chen, G.; Sartohadi, J.; Hadmoko, D.S.; Kasama, K.; Setiawan, M.A. Rockfall susceptibility zoning based on back analysis of rockfall deposit inventory in Gunung Kelir, Java. Landslides 2016, 13, 805–819. [Google Scholar] [CrossRef]
- Budetta, P. Assessment of rockfall risk along roads. Nat. Hazards Earth Syst. Sci. 2004, 4, 71–81. [Google Scholar] [CrossRef] [Green Version]
- De Biagi, V.; Napoli, M.L.; Barbero, M.; Peila, D. Estimation of the return period of rockfall blocks according to their size. Nat. Hazards Earth Syst. Sci. 2017, 17, 103–113. [Google Scholar] [CrossRef] [Green Version]
- Glade, T. Landslide occurrence as a response to land use change: A review of evidence from New Zealand. Catena 2003, 51, 297–314. [Google Scholar] [CrossRef] [Green Version]
- Crosta, G.B.; Agliardi, F. Parametric evaluation of 3D dispersion of rockfall trajectories. Nat. Hazards Earth Syst. Sci. 2004, 4, 583–598. [Google Scholar] [CrossRef] [Green Version]
- Michoud, C.; Derron, M.H.; Horton, P.; Jaboyedoff, M.; Baillifard, F.J.; Loye, A.; Nicolet, P.; Pedrazzini, A.; Queyrel, A. Rockfall hazard and risk assessments along roads at a regional scale: Example in Swiss Alps. Nat. Hazards Earth Syst. Sci. 2012, 12, 615–629. [Google Scholar] [CrossRef] [Green Version]
- Wang, X.; Frattini, P.; Crosta, G.B.; Zhang, L.; Agliardi, F.; Lari, S.; Yang, Z. Uncertainty assessment in quantitative risk assessment. Landslides 2013, 11, 711–722. [Google Scholar] [CrossRef]
- Colomina, I.; Molina, P. Unmanned aerial systems for photogrammetry and remote sensing: A review. ISPRS J. Photogramm. Remote Sens. 2014, 92, 79–97. [Google Scholar] [CrossRef] [Green Version]
- Rossi, G.; Tanteri, L.; Tofani, V.; Vannoci, P.; Moretti, S.; Casagli, N. Use of multicopter drone optical images for landslide mapping and characterization. Nat. Hazards Earth Syst. Sci. Discuss. 2017. [Google Scholar] [CrossRef] [Green Version]
- Yu, M.; Huang, Y.; Zhou, J.; Mao, L. Modeling of landslide topography based on micro-unmanned aerial vehicle photography and structure-from-motion. Environ. Earth Sci. 2017, 76, 1–9. [Google Scholar] [CrossRef]
- Giordan, D.; Adams, M.S.; Aicardi, I.; Alicandro, M.; Allasia, P.; Baldo, M.; De Berardinis, P.; Dominici, D.; Godone, D.; Hobbs, P.; et al. The use of unmanned aerial vehicles (UAVs) for engineering geology applications. Bull. Eng. Geol. Environ. 2020, 79, 3437–3481. [Google Scholar] [CrossRef] [Green Version]
- Birch, J.S. Using 3DM Analyst mine mapping suite for rock face characterization. In Laser and Photogrammetric Methods for Rock Face Characterization, Proceedings of the 41st U.S. Rock Mechanics Symposium, Golden, CO, USA, 17–21 June 2006; Tonon, F., Kottenstette, J., Eds.; AMRA: Alexandria, VA, USA, 2006. [Google Scholar]
- Haneberg, W.C. Using close range terrestrial digital photogrammetry for 3–D rock slope modeling and discontinuity mapping in the United States. Bull. Eng. Geol. Environ. 2008, 67, 457–469. [Google Scholar] [CrossRef]
- Tannant, D.D.; Bahrani, N.; Gulati, V. Bedding surface roughness profiles and estimated dilation angles. In Proceedings of the 61st Canadian Geotechnical Conference, Edmonton, AB, Canada, 21–24 September 2008. [Google Scholar]
- Sturzenegger, M.; Stead, D. Close–range terrestrial digital photogrammetry and terrestrial laser scanning for discontinuity characterization on rock cuts. Eng. Geol. 2009, 106, 163–182. [Google Scholar] [CrossRef]
- Bahrani, N.; Tannant, D.D. Field–scale assessment of effective dilation angle and peak shear displacement for a footwall slab failure surface. Int. J. Rock Mech. Min. Sci. 2011, 48, 565–579. [Google Scholar] [CrossRef]
- Niethammer, U.; James, M.R.; Rothmund, S.; Travelletti, J.; Joswig, M. UAV-based remote sensing of the Super–Sauze landslide: Evaluation and Results. Eng. Geol. 2012, 128, 2–11. [Google Scholar] [CrossRef]
- Westoby, M.J.; Brasington, J.; Glasser, N.F.; Hambrey, M.J.; Reynolds, J.M. ‘Structure-from-Motion’ photogrammetry: A low-cost, effective tool for geoscience applications. Geomorphology 2012, 179, 300–314. [Google Scholar] [CrossRef] [Green Version]
- Lucieer, A.; Jong, S.M.D.; Turner, D. Mapping landslide displacements using Structure from Motion (SfM) and image correlation of multi-temporal UAV photography. Prog. Phys. Geogr. 2013, 38, 97–116. [Google Scholar] [CrossRef]
- Vasuki, Y.; Holden, E.J.; Kovesi, P.; Micklethwaite, S. Semi–automatic mapping of geological structures using UAV-based photogrammetric data: An image analysis approach. Comput. Geosci. 2014, 69, 22–32. [Google Scholar] [CrossRef]
- Bemis, S.P.; Micklethwaite, S.; Turner, D.; James, M.R.; Akciz, S.; Thiele, S.T.; Bangash, H.A. Ground–based and UAV–based photogrammetry: A multi-scale, high-resolution mapping tool for structural geology and paleoseismology. J. Struct. Geol. 2014, 69, 163–178. [Google Scholar] [CrossRef]
- Tannant, D.D. Review of photogrammetry–based techniques for characterization and hazard assessment of rock faces. Int. J. Geohazards Environ. 2015, 1, 76–87. [Google Scholar] [CrossRef] [Green Version]
- Casella, E.; Rovere, A.; Pedroncini, A.; Stark, C.P.; Casella, M.; Ferrari, M.; Firpo, M. Drones as tools for monitoring beach topography changes in the Ligurian Sea (NW Mediterranean). Geo-Mar. Lett. 2016, 36, 151–163. [Google Scholar] [CrossRef]
- Salvini, R.; Mastrorocco, G.; Seddaiu, M.; Rossi, D.; Vanneschi, C. The use of an unmanned aerial vehicle for fracture mapping within a marble quarry (Carrara, Italy): Photogrammetry and discrete fracture network modelling. Geomat. Nat. Hazards Risk 2017, 8, 34–52. [Google Scholar] [CrossRef]
- Chesley, J.T.; Leier, A.L.; White, S.; Torres, R. Using unmanned aerial vehicles and structure-from-motion photogrammetry to characterize sedimentary outcrops: An example from the Morrison Formation, Utah, USA. Sediment. Geol. 2017, 354, 1–8. [Google Scholar] [CrossRef]
- Giordan, D.; Manconi, A.; Remondino, F.; Nex, F. Use of unmanned aerial vehicles in monitoring application and management of natural hazards. Geomat. Nat. Hazards Risk 2017, 8, 1–4. [Google Scholar] [CrossRef]
- Giordan, D.; Hayakawa, Y.; Nex, F.; Remondino, F.; Tarolli, P. The use of remotely piloted aircraft systems (RPAS) for natural hazards monitoring and management. Nat. Hazards Earth Syst. Sci. 2018, 18, 1079–1096. [Google Scholar] [CrossRef] [Green Version]
- Török, Á.; Bögöly, G.; Somogyi, Á.; Lovas, T. Application of UAV in Topographic Modelling and Structural Geological Mapping of Quarries and Their Surroundings—Delineation of Fault-Bordered Raw Material Reserves. Sensors 2020, 20, 489. [Google Scholar] [CrossRef] [PubMed] [Green Version]
- Valkaniotis, S.; Papathanassiou, G.; Ganas, A. Mapping an earthquake-induced landslide based on UAV imagery; case study of the 2015 Okeanos landslide, Lefkada, Greece. Eng. Geol. 2018, 245, 141–152. [Google Scholar] [CrossRef]
- Slob, S.; Hack, H.R.G.K.; van Knapen, B.; Kemey, J. Automated identification and characterisation of discontinuity sets in outcropping rock masses using 3D terrestrial laser scan survey techniques. In Proceedings of the ISRM Regional Symposium EUROCK 2004 and 53rd Geomechanics Colloquy: Rock Engineering and Practice, Salzburg, Austria, 7–9 October 2004; pp. 439–443. [Google Scholar]
- Jaboyedoff, M.; Metzger, R.; Oppikofer, T.; Couture, R.; Derron, M.H.; Locat, J.; Turmel, D. New insight techniques to analyze rock-slope relief using DEM and 3Dimaging cloud points: COLTOP-3D software. In Rock Mechanics: Meeting Society’s Challenges and Demands; CRC Press: London, UK, 2007; pp. 61–68. [Google Scholar]
- Gigli, G.; Casagli, N. Semi-automatic extraction of rock mass structural data from high resolution LIDAR point clouds. Int. J. Rock Mech. Min. Sci. 2011, 48, 187–198. [Google Scholar] [CrossRef]
- Fanti, R.; Gigli, G.; Lombardi, L.; Tapete, D.; Canuti, P. Terrestrial laser scanning for rockfall stability analysis in the cultural heritage site of Pitigliano (Italy). Landslides 2013, 10, 409–420. [Google Scholar] [CrossRef] [Green Version]
- Vöge, M.; Lato, M.J.; Diederichs, M.S. Automated rockmass discontinuity mapping from 3-dimensional surface data. Eng. Geol. 2013, 164, 155–162. [Google Scholar] [CrossRef]
- Chen, J.; Zhu, H.; Li, X. Automatic extraction of discontinuity orientation from rock mass surface 3D point cloud. Comput. Geosci. 2016, 95, 18–31. [Google Scholar] [CrossRef]
- Dewez, T.J.; Girardeau-Montaut, D.; Allanic, C.; Rohmer, J. Facets: A CloudCompare plugin to extract geological planes from unstructured 3D point clouds. In: Int. Arch. Photogramm. Remote Sens. Spat. Inf. Sci. 2016, 41, 799–804. [Google Scholar]
- Gomes, R.K.; de Oliveira, L.P.; Gonzaga, L.; Tognoli, F.M.; Veronez, M.R.; de Souza, M.K. An algorithm for automatic detection and orientation estimation of planar structures in LiDAR-scanned outcrops. Comput. Geosci. 2016, 90, 170–178. [Google Scholar] [CrossRef]
- Bordehore, L.J.; Riquelme, A.; Cano, M.; Tomás, R. Comparing manual and remote sensing field discontinuity collection used in kinematic stability assessment of failed rock slopes. Int. J. Rock Mech. Min. Sci. 2017, 97, 24–32. [Google Scholar] [CrossRef] [Green Version]
- Guo, J.; Liu, S.; Zhang, P.; Wu, L.; Zhou, W.; Yu, Y. Towards semi-automatic rock mass discontinuity orientation and set analysis from 3D point clouds. Comput. Geosci. 2017, 103, 164–172. [Google Scholar] [CrossRef]
- Menegoni, N.; Giordan, D.; Perotti, C.; Tannant, D.D. Detection and geometric characterisation of rock mass discontinuities using a 3D high-resolution digital outcrop model generated from RPAS imagery—Ormea rock slope, Italy. Eng. Geol. 2019, 252, 145–163. [Google Scholar] [CrossRef]
- Mountrakis, D. Geology and Geotectonic Evolution of Greece; University Studio Press: Thessaloniki, Greece, 2010. [Google Scholar]
- Giordan, D.; Manconi, A.; Tannant, D.D.; Allasia, P. U.A.V: Low-cost remote sensing for high-resolution investigation of landslides. In Proceedings of the Geoscience and Remote Sensing Symposium (IGARSS), Milan, Italy, 26–31 July 2015; pp. 5344–5347. [Google Scholar]
- Turner, D.; Lucieer, A.; Wallace, L. Direct georeferencing of ultrahigh-resolution UAV imagery. IEEE Trans. Geosci. Remote Sens. 2014, 52, 2738–2745. [Google Scholar] [CrossRef]
- Riquelme, A.J.; Abellán, A.; Tomàs, R. Discontinuity spacing analysis in rock masses using 3D point clouds. Eng. Geol. 2015, 195, 185–195. [Google Scholar] [CrossRef] [Green Version]
- Botev, Z.I.; Grotowski, J.F.; Kroese, D.P. Kernel density estimation via diffusion. Ann. Stat. 2010, 38, 2916–2957. [Google Scholar] [CrossRef] [Green Version]
- Riquelme, A.; Tomàs, R.; Cano, M.; Pastor, J.L.; Abellán, A. Automatic Mapping of Discontinuity Persistence on Rock Masses Using 3D Point Clouds. Rock Mech. Rock Eng. 2018, 51, 3005–3028. [Google Scholar] [CrossRef]
- Utlu, M.; Öztürk, M.Z.; Simsek, M. Rockfall analysis based on UAV technology in Kazıklıali Gorge, Aladağlar (Taurus Mountains, Turkey). Int. Journey Environ. Geoinform. 2020, 7, 239–251. [Google Scholar] [CrossRef]
- Menegoni, N.; Giordan, D.; Perotti, C. Reliability and Uncertainties of the Analysis of an Unstable Rock Slope Performed on RPAS Digital Outcrop Models: The Case of the Gallivaggio Landslide (Western Alps, Italy). Remote Sens. 2020, 12, 1635. [Google Scholar] [CrossRef]
- Stevens, W.D. Rocfall: A Tool for Probabilistic Analysis, Design of Remedial Measures and Prediction of Rockfalls. Master’s Thesis, Graduate Department of Civil Engineering, University of Toronto, Toronto, ON, Canada, 1998; 143p. [Google Scholar]
- Corominas, J.; Mavrouli, O.; Ruiz-Carulla, R. Rockfall Occurrence and Fragmentation. In Advancing Culture of Living with Landslides; Sassa, K., Mikoš, M., Yin, Y., Eds.; Springer: Cham, Switzerland, 2017. [Google Scholar]
- Asteriou, P. Investigation of the Geotechnical Parameters which Control Rockfalls. Ph.D. Thesis, Geotechnical Division, School of Civil Engineering, National Technical University of Athens, Athens, Greece, 2016; 753p. [Google Scholar]
- Cruden, D.M.; Fell, R. Landslide Risk Assessment; Balkema: Rotterdam, Netherlands, 1997. [Google Scholar]
- Fell, R.; Ho, K.; Lacasse, S.; Leroi, E. A framework for landslide risk assessment and management. In Landslide Risk Management; Hungr, O., Fell, R., Couture, R., Eberhardt, E., Eds.; Taylor and Francis Group: London, UK, 2005. [Google Scholar]
- Mavrouli, O.C. Quantitative evaluation of the rockfall risk. Application to the Solà d’Andorra. Ph.D. Thesis, Universitat Politècnica de Catalunya, Barcelona, Spain, 2011. [Google Scholar]
- Pantelidis, L. System of Quantitative and Qualitative Assessment of Highway Geotechnical Assets Failure Hazard and Relevant Consequences. Ph.D. Thesis, Aristotle University of Thessaloniki, Thessaloniki, Greece, 2009. [Google Scholar]
- Hantz, D.; Vengeon, J.M.; Dussauge-Peisser, C. An Historical, Geomechanical and Probabilistic Approach to Rock-Fall Hazard Assessment. Nat. Hazards Earth Syst. Sci. 2003, 3, 693–701. [Google Scholar] [CrossRef] [Green Version]
- Budetta, P.; Nappi, M. Comparison between qualitative rockfall risk rating systems for a road affected by high traffic intensity. Nat. Hazards Earth Syst. Sci. 2013, 13, 1643–1653. [Google Scholar] [CrossRef] [Green Version]
- Gerath, R.; Jakob, M.; Mitchell, P.; VanDine, D.; Finn, L.; Gillespie, D.; Kuan, S.; Naesgaard, E.; Patrick, B.; Skermer, N.; et al. Guidelines for Legislated Landslide Assessments for Proposed Residential Development in British Columbia; Association of Professional Engineers and Geoscientists of British Columbia: Vancouver, BC, Canada, 2006. [Google Scholar]
- Brawner, C.; Wyllie, D. Rock Slope Stability on Railway Projects. Area Bull. 1976, 77, 449–474. [Google Scholar]
- Pierson, L.A.; Davis, S.A.; Van Vickle, R. Rockfall Hazard Rating System Implementation Manual; Federal highway administration (FHWA); report FHWA-OR-EG-90–01, FHWA; US Department of Transporation: Salem, OR, USA, 1990.
- Pierson, L.A. The rockfall hazard rating system. Rockfall Prediction and Control and Landslide Case Histories: Rockfall Prediction and Control and Landslide Case Histories. Transp. Res. Rec. 1992, 1343, 6–13. [Google Scholar]
- Wyllie, D.C. Rock slope inventory system. In Proceedings of the Federal Highway Administration Rockfall Mitigation Seminar FHWA Region 10, Portland, OR, USA; 1987. [Google Scholar]
- New York State DOT. Rock Slope Rating Procedure. Geotechnical Engineering Manual, 15; Geotechnical Engineering Bureau: Albany, NY, USA, 1996.
- New York State DOT. Rock Slope Rating Procedure. Geotechnical Engineering Manual, 15; revision no. 1; Geotechnical Engineering Bureau: Albany, NY, USA, 2007.
- Hadjin, D.J. New York State Department of Transportation rock slope rating procedure and rockfall assessment. Transp. Res. Rec. 2002, 1786, 60–68. [Google Scholar] [CrossRef]
- Maerz, N.H.; Youssef, A.; Lauer, R. MORFH RS: A rockcut rating system for Missouri highways. In Proceedings of the 55th Highway Geology Symposium, Kansas City, MO, USA, 7–10 September 2004; pp. 406–424. [Google Scholar]
- Maerz, N.H.; Youssef, A.; Fennessey, T.W. New risk—Consequence rockfall hazard rating system for Missouri highways using digital image analysis. Environ. Eng. Geosci. 2005, 11, 229–249. [Google Scholar] [CrossRef]
- Youssef, A.M.; Maerz, N.H. Development, justification, and verification of a rock fall hazard rating system. Bull. Eng. Geol. Environ. 2012, 71, 171–186. [Google Scholar] [CrossRef]
- Bateman, V. Development of a database to manage rockfall hazard: The Tennessee rockfall hazard database. In Proceedings of the 82nd Annual Meeting of Transportation Research Board, Washington, DC, USA, 12–16 January 2003. [Google Scholar]
- Rose, B.T. Tennessee rockfall management system. Ph.D. Thesis, Virginia Polytechnic Institute and State University, Blacksburg, VA, USA, 2005. [Google Scholar]
- Vandewater, C.; Dunne, W.M.; Mauldon, M.; Drumm, E.C.; Bateman, V. Classifying and assessing the geologic contribution to rockfall hazard. Environ. Eng. Geosci. 2005, 11, 141–154. [Google Scholar] [CrossRef]
- Mauldon, M.; Drumm, E.C.; Dunne, W.M.; Bateman, N.; Rose, B.T.; Kim, M. Rockfall Management System for Tennessee; Tennessee Department of Transportation Division of Material and Tests: Nashville, TN, USA, 2007; p. 301. [Google Scholar]
- Stover, B.K. Highway Rockfall Research Report; Colorado Geological Survey; Department of Natural Resources: Denver, CO, USA, 1992. [Google Scholar]
- Andrew, R.D. The Colorado Rockfall Hazard Rating System; report CTI-CDOT-2-94; Colorado Department of Transportation: Denver, CO, USA, 1994.
- Santi, P.M.; Russell, C.P.; Higgins, J.D.; Spriet, J.I. Modification and statistical analysis of the Colorado rockfall hazard rating system. Eng. Geol. 2009, 104, 55–65. [Google Scholar] [CrossRef]
- Franklin, J.A.; Senior, S.A. The Ontario rockfall hazard rating system. In Proceedings of the Conference on Engineering Geology and Environment, Athens, Greece, 23–27 June 1997; pp. 647–658. [Google Scholar]
- Senior, S.A. Ontario Rockfall Hazard Rating System. Field Procedures Manual; Report draft; Materials Engineering and Research Office: Toronto, ON, Canada, 2003; p. 36. [Google Scholar]
- Franklin, J.A.; Wood, D.F.; Senior, S.A.; Blair, J.A.; Wright, J. RHRON: Ontario Rockfall Hazard Rating System. Field Procedures Manual; Ontario Ministry of Transportation Materials Engineering and Research Office Report, MERO-043; Ontario Ministry of Transportation Materials Engineering and Research Office: Toronto, ON, USA, 2013.
- McMillan, P.; Matheson, G.D. A two–stage system for highway rock slope risk assessment. Int. J. Rock Mech. Min. Geomech. 1997, 34, 517. [Google Scholar] [CrossRef]
- Hungr, O.; Fell, R.; Couture, R.; Eberhardt, E. Landslide Risk Management; Taylor and Francis Group: London, UK, 2005. [Google Scholar]
- Guzzetti, F.; Reichenbach, P.; Ghigi, S. Rockfall hazard and risk assessment along a transportation corridor in the Nera Valley, Central Italy. Environ. Manag. 2004, 34, 191–208. [Google Scholar] [CrossRef] [PubMed]
- Corominas, J.; Copons, R.; Vilaplana, J.M.; Altimir, J.; Amigo, J. Integrated Landslide Susceptibility Analysis and Hazard Assessment in the Principality of Andorra. Nat. Hazards 2003, 30, 421–435. [Google Scholar] [CrossRef]
- Saroglou, H.; Marinos, V.; Marinos, P.; Tsiambaos, G. Rockfall hazard and risk assessment: An example from a high promontory at the historical site of Monemvasia, Greece. Nat. Hazards Earth Syst. Sci. 2012, 12, 1823–1836. [Google Scholar] [CrossRef] [Green Version]
- Sarro, R.; Riquelme, A.; García-Davalillo, J.C.; Mateos, R.M.; Tomás, R.; Pastor, J.L.; Cano, M.; Herrera, G. Rockfall Simulation Based on UAV Photogrammetry Data Obtained during an Emergency Declaration: Application at a Cultural Heritage Site. Remote Sens. 2018, 10, 1923. [Google Scholar] [CrossRef] [Green Version]
- Perrotti, M.; Godone, D.; Allasia, P.; Baldo, M.; Fazio, N.L.; Lollino, P. Investigating the Susceptibility to Failure of a Rock Cliff by Integrating Structure-from-Motion Analysis and 3D Geomechanical Modelling. Remote Sens. 2020, 12, 3994. [Google Scholar] [CrossRef]
- Fernández, T.; Pérez-García, J.L.; Gómez-López, J.M.; Cardenal, J.; Moya, F.; Delgado, J. Multitemporal Landslide Inventory and Activity Analysis by Means of Aerial Photogrammetry and LiDAR Techniques in an Area of Southern Spain. Remote Sens. 2021, 13, 2110. [Google Scholar] [CrossRef]
- Lindner, G.; Schraml, K.; Mansberger, R.; Hübl, J. UAV monitoring and documentation of a large landslide. Appl. Geomath. 2016, 8, 1–11. [Google Scholar] [CrossRef]
Figure 1.
Conceptual scheme of the proposed methodology.

Figure 2.
Stereographic projections of the 122 field–obtained tectonic measurements.

Figure 3.
The constructed 3D point cloud model with used GCPs shown as yellow dots.

Figure 4.
The segmented initial point cloud, in four (4) areas; U1: blue, U2: green, U3: yellow and U4: red.
Figure 4.
The segmented initial point cloud, in four (4) areas; U1: blue, U2: green, U3: yellow and U4: red.

Figure 5.
Overall image of the whole slope and the allocation of each main discontinuity set on it.

Figure 6.
(a) Stereographic projections of the DSE-derived discontinuity sets for U1 and (b) the visual interpretation of the four (4) main sets in the 3D point cloud.
Figure 6.
(a) Stereographic projections of the DSE-derived discontinuity sets for U1 and (b) the visual interpretation of the four (4) main sets in the 3D point cloud.

Figure 7.
(a) Stereographic projections of the DSE-derived discontinuity sets for U2 and (b) the visual interpretation of the four (4) main sets in the 3D point cloud.
Figure 7.
(a) Stereographic projections of the DSE-derived discontinuity sets for U2 and (b) the visual interpretation of the four (4) main sets in the 3D point cloud.

Figure 8.
(a) Stereographic projections of the DSE-derived discontinuity sets for U3 and (b) the visual interpretation of the four (4) main sets in the 3D point cloud.
Figure 8.
(a) Stereographic projections of the DSE-derived discontinuity sets for U3 and (b) the visual interpretation of the four (4) main sets in the 3D point cloud.

Figure 9.
(a) Stereographic projections of the DSE-derived discontinuity sets for U4 and (b) the visual interpretation of the four (4) main sets in the 3D point cloud.
Figure 9.
(a) Stereographic projections of the DSE-derived discontinuity sets for U4 and (b) the visual interpretation of the four (4) main sets in the 3D point cloud.

Figure 10.
Kinematic analysis for: (a) wedge sliding and (b) flexural toppling failure in sub-region U1.
Figure 10.
Kinematic analysis for: (a) wedge sliding and (b) flexural toppling failure in sub-region U1.

Figure 11.
Kinematic analysis for: (a) planar sliding and (b) wedge sliding failure in sub-region U2.
Figure 11.
Kinematic analysis for: (a) planar sliding and (b) wedge sliding failure in sub-region U2.

Figure 12.
Kinematic analysis for: (a) planar sliding and (b) wedge sliding failure in sub-region U3.
Figure 12.
Kinematic analysis for: (a) planar sliding and (b) wedge sliding failure in sub-region U3.

Figure 13.
Kinematic analysis for: (a) planar sliding and (b) wedge sliding failure in sub-region U4.
Figure 13.
Kinematic analysis for: (a) planar sliding and (b) wedge sliding failure in sub-region U4.

Figure 14.
Overview of both the already failed (blue) and the potentially unstable (red) blocks in the whole slope.
Figure 14.
Overview of both the already failed (blue) and the potentially unstable (red) blocks in the whole slope.

Figure 15.
Volume distribution for both the fallen (blue) and the potentially unstable (red) blocks for sub-region U1.
Figure 15.
Volume distribution for both the fallen (blue) and the potentially unstable (red) blocks for sub-region U1.


Figure 16.
Volume distribution for both the fallen (blue) and the potentially unstable (red) blocks for sub-region U2.
Figure 16.
Volume distribution for both the fallen (blue) and the potentially unstable (red) blocks for sub-region U2.


Figure 17.
Volume distribution for both the fallen (blue) and the potentially unstable (red) blocks for sub-region U3.
Figure 17.
Volume distribution for both the fallen (blue) and the potentially unstable (red) blocks for sub-region U3.


Figure 18.
Volume distribution for both the fallen (blue) and the potentially unstable (red) blocks for sub-region U4.
Figure 18.
Volume distribution for both the fallen (blue) and the potentially unstable (red) blocks for sub-region U4.


Figure 19.
Volume distribution for both the fallen (blue) and the potentially unstable (red) blocks for the whole slope.
Figure 19.
Volume distribution for both the fallen (blue) and the potentially unstable (red) blocks for the whole slope.

Figure 20.
Location of main release points for rock blocks (seeders) and the trajectories of the potential blocks for: (a) sub-region U1 (b) sub-region U2 (c) sub-region U3 and (d) sub-region U4.
Figure 20.
Location of main release points for rock blocks (seeders) and the trajectories of the potential blocks for: (a) sub-region U1 (b) sub-region U2 (c) sub-region U3 and (d) sub-region U4.

Figure 21.
The visual interpretation of the results of the rockfall hazard and risk assessment with: (a) the hazard map and (b) the risk map along the cliff of Kipinas monastery.
Figure 21.
The visual interpretation of the results of the rockfall hazard and risk assessment with: (a) the hazard map and (b) the risk map along the cliff of Kipinas monastery.


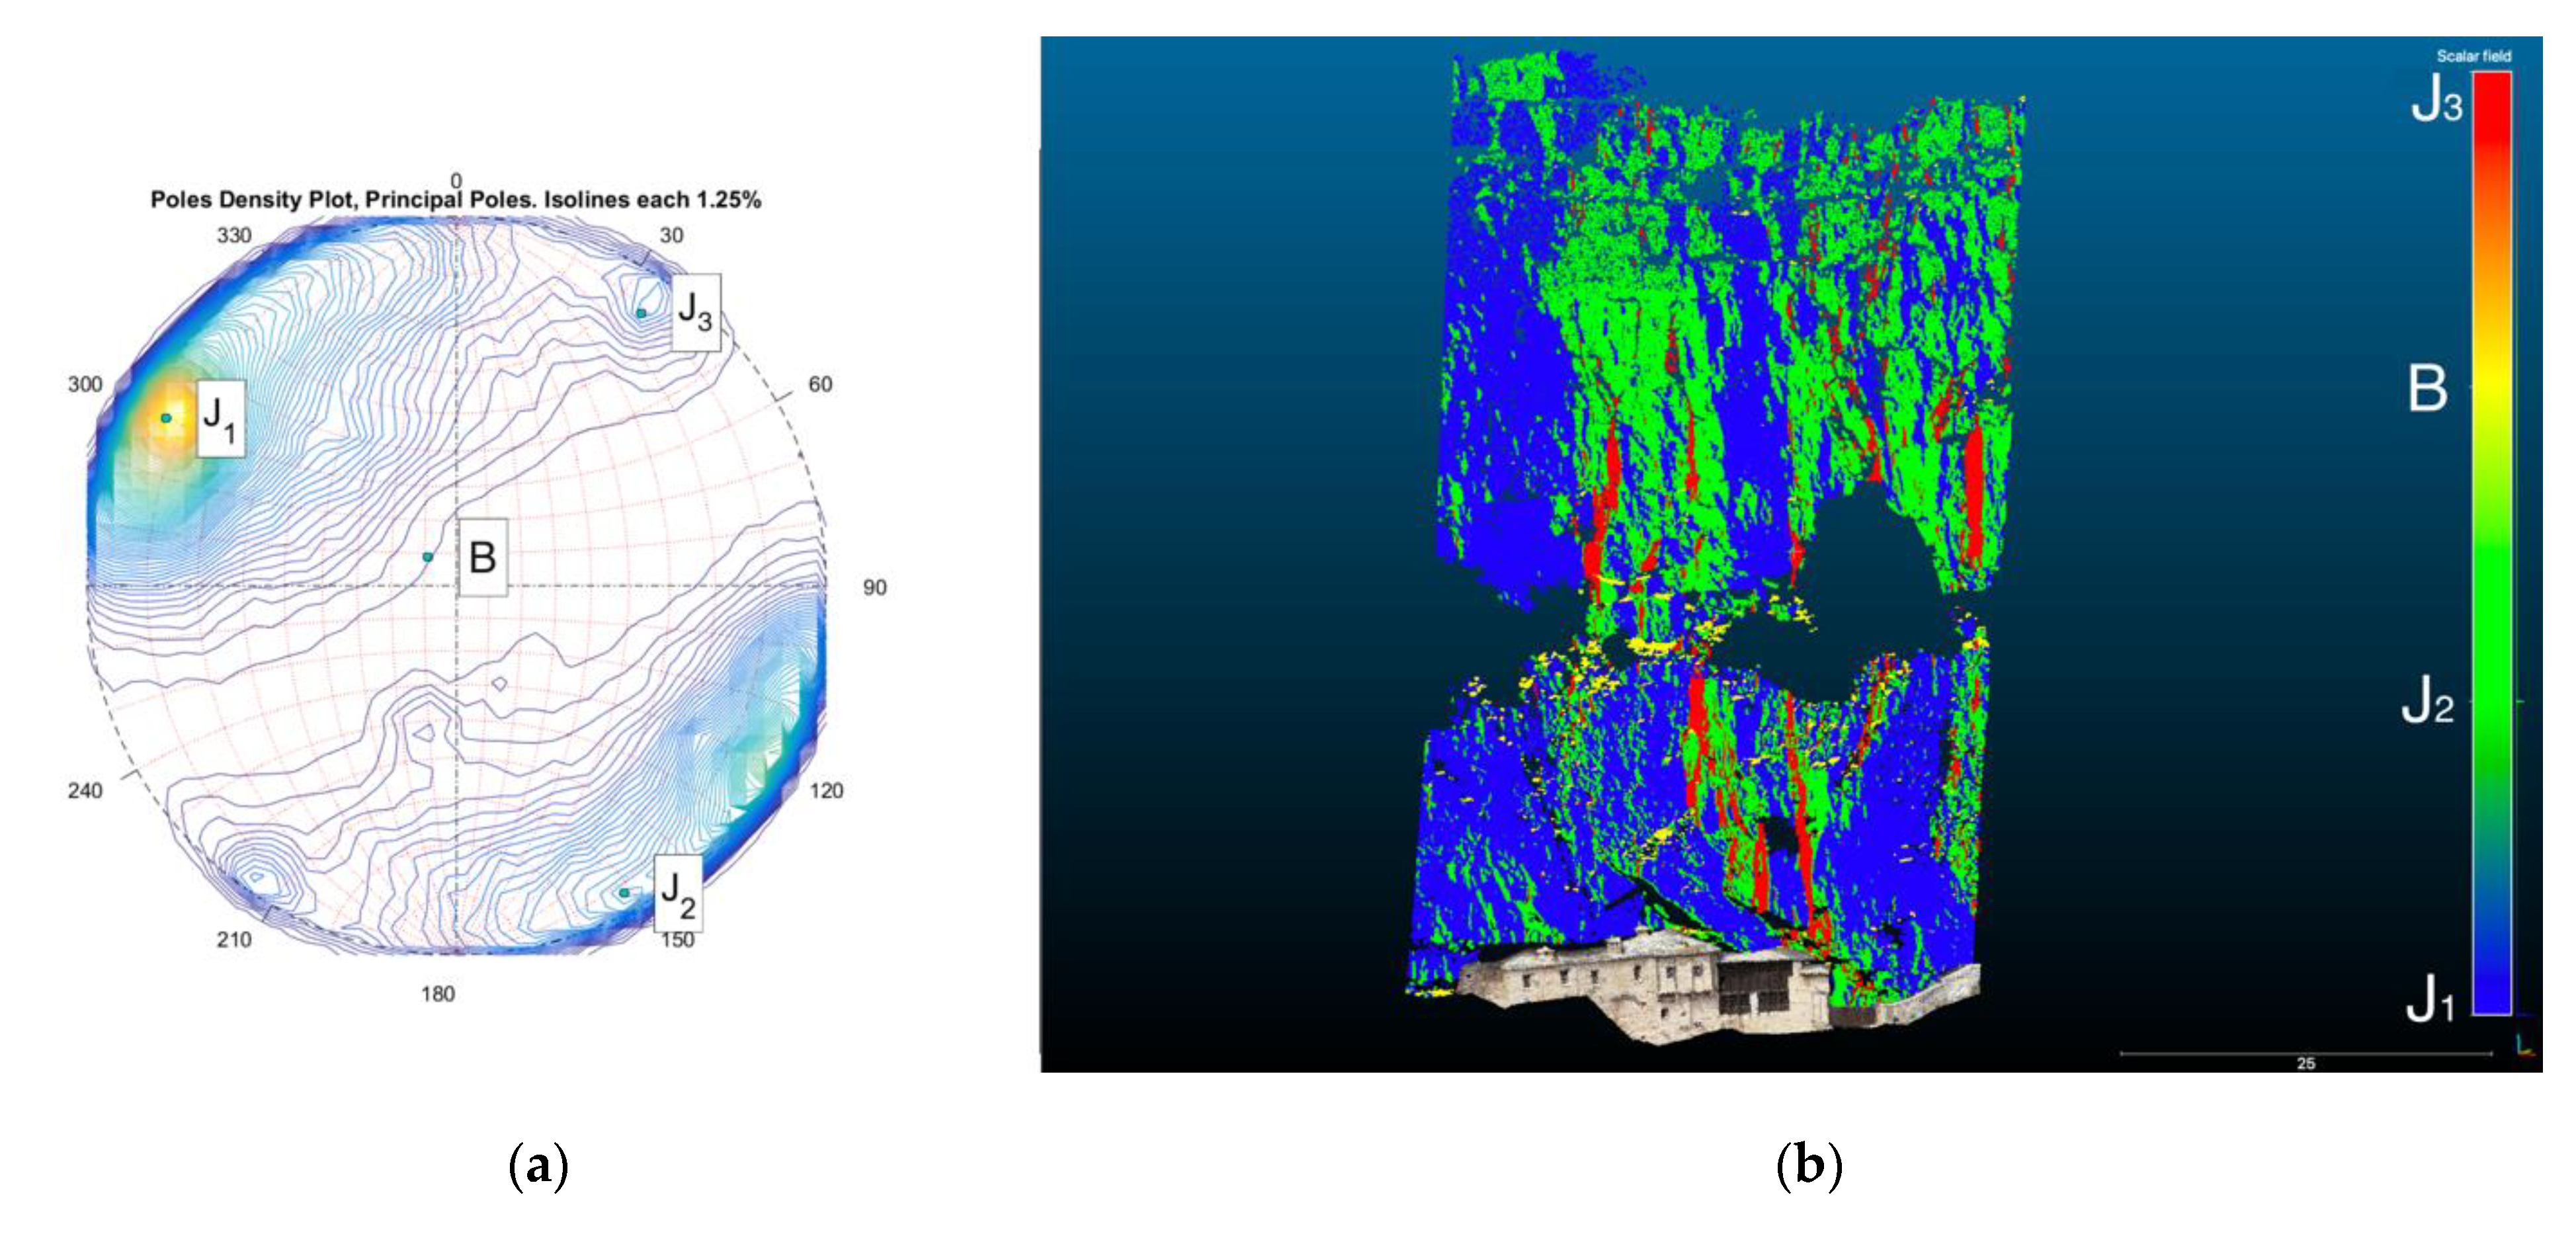
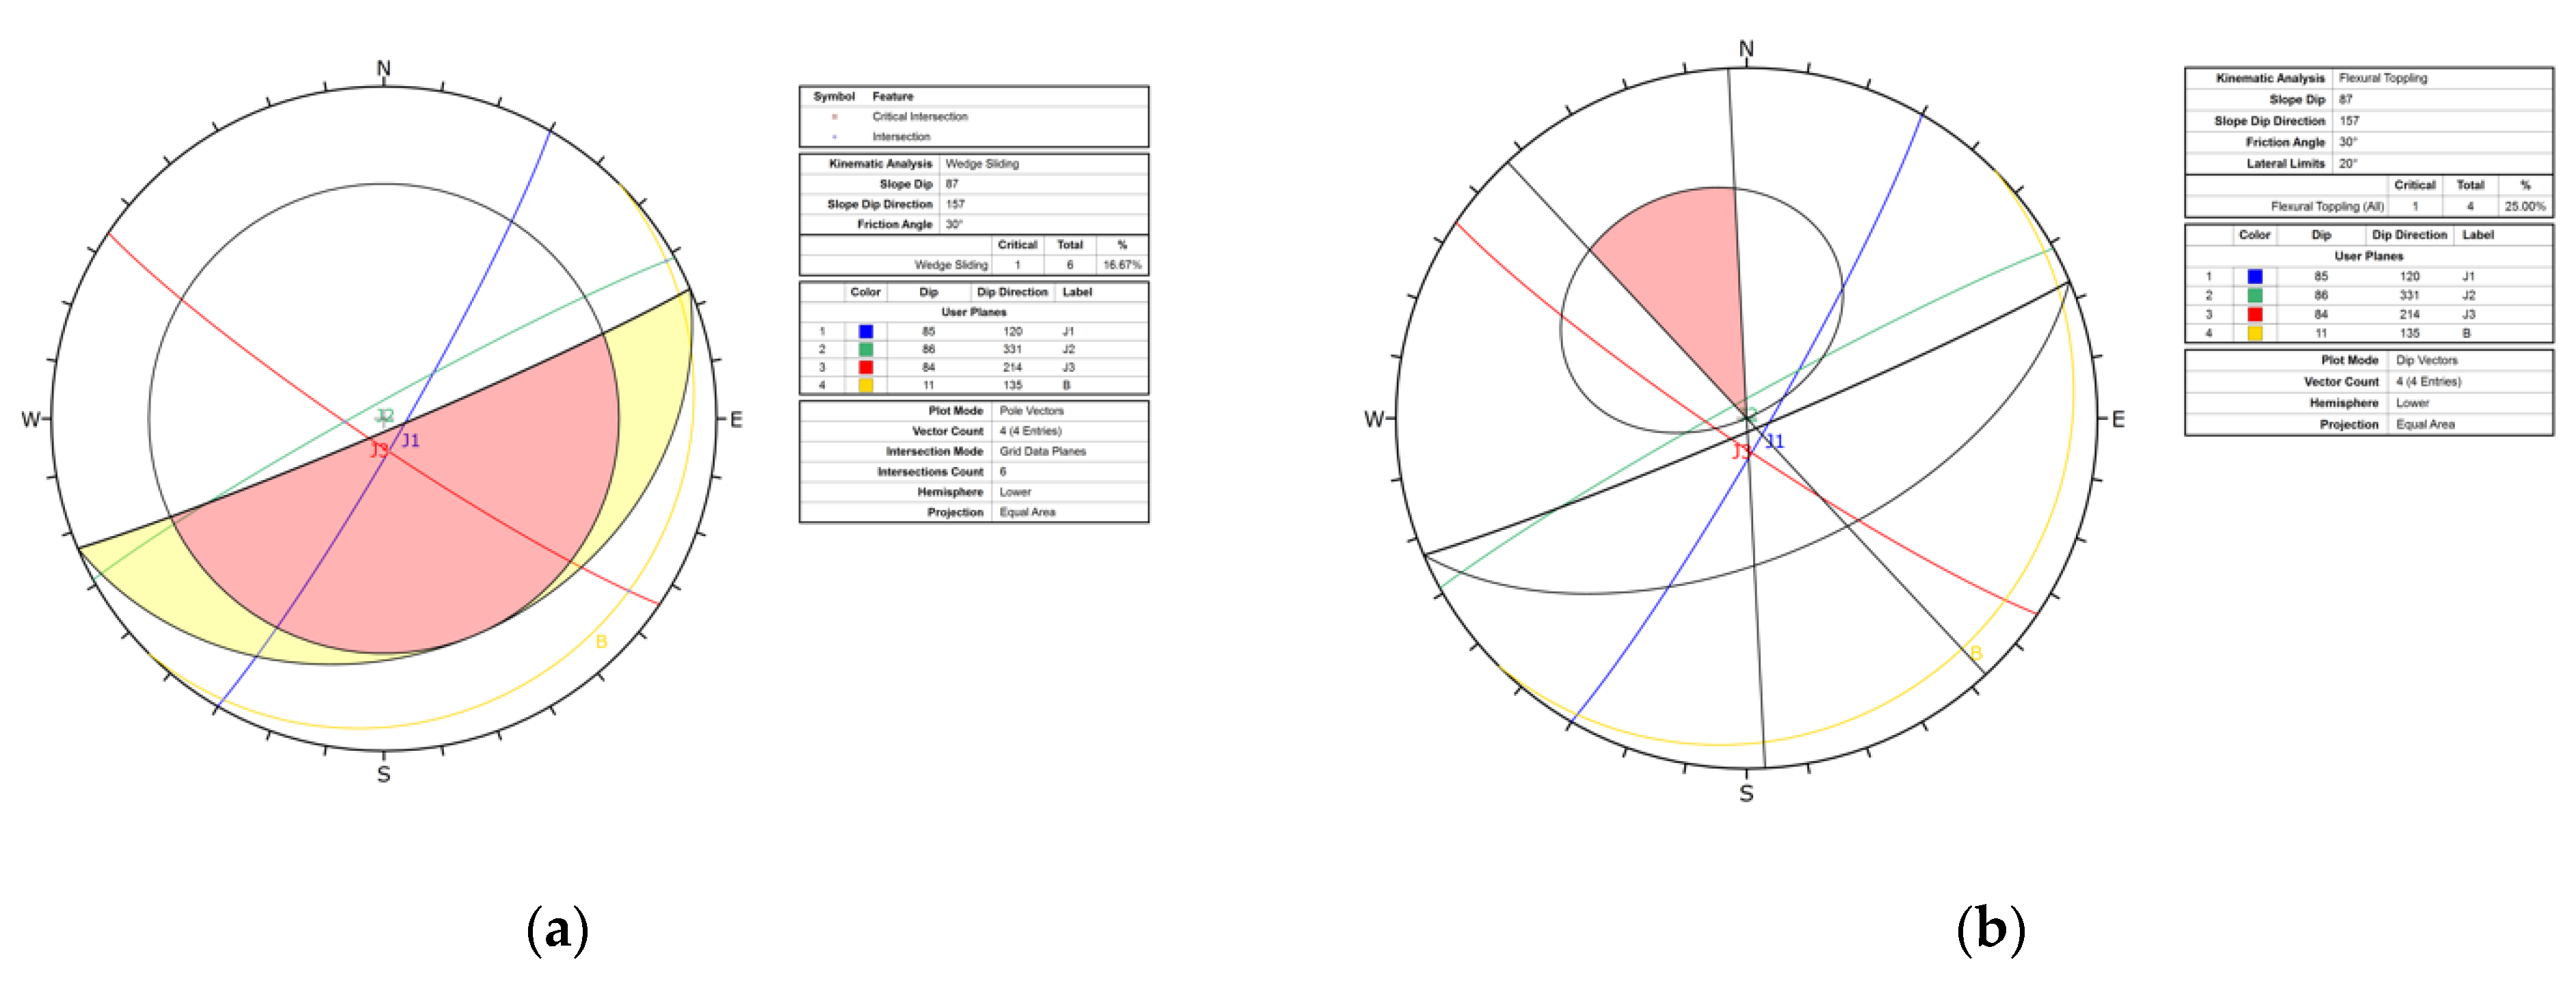
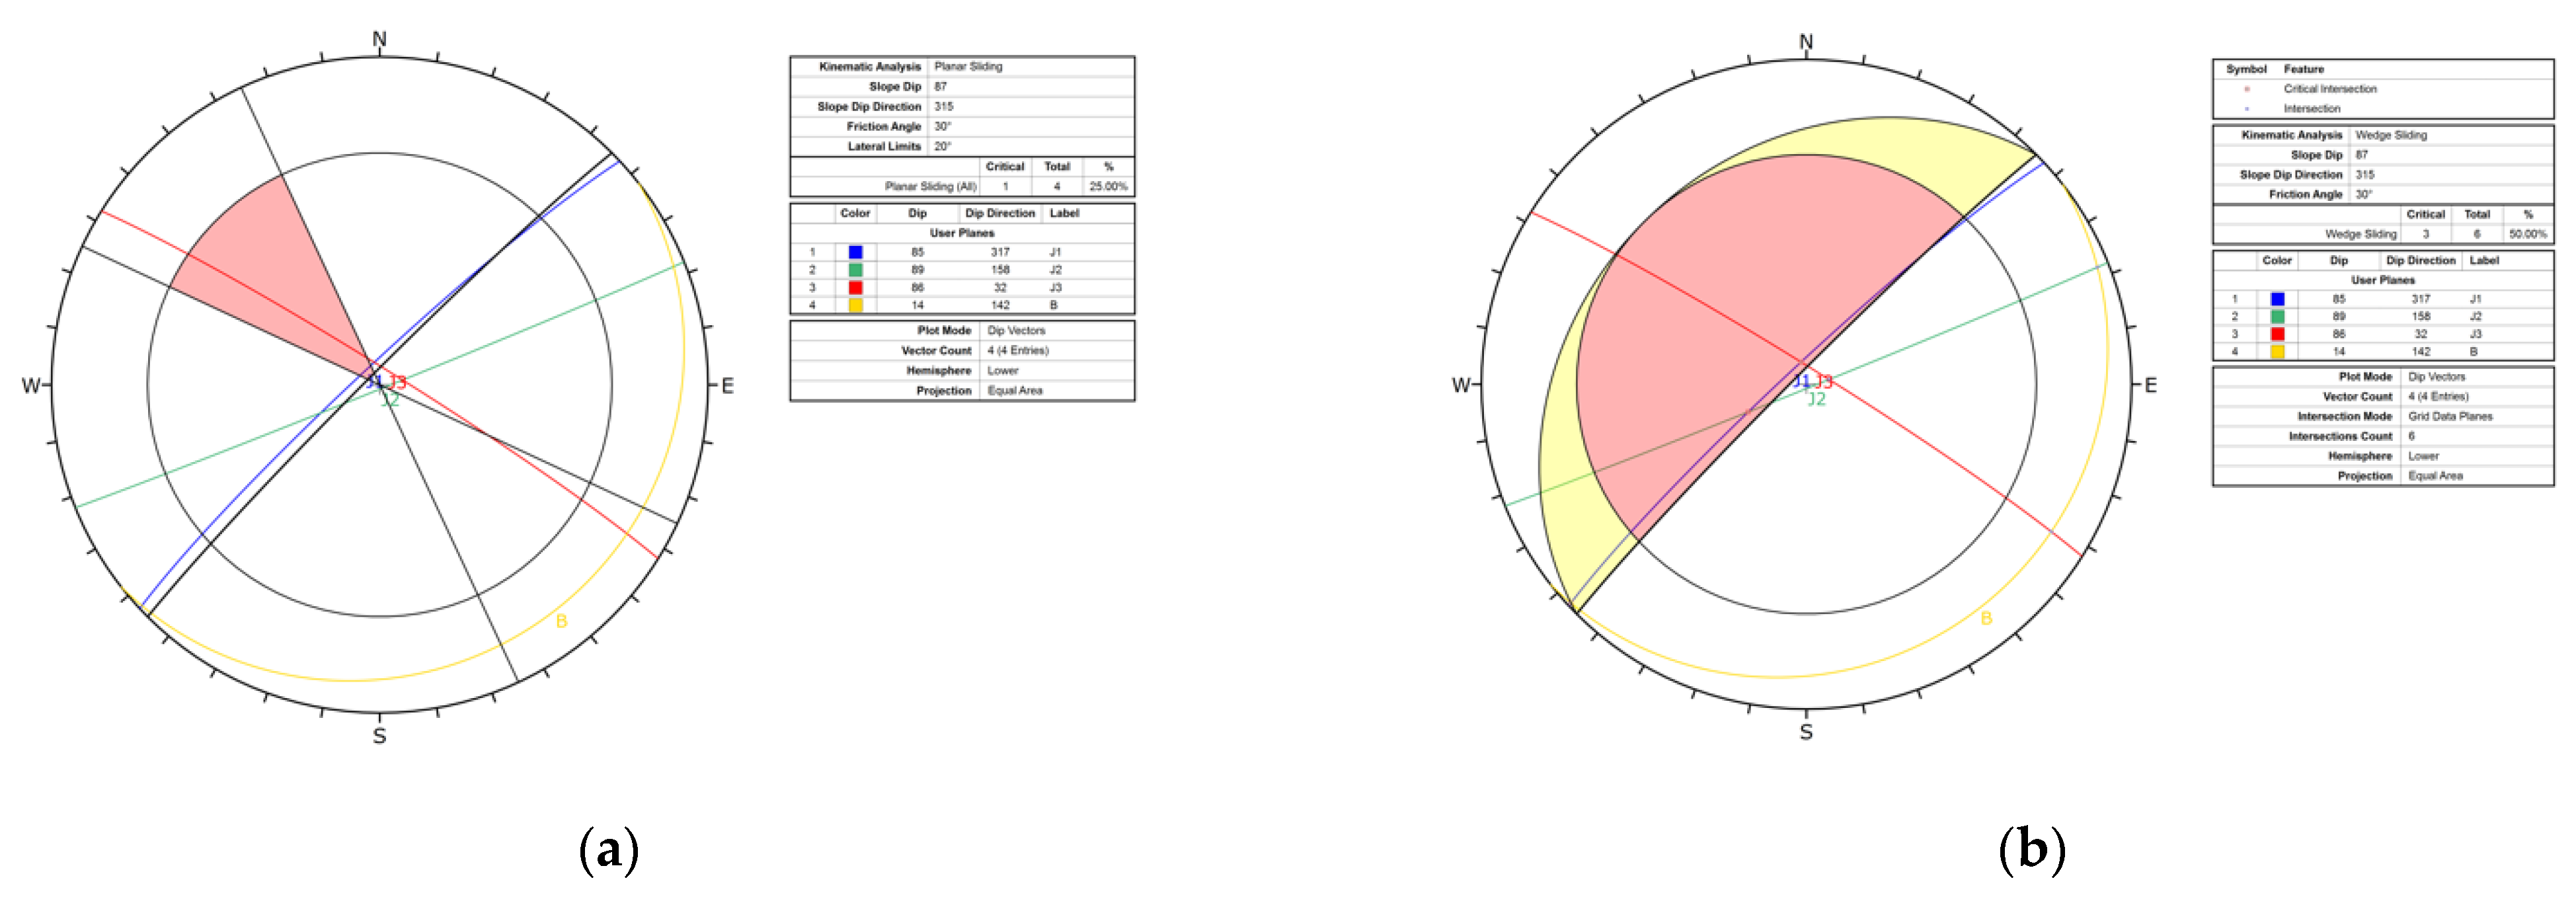
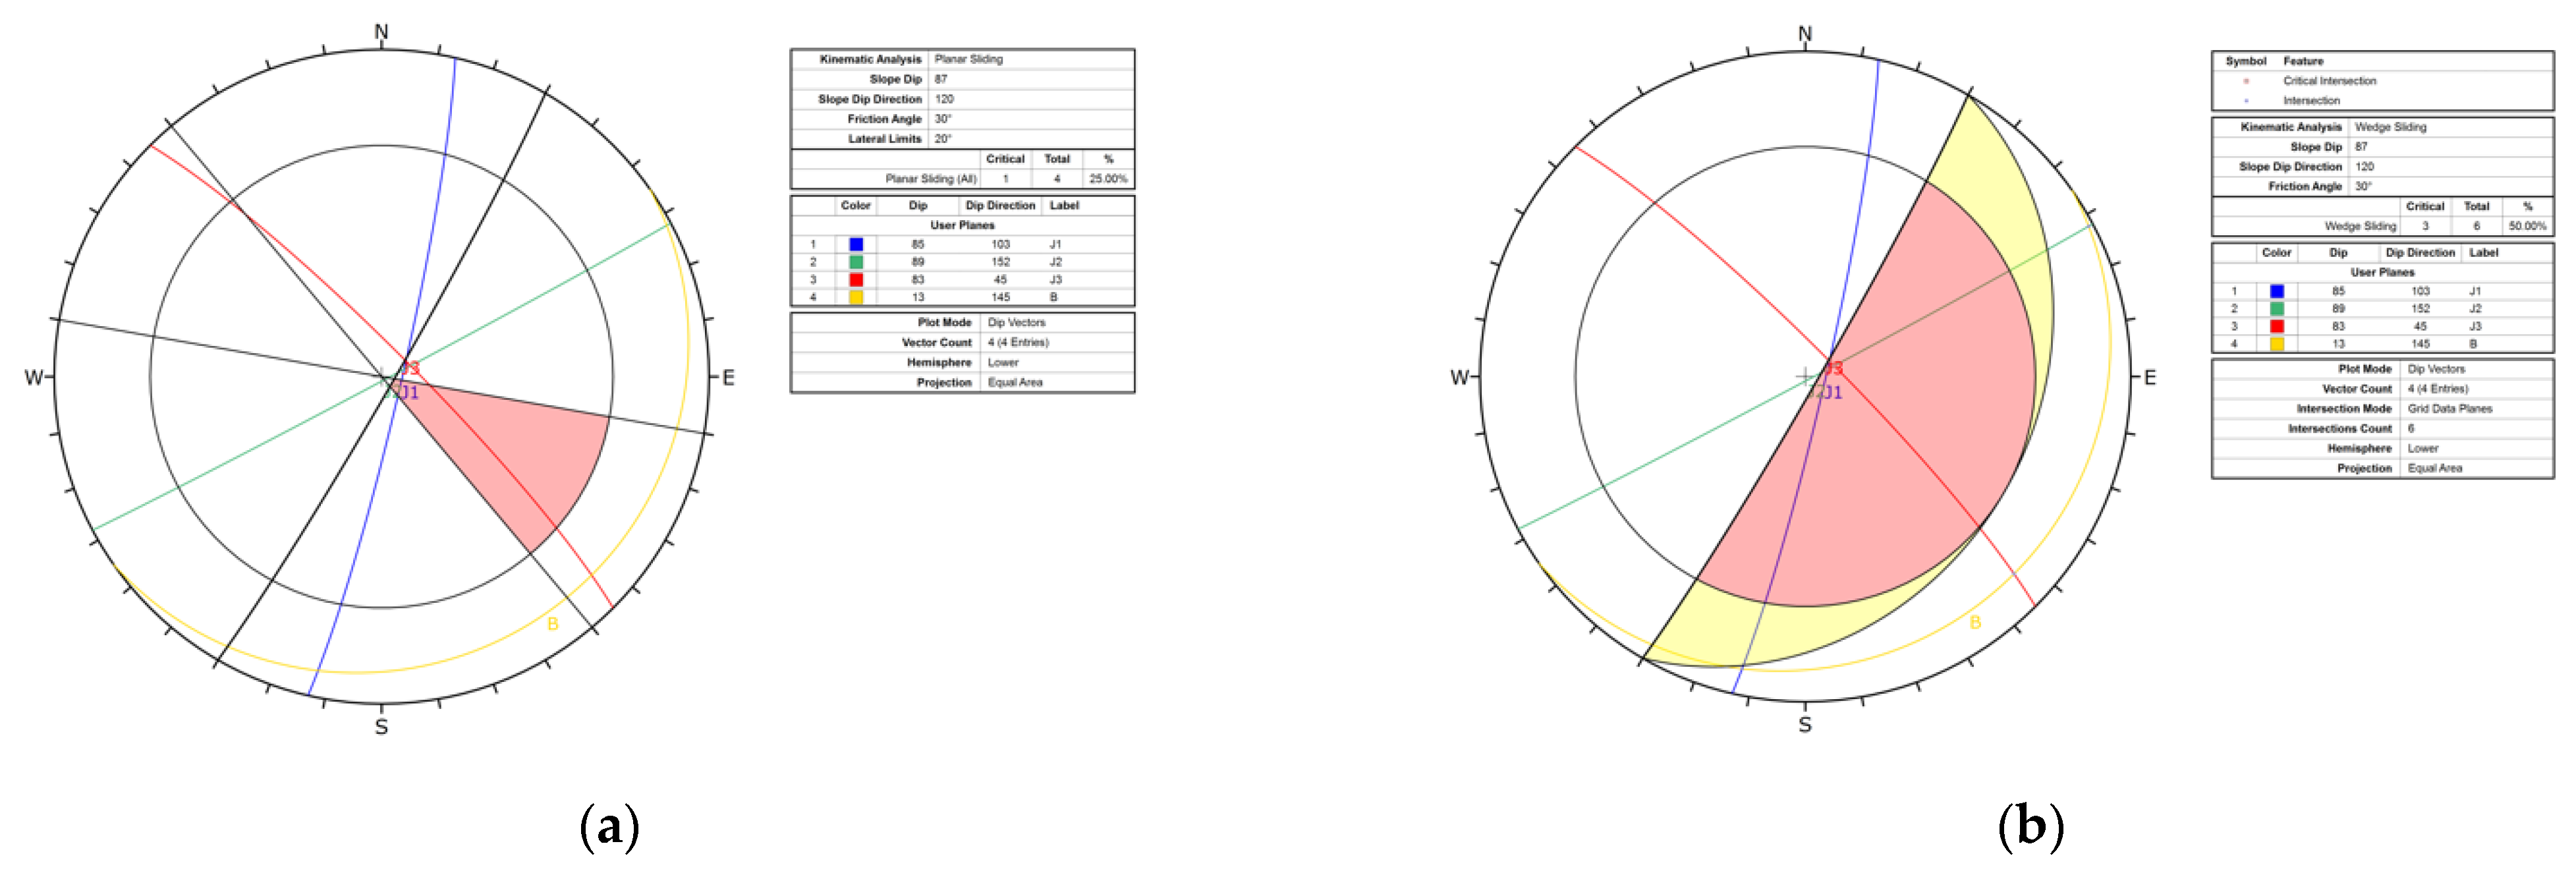
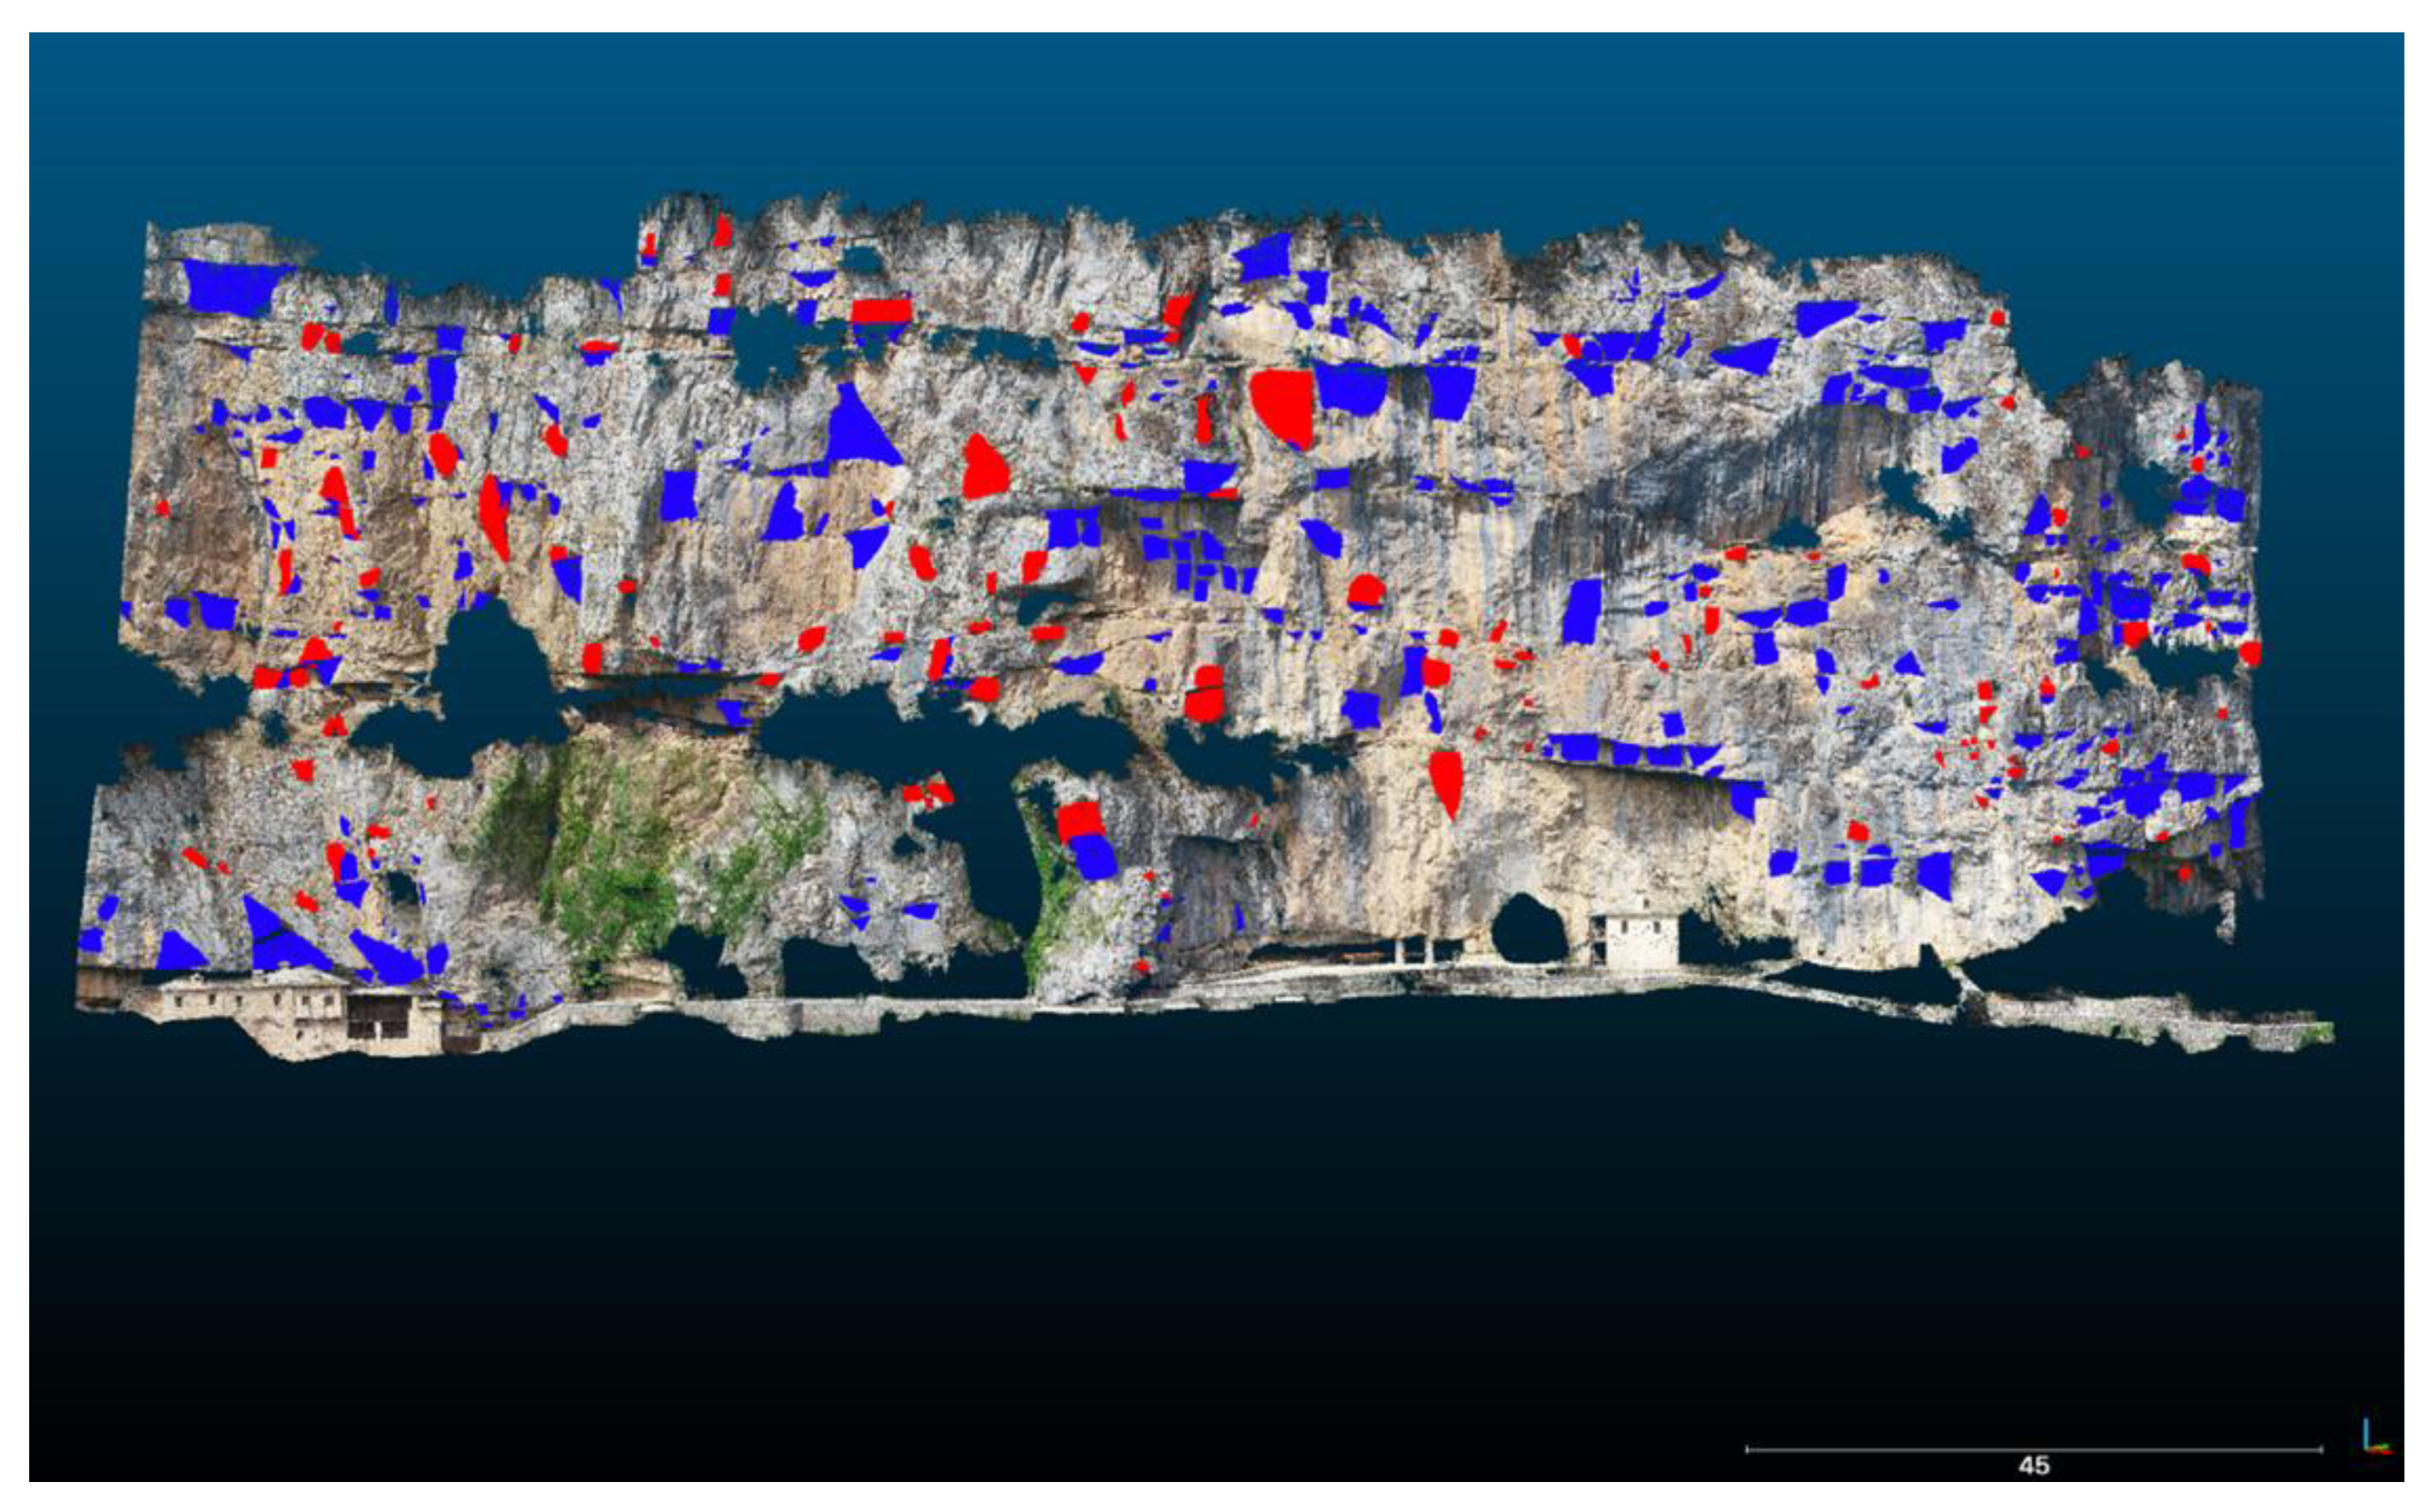
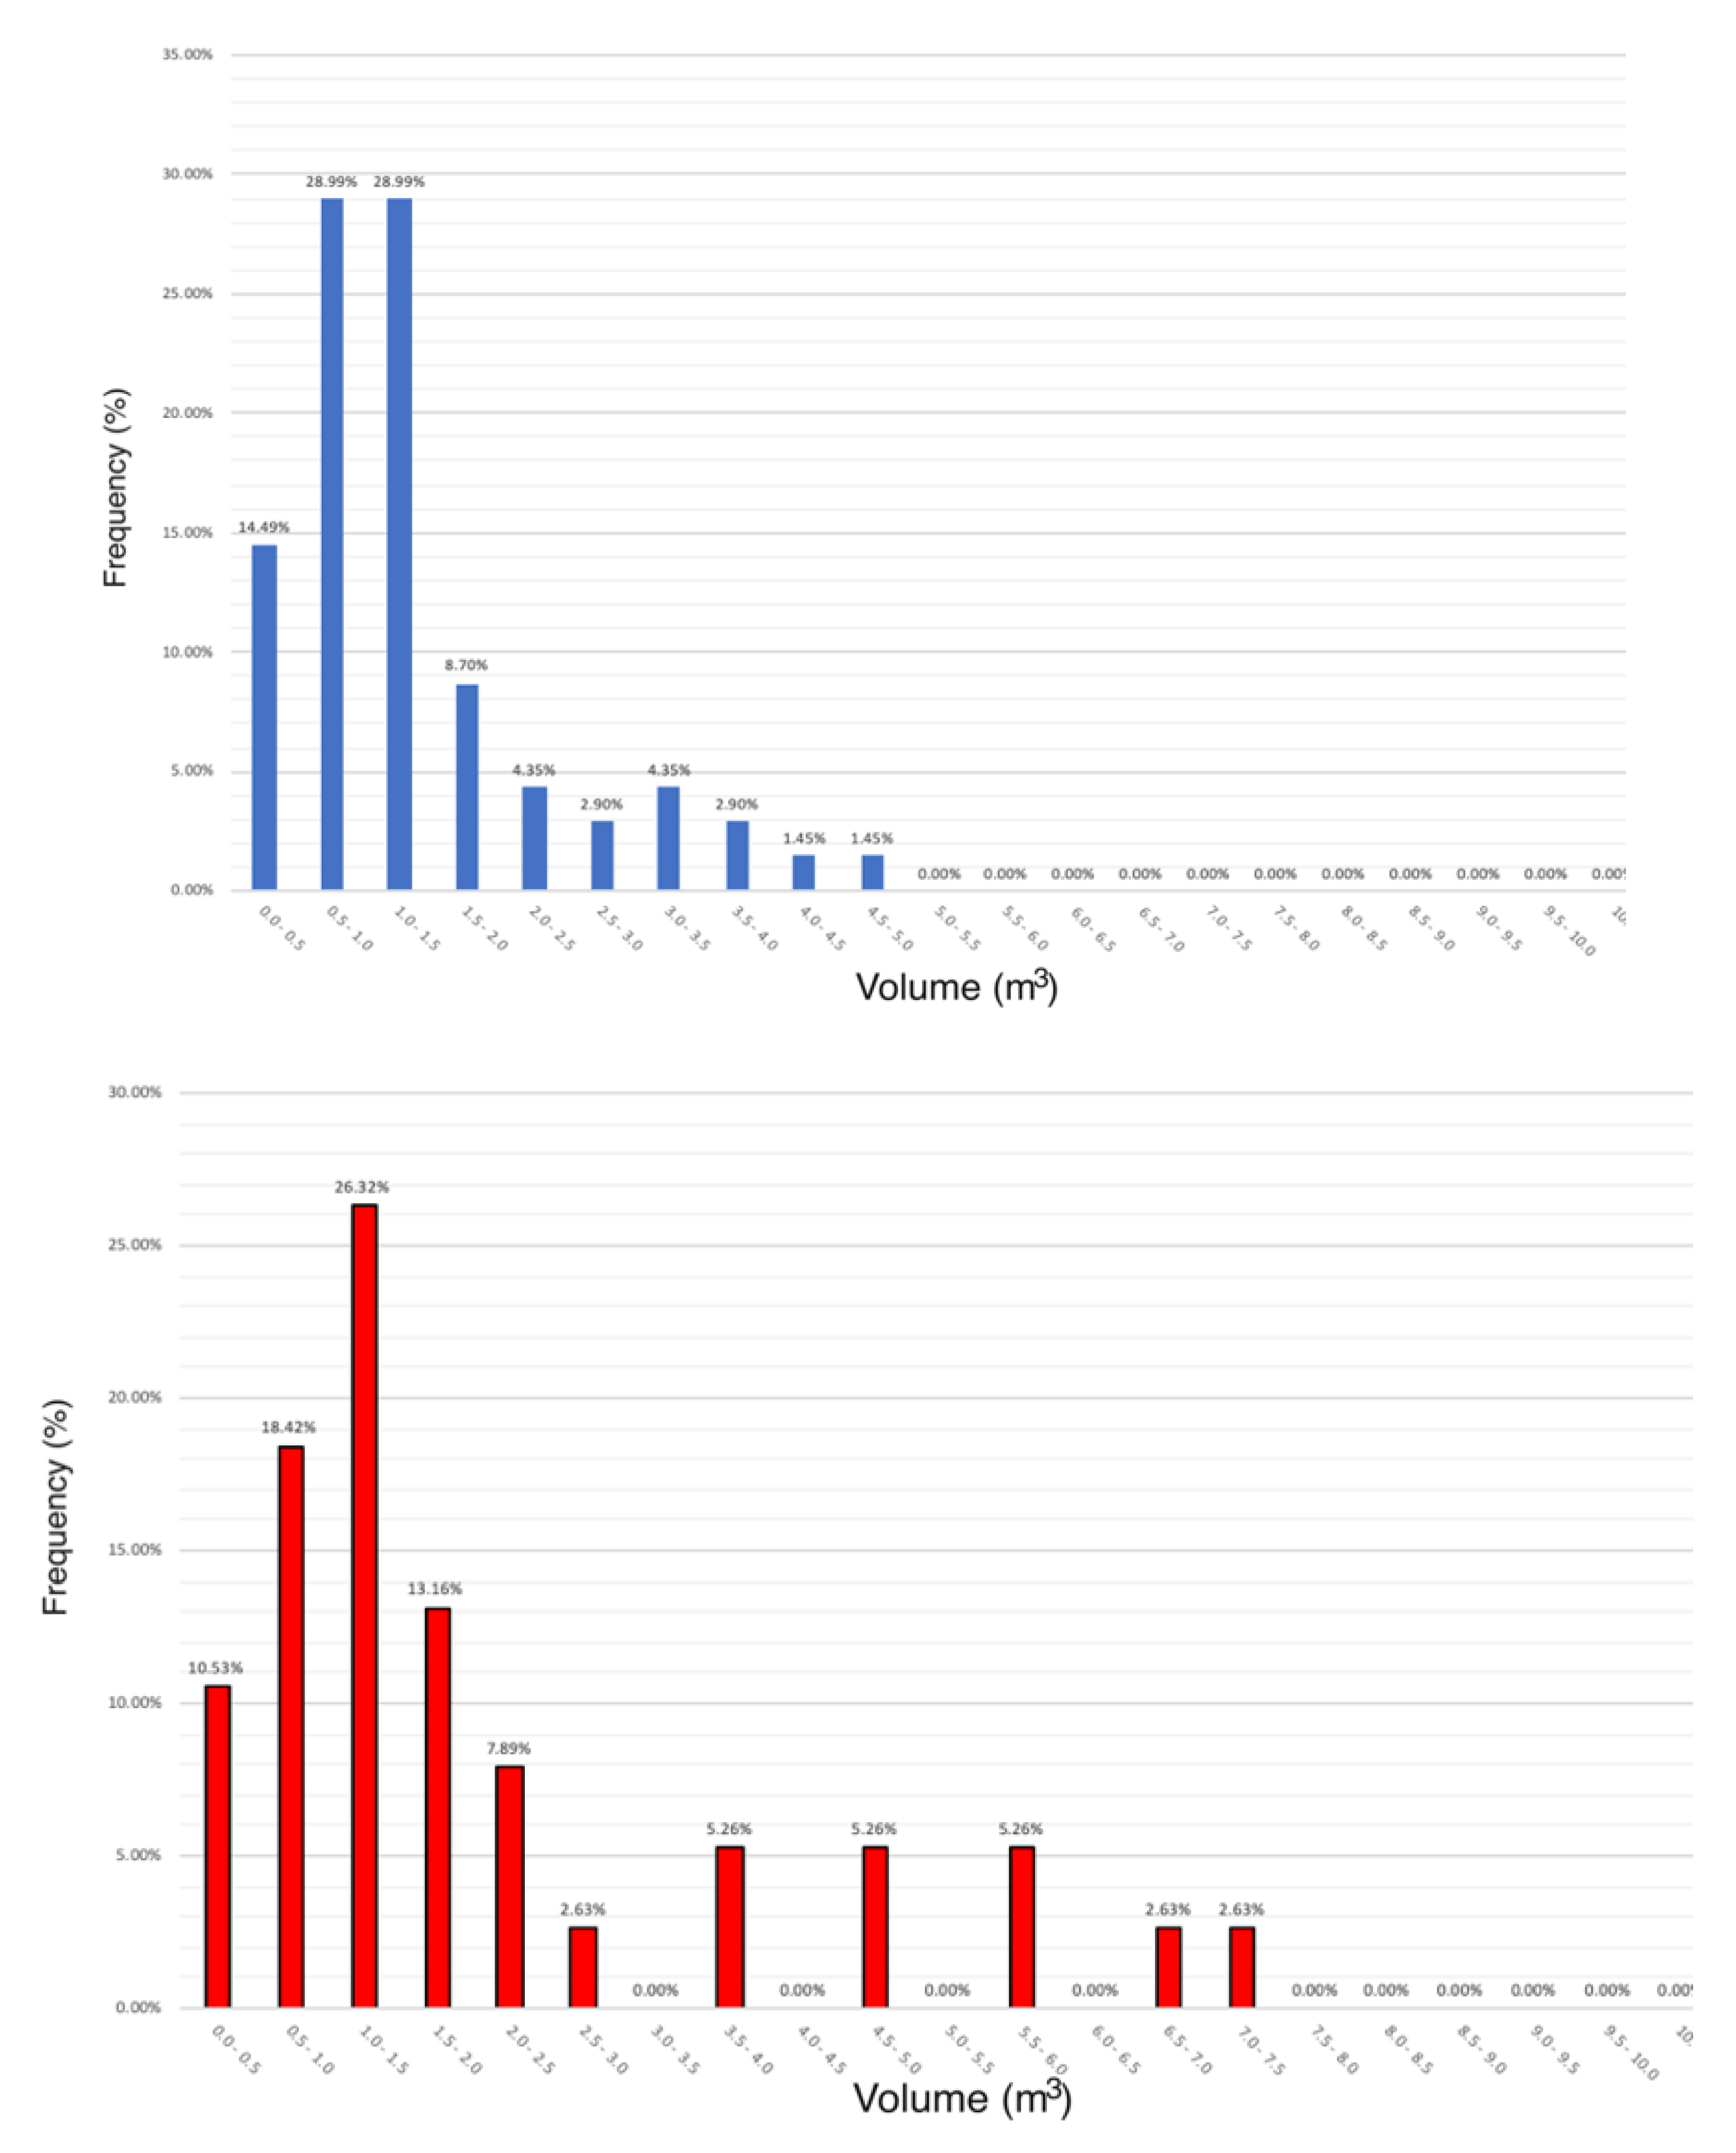
Table 1.
Main characteristics of the sub-regions that the initial point cloud was segmented into.
| Sub-Region | Area Dimension (m2) | Slope Dip/Dip Direction |
|---|---|---|
| U1 | 2427 | 87/157 |
| U2 | 3152 | 85/130 |
| U3 | 3594 | 87/315 |
| U4 | 909 | 87/120 |
Table 2.
Main characteristics of the DSE-extracted major discontinuity sets per sub-region.
| Sub-Region | Set | Dip/Dip Direction | Density | % |
|---|---|---|---|---|
| U1 | J1 | 85/120 | 2.76 | 48.44 |
| J2 | 86/331 | 0.76 | 27.17 | |
| Β | 11/135 | 0.09 | 1.78 | |
| J3 | 84/214 | 0.40 | 8.26 | |
| U2 | J1 | 82/126 | 2.12 | 57.88 |
| J2 | 80/190 | 0.33 | 12.13 | |
| Β | 10/134 | 0.18 | 2.39 | |
| J3 | 87/215 | 0.15 | 2.19 | |
| U3 | J1 | 85/317 | 2.15 | 62.57 |
| J2 | 89/158 | 0.73 | 23.98 | |
| Β | 14/142 | 0.11 | 1.37 | |
| J3 | 86/032 | 0.09 | 1.13 | |
| U4 | J1 | 85/103 | 2.65 | 67.63 |
| J2 | 89/152 | 0.12 | 15.38 | |
| Β | 13/145 | 0.09 | 2.01 | |
| J3 | 83/045 | 0.15 | 4.23 |
Table 3.
A concise review of the kinematic analysis per sub-region.
| Sub-Region | Type of Failure | Contributed Discontinuity Sets |
|---|---|---|
| U1 | Wedge | J1 & J3 |
| Toppling | J2 | |
| U2 | Planar | J1 |
| Wedge | J1 & J2 | |
| Wedge | J1 & J3 | |
| Wedge | J2 & J3 | |
| U3 | Planar | J1 |
| Wedge | J1 & J2 | |
| Wedge | J1 & Β | |
| Wedge | J1 & J3 | |
| U4 | Planar | J1 |
| Wedge | J1 & J2 | |
| Wedge | J1 & J3 | |
| Wedge | J2 & J3 |
Table 4.
The distribution of the already failed and the potentially unstable rock blocks per sub-region.
Table 4.
The distribution of the already failed and the potentially unstable rock blocks per sub-region.
| Sub-Region | Failed Blocks | Potentially Unstable Blocks |
|---|---|---|
| U1 | 86 | 32 |
| U2 | 69 | 38 |
| U3 | 99 | 45 |
| U4 | 72 | 14 |
| SUM | 326 | 129 |
Table 5.
The exports from the trajectometry simulations, executed by RocFall software.
| Sub-Region | Release Point Location | Release Height (m) | Rock Block Volume (m3) | Total Kinetic Energy of the Rockfall (kJ) |
|---|---|---|---|---|
| U1 | point a | 46 | 0.9 | – |
| point b | 24 | 1.1 | – | |
| point c | 11 | 0.5 | 69 | |
| U2 | point a | 41 | 0.7 | 429 |
| point b | 34 | 1.2 | 747 | |
| U3 | point a | 47 | 4.4 | 3621 |
| point b | 38 | 1.4 | 1386 | |
| point c | 30 | 1.8 | – | |
| U4 | point a | 41 | 0.4 | 290 |
| point b | 13 | 1.0 | 102 |
Table 6.
The main categories of rating factors and their weight for the proposed rating system.
| Major Category | Weight in Risk Level (%) |
|---|---|
| A. Geometry Factors | 30 |
| B. Geoengineering Factors | 30 |
| C. Triggering Factors | 10 |
| D. Impact Factors | 30 |
Table 7.
The parameters and their rating for the proposed Rockfall Hazard and Risk Rating System.
| Category | Factor | Weight | Rating | |||
|---|---|---|---|---|---|---|
| A. | 1. Slope height (m) | 5% | <10 | 10–30 | 30–60 | >60 |
| Rating | 10 | 30 | 60 | 100 | ||
| 2. Slope angle (°) | 7% | 20–45 | 45–55 | 55–70 | >70 | |
| Rating | 10 | 30 | 60 | 100 | ||
| 3. Slope roughness | 2% | Planar rough | Planar smooth | Inclined smooth | Inclined rough | |
| Rating | 10 | 30 | 60 | 100 | ||
| 4. Main seeder height (m) | 8% | <H/4 | H/4–H/2 | H/2–2H/3 | 2H/3–H | |
| Rating | 10 | 30 | 60 | 100 | ||
| 5. Slope vegetation | 3% | Dense (high trees) | Dense (low bushes) | Sparse | None | |
| Rating | 10 | 30 | 60 | 100 | ||
| 6. Catchment zone obstacles | 5% | Dense (trees and big rock pillars) | Moderate (small bushes) | Sparse (grass and dirt) | None | |
| Rating | 10 | 30 | 60 | 100 | ||
| B. | 7. Joint(s) orientation | 4% | Favorable for stability | Moderate | Adverse | Very adverse |
| Rating | 10 | 30 | 60 | 100 | ||
| 8. Joint(s) persistence (m) | 2% | <2 | 2–4 | 4–8 | >8 | |
| Rating | 10 | 30 | 60 | 100 | ||
| 9. Strength of intact rock (MPa) | 1% | <25 | 25–50 | 50–100 | >100 | |
| Rating | 10 | 30 | 60 | 100 | ||
| 10. Tensile strength (MPa) | 1% | <2 | 2–7 | 7–12 | >12 | |
| Rating | 10 | 30 | 60 | 100 | ||
| 11. Rock mass structure | 3% | Intact | Foliated–disintegrated | Very blocky | Blocky | |
| Rating | 10 | 30 | 60 | 100 | ||
| 12. Rock mass weathering | 2% | None | Slight (limited only in joints) | Moderate (limited only in joints) | High (both in joints and the intact rock) | |
| Rating | 10 | 30 | 60 | 100 | ||
| 13. Fallen blocks per m2 | 3% | <0.010 | 0.010–0.030 | 0.030–0.060 | >0.060 | |
| Rating | 10 | 30 | 60 | 100 | ||
| 14. Prone blocks per m2 | 2% | <0.005 | 0.005–0.010 | 0.010–0.030 | >0.030 | |
| Rating | 10 | 30 | 60 | 100 | ||
| 15. Mode fallen rock block volume (m3) | 3.5% | <1 | 1–3 | 3–5 | >5 | |
| Rating | 10 | 30 | 60 | 100 | ||
| 16. Mode prone rock block volume (m3) | 3.5% | <1 | 1–3 | 3–5 | >5 | |
| Rating | 10 | 30 | 60 | 100 | ||
| 17. Kinetic energy (kJ) | 5% | <100 | 100–400 | 400–1000 | >1000 | |
| Rating | 10 | 30 | 60 | 100 | ||
| C. | 18. Precipitation conditions | 1.5% | Seldom | Seasonal | Often | Very often |
| Rating | 10 | 30 | 60 | 100 | ||
| 19. Precipitation severity | 1.5% | Low | Moderate | High | Very high | |
| Rating | 10 | 30 | 60 | 100 | ||
| D. | 20. Rock mass permeability | 3% | Very high | High | Moderate | Low |
| Rating | 10 | 30 | 60 | 100 | ||
| 21. Seismic acceleration coefficient (m/s2) | 4% | <0.16 | 0.16–0.24 | 0.24–0.36 | >0.36 | |
| Rating | 10 | 30 | 60 | 100 | ||
| 22. Human presence | 15% | Negligible | Low | Moderate | High | |
| Rating | 10 | 30 | 60 | 100 | ||
| 23. Value of structures | 15% | Negligible (i.e., unmade roads) | Low (i.e., tarmac roads) | Moderate (i.e., houses) | High (i.e., monuments) | |
| Rating | 10 | 30 | 60 | 100 | ||
Table 8.
Rockfall hazard level classification based on the proposed rating system.
| Hazard Class | Score Range | Hazard Level | Visual Interpretation |
|---|---|---|---|
| I | 0–14 | Very low | Blue color |
| II | 15–28 | Low | Green color |
| III | 29–42 | Moderate | Yellow color |
| IV | 43–56 | High | Amber color |
| V | 57–70 | Very high | Red color |
Table 9.
Rockfall risk level classification based on the proposed rating system.
| Risk Class | Score Range | Risk Level | Visual Interpretation |
|---|---|---|---|
| I | 0–20 | Very low | Blue color |
| II | 21–40 | Low | Green color |
| III | 41–60 | Moderate | Yellow color |
| IV | 61–80 | High | Amber color |
| V | 81–100 | Very high | Red color |
Table 10.
The hazard and risk assessment results for each sub-region in Kipinas Monastery.
| Sub-Region | Hazard Score | Hazard Level | Risk Score | Risk Level |
|---|---|---|---|---|
| U1 | 40 | III (Moderate) | 70 | IV (High) |
| U2 | 46 | IV (High) | 59.5 | III (Moderate) |
| U3 | 53.54 | IV (High) | 77.45 | IV (High) |
| U4 | 41 | III (Moderate) | 50 | III (Moderate) |
Publisher’s Note: MDPI stays neutral with regard to jurisdictional claims in published maps and institutional affiliations. |
© 2021 by the authors. Licensee MDPI, Basel, Switzerland. This article is an open access article distributed under the terms and conditions of the Creative Commons Attribution (CC BY) license (https://creativecommons.org/licenses/by/4.0/).
Share and Cite
MDPI and ACS Style
Konstantinidis, I.; Marinos, V.; Papathanassiou, G. UAV-Based Evaluation of Rockfall Hazard in the Cultural Heritage Area of Kipinas Monastery, Greece. Appl. Sci. 2021, 11, 8946. https://0-doi-org.brum.beds.ac.uk/10.3390/app11198946
AMA Style
Konstantinidis I, Marinos V, Papathanassiou G. UAV-Based Evaluation of Rockfall Hazard in the Cultural Heritage Area of Kipinas Monastery, Greece. Applied Sciences. 2021; 11(19):8946. https://0-doi-org.brum.beds.ac.uk/10.3390/app11198946
Chicago/Turabian StyleKonstantinidis, Ioakeim, Vassilis Marinos, and George Papathanassiou. 2021. "UAV-Based Evaluation of Rockfall Hazard in the Cultural Heritage Area of Kipinas Monastery, Greece" Applied Sciences 11, no. 19: 8946. https://0-doi-org.brum.beds.ac.uk/10.3390/app11198946
Note that from the first issue of 2016, this journal uses article numbers instead of page numbers. See further details here.