1. Introduction
With the onset of the fourth industrial revolution (Industry 4.0), the global economy has become more data-centric. Industry 4.0 refers to the means of automation and data sharing in manufacturing technology, including internet of things (IoT), big data and analytics, augmented reality, autonomous robots, and so on [
1]. According to [
2], there are currently more than 10 billion active IoT devices, and this number is expected to increase to 25.4 billion by 2030. The amount of data generated by IoT devices is expected to reach 73.1 zettabytes in 2025 [
2].
As data are the fuel for Industry 4.0 [
1], governments in various countries are interested in using IoT devices to collect data from the public domain. In recent years, public data collected by governments through IoT and non-IoT means has been published on open government data portals (OGDPs) to make them available for citizens to use for their business or research purposes, which will ultimately contribute to a country’s economic growth [
3,
4,
5]. An OGDP is a web-based system that collects existing datasets from various sources and publishes them on user-friendly dashboards that users can view, download, and retrieve via an application programming interface (API) in standardized file formats (CSV, XLSX, JSON, and XML) [
6].
The key characteristics that make an OGDP highly reliable are quality, completeness, accessibility, usability and comprehensibility, timeliness, value and usefulness, and granularity and comparability [
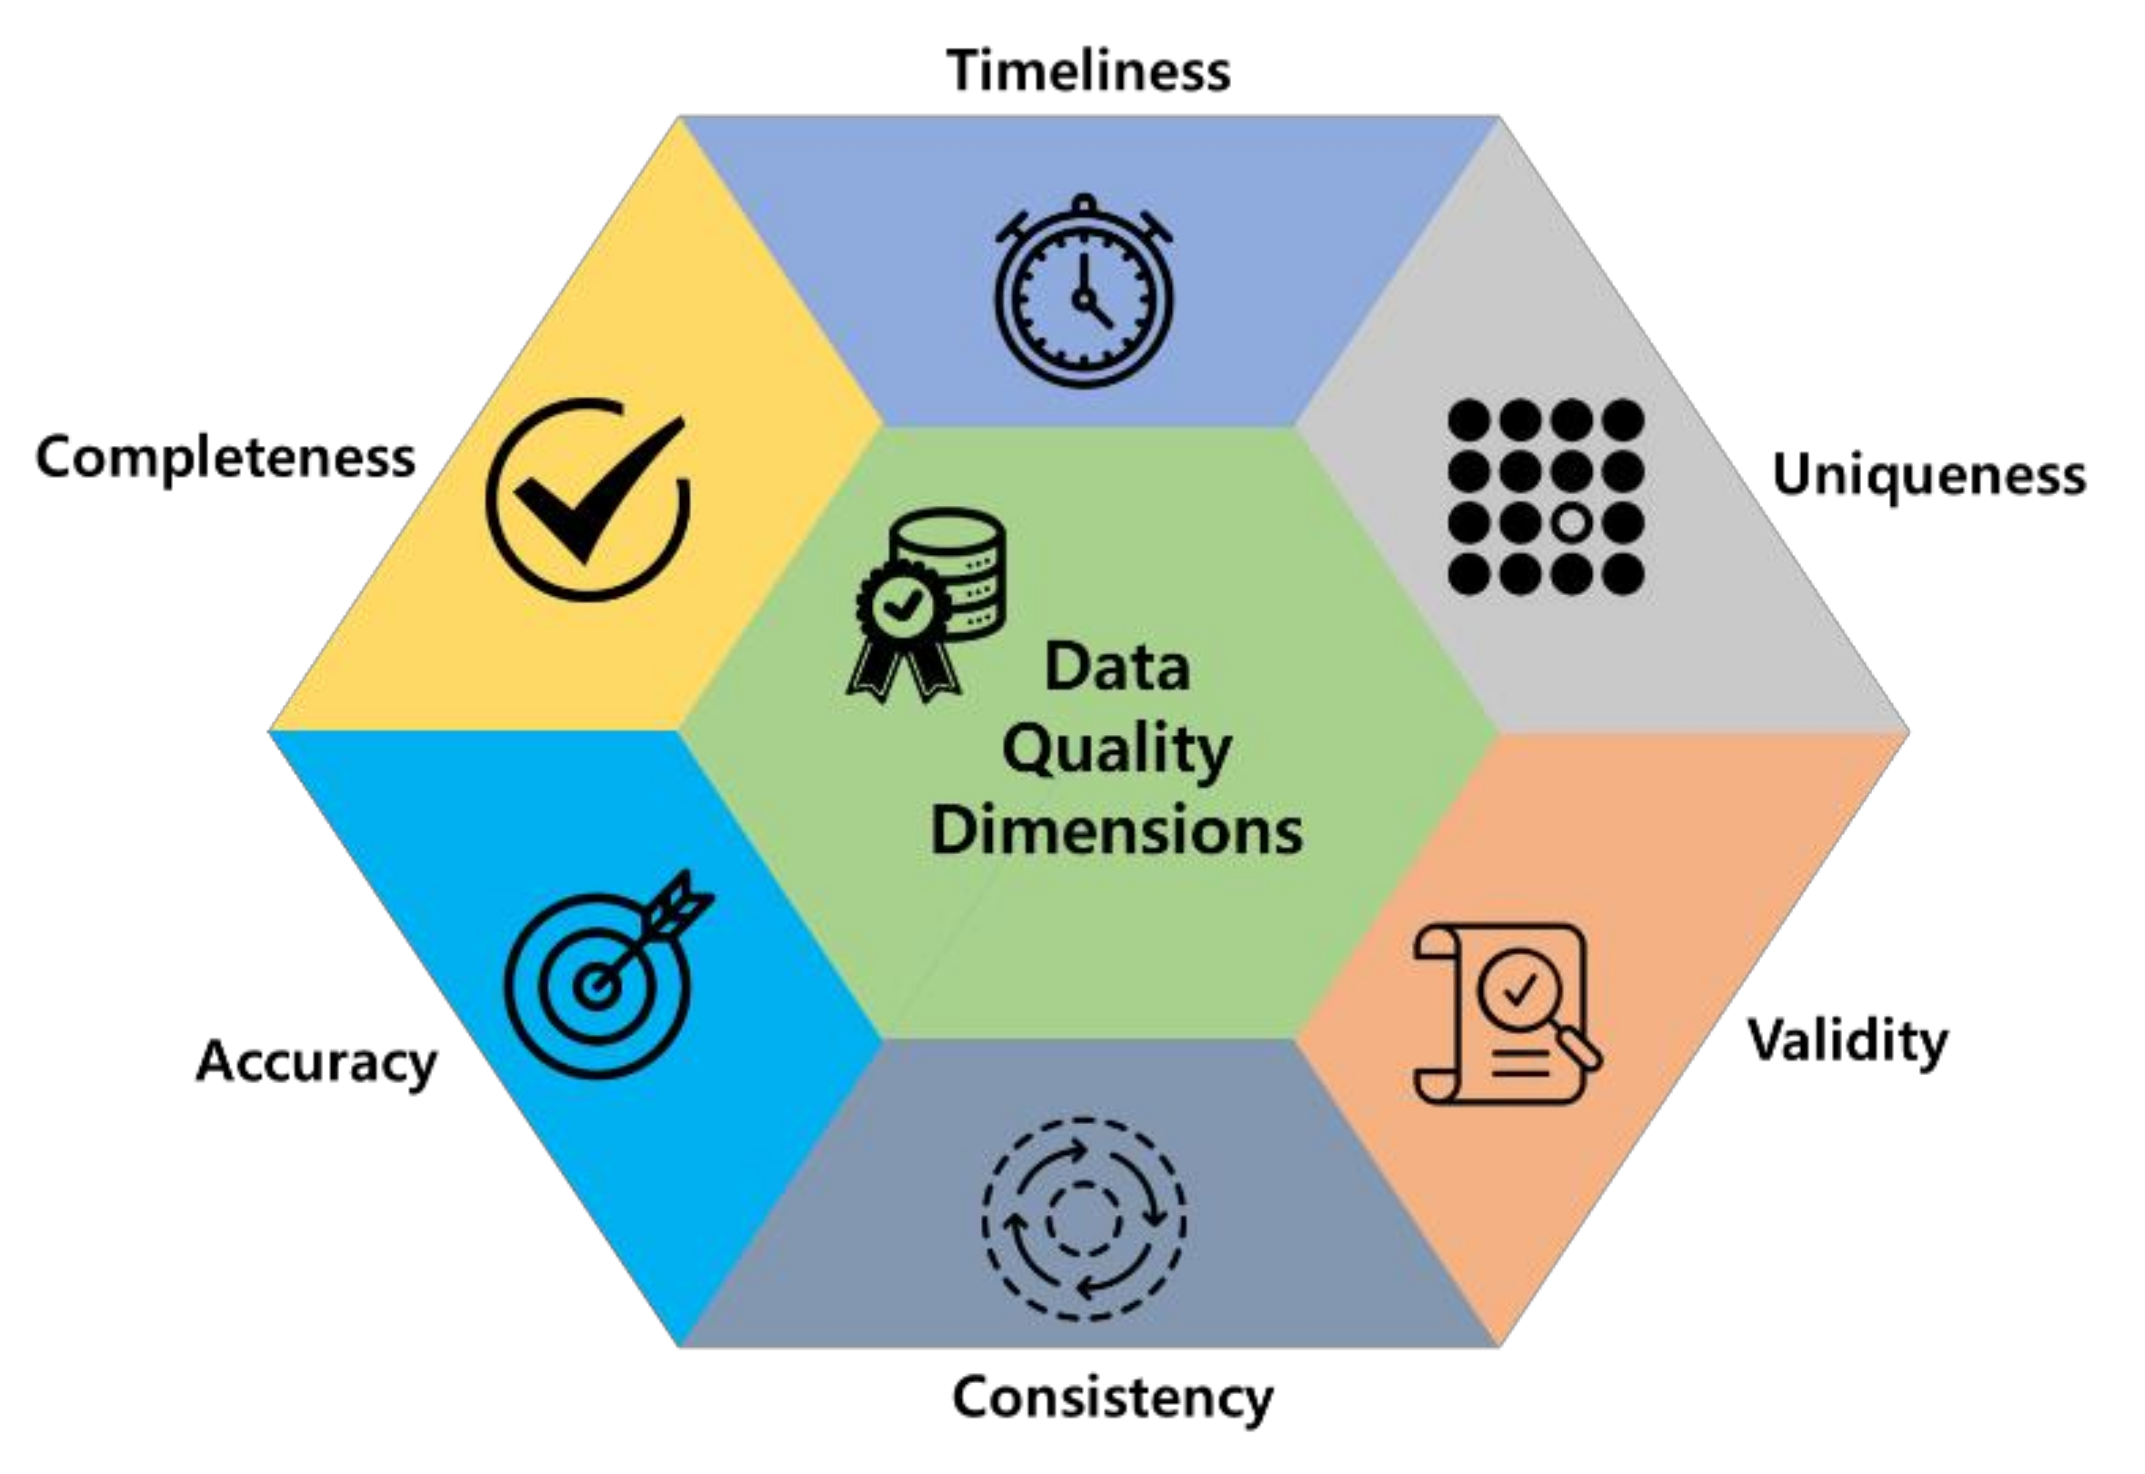
7]. In addition to all these characteristics, the quality of the data plays a crucial role in the success of OGDP, as high-quality data can increase the chance of achieving peak performance. The six characteristics defined by the International Data Management Association (DAMA) to ensure data quality are completeness, uniqueness, timeliness, validity, accuracy, and consistency and are illustrated in
Figure 1 [
8]. These characteristics are defined as follows:
Completeness: ratio between the number of non-null values in a source and the size of the universal relation [
9,
10].
Accuracy: the extent to which data are correct, reliable, and certified [
11].
Consistency: the extent to which data are presented in the same format and compatible with previous data [
11].
Validity: the extent to which data conform to the syntax (format, type, range) of their definitions [
8].
Uniqueness: the extent to which data are not duplicated [
8].
Timeliness: the extent to which age of the data are appropriate for the task at hand [
11].
Figure 1.
Data quality dimensions [
8].
Figure 1.
Data quality dimensions [
8].
With the noticeable increase in the amount and variety of open data released by government agencies around the world, the quality of the data published in the OGDP will determine its future potential [
12]. Since data are the most important resource of the 21st century [
13], good quality data can help users find the data they need more easily [
14], whereas poor quality data in the OGDP jeopardizes the efficient use and reuse of open data [
12,
15,
16].
Furthermore, low data quality increases the cost of accessing and interpreting data [
12] and provides misleading information [
17], which consequently reduces the use of OGDP [
18].
Therefore, to address the problems identified with the poor quality of data stored in OGDP, a framework that automatically examines the quality of data stored in OGDP is needed to motivate the government to invest in improving the data stored in OGDP.
1.1. Related Work
In this sub-section, we present some related work that deals with evaluating the quality of data stored in the OGDP, and are listed in [
6,
12,
19,
20,
21,
22].
In [
6], the quality of OGDPs are assessed at the national level for 67 countries. The quality of the OGDPs was assessed based on evaluation metrics such as the number of datasets on the portals, the number of thematic groups in the portals, the number of tags associated with each dataset, the number of participating organizations, the number of licenses available for open government data (OGD) for publication and reuse, the number of users accessing the OGDP, and questionnaires. The quality of the OGDP cannot be determined solely by the amount of data stored in it. However, this work mainly adopted a quantitative approach to evaluate the quality of the OGDP and did not consider the quality of the individual data stored in the OGDP. Moreover, their work is more of a theoretical framework for evaluating the quality of OGDP rather than a framework that can be converted into tools for automatically calculating the quality of OGDP.
In [
12], a framework for measuring the quality of Italian OGD is presented using data quality dimensions such as completeness, accuracy, traceability, currentness, expiration, conformity, and understandability at the most granular level of measurement. In this work, a qualitative approach is presented to evaluate the quality of the OGD. However, this work also presented a theoretical framework to assess the values of the data quality dimensions. As part of their long-term goal, they have considered the development of an OGD quality framework that can be transformed into a tool to automatically calculate data quality dimensions.
The framework to evaluate the quality of Chinese OGD portals at the provincial level was proposed in [
19] based on metrics such as data quantity, data accessibility, and data quality. In [
20], the quality of government datasets in Chinese regions of Beijing, Guangzhou, and Harbin is quantified based on seven quality dimensions such as completeness, accuracy, consistency, timeliness, uniqueness, and understandability. The conceptual framework is shown in [
21] to classify 10 previous quality assessment frameworks for OGD based on six data quality indicators, namely accuracy, accessibility, completeness, timeliness, consistency, and understandability. The work presented in [
19,
20,
21] consider a qualitative approach for assessing the quality of OGDP; however, these studies only consider a theoretical approach, as in [
6,
12].
In [
22], a general metadata quality assessment framework for 260 OGDPs is presented. This work differs from the work presented in [
6,
12,
19,
20,
21] as it focuses on automatic metadata quality assessment on a weekly basis. The quality of metadata is evaluated using quality metrics such as retrievability, existence, conformance, and openness. Although the work in [
22] focuses on assessing the quality of metadata rather than the main data stored in OGDP, it provides a framework for automatically assessing its quality on a weekly basis.
1.2. Contribution and Organization
To address the drawbacks of the work in [
6,
12,
19,
20,
21,
22] to some extent, this work proposes a framework that can automatically retrieve the quality of data stored in the OGDP in tabular form and visualize them in real-time. In this framework, data quality is quantified using the data completeness ratio (DCR), which is one of the most important metrics for checking data quality as defined by the DAMA [
8]. Here, DCR refers to the percentage of complete cells in the dataset. Mathematically, DCR can be written as [
6]:
In this framework, DCR is only used to evaluate the quality of the data stored in OGDP, since calculating its value does not require any manual work. Apart from DCR, the other data quality metrics cannot be automatically evaluated without manual computation.
In addition to the framework for automatic DCR calculation and real-time visualization, this paper also provides recommendations for improving the DCR of the dataset. To verify the usefulness of our framework, samples from the OGD of South Korea are used for national and provincial level analysis. With our framework, the government agencies that control OGD can evaluate the DCR of the individual dataset stored in their portal and use our recommendation methods to improve the quality of their data before releasing them to the public.
The structure of the paper is as follows.
Section 2 formulates the general framework for automatic computation and visualization of DCR of data stored in OGDP in real-time.
Section 3 presents an implementation of this work using a Django-based framework to compute the DCR of the OGD from South Korea.
Section 4 presents the DCR results of the OGD from South Korea. The obtained results are discussed in
Section 5.
Section 6 provides some recommendations to improve the DCR.
Section 7 presents the limitations of this work.
Section 8 provides a conclusion and roadmap for future work.
2. DCR Check Framework
In this section, an automatic general framework is shown for accessing the quality of OGD in terms of DCR, which is illustrated in
Figure 2.
Figure 2 consists of various modular steps, such as OGDP, API collection, automatic data download, automatic DCR calculation, website framework, website deployment, and website visualization.
The tasks and functionalities of each module step are explained in the following sub-sections.
2.1. OGDP
OGDP is an online data repository where the data are freely available to anyone. The data available in the OGDP are called OGD and can be used or re-published without restrictions from copyright or patents. The goal of OGDP is to open all non-personal and non-commercial data collected and processed by government organizations [
23]. As part of this trend, public agencies have started to make government data available in standardized file formats on web portals, as web services, or via API, mostly based on open source data management systems such as CKAN or DKAN [
6].
Using the API, the data stored in the OGDP can be downloaded automatically. So, in the first step of the automatic data quality checking framework, we find the OGDP whose data stored in the tabular form can be downloaded using the API. Some of the OGDP where the data can be downloaded through the API are
data.go.kr (South Korea),
data.gov (USA),
data.gov.uk (UK), etc. The list of APIs associated with the data files can be found in the metadata section of these portals [
6,
24].
2.2. API Collection
In the second step, the API listed in the metadata section of the OGDP, along with their corresponding data file name as are stored in the API database = { of length in a standardized format. The API stored in the database can be used to automatically download the data files associated with it using scripting languages such as Python, Java, Ruby, etc.
2.3. Automatic Data Download
In the third step, scripting language is used to automatically download the files using the API database created in the second step. The algorithm to download list of files using the corresponding API listed in the API database of length is shown in Algorithm 1.
In Algorithm 1, the database containing the standard data name
and their corresponding API
are used to download the files
in the standard file format using their corresponding names
. The downloaded files
are stored in the preferred system location.
| Algorithm 1 Automatic data download |
| | Input: containing API and its corresponding data file name |
| | Output: Downloaded data file |
| | Initialize: = [], = [] |
| | Automatically download data file: To download the data file from its respective API |
| | 1. | for in range() do |
| | 2. | ![Applsci 11 09270 i001]() |
| | 3. |
| | 4. |
| | 5. |
| | 6. | end for |
2.4. Automatic DCR Calculation
After successfully downloading the data file in a standard format, the data of these files are further analyzed to determine the region-based DCR of these files. The term ‘region’ here stands for both the administrative division of the country and the country as a whole.
The algorithm for determining the region-based DCR of a file is shown in Algorithm 2. In Algorithm 2, based on the unique regions
listed in the file
, the DCR is calculated considering the case of the overall data fields and the mandatory data fields. The term ‘overall data fields’ refers to the list of column names in file
, whereas the ‘mandatory data fields’ of file
are predefined and listed in the data standardization policy section of the OGDP.
| Algorithm 2 Automatic region-based DCR calculation |
| | Input: Data file , list of unique regions in the file }, list of overall and mandatory fields |
| | Output: Region-based DCR stored in the data file |
| | Initialize: , , , = [] |
| | Automatically find region-based DCR: To find DCR in the data file |
| | 1. | for in range() do |
| | 2. | ![Applsci 11 09270 i002]() |
| | 3. |
| | 4. |
| | 5. |
| | 6. |
| | 7. |
| | 8. |
| | 9. |
| | 10. |
| | 11. | end for |
The DCR is calculated based on (1). After computing the region-based DCR, results of each are stored in .
2.5. Website Framework
After successfully calculating DCR, the data are sent to the open-source website framework for visualization. The functionalities that determine the quality of web development frameworks are AJAX support, cloud computing, comet support, custom error messages, customization and extensibility, debugging, documentation, forms validation, HTML5 support, JavaScript-based frameworks support, object relational mapping, parallel rendering, platform support, etc. [
25].
Because there are many ways to build websites, some of the open source frameworks that have powerful backends for website development are Ruby on Rails, Cake PHP, ASP.NET, Django, Laravel, etc. [
25].
2.6. Website Deployment
After making the website in step 5 using the data of step 4, it could only be accessed in the local server where the website was made. To deploy the website to the internet, an open-source web server should be used [
26].
An open-source web server is public-domain software designed to deliver web pages over the World Wide Web. For instance, some of the popular open-source web servers are Apache HTTP Server, NGINX, Apache Tomcat, and Node.js [
27].
2.7. Website Visualization
Finally, in this step, users can enter the website uniform resource locator (URL) in their web browser for visualization. When the URL is entered in the web browser, a server hosting a website receives URL requests for a resource or web page, and in response, sends the webpage over to the user’s browser [
26,
27].
3. Django-Based DCR Check Framework for South Korea
In this section, we present a Django-based framework to automatically evaluate the DCR of data available in the OGDP from South Korea (see
Figure 3). This framework is an implementation of the framework shown in
Figure 2.
In
Figure 3, at first, OGDP of South Korea is accessed to collect the API that contains data in the standard format. The list of APIs can be found in the metadata section of the platform, as shown in
Figure 4.
In
Figure 4, the metadata section containing the list of APIs to download ‘National performance event information standard data’ in different standardized formats is shown. Only the data of 93 categories were found in the portal in the standardized format, which can be accessed directly via the API.
In the second step, the APIs that can download those data in the CSV format (tabular format) were stored in the API database, as shown in
Table 1.
In
Table 1, a list of data stored in the API database is shown. A total of 93 APIs linking to different data categories were stored in the database.
In the third step, Python code is written based on Algorithm 1 to automatically download files using the APIs listed in the API database. In the fourth step, the downloaded files are analyzed using Python to determine the region-based DCR based on Algorithm 2. The DCR is calculated for the first-tier administrative division of South Korea, including the national one, for the overall and preferred data fields, which are stored in the file name (CSV).
After the completion of the fourth step, i.e., the fifth step, the region-based DCR
is stored in the backend database of a Django-based framework for visualization. Django is a Python-based web framework that simplifies the creation of dynamic websites [
28]. It follows the model–template–views (MTV) architectural pattern as shown in
Figure 5.
In the MVT architecture, the model manages the data and is represented by a database; the view handles hypertext transfer protocol (HTTP) requests and HTTP responses; the template is the frontend layer. The view completes HTTP response by interacting with the model and the template [
28].
The Django-based framework is used to visualize the
database as shown in
Figure 3. The
database stored in the backend of the Django framework is accessed directly through the views (Python file). In the views, ‘context’ is used to store the variables of the database in dictionary format, as shown in
Figure 6.
In
Figure 6, the list data of the database are stored in the dictionary under the variable name ‘items’. The dictionary ‘item’ is then assigned to the variable ‘context’. Then the items from ‘context’ are rendered into the frontend template. Basic HTML is used for simple frontend templates; to make the templates more attractive and dynamic CSS and JavaScript are used. In the frontend template, Django’s built-in multivariable template is used to display the list variables sent through ‘context’ [
28,
29].
The frontend template is only displayed as an HTTP response when the URL is entered. This constructed dashboard can only be accessed on the local server. To make this dashboard accessible through the client’s browser, we used Apache Web Server in the sixth step.
Apache Web Server, commonly known as Apache, is a free and open-source web server that provides web content through the internet [
30]. The Django-based website can be deployed using Apache and WSGI (Web Server Gateway Interface), where WSGI is an Apache module that can host any Python application [
28].
After completing the sixth step, the last step of this framework is to enter the URL of this website into the web browser to get the DCR of data.go.kr. This created website can be accessed through the URL
http://cityview.inu.ac.kr (accessed on 9 August 2021).
4. Results
In this section, we show the results of the Django-based data quality checking framework for South Korea. The result of each data file is automatically quantified in terms of DCR and visualized on the dashboard in real time. The specification of the computer server on which the dashboard is created includes an Intel Core i7 CPU, four Intel Xeon E7-1680 processors, and 128 GB memory.
4.1. DCR
In this part, based on Algorithm 2, the region-specific DCR of the OGD of South Korea is shown. The DCR is calculated for the different administrative regions of the country, including the national level, based on the overall and mandatory data fields. However, in this paper, only the administrative regions such as Incheon, Seoul, and Gyeonggi, collectively referred to as Greater Seoul, are considered for better presentation of the results.
Figure 7 and
Figure 8 show the radar plot of DCR of 93 different standardized files of National, Incheon, Seoul, and Gyeonggi regions in South Korea. The DCR values for 93 different files shown in
Figure 7 were calculated considering the overall data fields in the files, whereas in
Figure 8 the mandatory data fields in the files were considered.
The file names shown in
Table 1 are mapped as Ni, where the value of i is varied from 1 to 93. The first name in
Table 1 is denoted as N1 for SN 1, whereas the last name is denoted as N93 for SN 93. This is done to facilitate the file-specific DCR representation on the radar chart, as shown in
Figure 7 and
Figure 8.
In
Figure 7 and
Figure 8, the broken lines due to missing points can be seen for the Incheon, Seoul, and Gyeonggi regions. The missing points in the graphs are due to lack of data points in the file for that region. The list of files that do not contain data for National, Incheon, Seoul, and Gyeonggi regions, considering the overall and mandatory fields, can be found in
Table 2.
From
Figure 7 and
Figure 8, we can see that the DCR of the files evaluated considering the mandatory fields have a higher value than that of the total (mandatory + non-mandatory) fields.
A detailed analysis of the results from
Figure 7 and
Figure 8 is performed to categorize the 93 different standardized files of National, Incheon, Seoul, and Gyeonggi regions based on different DCR values, which are shown in
Figure 9.
To further clarify the results of
Figure 7 and
Figure 8, the average DCR of National, Incheon, Seoul, and Gyeonggi regions is shown in
Figure 10 for the overall and mandatory data fields.
Although our framework is capable of performing a minute-by-minute analysis of the DCR of the OGD, the DCR evaluation of the OGD is only presented on a daily basis in this paper. The average daily DCR of National, Incheon, Seoul, and Gyeonggi regions is shown in
Figure 11.
4.2. Dashboard Visualization
In this part snapshots of the dashboard under the domain name ‘cityview.inu.ac.kr’ are shown.
Figure 12 shows the overall view of the dashboard.
Figure 12a shows the home page of the dashboard. When the ‘Open Government Data’ button on the home page is clicked, the page with the items shown in
Figure 12b is displayed.
Figure 12b shows the region-specific list of standard public data and the corresponding DCRs. The highlighted portion of the DCR can be seen in
Figure 12c for the National (Overall), where the DCRs are displayed in different background colors to easily identify any change. The background color of the DCR is changed according to the rule shown in
Table 3.
5. Discussion
From the radar plots in
Figure 7 and
Figure 8, we can obtain information about the completeness of the 93 individual standardized files of National, Incheon, Seoul, and Gyeonggi regions.
Figure 8 shows that the result of DCR evaluated considering the mandatory fields seems to be more complete than that of
Figure 7, in which DCR was calculated considering all fields. Moreover, in both figures, the missing DCR value for Incheon, Seoul, and Gyeonggi regions can be seen, which means that the data points in the respective files are not available for these regions. The standardized files that do not contain values for Incheon, Seoul, and Gyeonggi regions are 14, 19, and 7, respectively, which are identical for the overall and the mandatory case. This result is even more evident in
Table 2, which also lists the names of the files that do not contain data points for the previously defined regions.
In
Figure 9, the 93 files of the above regions are categorized according to the different levels of completeness. A file is considered most complete if the DCR is ≥90%, whereas the lowest degree of completeness applies to the case when the DCR is <50%. Following this rule,
Figure 9 shows that for the case DCR ≥ 90%, the National (Mandatory) region has the highest number of files, i.e., 87, whereas Seoul (Overall) and Gyeonggi (Overall) regions have the lowest number of files, i.e., 46. For the DCR < 50% case, the National (Overall), National (Mandatory), Incheon (Mandatory), and Gyeonggi (Mandatory) regions have the highest number of files, namely 4, whereas Incheon (Overall), Seoul (Overall), and Gyeonggi (Overall) regions have the lowest number of files, namely 1.
Figure 9 shows that a large proportion of files in the Seoul, Incheon, and Gyeonggi regions have a DCR of less than 90%, let alone 100%.
Figure 10 shows the average DCR of the 93 standard files based on the regions. From the results, it can be seen that the National (Mandatory) region has the highest average DCR of 94.87%, whereas the National (Overall) region has the lowest average DCR of 86.63%. It can be inferred that in 93 standardized files, the non-mandatory fields are incomplete in most of the cases as compared to the mandatory fields.
Figure 11 shows the daily average DCR for the National, Incheon, Seoul, and Gyeonggi regions for the overall and the mandatory case. The line graph in the figure shows the slight fluctuations in the DCR value, indicating that the government agencies are revising the dataset, but the desirable DCR level has not yet been reached.
The DCR results shown in
Figure 7,
Figure 8,
Figure 9,
Figure 10 and
Figure 11 are visualized in real-time using the Django-based dashboard, as shown in
Figure 12. The results displayed in the dashboard show the alarming state of OGD quality of South Korea. The government agencies that control and monitor the OGD data should use this platform to improve and monitor the quality of data published in their portal before releasing it to the public.
8. Conclusions and Future Work
In this paper, we propose a general framework for automatically checking and visualizing the quality of data provided in OGDP with respect to DCR in real-time. To validate our framework, it is applied to 93 standard tabular OGDP datasets from South Korea that can be downloaded via the API. The quality of the dataset is quantified using the region-based DCR, considering the overall and mandatory data fields. For the region-based analysis, National, Incheon, Seoul, and Gyeonggi regions were considered. The simulation results show that among the 93 standard datasets, the datasets from the National (Mandatory) region gave better results, as 87 files were at least 90% complete, whereas in the case of the Seoul (Overall) and Gyeonggi (Overall) regions, only 46 files were 90% complete. The National (Mandatory) region had the highest average DCR with a value of 94.87%, and the lowest value of average DCR was found in the National (Total) region with a value of 86.63%. The results were visualized in real-time using the Django-based dashboard, which can be accessed via the URL
http://cityview.inu.ac.kr/data/ (accessed on 9 August 2021). The results show that the average DCR value of the OGD of South Korea was not even 95% even when the mandatory fields were included, and the result was even worse when the non-mandatory fields were also included.
Although we only checked the DCR of the OGD of South Korea, the value of DCR for the OGD of other countries could be even worse. Thus, in order to check and improve the quality of datasets stored in OGDP in real-time before releasing them to the public, the government agencies responsible for storing and maintaining OGD could use our framework.
Since this framework only considers DCR to automatically quantify the quality of tabular datasets that can be visualized in real-time, future work will consider other metrics to calculate data quality that will be applicable to non-tabular datasets. The framework will consider OGD from different countries rather than just from one country.


 ,
, 


