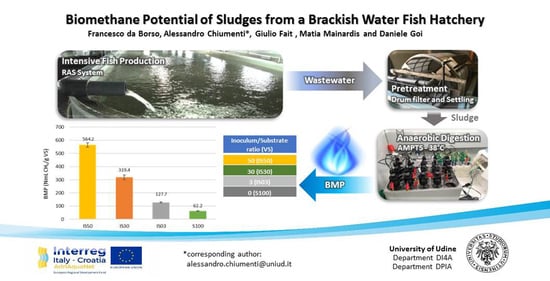
Biomethane Potential of Sludges from a Brackish Water Fish Hatchery
by
 , and
, and
Francesco da Borso
1 ,
,
Alessandro Chiumenti
1,*,
Giulio Fait
1,
Matia Mainardis
2 and
Daniele Goi
2 1
Department of Agricultural, Food, Environmental and Animal Sciences (DI4A), University of Udine Via delle Scienze 206, 33100 Udine, Italy
2
Department Polytechnic of Engineering and Architecture (DPIA), University of Udine Via del Cotonificio 108, 33100 Udine, Italy
*
Author to whom correspondence should be addressed.
Appl. Sci. 2021, 11(2), 552; https://0-doi-org.brum.beds.ac.uk/10.3390/app11020552
Submission received: 7 December 2020
/
Revised: 31 December 2020
/
Accepted: 5 January 2021
/
Published: 8 January 2021
(This article belongs to the Special Issue New Advances in Anaerobic Fermentation for Biogas and Biomethane Production)
Abstract
:Featured Application
AD applied to brackish water fish sludges can be a promising treatment process with quite good methane productions, increasing the economic and environmental sustainability of the sector.
Abstract
The development of intensive aquaculture is facing the challenge of the sustainable management of effluents. The reproductive sectors (i.e., hatcheries) mainly use water recirculation systems (RAS), which discharge a portion of wastewater. Anaerobic digestion (AD) could reduce the environmental impact of this waste stream while producing biogas. The study is focused on the biochemical methane potential (BMP) of brackish fish hatchery sludges. Wastewater was concentrated by microfiltration and sedimentation and thickened sludges were treated in a BMP system with different inoculum/substrate (I/S) volatile solids ratios (from 50:1 to no inoculum). The highest I/S ratio showed the highest BMP (564.2 NmL CH4/g VS), while different I/S ratios showed a decreasing trend (319.4 and 127.7 NmL CH4/g VS, for I/S = 30 and I/S = 3). In absence of inoculum BMP resulted of 62.2 NmL CH4/g VS. The kinetic analysis (modified Gompertz model) showed a good correlation with the experimental data, but with a long lag-phase duration (from 14.0 to 5.5 days) in particular with the highest I/S. AD applied to brackish water sludges can be a promising treatment with interesting methane productions. For a continuous, full-scale application further investigation on biomass adaptation to salinity and on retention times is needed. Further experimental tests are ongoing.
1. Introduction
During the last 40 years, aquaculture grew faster than other food production sectors. The most recent data revealed that marine aquaculture systems allowed to obtain a production of 28.7 million tons, representing approximately 36% of the total production of aquaculture [1]. Production of fed finfish in marine or coastal aquaculture systems (about 6.6 million tons in 2016) [1] is mostly carried out with floating or submersible cages, that however, raise serious problems related to the produced environmental impacts from many points of view. Sea water and sediment pollution, as a matter of fact, are the most serious and difficult to control of these environmental issues, mainly due to the practical impossibility of collecting the released effluents from these sea systems [2]. The production of the fry that successively are bred in cages, instead, is normally carried out in land based brackish and marine water systems, generally with tanks located in a protect environment. In order to reduce the overall water consumption, recirculation aquaculture systems (RAS) can be adopted. In RAS, the effluents separated from recirculating water can be collected and more carefully managed. Solid removal is an essential component in RAS, but often requires large quantities of water to wash out the accumulated waste [3]. Moreover, the produced waste is very diluted and for this reason it is difficult to store or to submit to a proper treatment [4,5]. Aerobic degradability of saline industrial wastewater was successfully demonstrated by comparing biological and chemical treatments in Kiel et al. (2014) [6] and by using biological sequencing batch reactors (SBRs) in Uygur (2006) [7], with particular focus on nutrient abatement. However, considering that aerobic processes are often characterized by high-energy demand and necessarily lack biogas production, in several cases anaerobic digestion (AD) treatment is preferred, particularly when concentrated effluents need to be treated.
In the present research, anaerobic digestion (AD) was investigated for the treatment of sludges from RAS of intensive fish hatchery using brackish water (i.e., salinity 10–12 g/L), after sludge thickening by mechanical filtration and sedimentation. AD applied to marine or brackish aquaculture effluents could allow several advantages: the obtained biomethane can be used as an alternative source of renewable energy [8,9]; the supernatant from AD may be recycled to RAS, saving water, salts, reducing energy costs and obtaining a lower final sludge volume [10]; a reduction of the atmospheric pollution and carbon footprint can be accomplished [11,12]; and a reduction of sludge transport, disposal or reuse costs can be obtained [4,13].
However, some critical aspects can be associated to the anaerobic treatment of these sludges. AD is known to be inhibited by high salinity mainly due to the presence of cations: in particular, a sodium concentration higher than 10 g/L strongly inhibits methanogenesis [14]. However, the anaerobic archaea are able to adapt to moderate saline conditions, where methane production can be even stimulated, rather than inhibited [15]. The high levels of sulfate, which is reduced to sulfide under anaerobic conditions, and of ammonia produced by the degradation of protein in feces and excess feed, can be other limiting factors in applying AD to aquaculture effluents [16]. In fact, it should be considered that biogas could contain harmful concentrations of NH3 and H2S [17] and it must be consequently purified before combustion, to avoid corrosion and other technical issues: biogas treatments such as biological desulphurization by thiobacillus [18,19], scrubbing or filtration in activated carbon reactors are common practices in the sector, but also determine capital and management costs. Other contaminants that have to be monitored in the biogas include volatile organic compounds (VOCs), carbon monoxide (CO), nitrogen oxides (NOx), formaldehyde, HCl, SO2 [17].
In recent years, few studies have been addressed to the determination of the methane potential in AD from marine or brackish aquaculture effluents, mainly operating with lab-scale self-built apparatus; nonetheless, the reported results were particularly promising. Gebauer treated marine aquaculture sludges with a continuously stirred tank reactor (CSTR), but the sludge was diluted 1:1 with tap water (5.3 g Na+/L) to overcome inhibition and maintain a stable process, obtaining a methane production of 0.26–0.28 L CH4/g of volatile solids (VS) [16]. Operating with an up-flow anaerobic sludge blanket (UASB) reactor and with a sludge salinity of 15–17 g/L, Tal et al. found a maximum specific methane production of 0.45 L CH4/L of volume reactor/day [8]. Zhang and colleagues [20] employed 0.5 L batch reactors, reaching methane yields of 0.27–0.33 NmL CH4/g VS in the treatment of sludge from brackish fish farm; however, they used specific additives like glycine betaine and trehalose to increase the energy yield.
Biochemical methane potential (BMP) assays allow to establish through a standardized laboratory tool the methane production of liquid and solid substrates in the AD process, giving useful information about substrate’s biodegradability and methane generation kinetics. The BMP procedure involves adding small amounts of an active anaerobic inoculum and a selected substrate into serum bottles, creating anaerobic conditions and measuring gas production over time [21]. The biochemical methane potential (BMP) of effluents from a typical fish of Mediterranean production, that is gilt-head sea bream (Sparus aurata), was never determined before, according to our knowledge. Consequently, the aim of the present study was to find out if the AD could be technically applicable to treat sludges from brackish gilt-head farming. Moreover, in order to have first indications on the feasibility of the AD process and on the eventual potential and requirements for a scale-up, it is fundamental to understand the optimal inoculum to substrate (I/S) ratio and the total methane potential of this substrate.
2. Material and Methods
2.1. Substrate and Inoculum
The sludges used as substrate for the methane potential determination in this study were collected from a fish hatchery located in Puglia (Southern Italy), where fingerlings of sea bream (Sparus aurata) and sea bass (Dicentrarchus labrax) are produced. Wastewater was discharged from the bottom of the tanks where sea breams were raised from 5 to 45 g l.w. and were filtered by a rotating drum filter (Hydrotech Microscreen 1603, Veolia) with a 30 mm mesh, having a treating capacity of 120 L/s. The thickened fraction from the filter was settled in a circular tank with a conic shaped bottom and the sludges were collected after 1 h of sedimentation for the anaerobic tests.
The inoculum was collected from a digestate of a full-scale mesophilic anaerobic digester (CSTR) treating dairy cow manure and corn silage, located in Padova, Italy. The main physicochemical characteristics of the actual substrate and inoculum are shown in Table 1. Before the beginning of the anaerobic assays, the inoculum was mixed and pre-incubated for a week at ambient temperature in order to volatilize the residual biogas and to deplete the residual readily available organic material.
2.2. Analytical Methods
Substrate, inoculum and digestate physicochemical characterization was performed according to the Standard Methods for Examination of Water and Wastewater [22]. In detail, the following parameters were analyzed: total solids (TS), volatile solids (VS), total nitrogen (TN) and ammoniacal nitrogen (TAN). The total solids were determined by complete drying of the samples in a ventilated oven at 105 °C for 24 h; the volatile solids were determined as the difference between the calculated TS and the residual ashes, where the ashes were determined after incineration of the TS sample at 600 °C for about 8 h, until a constant weight was reached.
Total COD (tCOD) and soluble COD (sCOD) were determined by means of spectrophotometer Lovibond PC Multidirect® using COD Medium Range (0–1500 mg/L) cuvettes, respectively on the raw sample and on the liquid fraction obtained after centrifugation at 10,000 rpm for 10 min, properly diluting the sample. Volatile fatty acids (VFA) and Total alkalinity were determined by means of Biogas Titration Manager System (Hach-Lange, Düsseldorf, Germany). Salinity was estimated with salt refractometer 106 ATC (Sper Scientific Direct, Scottsdale, AZ, USA). Redox potential and pH were measured with Crison 2001 multimeter (Hach Lange).
2.3. Biochemical Methane Potential Tests
Biochemical methane potential (BMP) tests were carried out in an automatic methane potential test system (AMPTS, Bioprocess Control, Sweden). This equipment consisted of an incubation unit where 15 individual glass reactors were incubated at a constant temperature of 38 °C. Each reactor had a total volume of 650 mL, and was filled with the mixture of inoculum and substrate for 400 mL before starting the tests. The reactors were mixed by an intermittent slow bent rotating agitator, operating for periods of 10 s every minute. The biogas produced in the reactors passed through an individual vial containing a 3 M NaOH solution, with the effect of retaining acidic gas fractions (mainly CO2 and H2S), allowing only CH4 to pass through to the gas measuring unit. A solution of thymolphthalein as pH indicator was added to the NaOH vials for keeping the acid binding capacity of the solution. The volume of released CH4 was measured using individual wet gas flow measuring devices, automatically recording the digital pulses at each filling of the flow cells (10 mL). A dedicated programmable logic controller (PLC) connected to a PC was used to elaborate and record the data. The cumulative methane production (expressed as NmL CH4) and the net daily methane production of each reactor (NmL CH4/day) was calculated by the difference between the CH4 production from test bottles (substrate and inoculum) and the CH4 production from blank reactors filled only with inoculum (standardizing the VS content). The final BMP value was then expressed as the cumulative methane yield at the end of the test divided by the relative VS content (NmL CH4/g VS), as recommended by Pearse et al., 2018 [21].
On the basis of BMP tests previously performed with diluted effluents [23], a wide range of I/S ratios, based on the relative VS content of inoculum and substrate, were tested in this preliminary campaign, including the following values: I/S = 50 (IS50); I/S = 30 (IS30); I/S = 3 (IS03). In addition, the substrate itself, without inoculum, (S100) was tested to evaluate its eventual methane production in absence of a specialized anaerobic bacteria consortium. The tests were carried out in triplicate, and 3 reactors filled only with inoculum were used as blanks to calculate the net methane production. All the experimental data were statistically analyzed using one-way analysis of variance (ANOVA) through the MS Excel software, at a level of significance p < 0.01.
2.4. Kinetic Models
The below reported first-order kinetic model Equation (1) and the modified Gompertz model Equation (2) were tested to fit the experimental data of the cumulative methane yield (NmL CH4/g VS load).
where:
- Y(t) is the estimated cumulative methane yield at time t (mL CH4/g VS)
- Y0 is the calculated BMP of the substrate (mL CH4/g VS)
- k is the hydrolysis rate constant (1/day)
- t is the time (day)
- Rmax is the maximum methane production rate (mL CH4/g VS day)
- λ is the lag phase duration (day)
In the case of batch reactors and experimental anaerobic tests for BMP determination, the most accurate kinetic model should be the one which most correctly simulates the metabolic pathways and mechanisms involved in the AD process [24].
The first order kinetic model Equation (1) is generally more accurate when hydrolysis represents the phase controlling the whole process (rate-limiting step) and the substrate availability at the beginning of the tests is the limiting factor [23]. The modified Gompertz model, instead, is considered the best empirical non-linear regression model, that can give an accurate simulation of the potential methane production, describing the microbial cells’ exponential growth rates and in particular the lag phase duration [25].
The simple linear regression method, through calculation of the coefficient of determination R2, was used for comparing the two models against the actual experimental dynamics of methane yield from BMP experimental tests. Subsequently, the inferred hydrolysis constant k of first order kinetic model and the lag phase duration λ of modified Gompertz model were assessed.
3. Results and Discussions
3.1. Chemical Composition of Fish Sludges
Despite fish hatchery wastewater was concentrated by means of mechanical micro-filtration and sedimentation, the obtained sludges were very diluted (Table 1), with an average TS concentration of 14.3 g/L, slightly higher than the value of 9.7 g/L obtained in previous tests [4], and, in addition, they were characterized by a high inorganic content. In fact, the concentration of VS was on average 4.7 g/L, corresponding to 32.9% of the TS. The few published studies concerning AD of marine fish effluents have reported higher organic matter contents than those found in this research. Gebauer [16] and Mirzoyan and colleagues [26], for example, indicated mean VS contents between 49.8 and 56.1% of TS, at salinity levels ranging from 2.5 to 35 g/L. Luo and colleagues [27], on the other hand, operating with a RAS and a salinity value of 10.5 g/L, found low ratios of suspended VS (27.2–35.0% of TSS) in much more concentrated sludges (129.6–145.3 g/L TSS).
Volatile acidity (VFA) and total alkalinity (TAC) were on average 596.5 mg/L and 815.0 mg/L, respectively, with a VFA/TAC ratio of 0.732, which indicates a substrate potentially adapt for the anaerobic digestion process for the prevailing content of VFA [28]. The redox potential resulted in average of −60 mV, in the same range of what reported by Mirzoyan and colleagues [26], which found a redox potential between −35 and −124 mV. These values are typical of substrates that have not reached complete anaerobic conditions: while −400 mV is a typical reference value for digestates, higher values, such as those detected in the present study, do not indicate particular issues in relation to the biodegradability of the feedstock in the AD process [11].
3.2. Methane Production
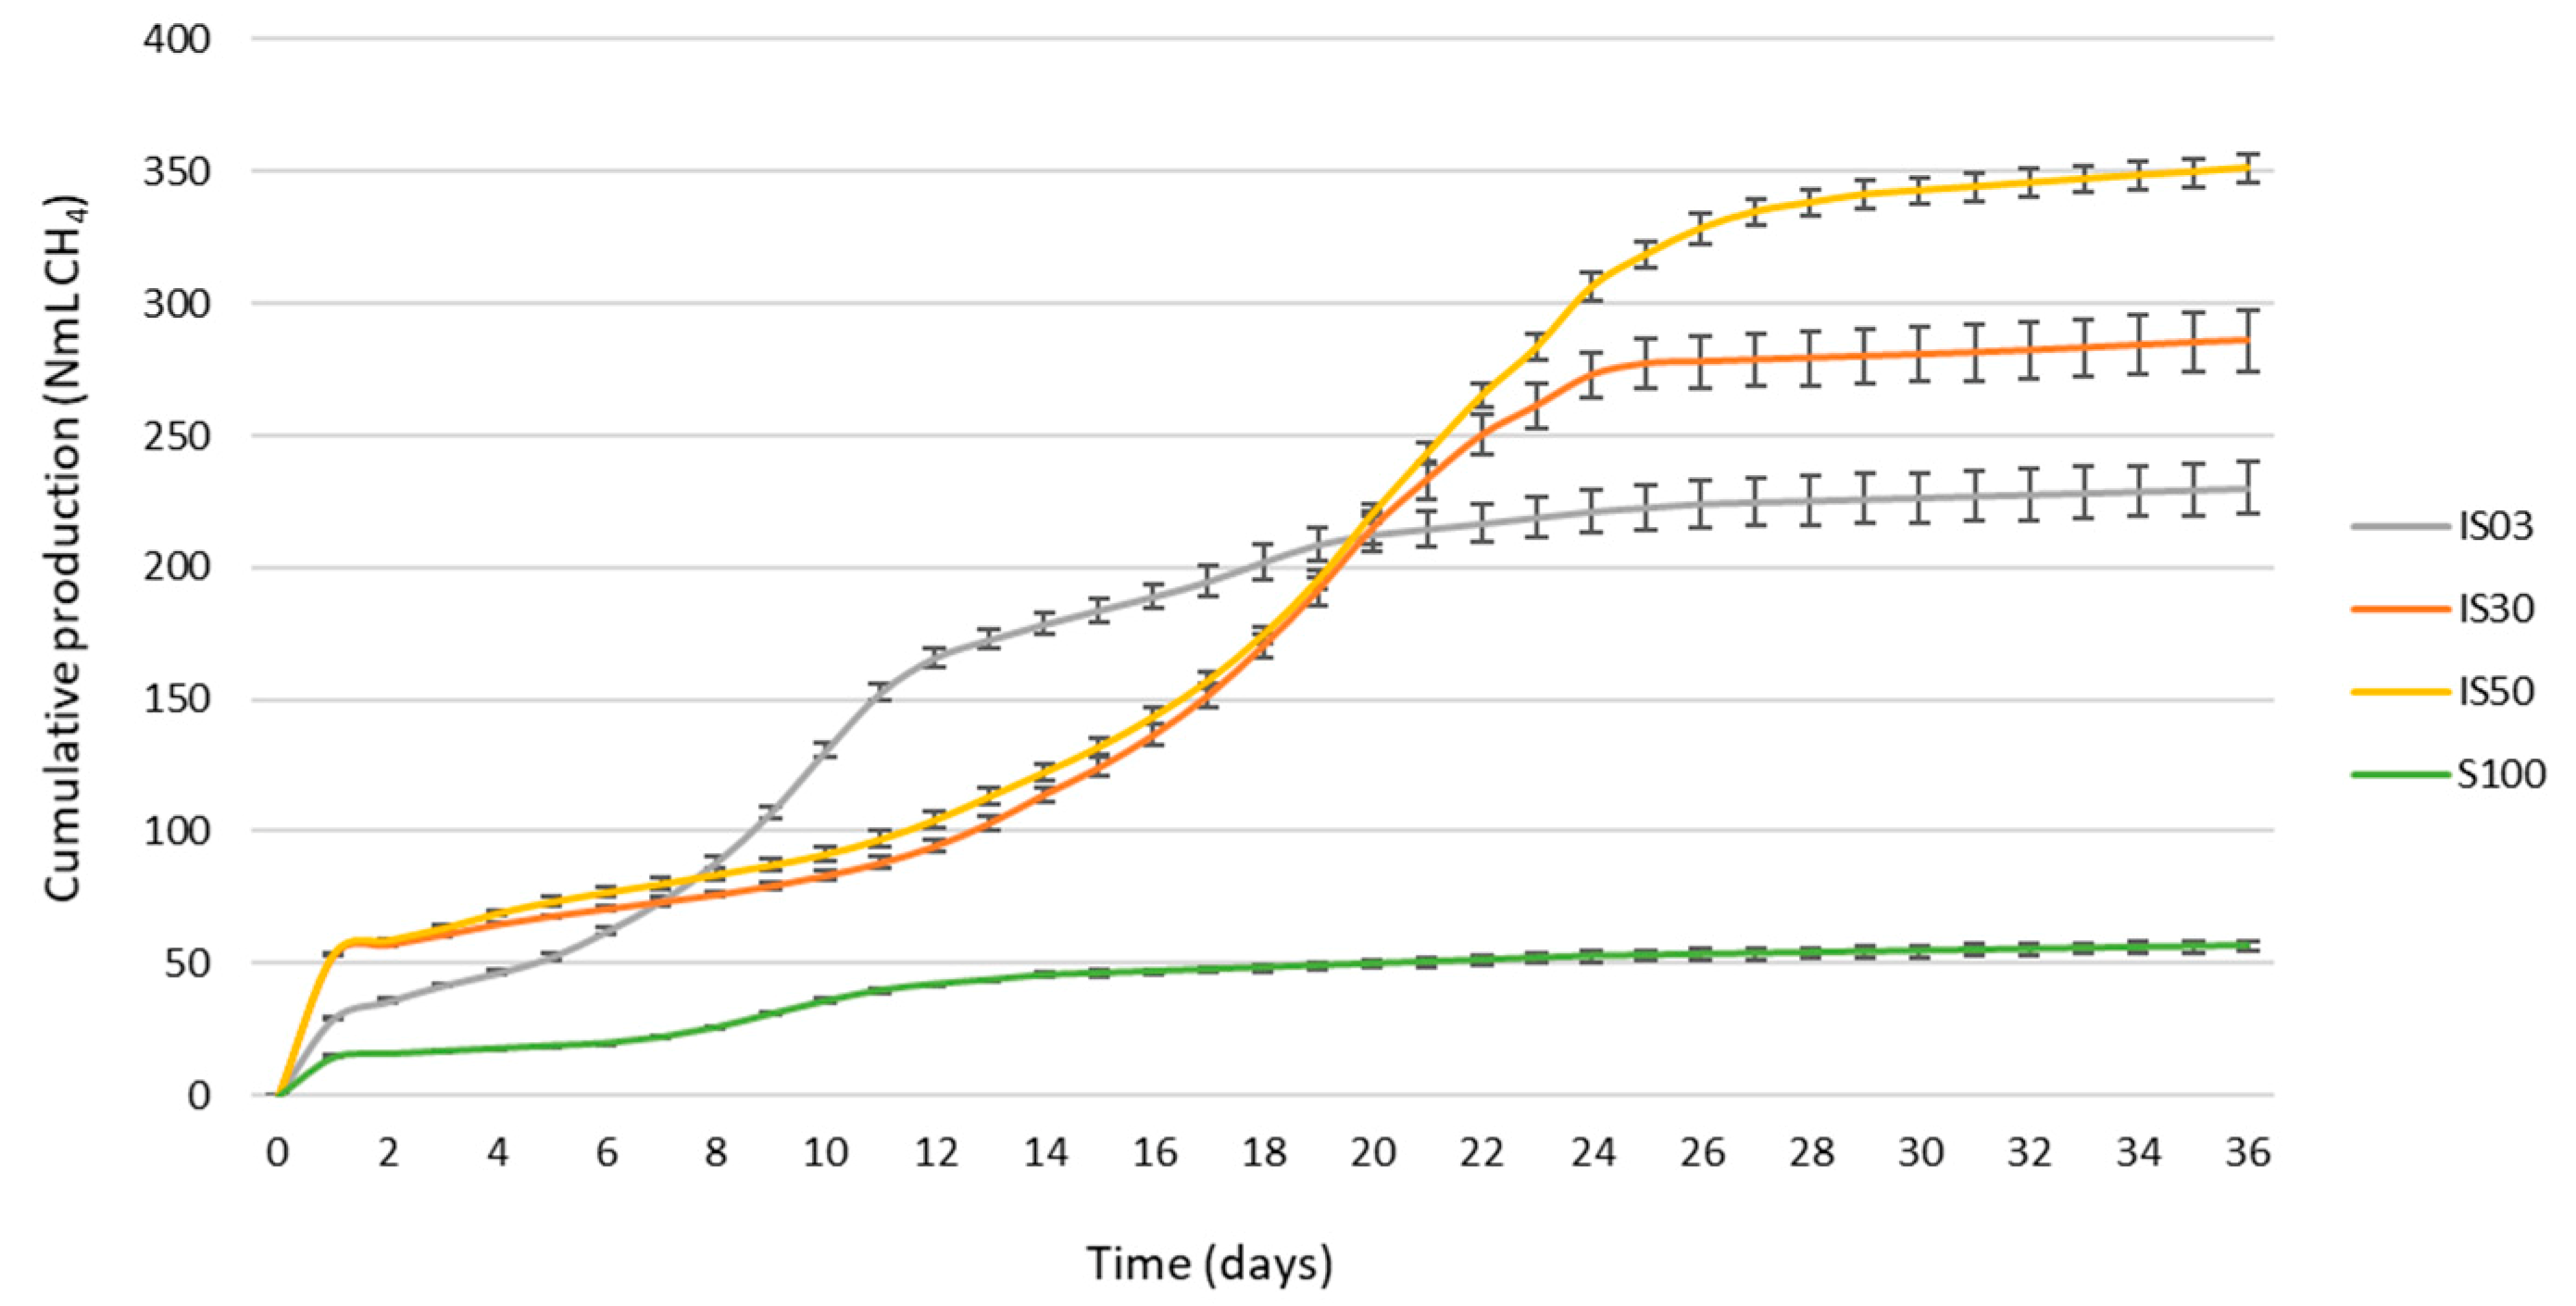
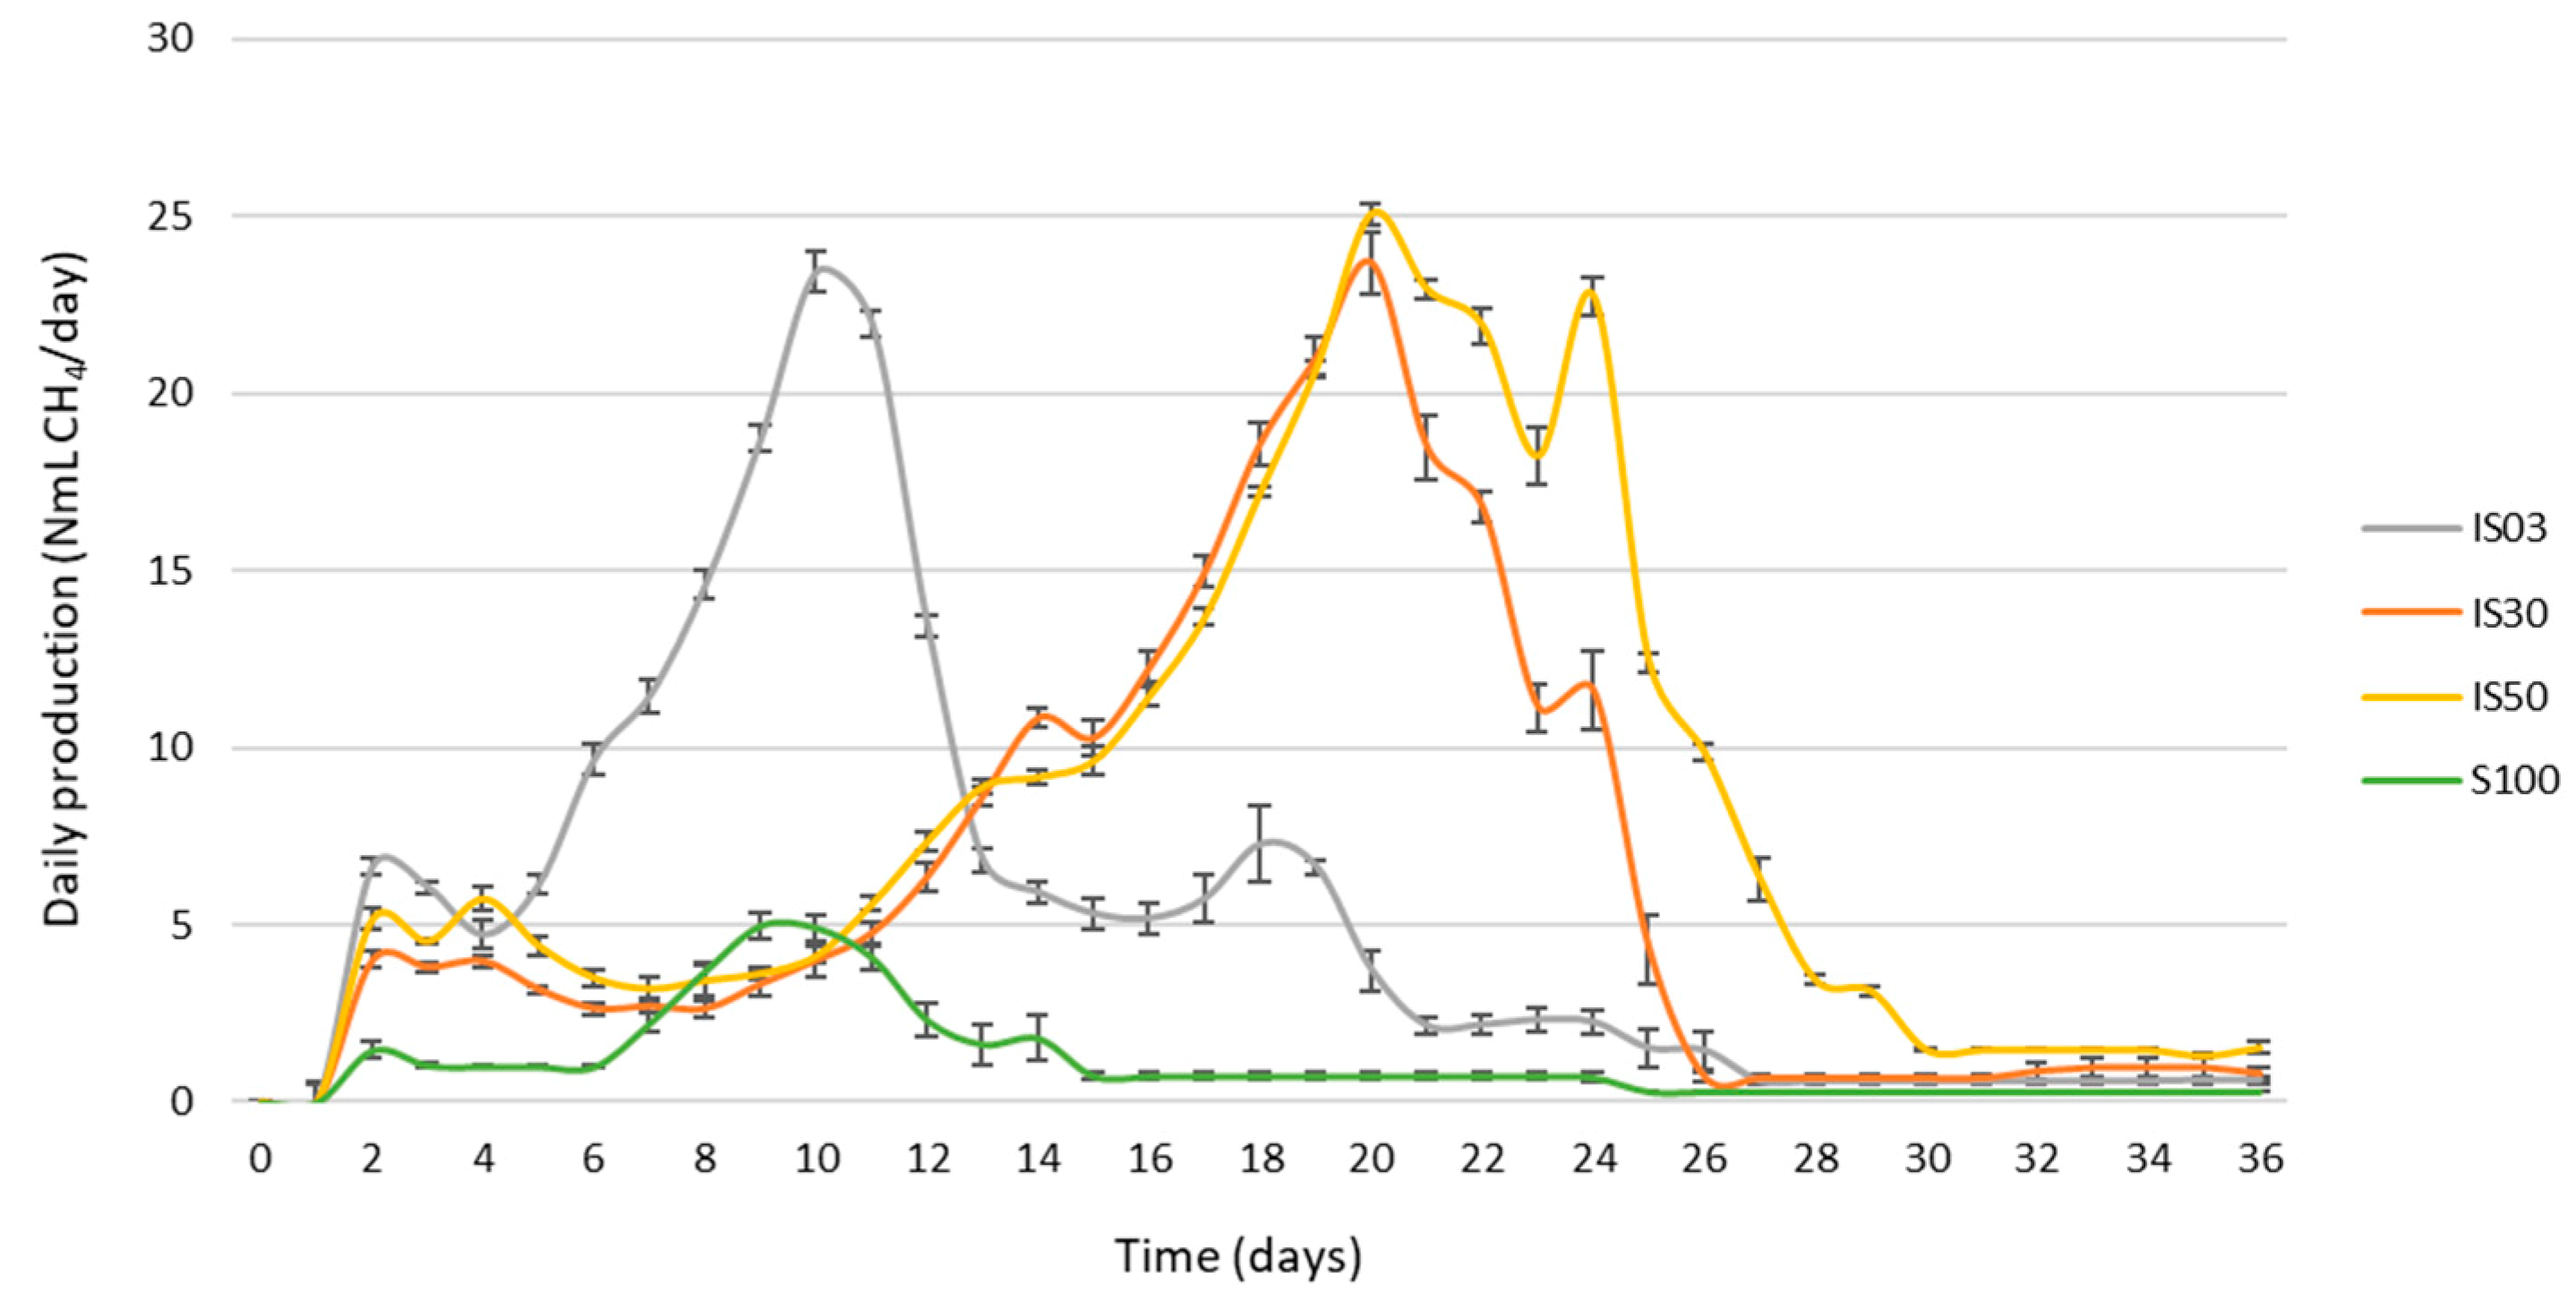
The broad range of tested inoculum to substrate ratios produced significantly different cumulated methane productions (Figure 1). The highest production was obtained from the highest tested ratio (IS50), while the reduction of relative inoculum proportions evidenced gradually lower productions. In more detail, looking at methane production curves in Figure 1, IS50 and IS30 performed very similarly until day 20, after which IS30 ceased to increase, while IS50 continued to grow up and slowed down only after day 26. The production trend of IS03 was different from the previous ones, as it increased more rapidly until day 10, but then it grew slowly until it stabilized on lower final BMP values. As could be expected, the growth of S100 (only substrate) methane production was very slow and the methane production trend was much more flat than the other curves. The trends of daily methane productions drawn down in Figure 2 allow to better highlight these differences among the experimental theses. The daily production of IS03 showed the highest peak on day 10 (23.4 NmL CH4/day), while for IS30 and IS50 the peaks occurred almost simultaneously around day 20–21, however with values that were not very different from those of IS03 (25.1 and 23.7 NmL CH4/day, respectively for IS50 and IS30). The daily production of S100 reached the maximum on Day 9 (as for IS03), but with much lower absolute values (5.0 NmL CH4/day). Moreover, it is possible to highlight a second less pronounced peak of daily methane production for all the theses, probably due to the degradation of less easily digestible compounds. This happened during day 14, 18, 25 and 26, respectively for S100, IS03, IS30 and IS50 trials. Similar behaviors are known and well described for other substrates: they have been observed for example with cheese whey [23], paper sludge [29], potato peels [30,31].
3.3. Biochemical Methane Potential (BMP)
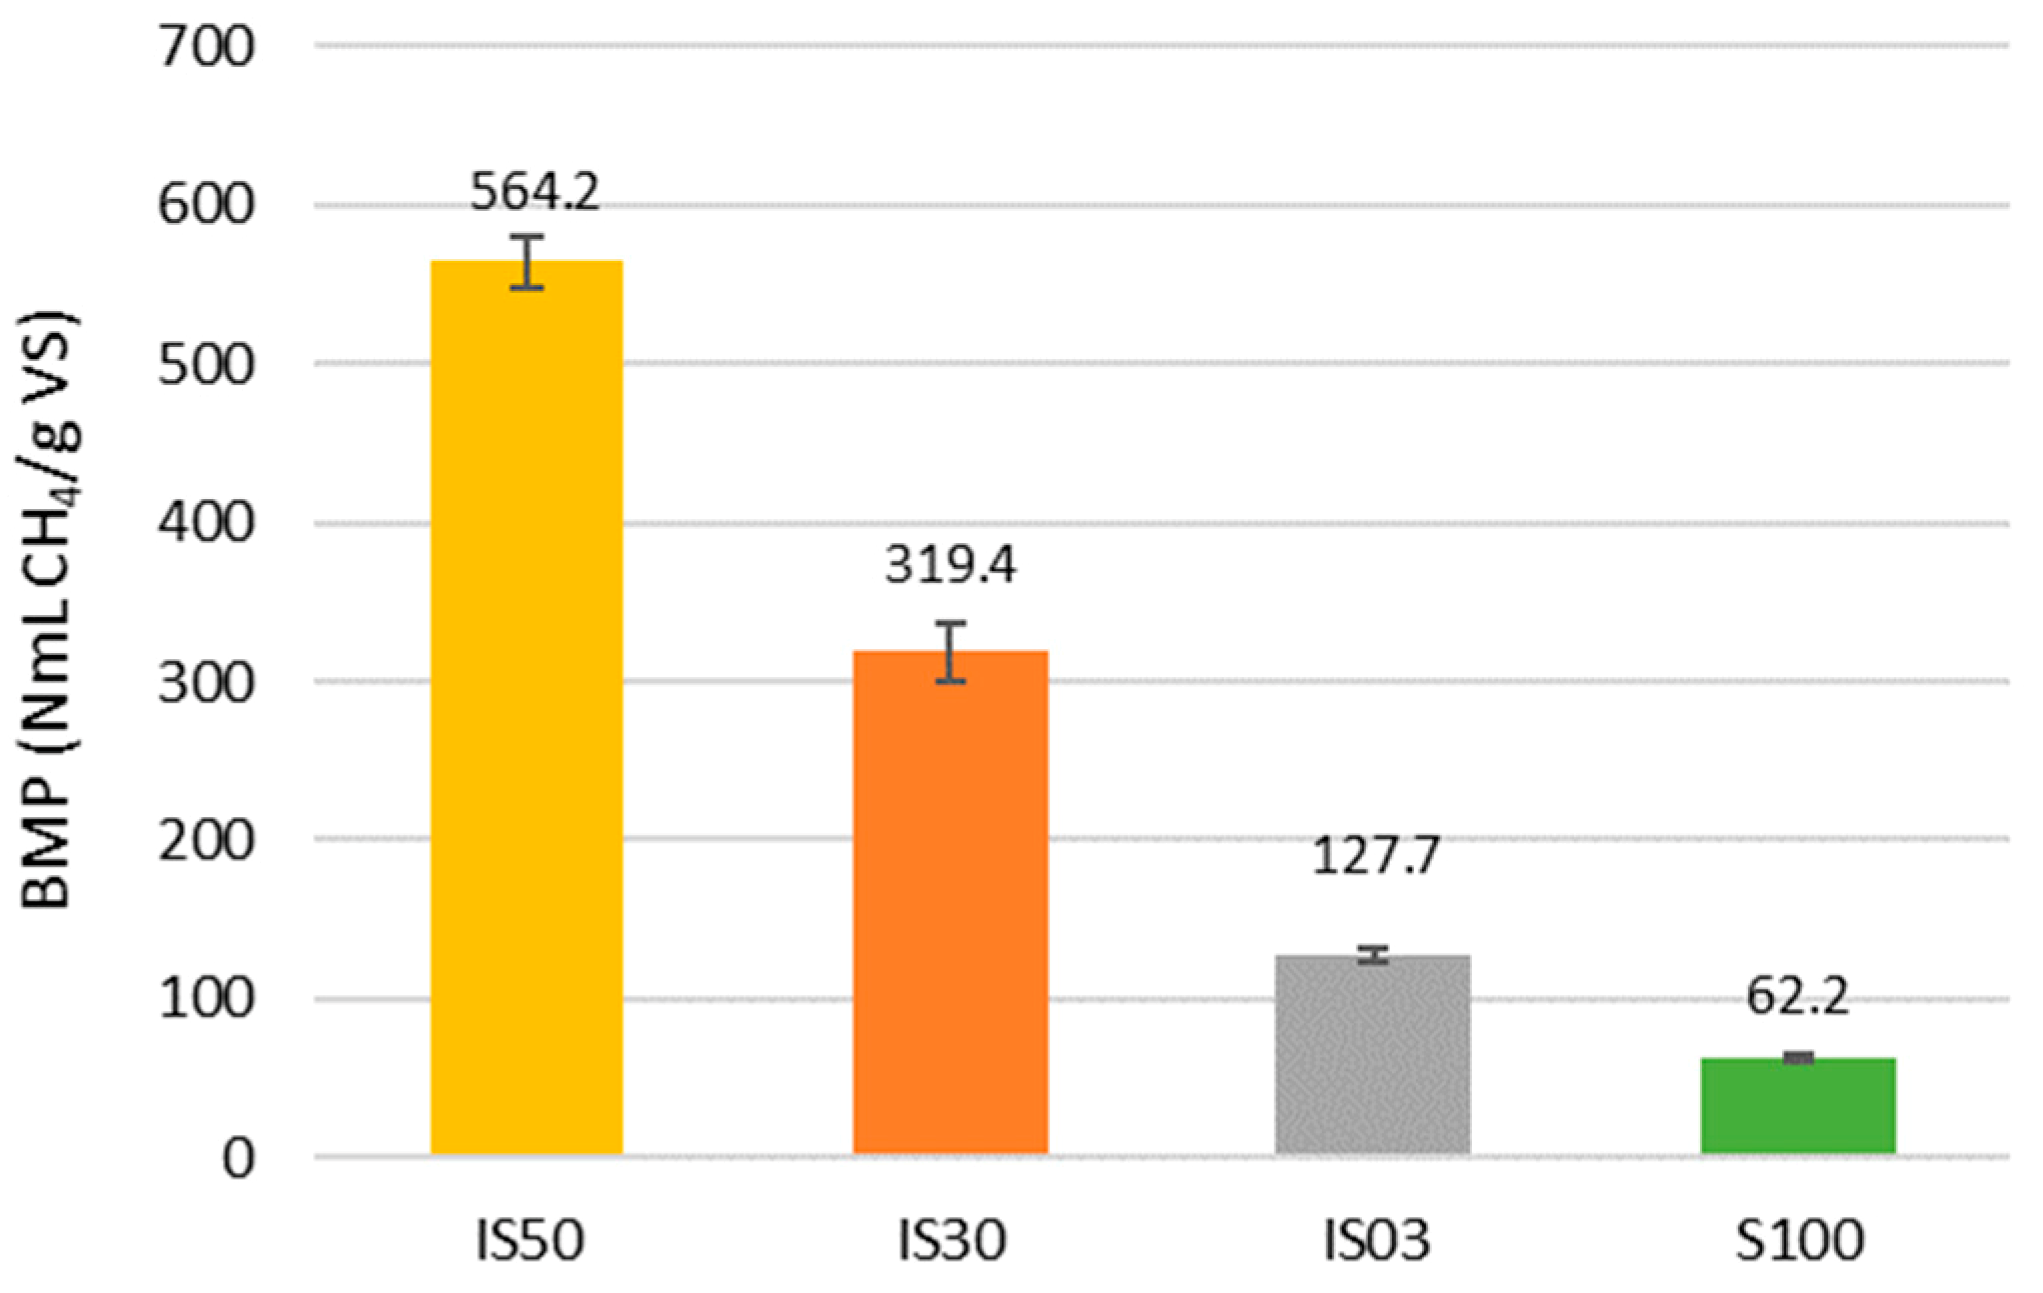
The Biochemical methane potential value obtained with the different applied I/S ratios was significantly different, with values gradually decreasing from the highest inoculum to substrate ratio (IS50) to the total absence of inoculum (S100). BMP mean values are reported in Figure 3. The highest obtained BMP (564.2 ± 16.9 NmL CH4/g VS, in IS50) was comparable to the yields of 396.8–779.8 NmL CH4/g VS obtained in previous tests on thickened sludge from trout production in fresh water [4,5] and to the highest yield of 460 L/kg VS, reported by Lanari and Franci [32] for effluents from trout in freshwater. Moreover, the highest BMP yield of this study resulted higher than a previous literature outcome of 270–330 NmL CH4/g VS, reported by a research carried out in an AMPTS system with sludges of turbots fishes (Scophthalmus maximus) bred in brackish water with 15.2 g/L salinity [20]. These authors, however, used additives like glycine betaine and trehalose to improve biogas production rates, while in the present study no additives were used. Other research studies have been carried out with different laboratory methods, which have not always allowed to reach the determination of BMP value, but gave useful indications for a comparison with the present study. With the same fish species (Sea Bream), for example, methane yields of 0.45 L CH4/kg input sludge have been determined in brackish conditions and with a continuous load AD process [8]. Gebauer [16] obtained methane yields of 160–241 NmL CH4/g VS with Atlantic Salmon, reducing the saline content from 35 to 17.5 g/L respectively. Finally, Zhang and colleagues [33] found methane yields of 203 mL CH4/g COD with a semi-continuous digester operating with sludges from a turbot RAS. The inoculum used in these studies was municipal sewage sludge and cow manure [16] or digestate from AD of various fish waste adapted to saline conditions [33,34,35]. From this analysis, it emerges that the current experimentation gave in any case good methane yields, even without the use of a specialized inoculum or a community already adapted to saline conditions, provided that a sufficiently high inoculum/substrate ratio is maintained. These basic indications from the batch BMP assays can be of extreme interest for successive experimental works at larger scale or on continuous mode.
3.4. Kinetic Analysis
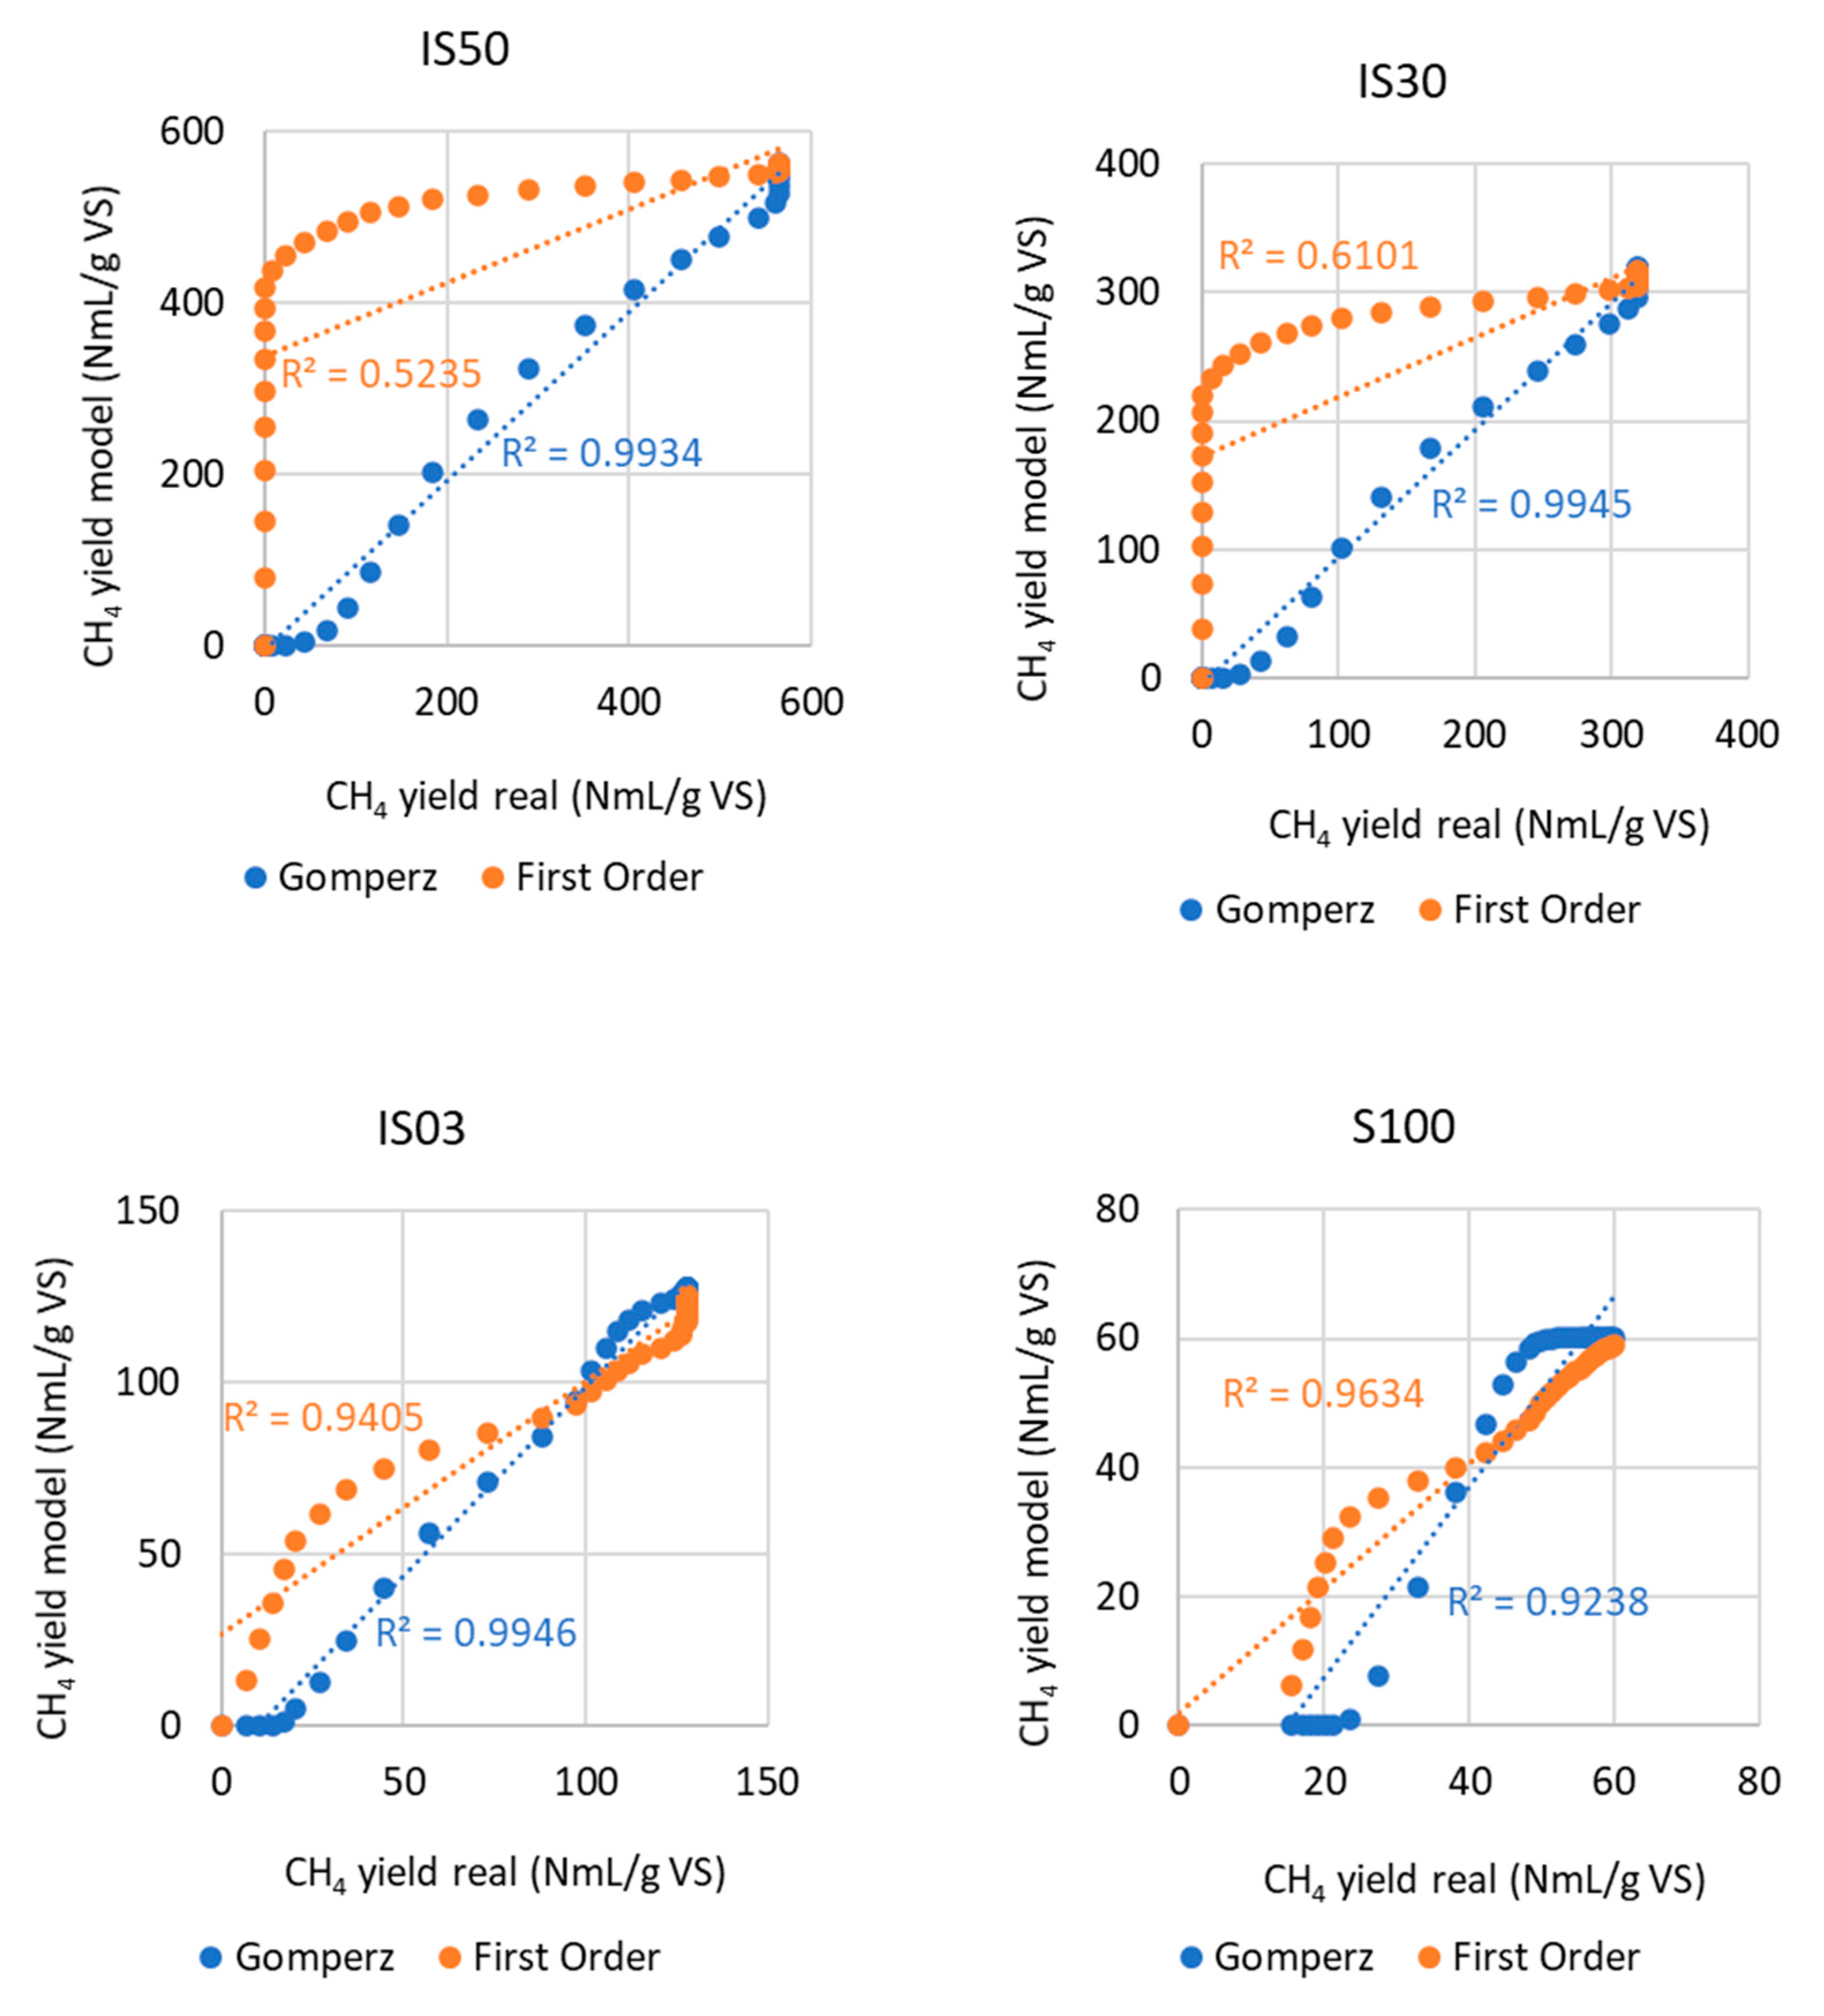
In general, the Gompertz model demonstrated better correlations between the measured and the predicted values of CH4 yields, when inoculum was used. In fact, R2 resulted from 0.9934 to 0.9946 for IS50 and IS03, respectively, with an intermediate R2 value for IS30 (Figure 4). The first-order model, instead, simulated better than Gompertz equation the S100 behavior, with R2 value of 0.9634, higher than the value of 0.9238 calculated for Gompertz equation. The hydrolysis constant k applied to get these results was in the range 0.11–0.15 1/day, with the lowest value for S100 and the highest for IS50 (Table 2).
As no other recent study related to AD kinetics of aquaculture effluents was found in literature, studies on other effluents can be taken as a reference for a fruitful comparison. The hydrolysis constant k calculated by our data set was lower than that reported by Mainardis and colleagues [23], which found k values between 0.36 and 0.55 1/day when treating cheese whey. Instead, the calculated k from AD of fish sludges seems to be more similar to that reported for AD of livestock manures, namely k = 0.13 1/day [36] and k = 0.05–0.12 1/day [37], to give some examples.
The lag phase duration (λ) calculated with Gompertz model resulted to be from 5.5 to 14.0 days, which can be considered quite a long duration, indicating a slow adaptation of the anaerobic biomass to the substrate and a slow hydrolysis kinetics. However, with the highest content of substrate with respect to inoculum (IS03), the lowest lag phase duration was found (λ = 5.5 days), showing the highest degree of correlation (R2 = 0.9946). Indeed, this inoculum to substrate ratio was the best performing test in terms of AD process rate, also in agreement with the trends reported in Figure 1 and Figure 2. In particular, the present results were very similar to those reported by Sun and colleagues [24], which indicated a lag phase duration from 4.76 to 5.88 days for the mesophilic digestion of beer lees and biochar in an AMPTS system. As observed in this last study, performing AD in thermophilic conditions, rather than actual mesophilic range, could further shorten the lag phase duration [24].
Finally, the maximum daily specific methane yield (Rmax, NmL CH4/g VS day, Table 2) resulted to be higher for IS50 and gradually lower for the others I/S ratios, with the lowest values obtained on IS03 and S100 (16.0 and 15.4 NmL CH4/g VS day, respectively).
4. Conclusions
In this study, wastewaters obtained from a sea bream hatchery recirculation aquaculture system (RAS) were subjected to microfiltration and sedimentation, and the thickened sludges were anaerobically digested in batch assays for 36 days at 38 °C in an automatic methane production test system (AMPTS) with different inoculum to substrate (I/S) ratios to establish their methane generation potential in the anaerobic digestion (AD) process. The highest obtained biochemical methane potential (BMP) value (564.2 NmL/g VS) was measured with an I/S of 50, while by applying lower I/S ratios (30 and 3) the BMP was reduced to 319.4 and 127.7 NmL/g VS, respectively. However, also the substrate alone in absence of inoculum demonstrated a moderate methane production (BMP of 62.2 NmL/g VS) with the same digestion conditions. As regards to the process kinetics, the modified Gompertz model allowed to estimate a more prolonged lag phase when I/S ratio was above 30 (13.5–14.0 days), but with I/S = 3 the lag phase was shortened to 5.5 days. The results of this study therefore indicated that AD process could be optimized with a prior adaptation of the inoculum and biomass to saline conditions, by adopting sufficiently long retention time (i.e., 15–20 days) with a continuous loading. The use of fixed bed reactors (FBR), which allow biomass growth and retention inside the reactor, and the adoption of higher processing temperature (i.e., thermophilic regime), could be other factors to improve the process. Moreover, a proper pre-treatment of the aquaculture sludge and its co-digestion with other locally available substrates could be beneficial to improve the overall energy yields. Further experimental tests are underway in order to compare the AD process in brackish and high salinity conditions, considering the previously cited factors.
Author Contributions
Conceptualization, F.d.B., A.C., G.F., M.M., and D.G.; methodology, F.d.B., A.C., G.F., M.M., and D.G.; investigation, F.d.B., A.C., G.F., M.M., and D.G.; data curation, F.d.B., A.C., G.F., M.M., and D.G.; writing—original draft preparation, F.d.B., A.C., G.F., M.M., and D.G.; writing—review and editing, F.d.B., A.C., G.F., M.M., and D.G.; funding acquisition, F.d.B. All authors have read and agreed to the published version of the manuscript.
Funding
The research was supported by the AdriAquaNet project (application ID 10045161), 2014–2020 Interreg V-A Italy-Croatia CBC Programme, Priority Axis: Blue innovation.
Institutional Review Board Statement
Not applicable.
Informed Consent Statement
Not applicable.
Data Availability Statement
Data available on request due to restrictions eg privacy or ethical. The data presented in this study are available on request from the corresponding author. The data are not publicly available because part of a research project not yet concluded.
Acknowledgments
Thanks to Ittica Caldoli Fish Farm (Poggio Imperiale, Fg, Italy) for kind support in research practical activities.
Conflicts of Interest
The authors declare no conflict of interest.
References
- FAO. The State of the World Fishery and Aquaculture 2018—Meeting the Sustainable Development Goals; Licence: CC BY-NC-SA 3.0 IGO; FAO: Rome, Italy, 2018. [Google Scholar]
- Price, C.; Black, K.D.; Hargrave, B.T.; Morris, J.A. Marine cage culture and the environment: Effects on water quality and primary production. Aquacult. Environ. Interac. 2015, 6, 151–174. [Google Scholar] [CrossRef] [Green Version]
- Timmons, M.B.; Ebeling, J.M. Recirculating Aquaculture; Cayuga Aqua Ventures, LLC: Ithaca, NY, USA, 2007. [Google Scholar]
- Chiumenti, A.; Fait, G.; Limina, S.; da Borso, F. Performances of Conventional and Hybrid Fixed Bed Anaerobic Reactors for the Treatment of Aquaculture Sludge. Bioengineering 2020, 7, 63. [Google Scholar] [CrossRef] [PubMed]
- Chiumenti, A.; Limina, S.; Fait, G.; da Borso, F. Anaerobic Digestion of Thickened Sludge from Fish Production in CSTR and Hybrid Pilot Scale Digesters. In Proceedings of the ASABE Annual Meeting, Virtual Edition, Lincoln, NE, USA, 13–15 July 2020. [Google Scholar]
- Kiel, M.; Dobslaw, D.; Engesser, K.H. Comparison of biological and chemical treatment processes as cost-effective methods for elimination of benzoate in saline wastewaters. Water Res. 2014, 66, 1–11. [Google Scholar] [CrossRef] [PubMed]
- Uygur, A. Specific nutrient removal rates in saline wastewater treatment using sequencing batch reactor. Process Biochem. 2006, 41, 61–66. [Google Scholar] [CrossRef]
- Tal, Y.; Schreier, H.J.; Sowers, K.R.; Stubblefield, J.D.; Place, A.R.; Zohar, Y. Environmentally sustainable land-based marine aquaculture. Aquaculture 2009, 286, 28–35. [Google Scholar] [CrossRef]
- Mirzoyan, N.; Tal, Y.; Gross, A. Anaerobic digestion of sludge from intensive recirculating aquaculture systems: Review. Aquaculture 2010, 306, 1–6. [Google Scholar] [CrossRef]
- Mirzoyan, N.; McDonald, R.C.; Gross, A. Anaerobic Treatment of Brackishwater Aquaculture Sludge: An Alternative to Waste Stabilization Ponds. J. World Aquac. Soc. 2012, 43, 238–248. [Google Scholar] [CrossRef]
- Chiumenti, R.; Chiumenti, A.; da Borso, F.; Limina, S.; Landa, A. Anaerobic Digestion of Swine Manure in Conventional and Hybrid Pilot Scale Plants: Performance and Gaseous Emissions Reduction. In Proceedings of the ASABE Annual Meeting, Reno, NV, USA, 21–24 June 2009; pp. 21–24. [Google Scholar]
- Wong, B.; Show, K.Y.; Lee, D.J.; Lai, J.Y. Carbon balance of anaerobic granulation process: Carbon credit. Bioresour. Technol. 2009, 100, 1734–1739. [Google Scholar] [CrossRef]
- Reed, S.C.; Crites, R.W.; Middlebrooks, E.J. Natural Systems for Waste Management and Treatment; McGraw-Hill: New York, NY, USA, 1995. [Google Scholar]
- Lefebvre, O.; Quentin, S.; Torrijos, M.; Godon, J.J.; Delgenès, J.P.; Moletta, R. Impact of increasing NaCl concentrations on the performance and community composition of two anaerobic reactors. Appl. Microbiol. Biotechnol. 2007, 75, 61–69. [Google Scholar] [CrossRef]
- Misson, G.; Mainardis, M.; Incerti, G.; Goi, D.; Peressotti, A. Preliminary evaluation of potential methane production from anaerobic digestion of beach-cast seagrass wrack: The case study of high-Adriatic coast. J. Clean. Prod. 2020, 254C, 120131. [Google Scholar] [CrossRef]
- Gebauer, R. Mesophilic anaerobic treatment of sludge from saline fish farm effluents with biogas production. Bioresour. Technol. 2004, 93, 155–167. [Google Scholar] [CrossRef] [PubMed]
- Dobslaw, D.; Engesser, K.H.; Stork, H.; Gerl, T. Low-cost process for emission abatement of biogas internal combustion engines. J. Clean. Prod. 2019, 227, 1079–1092. [Google Scholar] [CrossRef]
- Mulbry, W.; Selmer, K.; Lansing, S. Effect of liquid surface area on hydrogen sulfide oxidation during micro-aeration in dairy manure digesters. PLoS ONE 2017, 12, e0185738. [Google Scholar] [CrossRef] [PubMed] [Green Version]
- Chiumenti, A.; Pezzuolo, A.; Boscaro, B.; da Borso, F. Exploitation of Mowed Grass from Green Areas by Means of Anaerobic Digestion: Effects of Grass Conservation Methods (Drying and Ensiling) on Biogas and Biomethane Yield. Energies 2019, 12, 3244. [Google Scholar] [CrossRef] [Green Version]
- Zhang, X.; Ferreira, R.B.; Hu, J.; Spanjers, H.; van Lier, J.B. Improving methane production and phosphorus release in anaerobic digestion of particulate saline sludge from a brackish aquaculture recirculation system. Bioresour. Technol. 2014, 162, 384–388. [Google Scholar] [CrossRef]
- Pearse, L.F.; Hettiaratchi, J.P.; Kumar, S. Towards developing a representative biochemical methane potential (BMP) assay for landfilled municipal solid waste—A review. Bioresour. Technol. 2018, 254, 312–324. [Google Scholar] [CrossRef]
- APHA; AWWA; WEF. Standard Methods for the Examination of Water and Wastewater, 22nd ed.; American Public Health Association: Washington, DC, USA, 2012. [Google Scholar]
- Mainardis, M.; Flaibani, S.; Trigatti, M.; Goi, D. Techno-economic feasibility of anaerobic digestion of cheese whey in small Italian dairies and effect of ultrasound pre-treatment on methane yield. J. Environ. Manag. 2019, 246, 557–563. [Google Scholar] [CrossRef]
- Sun, C.; Liu, F.; Song, Z.; Wang, J.; Li, Y.; Pan, Y.; Sheng, T.; Li, L. Feasibility of dry anaerobic digestion of beer lees for methane production and biochar enhanced performance at mesophilic and thermophilic temperature. Bioresour. Technol. 2019, 276, 65–73. [Google Scholar] [CrossRef]
- Pramanik, S.K.; Suja, F.B.; Porhemmat, M.; Pramanik, B.K. Performance and Kinetic Model of a Single-Stage Anaerobic Digestion System Operated at Different Successive Operating Stages for the Treatment of Food Waste. Processes 2019, 7, 600. [Google Scholar] [CrossRef] [Green Version]
- Mirzoyan, N.; Parnes, S.; Singer, A.; Tal, Y.; Sowers, K.; Gross, A. Quality of brackish aquaculture sludge and its suitability for anaerobic digestion and methane production in an upflow anaerobic sludge blanket (UASB) reactor. Aquaculture 2008, 279, 35–41. [Google Scholar] [CrossRef]
- Luo, G.Z.; Li, P.; Tan, H.X.; Du, J.; Liang, W.Y. The start-upand saline adaptation of mesophilic anaerobic sequencing batch reactor treating sludge from recirculating aquaculture systems. Aquac. Eng. 2013, 54, 9–15. [Google Scholar] [CrossRef]
- Chiumenti, A.; da Borso, F.; Guercini, S.; Pezzuolo, A.; Zanotto, M.; Sgorlon, S.; Delle Vedove, G.; Miceli, F.; Stefanon, B. The Impact of the Dairy Cow Diet on Anaerobic Digestion of Manure. In Proceedings of the 2019 ASABE Annual International Meeting, Boston, MA, USA, 7–10 July 2019. [Google Scholar] [CrossRef]
- Priadi, C.; Wulandari, D.; Rahmatika, I.; Sarwanto Moersidik, S. Biogas Production in the Anaerobic Digestion of Paper Sludge. 5th International Conference on Chemical, Biological and Environmental Engineering. APCBEE Procedia 2014, 9, 65–69. [Google Scholar] [CrossRef] [Green Version]
- Liang, S.; Mcdonald, A.G. Anaerobic digestion of pre-fermented potato peel wastes for methane production. Waste Manag. 2015, 46, 197–200. [Google Scholar] [CrossRef] [PubMed]
- Achinas, P.; Li, Y.; Achinas, V.; Euverink, G.J.W. Biogas Potential from the Anaerobic Digestion of Potato Peels: Process Performance and Kinetics Evaluation. Energies 2019, 12, 2311. [Google Scholar] [CrossRef] [Green Version]
- Lanari, D.; Franci, C. Biogas production from solid wastes removed from fish farm effluents. Aquat. Living Resour. 1998, 11, 289–295. [Google Scholar] [CrossRef]
- Zhang, X.; Tao, Y.; Hu, J.; Liu, G.; Spanjers, H.; van Lier, J.B. Biomethanation and microbial community changes in a digester treating sludge from a brackish aquaculture recirculation system. Biores. Technol. 2016, 214, 338–347. [Google Scholar] [CrossRef] [Green Version]
- Gebauer, R.; Eikebrokk, B. Mesophilic anaerobic treatment of sludge from salmon smolt hatching. Biores. Technol. 2006, 97, 2389–2401. [Google Scholar] [CrossRef]
- Mirzoyan, N.; Gross, A. Use of UASB for brakish aquaculture sludge digestion under different conditions. Water Res. 2013, 47, 2843–2850. [Google Scholar] [CrossRef]
- IWA Task Group for Mathematical Modelling of Anaerobic Digestion Processes. Anaerobic Digestion Model No. 1 (ADM1). In Scientific and Technical Report No. 13; IWA Publishing: London, UK, 2002. [Google Scholar]
- Kafle, G.K.; Chen, L. Comparison on batch anaerobic digestion of five different livestock manures and prediction of biochemical methane potential (BMP) using different statistical models. Waste Manag. 2016, 48, 492–502. [Google Scholar] [CrossRef] [Green Version]
Figure 1.
Cumulative methane production from automatic methane potential test system (AMPTS) reactors during the biochemical methane potential (BMP) tests in relation to the different applied inoculum/substrate ratios, based on volatile solid content: IS03 is 3:1 ratio; IS30 is 30:1 ratio; IS50 is 50:1 ratio; S100 is only substrate (without inoculum).

Figure 2.
Daily methane production from AMPTS reactors during the BMP tests in relation to the different applied inoculum/substrate ratios, based on volatile solid content: IS03 is 3:1 ratio; IS30 is 30:1 ratio; IS50 is 50:1 ratio; S100 is only substrate (without inoculum).
Figure 2.
Daily methane production from AMPTS reactors during the BMP tests in relation to the different applied inoculum/substrate ratios, based on volatile solid content: IS03 is 3:1 ratio; IS30 is 30:1 ratio; IS50 is 50:1 ratio; S100 is only substrate (without inoculum).

Figure 3.
BMP values calculated from the different tested inoculum/substrate ratios (means and standard errors are indicated by numbers and bars, all significant differences p < 0.01).
Figure 3.
BMP values calculated from the different tested inoculum/substrate ratios (means and standard errors are indicated by numbers and bars, all significant differences p < 0.01).

Figure 4.
Linear regressions obtained between the tested models (Gompertz equation and first-order model) and the experimental methane production tests. The coefficients of determination R2 are indicated for each regression function.
Figure 4.
Linear regressions obtained between the tested models (Gompertz equation and first-order model) and the experimental methane production tests. The coefficients of determination R2 are indicated for each regression function.


Table 1.
Main physicochemical composition of fish sludge and inoculum (mean values and standard deviations).
Table 1.
Main physicochemical composition of fish sludge and inoculum (mean values and standard deviations).
| Parameter | Units | Fish Sludge (Substrate) | Inoculum |
|---|---|---|---|
| Total solids (TS) | g/L | 14.29 ± 0.3 | 64.27 ± 0.8 |
| Volatile solids (VS) | g/L | 4.70 ± 0.1 | 47.82 ± 0.6 |
| Volatile solids (VS) | % TS | 32.9 ± 1.5 | 74.4 ± 0.9 |
| Total COD (tCOD) | mg/L | 4045 ± 405 | n.d. |
| Soluble COD (sCOD) | mg/L | 3680 ± 220 | 8000 ± 75 |
| Total Nitrogen (TN) | g/L | 0.2 ± 0.07 | 4.53 ± 0.6 |
| Ammoniacal Nitrogen (TAN) | g/L | 0.011 ± 0.002 | 2.95 ± 0.5 |
| Volatile fatty acids (VFA) | mg/L | 596.5 ± 64.3 | 3115 ± 16.5 |
| Total alkalinity (TAC) | mg/L | 815.0 ± 0.1 | 17,058 ± 183 |
| VFA/TAC | - | 0.732 | 0.183 |
| Salinity | g/L | 12 | - |
| Redox potential | mV | −60 ± 8 | −328 ± 9 |
| pH | - | 5.9 ± 0.2 | 7.9 ± 0.0 |
Table 2.
Determination of the hydrolysis rate constant (k), lag phase duration (λ) and maximum methane production rate (Rmax) from the first-order kinetic model and the modified Gompertz model.
Table 2.
Determination of the hydrolysis rate constant (k), lag phase duration (λ) and maximum methane production rate (Rmax) from the first-order kinetic model and the modified Gompertz model.
| I/S Ratio | K (1/Day) | λ (Day) | Rmax (NmL/g VS Day) |
|---|---|---|---|
| 50 (IS50) | 0.15 | 14.0 | 63.1 |
| 30 (IS30) | 0.13 | 13.5 | 40.3 |
| 3 (IS03) | 0.11 | 5.5 | 16.0 |
| 0 (S100) | 0.11 | 7.6 | 15.4 |
Publisher’s Note: MDPI stays neutral with regard to jurisdictional claims in published maps and institutional affiliations. |
© 2021 by the authors. Licensee MDPI, Basel, Switzerland. This article is an open access article distributed under the terms and conditions of the Creative Commons Attribution (CC BY) license (http://creativecommons.org/licenses/by/4.0/).
Share and Cite
MDPI and ACS Style
da Borso, F.; Chiumenti, A.; Fait, G.; Mainardis, M.; Goi, D. Biomethane Potential of Sludges from a Brackish Water Fish Hatchery. Appl. Sci. 2021, 11, 552. https://0-doi-org.brum.beds.ac.uk/10.3390/app11020552
AMA Style
da Borso F, Chiumenti A, Fait G, Mainardis M, Goi D. Biomethane Potential of Sludges from a Brackish Water Fish Hatchery. Applied Sciences. 2021; 11(2):552. https://0-doi-org.brum.beds.ac.uk/10.3390/app11020552
Chicago/Turabian Styleda Borso, Francesco, Alessandro Chiumenti, Giulio Fait, Matia Mainardis, and Daniele Goi. 2021. "Biomethane Potential of Sludges from a Brackish Water Fish Hatchery" Applied Sciences 11, no. 2: 552. https://0-doi-org.brum.beds.ac.uk/10.3390/app11020552
Note that from the first issue of 2016, this journal uses article numbers instead of page numbers. See further details here.