Article

High-Precision Surface Scattering Measurement System and Uncertainty Analysis Applied in Laser Protective Materials Diagnostics

1
National Key Laboratory of Science and Technology on Tunable Laser, Harbin Institute of Technology, Harbin 150080, China
2
Department of Optoelectronic Information Science and Technology, Harbin Institute of Technology, Harbin 150001, China
3
Post-Doctoral Mobile Station of Instrumentation Science and Technology, School of Instrumentation Science and Engineering, Harbin Institute of Technology, Harbin 150001, China
*
Authors to whom correspondence should be addressed.
Submission received: 21 July 2021 / Revised: 29 September 2021 / Accepted: 8 October 2021 / Published: 12 October 2021
(This article belongs to the Special Issue State-of-the-Art Laser Measurement Technologies)

Abstract

:
The current measurement system of surface scattering rate applied in laser protective materials has the defects of low accuracy, discontinuous diagnosis region and narrow infrared measuring waveband. In order to make up for these shortcomings, a high-precision material-surface-scattering-rate measurement system based on a three-hole integrating sphere is proposed, which can realize the high-precision quantitative measurement on any region of coating surface from near-infrared to far-infrared band. Firstly, a new quantitative relationship between the luminous flux received by detector and the surface scattering rate of coating is obtained by modifying the existing integrating sphere scattering model. Secondly, a high-precision scattering characteristic measurement system based on a three-hole integrating sphere is designed and achieved. The influence of the main design parameters of the integrating sphere on the expected measuring accuracy of the system is investigated by using a TracePro simulation. Accordingly, the optimal design parameters of the system are given. Then, the main sources of the relative measurement uncertainty for the scattering rate are investigated experimentally, and four main relative uncertainty factors are evaluated quantitatively. Finally, according to the error propagation theory, the total experimental relative measurement uncertainty of the system is obtained, which is ±2.22% and 26–56% higher than the current measuring accuracy. The new coating-scattering-rate measurement system proposed in this paper can provide an effective experimental detection means for high-precision quantitative measurement and a performance evaluation for laser-protective-coating surface-scattering rate.

1. Introduction

In recent years, with the growing maturity of the high-power laser countermeasures and the lidar detection technology, some laser countermeasures and detection systems have reached the practical application level, which puts forward more stringent requirements for the laser damage resistance performance of laser protection stealth materials [1,2,3]. How to effectively avoid and resist the threat of high-power laser has become a hot issue in the current research field of laser protection. At present, the threat of high-power laser can be avoided mainly from two aspects [4,5]: one is to develop laser stealth materials to reduce the risk of target detection for the lidar and tracking device loaded in laser countermeasure equipment; the other is to develop laser protective materials to resist the attack and damage of high-power laser. It is generally considered that adding laser protective coating on the protected target is an effective way to resist the high-power laser damage. There are three kinds of laser protection materials to resist laser damage, which are ablation protection [6,7,8], reflection protection [9,10,11] and composite protection [12,13,14], respectively. Although these protecting systems can resist the damage caused by high-power laser at a certain extent, these methods belong to the static and passive protection mode and have the disadvantage of single protection effect. In particular, the laser protection method with high reflectivity will inevitably lead to the problem of low concealment for the protected target, which is not conducive to the survival of the equipment. Therefore, it is urgent to develop laser protection materials with both laser stealth and protection functions. The intelligent laser protection system with self-activation function has been considered to be the most promising and challenging technology [15,16,17]. The development of intelligent phase change laser protection materials with high reflection performance has great application value.
Generally, the self-activated intelligent laser protective coating is in a concealed state when it is not irradiated by laser. In this case, the reflectivity of the coating surface is low. When the external high-power laser invades the target surface, the coating will produce self-activation response to the laser, and the surface reflectivity will increase rapidly, reflecting most of the laser energy, so as to achieve the effect of target protection. Therefore, the surface reflectance is an important parameter to evaluate the laser ablation resistance for the self-activated intelligent laser protective coatings. The reflectance measuring methods for coating surface can be roughly divided into two categories: the first is to evaluate the reflection and absorption of laser by studying the changes of material state or measuring the temperature change of the material before and after absorbing the laser in the irradiated region. The main method is the laser absorption calorimeter [18,19,20,21,22]; The second is to measure the reflectivity of materials from the optical point of view, usually using the integrating sphere measuring method [23,24,25,26,27,28].
Among these two reflectivity measurement methods, although the laser calorimeter can quantitatively measure the reflectivity of materials, it has some limitations. First of all, when the calorimetry is used to measure, it is usually assumed that the light energy absorbed by the material is totally converted into the heat energy, that is, the light energy absorbed by the material can be equivalent to a certain heat flux injection. However, the heat exchange between the material and the external environment is ignored in the measuring process, leading to the large errors compared with the real results. Secondly, the calorimetric method can only measure the reflectance for a small number of materials meeting the lumped parameter conditions. It is difficult to determine the reflectance for other types of materials. Compared with the laser calorimeter method, the method of integrating sphere has higher accuracy thanks to its high efficient collection for the scattering light. However, the current integrating sphere reflectance measurement system has some defects: Firstly, the laser wavelengths used for the reflectivity measurement are limited, most of them can only response to the wavelength from ultraviolet to visible light, instead of the range from near-infrared to far-infrared band. Secondly, the measuring region is always discontinuous, so it is impossible to measure the scattering rate in a specific region on the coating surface. Thirdly, the measuring accuracy still needs to be improved. The reflectivity measurement accuracy of the current integrating sphere system is less than 3–5% [29,30,31,32].
In order to realize the high-precision measurement of the scattering rate for specific damage region on the coating surface in infrared band, a material-surface-scattering-rate measurement system responded to the infrared laser was proposed based on the three-hole integrating sphere. First of all, according to the structure characteristics of three-hole integrating sphere and the Lambert diffuse reflection model, the quantitative relationship between the scattering rate of material surface and the incident light power was given theoretically. Then, the main factors affecting the measuring accuracy of the system were analyzed and simulated by using the TracePro tool [33]. The correctness of the simulation analysis results was verified by the experiments. Finally, through the establishment of a high-precision three-hole integrating sphere scattering rate experimental measurement system, and combined with the results of TracePro simulation analysis, the uncertainty sources and interfering factors from the laser power stability, the laser incidence angle, the gap between the sample and the hole of integrating sphere, and the ambient light were comparatively analyzed. The maximum measuring relative uncertainty of the system was found to be less than ±2.22%. The measuring accuracy was higher than that of the current integrating sphere measurement results, which provided an important experimental evaluation method for accurately and quantitatively characterizing the surface infrared laser reflection performance of self-activated intelligent laser protective coating.

2. Theoretical Modified Model of Scattering Characteristics on Coating Surface

As shown in Figure 1, it is assumed that the reflection law of the material inside the integrating sphere follows Lambert’s law of diffuse reflection, so the illuminance at any point inside the integrating sphere consists of two parts: one is the illuminance generated by the light source directly irradiating a point a; and the other is the superimposed illuminance generated at the point a, excluding the contribution of illuminance caused by directly irradiating from the light source to point a.
For any point a in the integrating sphere, the illuminance E0 produced by directly irradiating from the light source can be expressed as follows:
E 0 = ϕ 4 π r 2
where ϕ is the total luminous flux of the light source, and r is the radius of the integrating sphere. The illuminance E1 after one time reflection can be represented as follows: E 1 = ρ · ϕ 4 π r 2 , where ρ is the coating reflectivity on the inner wall of the integrating sphere. The illumination E2 produced by secondary reflection can be expressed as E 2 = ρ 2 · ϕ 4 π r 2 . Then, one can infer that the illuminance En after the nth reflection is E n = ρ n · ϕ 4 π r 2 .
Therefore, the total illumination produced at point a can be written as follows:
E = E 0 + E 1 + E 2 + + E n + = ϕ 4 π r 2 + ρ · ϕ 4 π r 2 + ρ 2 · ϕ 4 π r 2 + + ρ n · ϕ 4 π r 2 + = ϕ 4 π r 2 + ρ · ϕ 4 π r 2 ( 1 + ρ 1 + ρ 2 + + ρ n + ) = ϕ 4 π r 2 + ϕ 4 π r 2 · ρ 1 ρ
where the first term in Equation (2) is the illuminance produced by the light source directly irradiating at the point, and the second term is the sum of the illuminance produced by the light reflected by other points. For a single-hole integrating sphere, when the laser enters the integrating sphere from the hole, it will not directly irradiate the point outside the incident position. Therefore, Equation (2) can be simplified as follows:
E = ϕ 4 π r 2 · ρ 1 ρ
For the three-hole integrating sphere, as shown in Figure 2, the laser enters into the integrating sphere from hole a to hole b. The hole b is blocked by the measured coating sample. The laser incident on the material surface is reflected many times in the integrating sphere and finally reaches the port of detector window c. With photoelectric signal conversion module, the detector converts the collected illumination into current signal. After calculation by using the data-processing module, the measurement results are output by a display module.
It is assumed that the average spectral reflectance of the diffuse reflective coating material in integrating sphere is ρ and the total radiation flux of the laser source entering the integrating sphere is ϕ0. As the light on the inner surface of integrating sphere reaches equilibrium after several times of diffuse reflection, the radiation flux distribution in the inner cavity is uniform and the illuminance is equal everywhere. As a result, the illuminance at any point in the integrating sphere is as follows:
E = ϕ A
where ϕ represents the sum of the radiation fluxes after multiple reflections in the inner cavity of the integrating sphere, and A is the surface area of the integrating sphere inner wall.
Since the divergence angle of the laser source used in the experiment is rather small (~1 mrad), it can be approximately considered as a parallel light. Therefore, when the laser first irradiates the surface of the measured sample, the incident beam is reflected by the coating and then the reflected beam is scattered around. After first diffuse reflection, the luminous flux ϕ1 remaining in the integrating sphere can be written as:
ϕ 1 = s · ϕ 0 · ( 1 d 1 2 + d 2 2 4 D 2 )
where ϕ0 represents the total radiation flux in the integrating sphere without diffuse reflection; s is the scattering rate of the sample to be measured; D is the diameter of the integrating sphere; d1 is the entrance port diameter of the integrating sphere, d2 is the diameter of the hole at the detector location; d3 is the diameter of the hole at the coating sample plate.
The remaining luminous flux ϕ1 after the first diffuse reflection will be diffused for the second time in the integrating sphere. Therefore, the remaining luminous flux ϕ2 after the second diffuse reflection can be expressed as follows:
ϕ 2 = ρ · ϕ 1 · [ 1 d 1 2 + d 2 2 4 D 2 ( 1 s ) d 3 2 4 D 2 ]
where the second term in Equation (6) represents the luminous flux loss factor caused by the incident port a and the port of opening window b at the detector location, and the third term represents the luminous flux loss caused by the surface absorption of the measured coating.
Let λ = 1 d 1 2 + d 2 2 4 D 2 ( 1 s ) d 3 2 4 D 2 , then
ϕ 2 = ρ · ϕ 1 · λ
where λ is defined as the luminous flux loss factor.
After the third diffuse reflection, the luminous flux ϕ3 remaining in the integrating sphere is calculated as follows:
ϕ 3 = ρ · ϕ 2 · λ = ρ · ϕ 1 · λ 2
For the fourth diffuse reflection, the luminous flux ϕ4 remaining in the integrating sphere is calculated as follows:
ϕ 4 = ρ · ϕ 3 · λ = ρ · ϕ 1 · λ 3
By using the induction method, one can know that after nth times of diffuse reflection, the luminous flux ϕn remaining in the integrating sphere can be written as follows:
ϕ n = ρ n 1 · ϕ 1 · λ n 1
By accumulating the luminous flux remaining in the integrating sphere after each diffuse reflection, the following results can be obtained:
ϕ = ϕ 1 + ϕ 2 + ϕ 3 + + ϕ n = ϕ 1 + ρ · ϕ 1 · λ ( 1 λ n ) 1 λ
The scattering rate on the coating surface can be calculated by Equation (11). Therefore, the luminous flux Φd received by the detector can be express as follows:
Φ d = η · ϕ · S t A = [ 1 + ρ · λ ( 1 λ n ) 1 λ ] · η ϕ 1 S t A
where η is the response efficiency of the detector to the laser wavelength used in the measurement, and St is the area of the detector opening port. Equation (12) gives the mathematical expression and design principle between the incident luminous flux of the three-hole integrating sphere and the received luminous flux of the detector. It is easy to know that the received luminous flux of the detector is positively proportional to the area of the detector opening, and positively related to the incident laser light flux and the average spectral reflectance of the diffuse reflective coated on the inner wall of the integrating sphere. There is a negative correlation between the diameters of the light entrance port and the opening at the sample plate.

3. Design, Simulation and Implementation for Scattering Measurement System

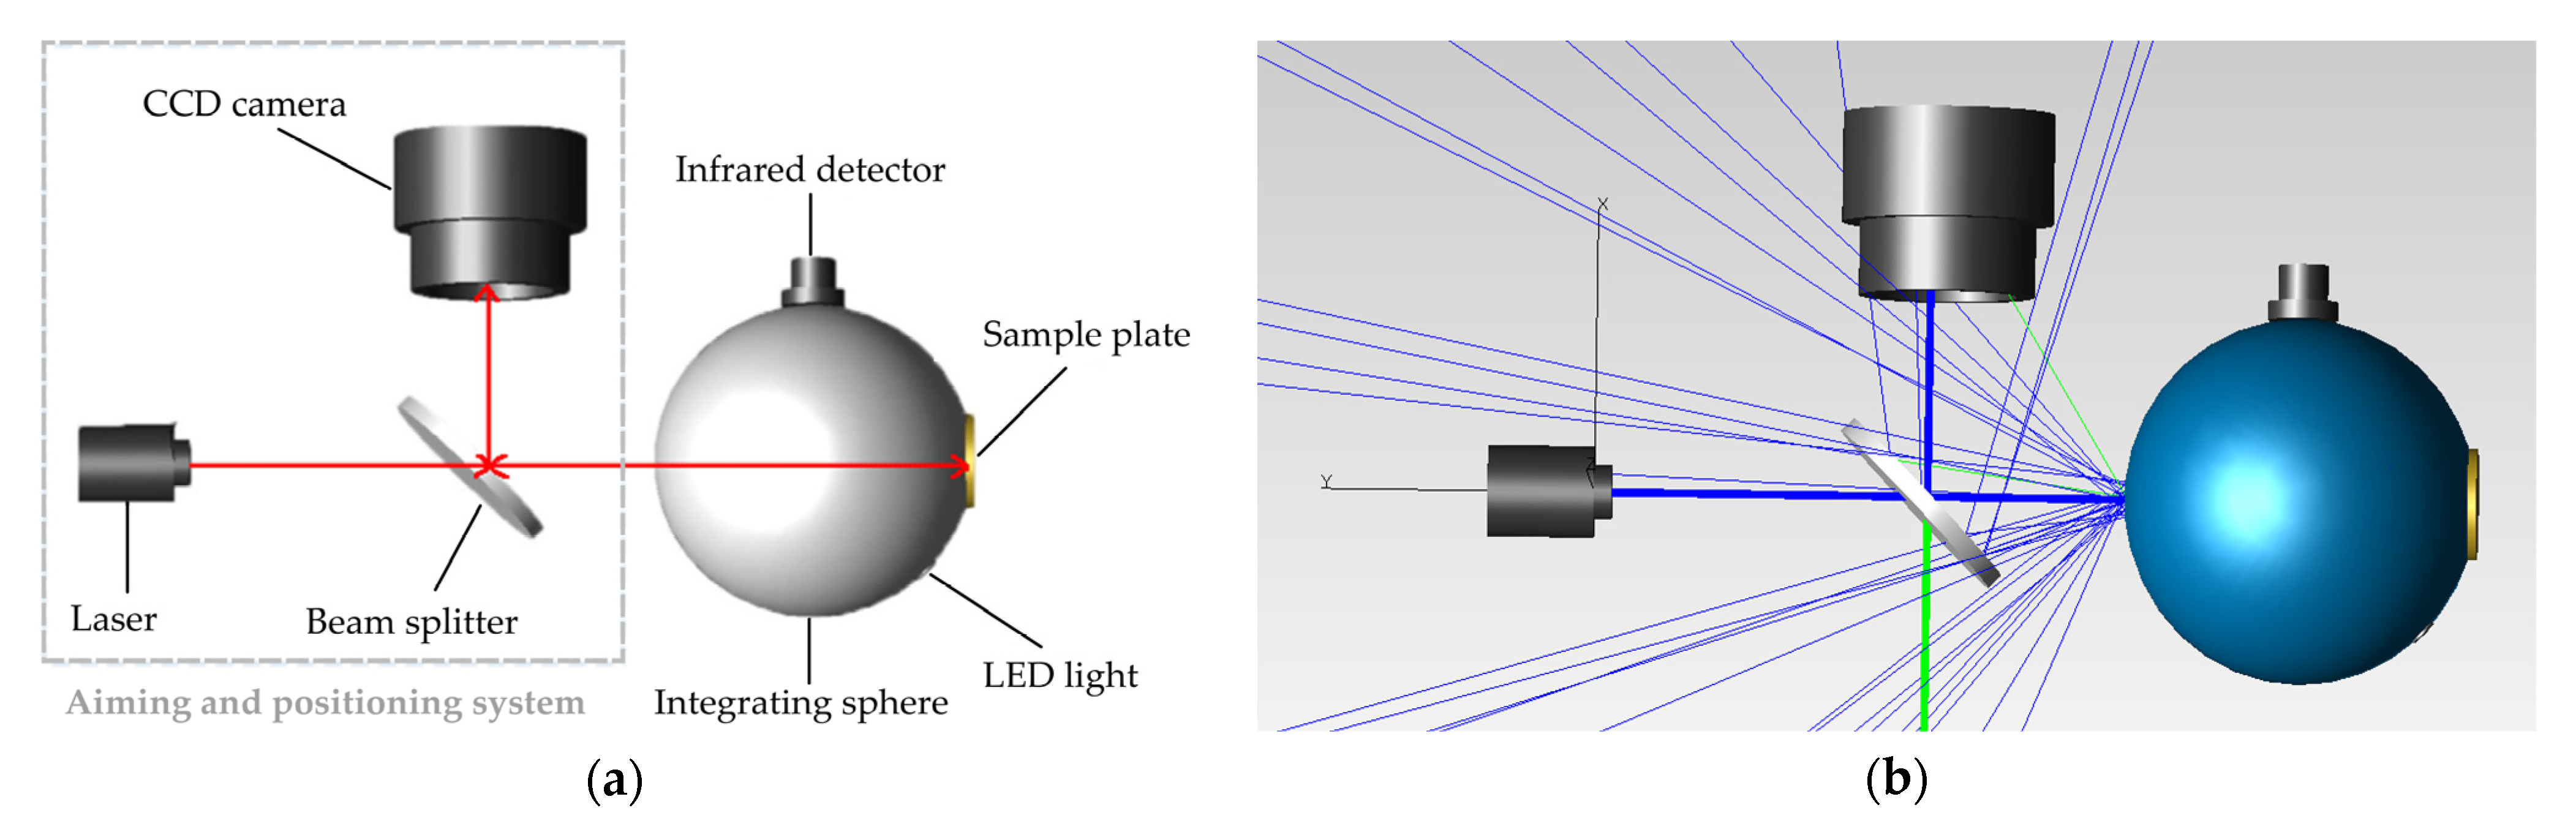
3.1. Design and Simulation for Aiming-and-Positioning System

The scattering-rate measurement system based on three-hole integrating sphere was mainly composed of the aiming-and-positioning system, the scattered-light collection and the data-processing system. The laser wavelength was 1064 nm in this paper. The laser wavelength at 1064 nm is invisible to the naked eye. Therefore, in order to observe and adjust the position of the incident spot on the sample plate, it is necessary to design the corresponding visible-light aiming-and-positioning system.
The green laser at 532 nm was used as the light source of the aiming-and-positioning system. The beam splitter was placed between the laser and the integrating sphere, and a charge coupled device (CCD) camera was mounted on the side of the beam splitter to observe the position of the laser spot. Due to the high brightness of the laser and the closed space in the integrating sphere, only a green spot could be observed in the CCD camera when the laser was incident into the integrating sphere. In other words, the relative position of the measuring spot at the wavelength of 1064 nm on the sample plate would not be observed. Therefore, it is necessary to install a micro light emitting diode (LED) light inside the integrating sphere to improve the contrast for the convenience of observation. In this paper, blue light was used to excite yellow fluorescent material in TracePro to simulate the white light produced by LED.
Figure 3 shows the composition diagram of the aiming-and-positioning system and the simulation results obtained by TracePro. It could be seen that the laser passed through the beam splitter and reached the sample surface to form a spot. A small part of the light reflected from the sample surface was reflected by the beam splitter into the CCD camera for imaging, so that the relative position of the spot on the sample plate could be observed. Then, the position of the sample would be adjusted according to the CCD image to make the laser irradiate the coating surface region.
The above aiming-and-positioning system model was imported into TracePro, the images received by CCD camera were observed and recorded. The comparison results without and with LED lighting are shown in Figure 4. It was obvious from Figure 4a that the laser spot could only be observed in the integrating sphere without LED illumination, and the relative position of the spot on the sample plate could not be observed. In this case, the relative position between the laser spot and the sample could not be adjusted. After adding LED lighting source, as shown in Figure 4b, the CCD camera could clearly distinguish the relative position of the incident light spot on the sample. In this way, one can adjust the three-dimensional position of the sample plate according to the observed spot position, so as to achieve the accurate measurement of the region interested.

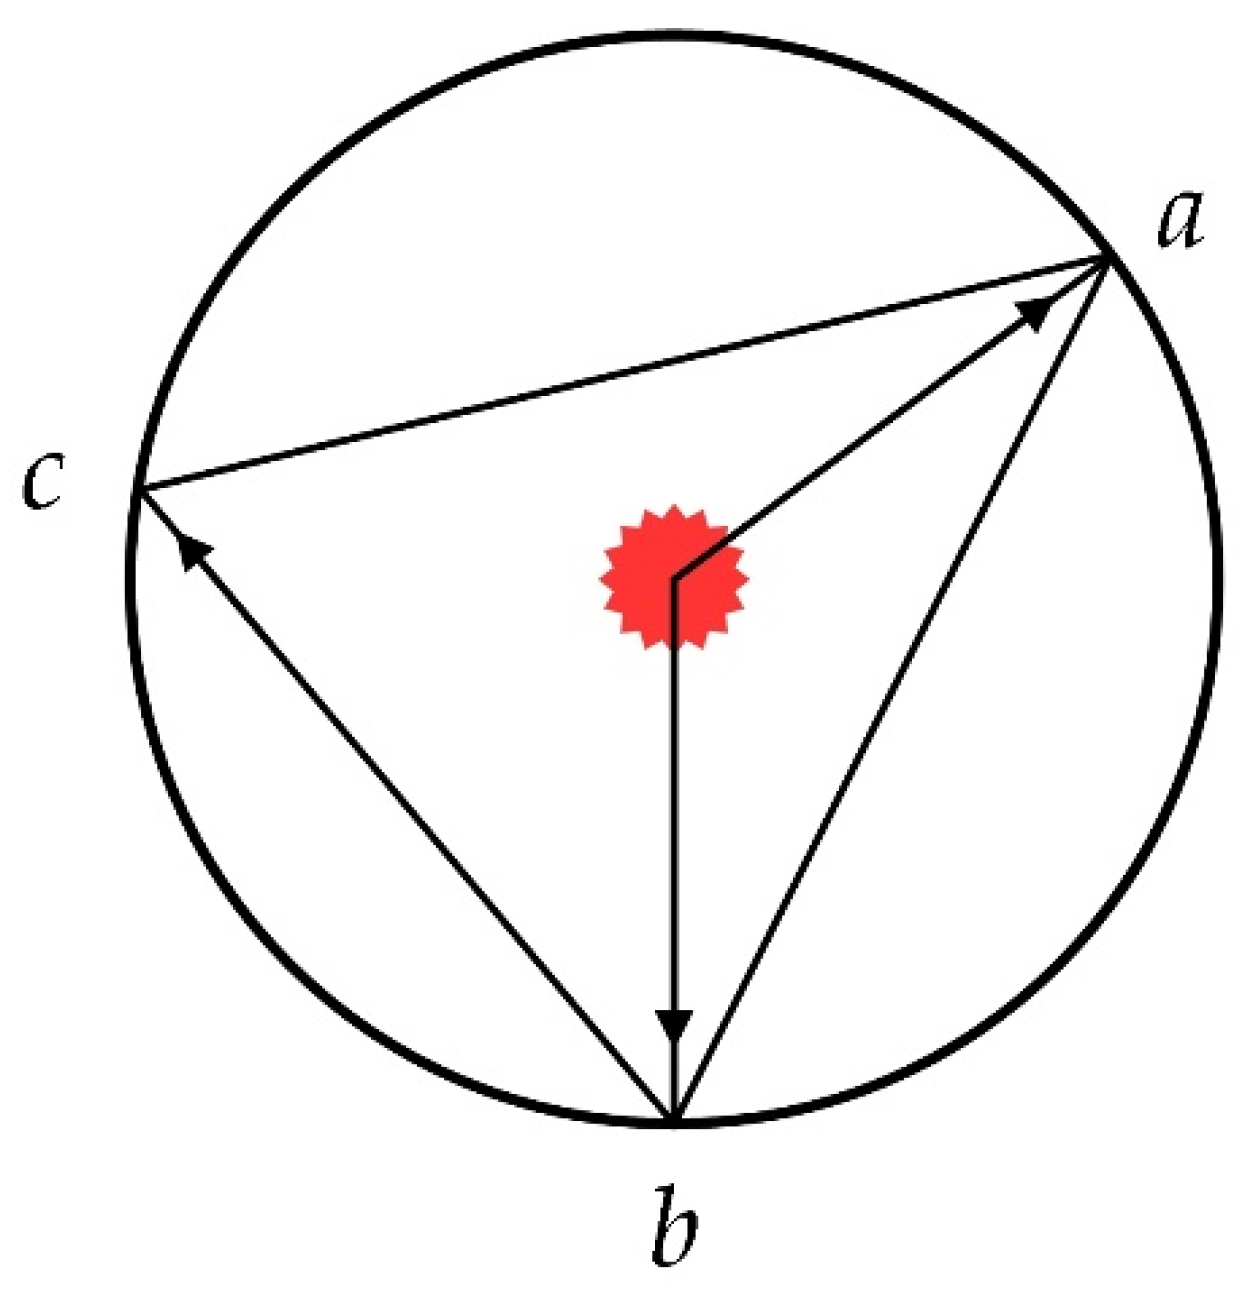
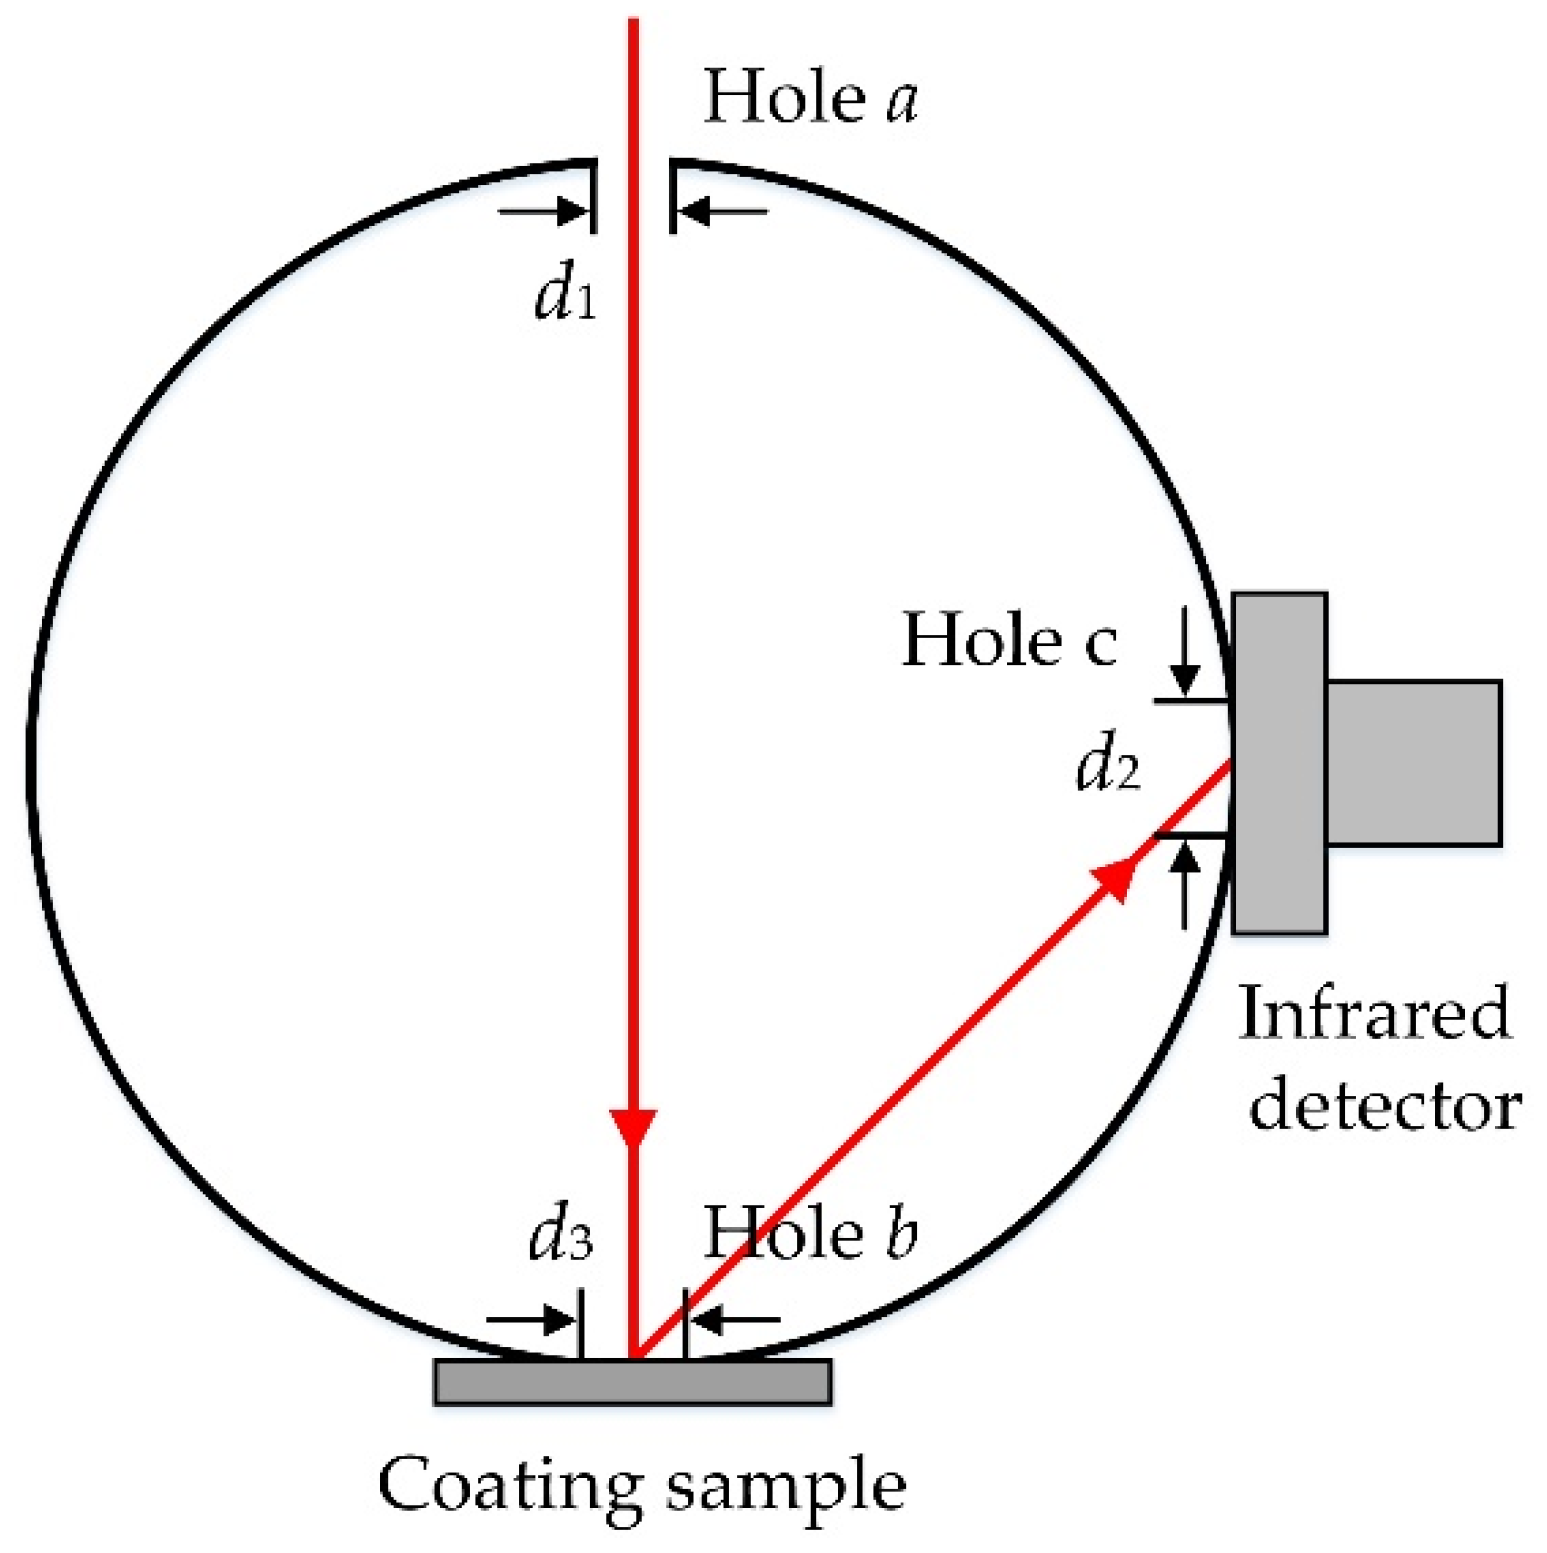
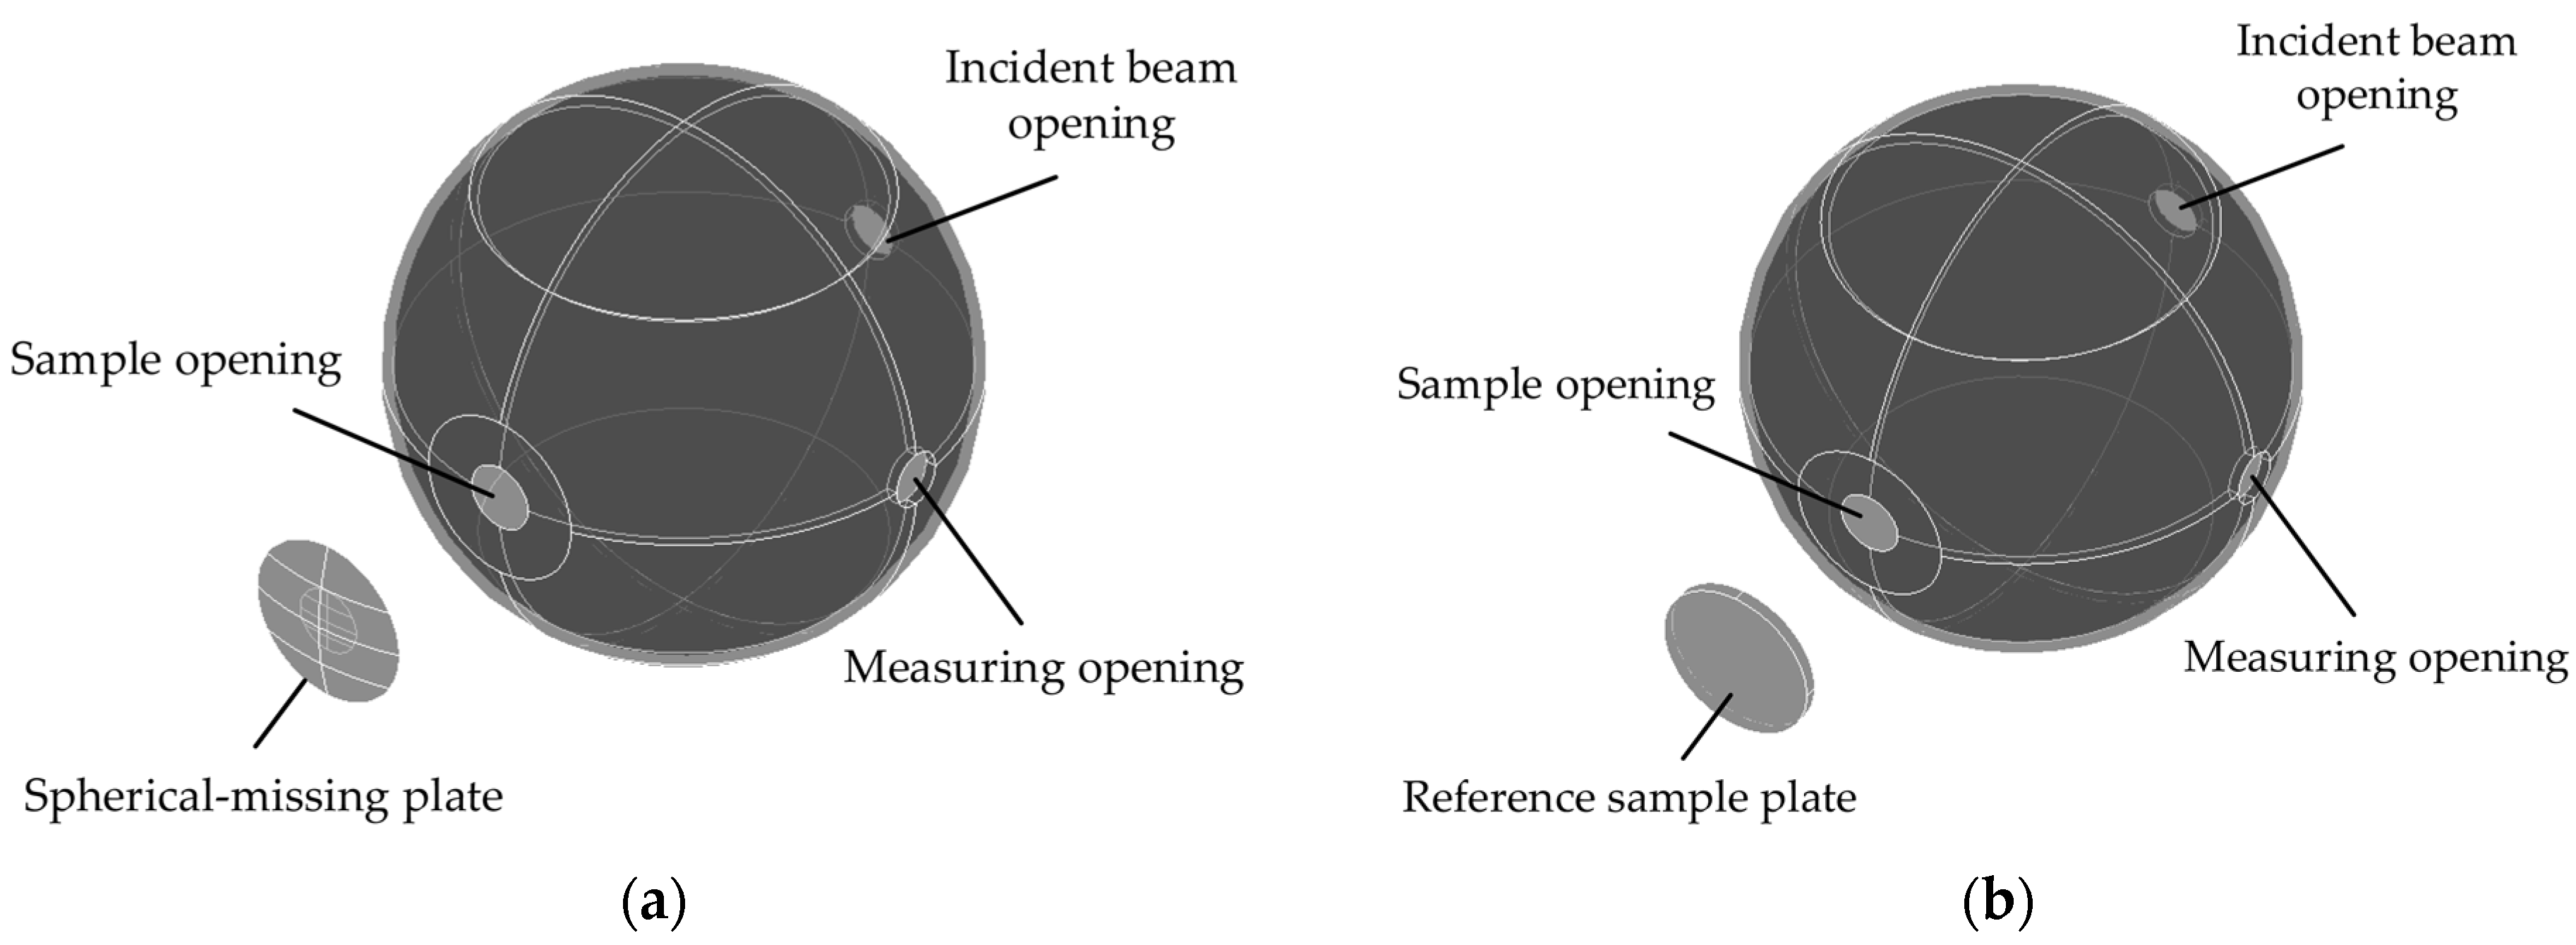
3.2. Modeling for Three-Hole Integrating Sphere

The integrating sphere models with spherical-missing plate and sample plate were established respectively. In this model, there were three holes, named incident beam opening, measuring opening and sample opening, on the surface of the integrating sphere. The measuring opening and the sample opening were respectively fitted with the detector and the sample plate, while the incident beam opening was empty.
Figure 5 shows a geometric model of integrating sphere with the spherical-missing plate and the sample plate. In Figure 5a, the contact position between the spherical-missing plate and the hole of the integrating sphere was a part of the sphere. When the spherical-missing plate and the integrating sphere coincided, the integrating sphere just formed a complete sphere, which was used to measure the background current noise. In Figure 5b, the reference sample plate in contact with the sample opening of the integrating sphere was a plane plate, which was used to provide reference calibration.
The TracePro was employed to achieve accurate simulation by using more tracing rays. However, with the increase of the tracing rays number, the effect of improving the accuracy for the results would be weaker. In the meantime, it would also cause a heavy computing burden for simulation. Therefore, in order to ensure the accuracy and efficiency of the results, we investigated the simulation effect for different numbers of tracing rays, and the results are shown in Figure 6. It could be seen from the Figure 6 that the simulated results fluctuated greatly when the number of tracing rays was small, which led to the low accuracy of the simulated results at this stage. With the increase of the tracing rays number, the simulated results gradually tended to be stable. After the number of tracing rays reached at 47,000, the simulated results only fluctuated in a small range.
According to Figure 6, the simulation results for tracing rays number could be divided into three intervals, namely 1000–20,000, 21,000–46,000 and 47,000–80,000. The standard deviation for these three sections of data could be obtained respectively to investigate the stability of the calculation results. The calculation results showed that the variation coefficient of simulated luminous flux was respectively 1.25%, 0.37% and 0.15% in the ranges of 1000–20,000, 21,000–46,000 and 47,000–80,000. Obviously, the luminous flux received by the detector fluctuated greatly in the range of 1000–20,000. At the range from 21,000 to 46,000, the simulated results were relatively stable, but there were still large fluctuations. When the number of tracing rays was more than 46,000, the standard deviation of simulated results was lower and more stable. Therefore, in this paper, 50,000 of tracing rays was chosen for high credibility results and short simulation time.

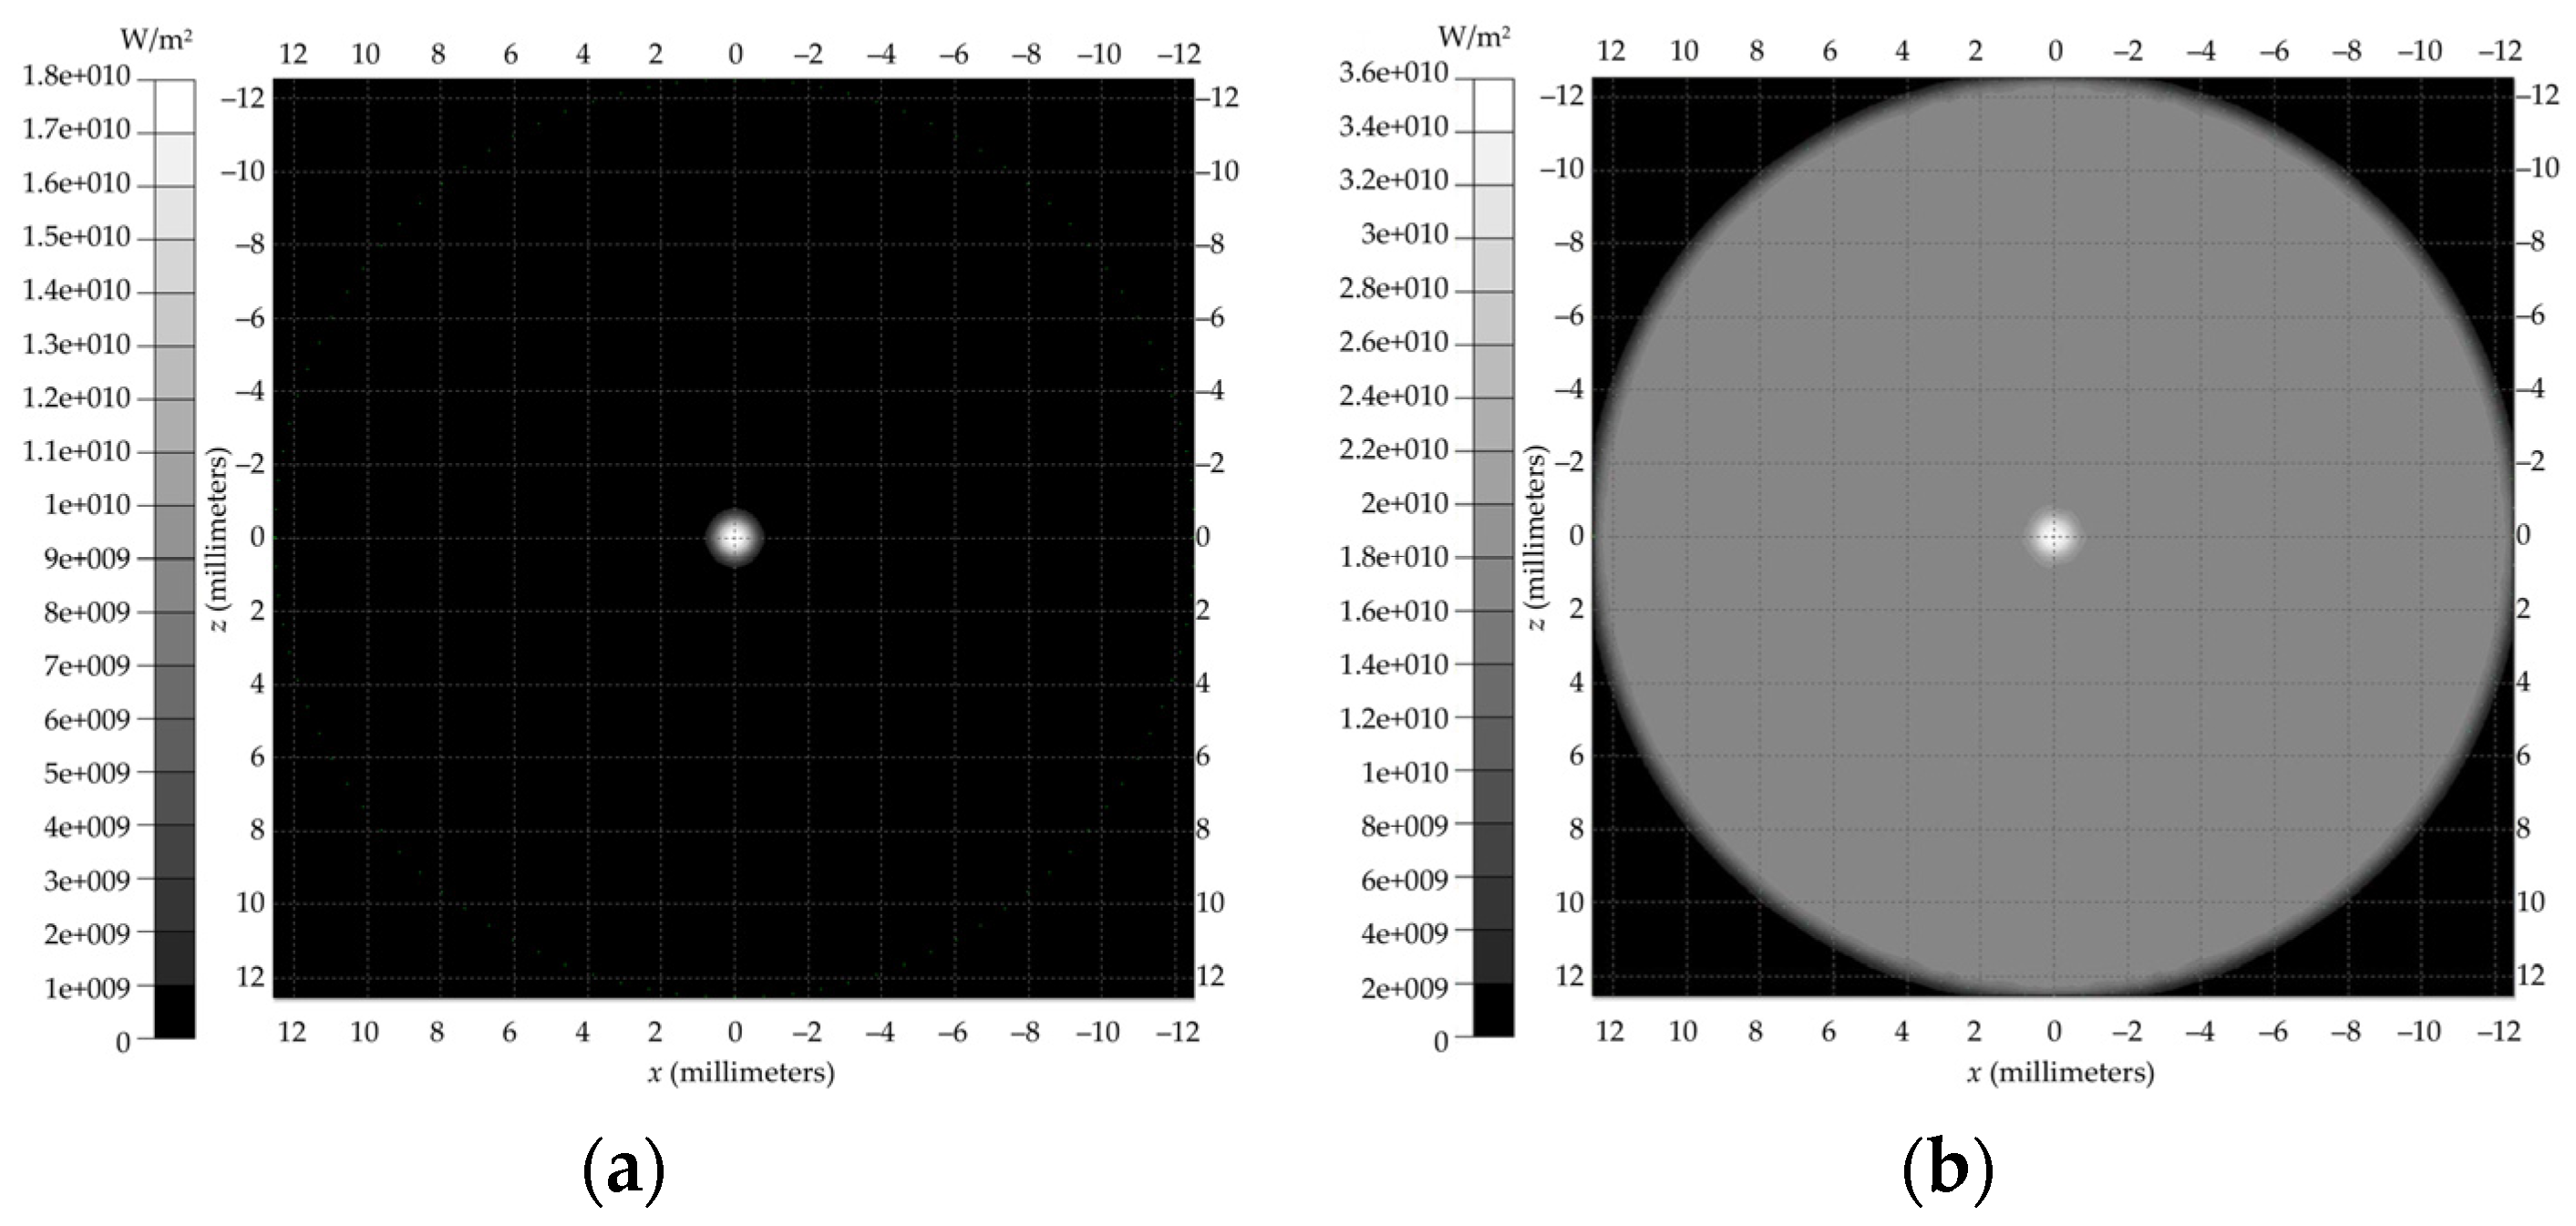
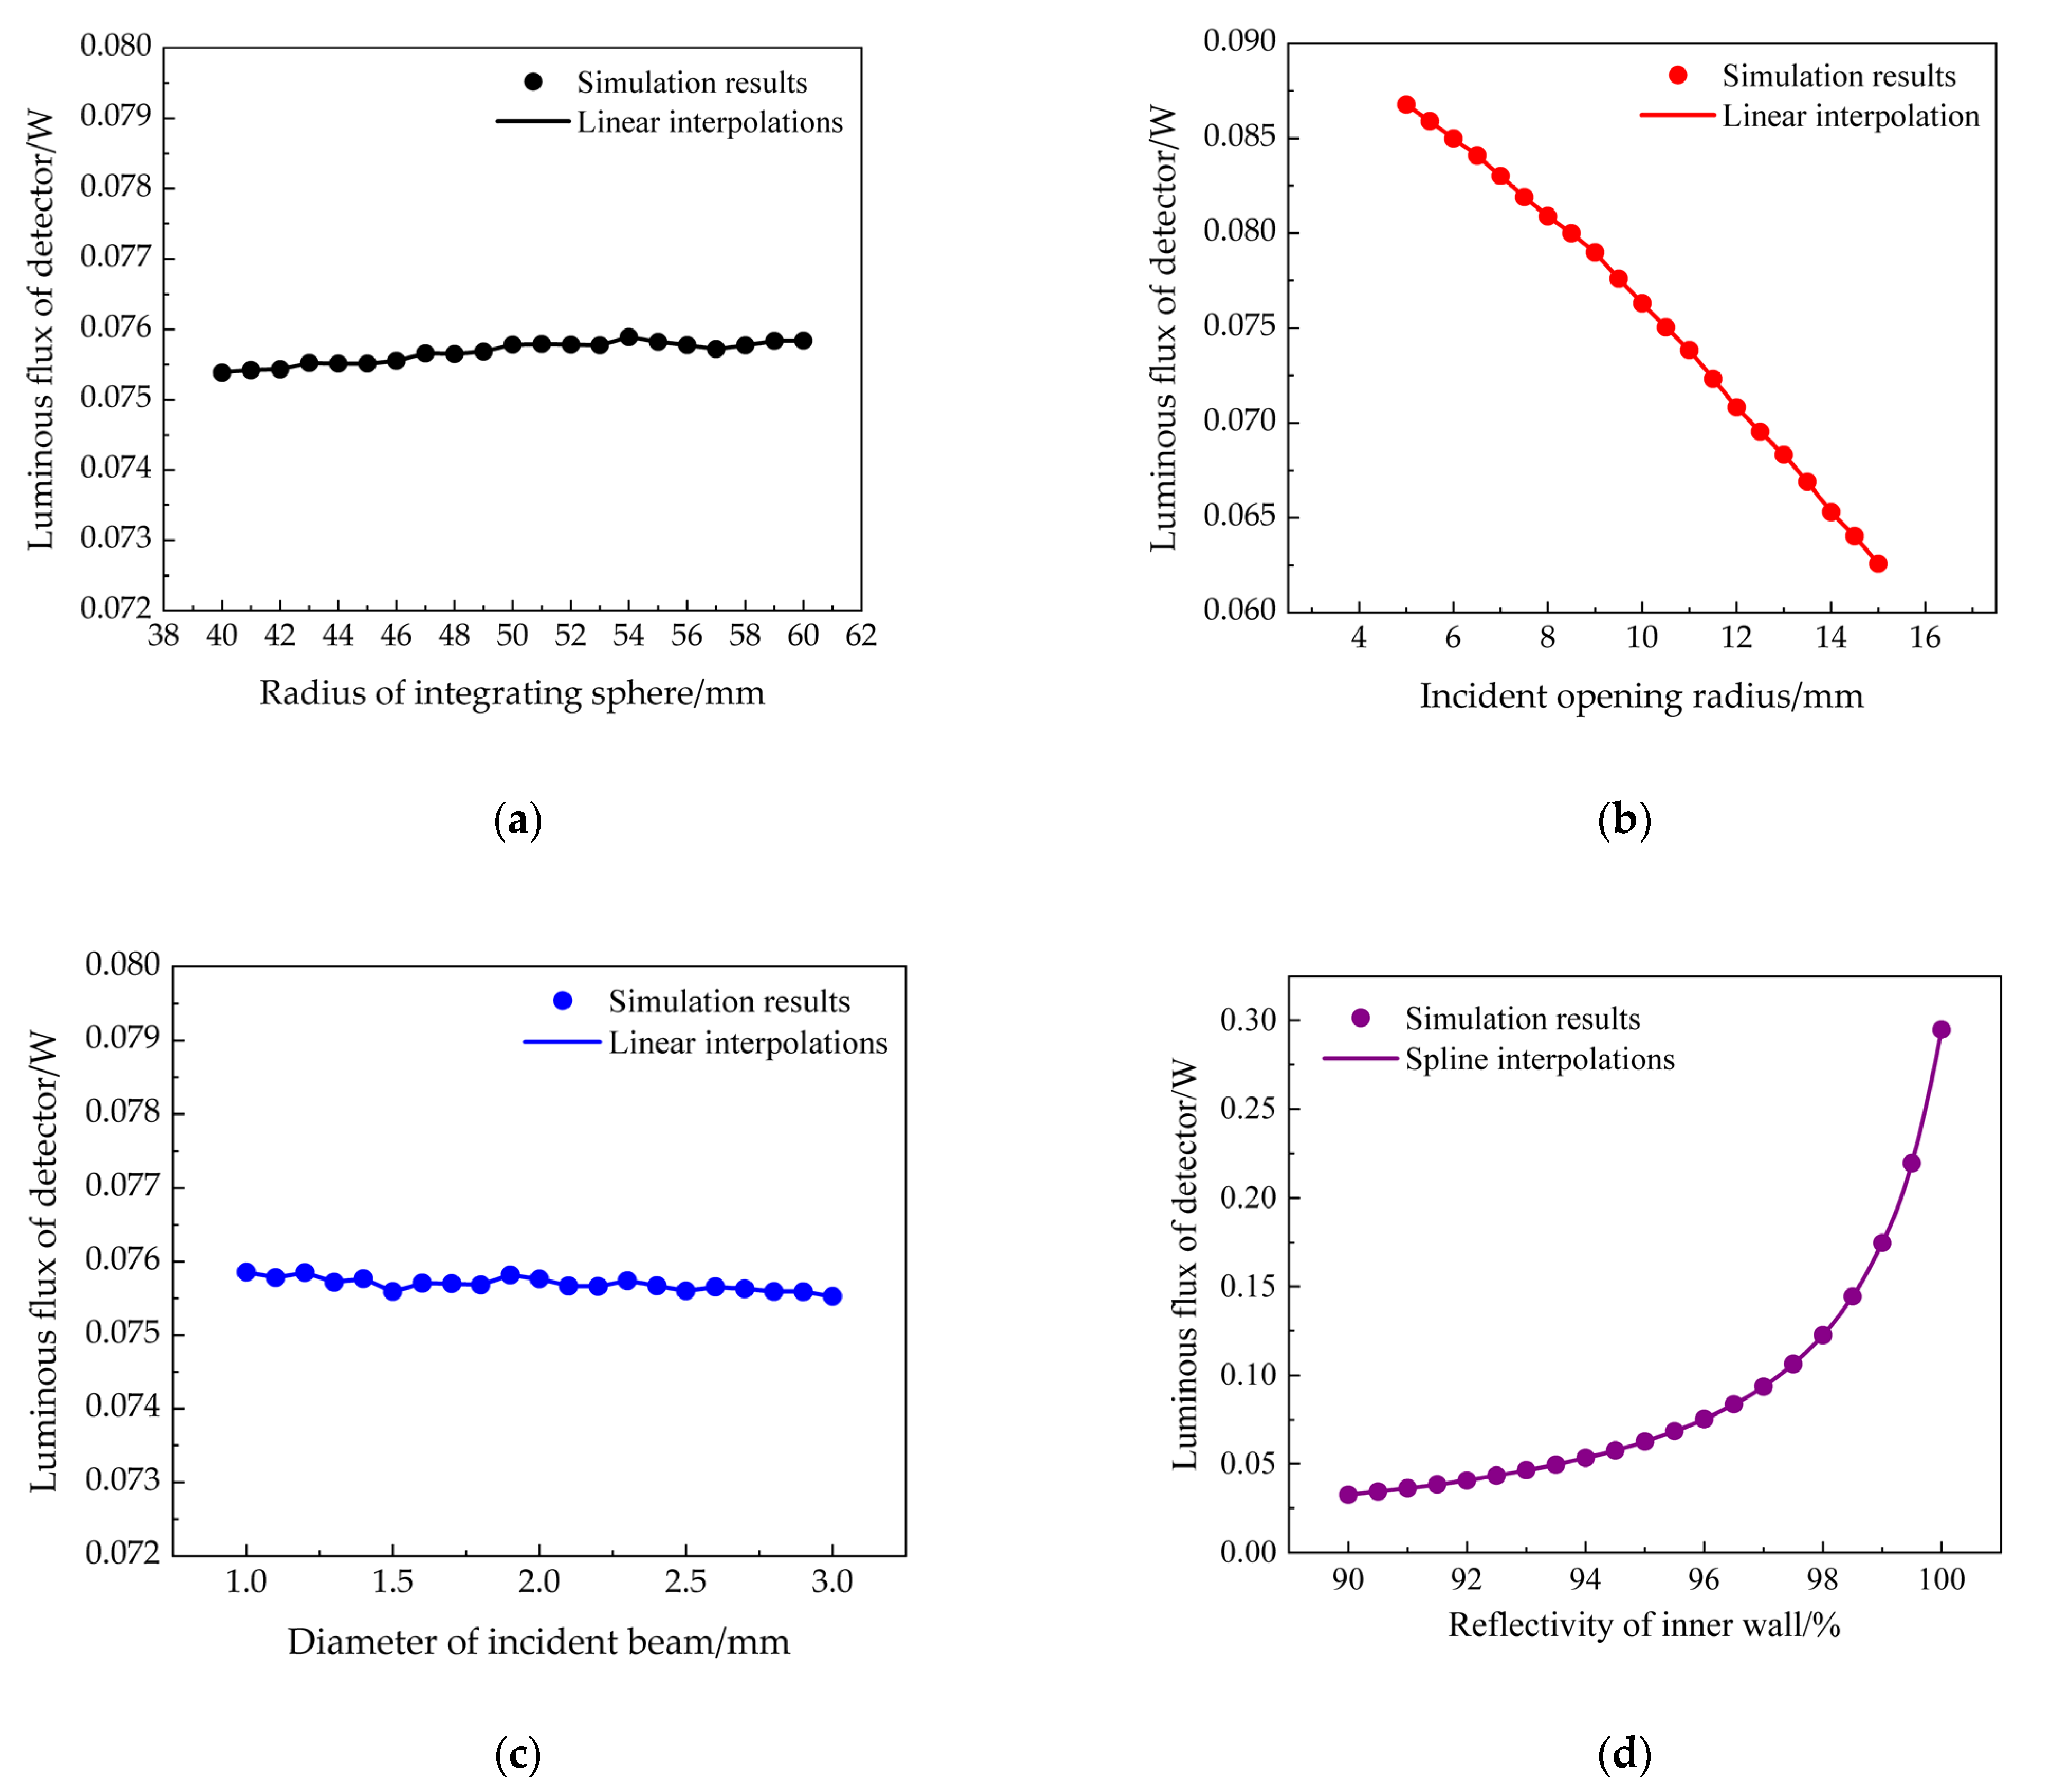
3.3. Influence of Design Parameters on Measurement Results

In order to quantitatively evaluate the influence of the design parameters on the simulated results, four influencing factors, namely, the radius of integrating sphere, the radius of the incident beam opening, the diameter of the incident beam and the coating reflectivity on the inner wall of the integrating sphere, were simulated and analyzed. The simulation results are shown in Figure 7.
Firstly, the variation of the luminous flux received by detector with the radius of the integrating sphere was simulated, as shown in Figure 7a. The radius of integrating sphere was set to 40–60 mm, the diameter of incident beam opening and measuring opening was equal to 20% of integrating sphere diameter, the diameter of sample opening was equal to 15% of integrating sphere diameter, the diameter of detector hole was 12% of integrating sphere diameter, the beam diameter was set to 2 mm and the luminous flux of laser source was 1 W.
It can be seen from Figure 7a that the luminous flux received by detector hardly changed with the varied radius of the integrating sphere. The further calculation showed that the average received luminous flux was 0.0757 W, and the standard deviation was 1.5 × 10⁻⁴ W. The coefficient of variation was only 0.2%. However, if the radius of integrating sphere was too small, the laser incident and sample opening would be too small, it is not easy to adjust the laser incident spot and the relative position of sample plate. Therefore, the larger integrating sphere should be selected appropriately. Since the diameter of integrating sphere had no obvious influence on the simulated results, the following simulation process would select the integrating sphere with a radius of 50 mm as the general design parameter.
Secondly, the variation of the luminous flux received by detector with the different opening radius of the incident beam was simulated. The simulation results are shown in Figure 7b. The opening radius of the incident beam was set to 5–15 mm, the beam diameter was 2 mm and the luminous flux of the output laser was 1 W. It can be seen that there was a negative correlation between the luminous flux of the incident light and the opening radius of the incident beam. Moreover, with the increasing of the diameter of incident beam opening, the more light escaped from the hole, the total luminous flux remained in the integrating sphere decreased. Therefore, the opening radius at the position of laser incidence should be as small as possible. However, the small opening radius would lead to increasing the difficulty for adjusting the spot position on the sample plate. The simulation results showed that, when the opening radius was set to 10 mm, the laser incident position could be adjusted in a large range, and the light flux escaping from the opening is relatively small. Therefore, the radius of 10 mm was selected as the parameter of incident beam opening.
Thirdly, in order to investigate the influence of the incident beam diameter on the simulated results, the variation of the received luminous flux with the incident beam diameter was simulated. The results are shown in Figure 7c. The beam diameter was set to be 1–3 mm. The luminous flux was still 1 W. The radius of the integrating sphere was 50 mm, the opening diameter of the incident beam and the measuring opening was set to be 20% of the integrating sphere diameter, the diameter of the sample opening was 15% of the integrating sphere diameter and the measuring opening diameter of detector was set to be 12% of the integrating sphere diameter.
As can be seen from Figure 7c, the influence of the beam diameter on the luminous flux was found to rather small. The main reason for the small fluctuation on the simulated results was that the light source used in TracePro model was a grid point light source. When the beam diameter was changed, the grid point distribution of the light source would also change. Therefore, the position of each beam incident into the integrating sphere would change, which would have a certain fluctuation effect on the simulation results. In the actual processing of integrating sphere, considering that too large beam diameter would increase the difficulty for adjusting the incident beam position, and the too-small beam diameter would not cover the region to be measured on the coating surface, the diameter of 2 mm was selected as the parameter of the incident beam opening.
Finally, the influence of the scattering rate for the inner wall of the integrating sphere on the received luminous flux had been investigated. The simulated results are shown in Figure 7d, where the scattering rate of the inner wall on the integrating sphere ranged from 90% to 99%. Because it was assumed that the inner coating of the integrating sphere followed an ideal Lambert’s law scattering the simulated results would follow an exponential growth trend, with the increase of the inner coating reflectivity in integrating sphere. The results indicated that the enhancement of the coating scattering rate on the inner wall of the integrating sphere could effectively reduce the light energy loss, which had a significant impact on the accuracy improvement for the measurement results. Therefore, one should choose the integrating sphere with the largest scattering rate. In this paper, the inner surface of the integrating sphere had processed by gold-plating and sand-blasting technology. The highest internal reflectivity could be reached at 96%.

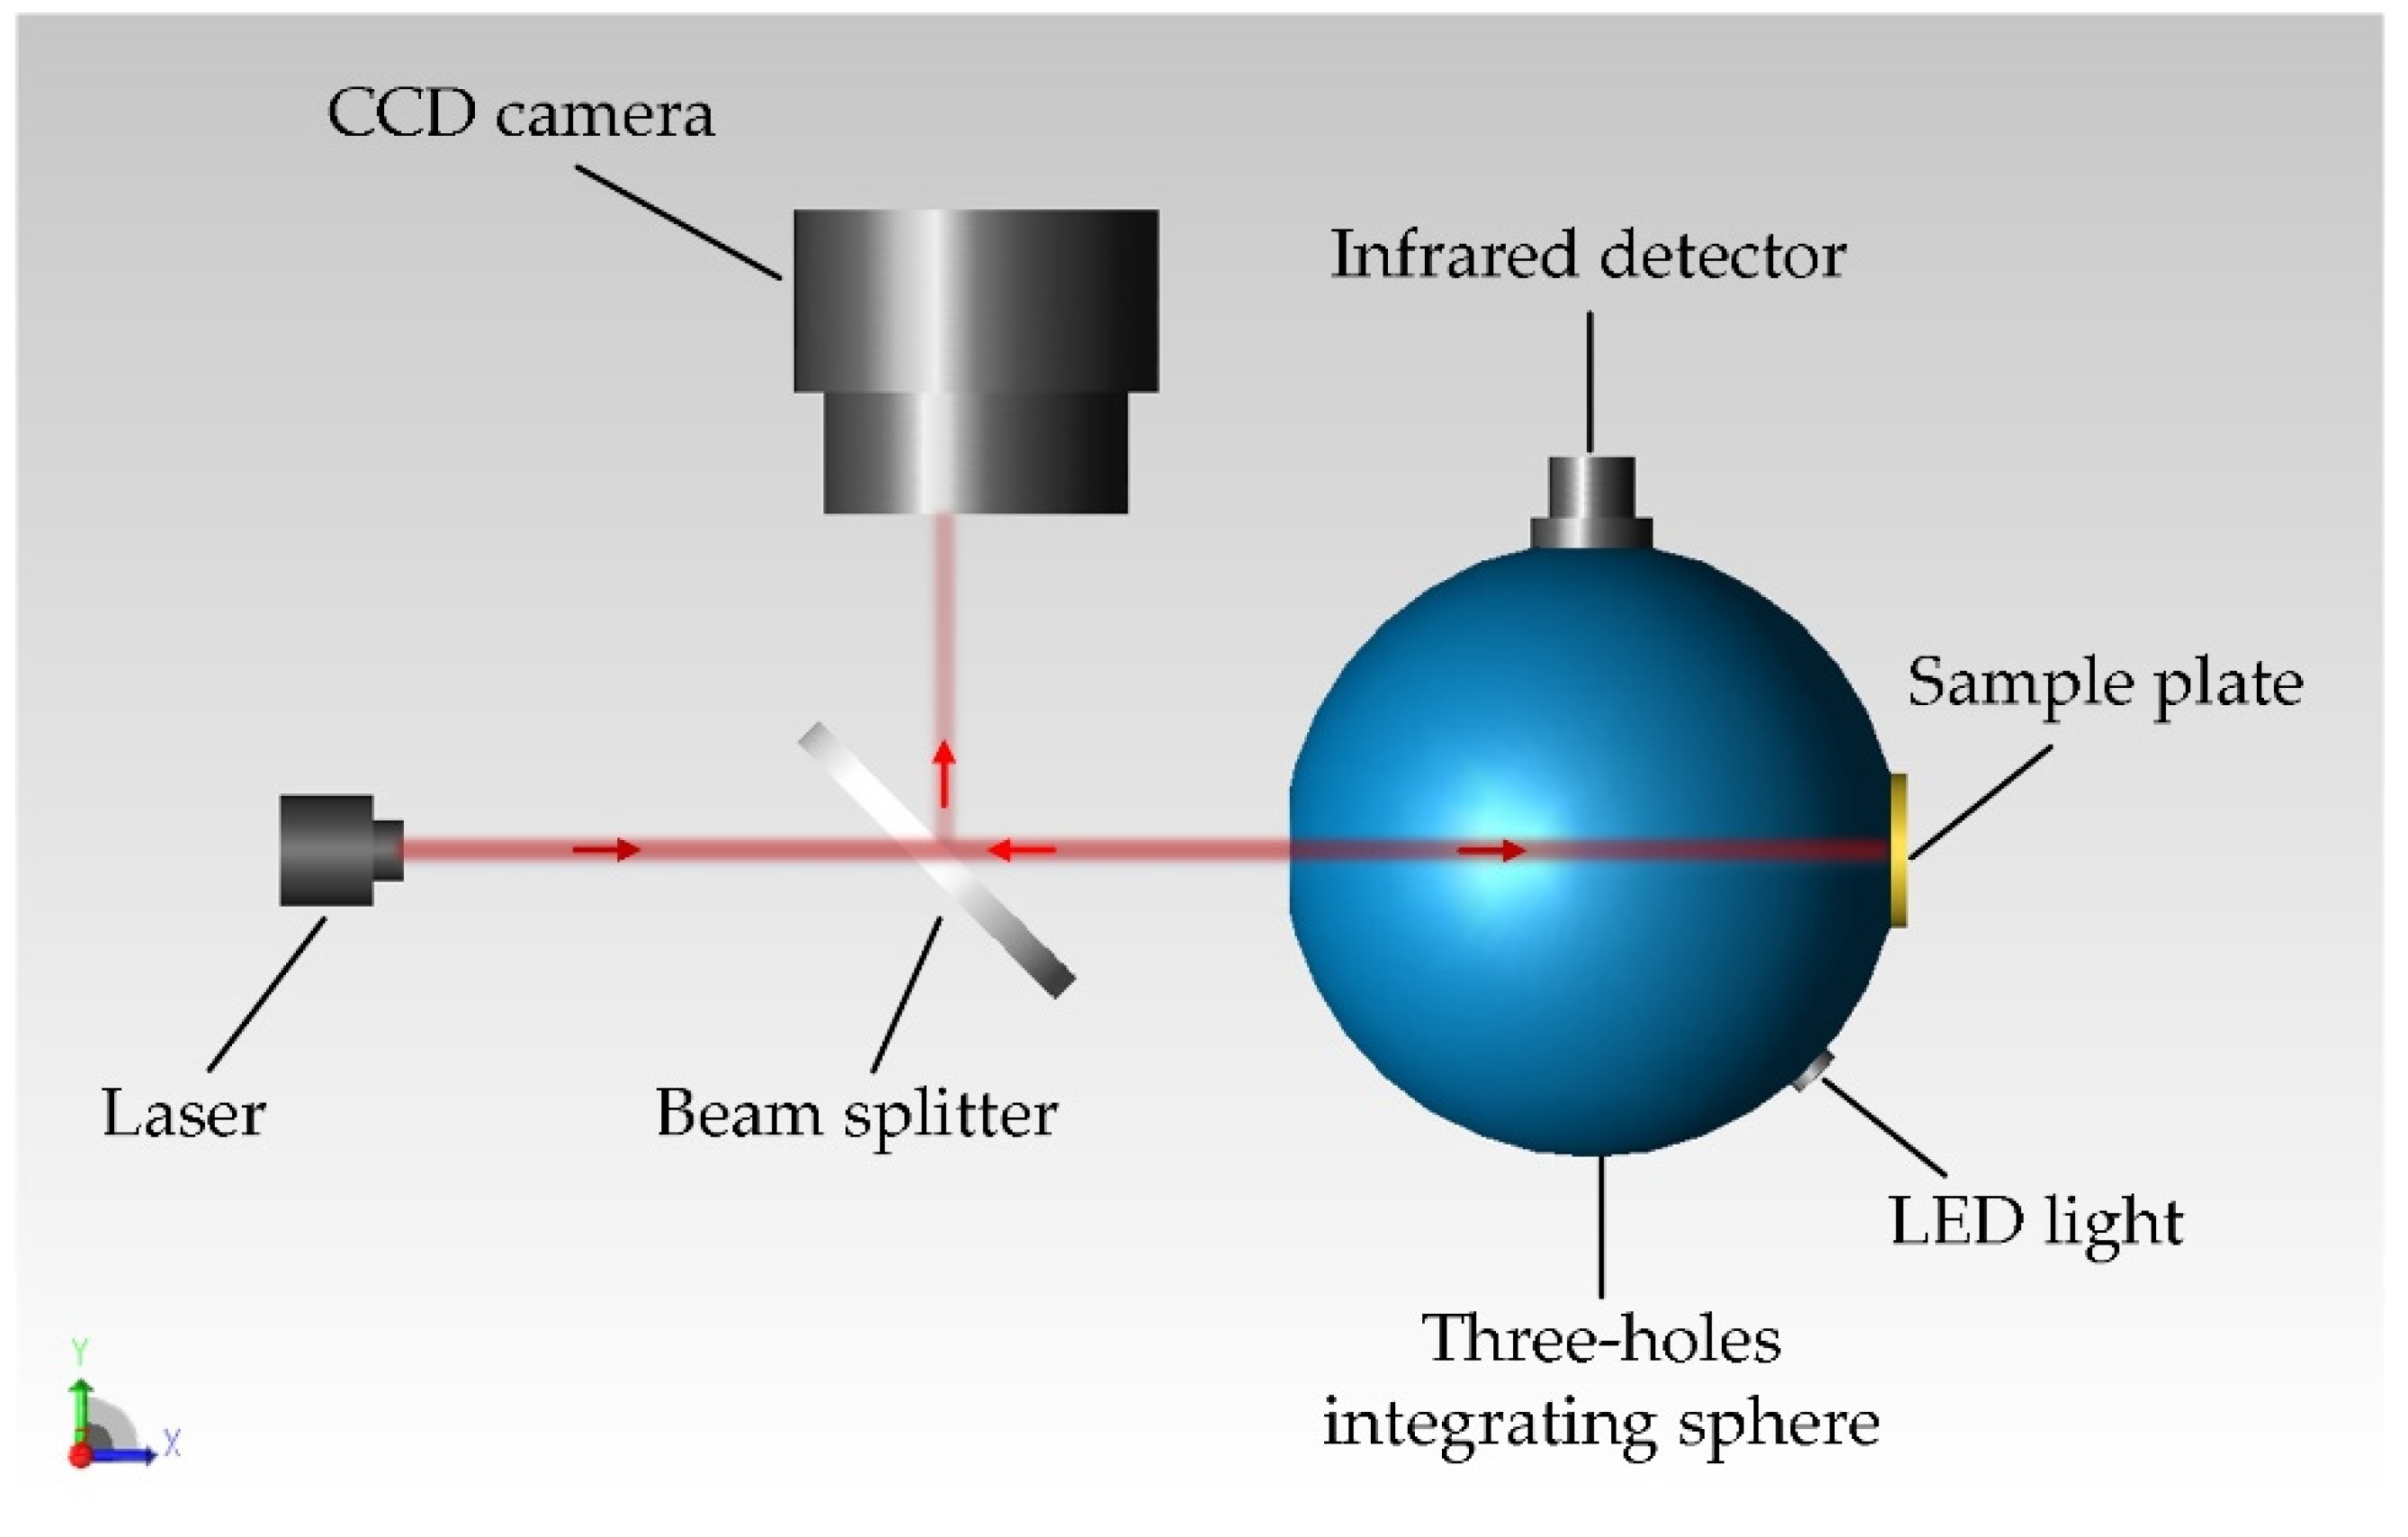
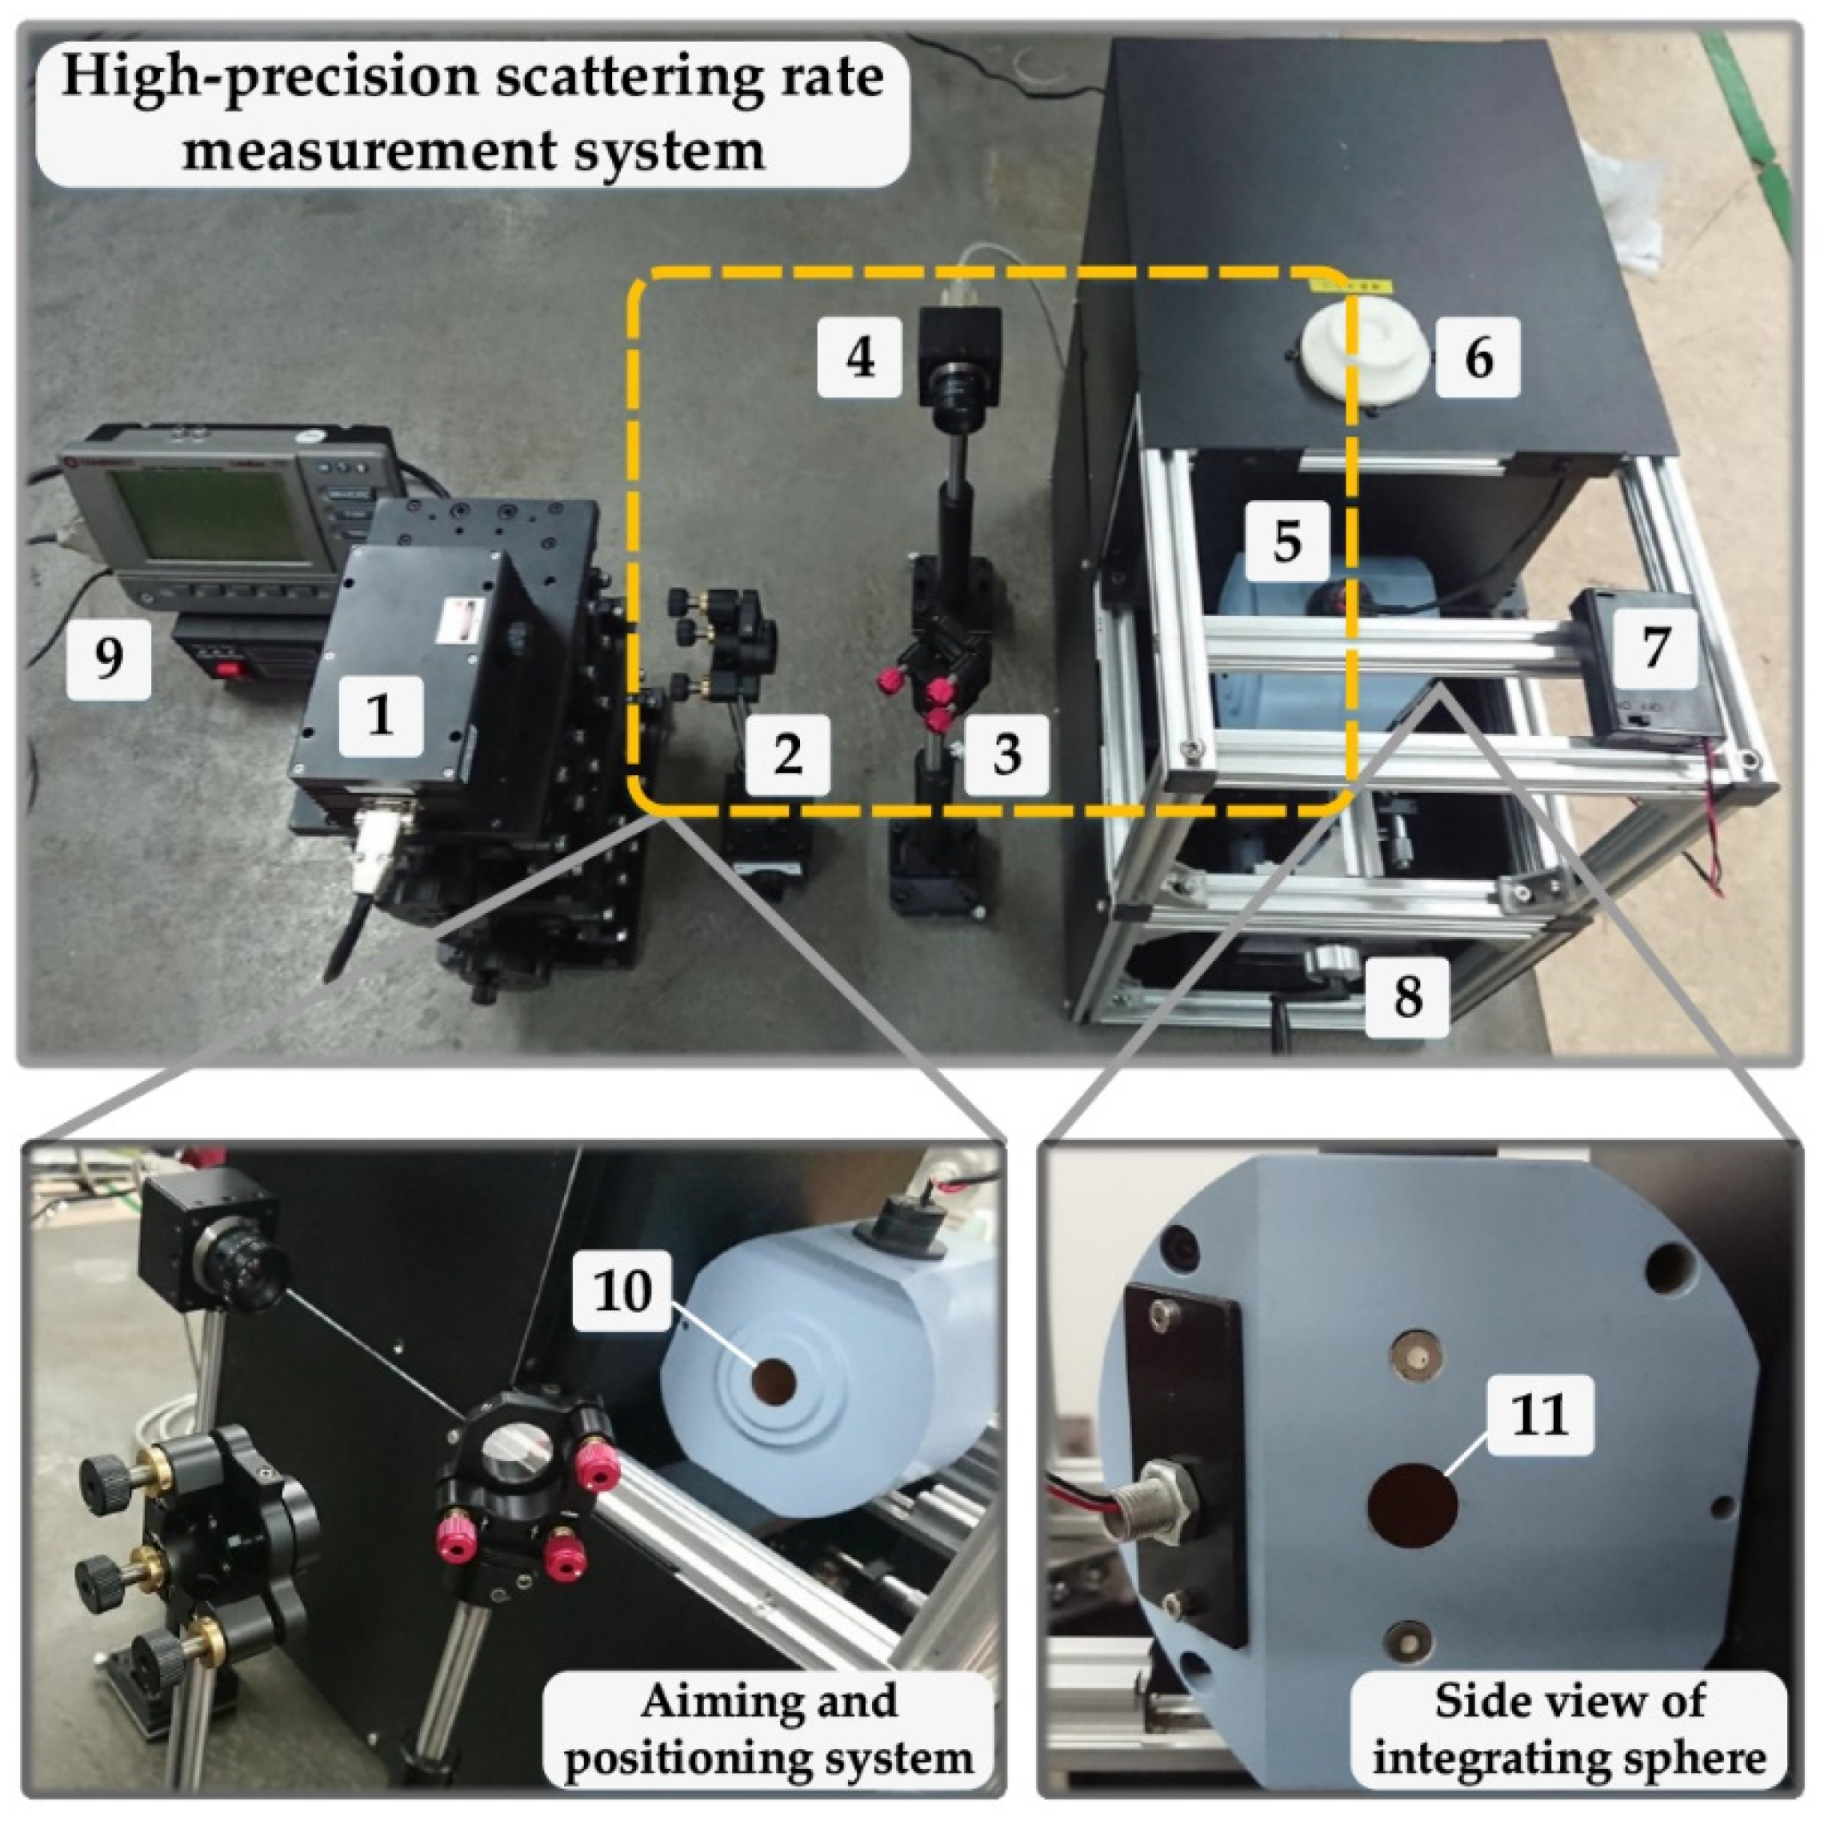
3.4. Modeling and Implementation for Surface Scattering Measurement System

According to the above design parameters, the surface scattering measurement system had been designed and modeled. The design diagram of the high-precision surface scattering measurement system is shown in Figure 8. The system is mainly composed of the aiming-and-positioning system and the measuring system. The main function of the aiming-and-positioning system is to facilitate the real-time observation for the region to be measured, so as to improve the flexibility and accuracy of the measuring system. The main function of the scattering-rate measuring system is to collect the scattered light efficiently, so as to achieve the high-precision scattering-rate measurement for any region on the coating surface.
Before using the high-precision integrating-sphere scattering-rate system for measurement, the aiming-and-positioning system should be firstly used to aim at the measuring region. When aiming, one can observe the spot position on the sample plate through the image collected by CCD camera, and then adjust the laser incident position according to the image to make the spot coincide with the region interested. Before the reflectivity measurements, the laser incident angle and the horizontal and vertical offset positons are adjusted by using the three-dimensional displacement adjustment platform and collimator to ensure that the incident laser beam vertically passes through the integrating sphere from the center of the incident beam opening to the center of the sample opening. Once the laser incidence angle is adjusted, the position of the laser spot relative to the sample opening remains unchanged, and then the relative position of the sample plate is adjusted by using the three-dimensional displacement platform to select the region to be measured. After the region to be measured has been selected, the laser at 1064 nm should be turned on to record the luminous flux received by the infrared detector. According to the calibration relationship between the simulated luminous flux and detector photocurrent, the scattering rate for the specific region on the sample surface to the corresponding laser wavelength can be calculated. The photograph of high-precision three-hole-integrating-sphere coating-scattering-rate measurement system is shown in Figure 9. The specific technical parameters of the system are shown in Table 1. The flowchart of high-precision scattering-rate measuring system is shown in Figure 10.
As can be seen in Figure 10, it is necessary to measure the background noise to reduce the measuring uncertainty of the system before employing the system for measurement. Then, the laser-aiming-and-positioning system was used to complete the laser aiming for the measured region. Finally, the reflectivity of the selected region could be measured. The specific steps can be summarized as follows. The first step is to install the spherical-missing plate and to record the background current I0 received by the infrared detector without turning on the laser. The second step is to remove the spherical-missing plate and to install the standard reference sample plate, which is made of gold-plating and sand-blasting process. In this paper, the surface reflectance of reference sample is consistent with the internal reflectance in the integrating sphere, both of which are 96%. Then, turn on the laser at 1064 nm and LED light; adjust the laser incident direction, using the aiming-and-positioning system; make it incident vertically from the beam inlet port to the center position of reference sample plate; and record the photocurrent value I1 received by the detector. The third step is to detach the standard reference sample plate and to replace it with the sample plate to be measured. Then, turn on the green laser at 532 nm and LED light, observe the spot position on the sample plate according to the image recorded by the CCD camera and adjust the position of the sample plate properly to make the spot coincide with the region to be measured on the coating surface. After completing the above operations, turn off the indicator laser at 532 nm and LED light, turn on the infrared laser at 1064 nm and record the photocurrent value I2 recorded by the infrared detector. At last, the surface reflectance s of the measured coating can be calculated as the following expression:
s = I 2 I 0 I 1 I 0 · ρ ref
where the ρref is the surface reflectance of gold-plating standard reference plate.

4. Relative Uncertainty Analysis for Scattering-Rate Measurement System

In order to quantitatively evaluate the actual measuring relative uncertainty of the system, we analyzed the influence of the relative uncertainty factors on the measuring accuracy in terms of following five main relative uncertainty sources: the laser power stability, the laser incident angle, the gap distance between the sample plate and the integrating sphere, the ambient light angle and the off-center position of the incident laser beam. The experimental results were compared with the corresponding simulation results. Then, considering the influence of all relative uncertainties on the total measuring results, the experimental measuring accuracy of the system were given.

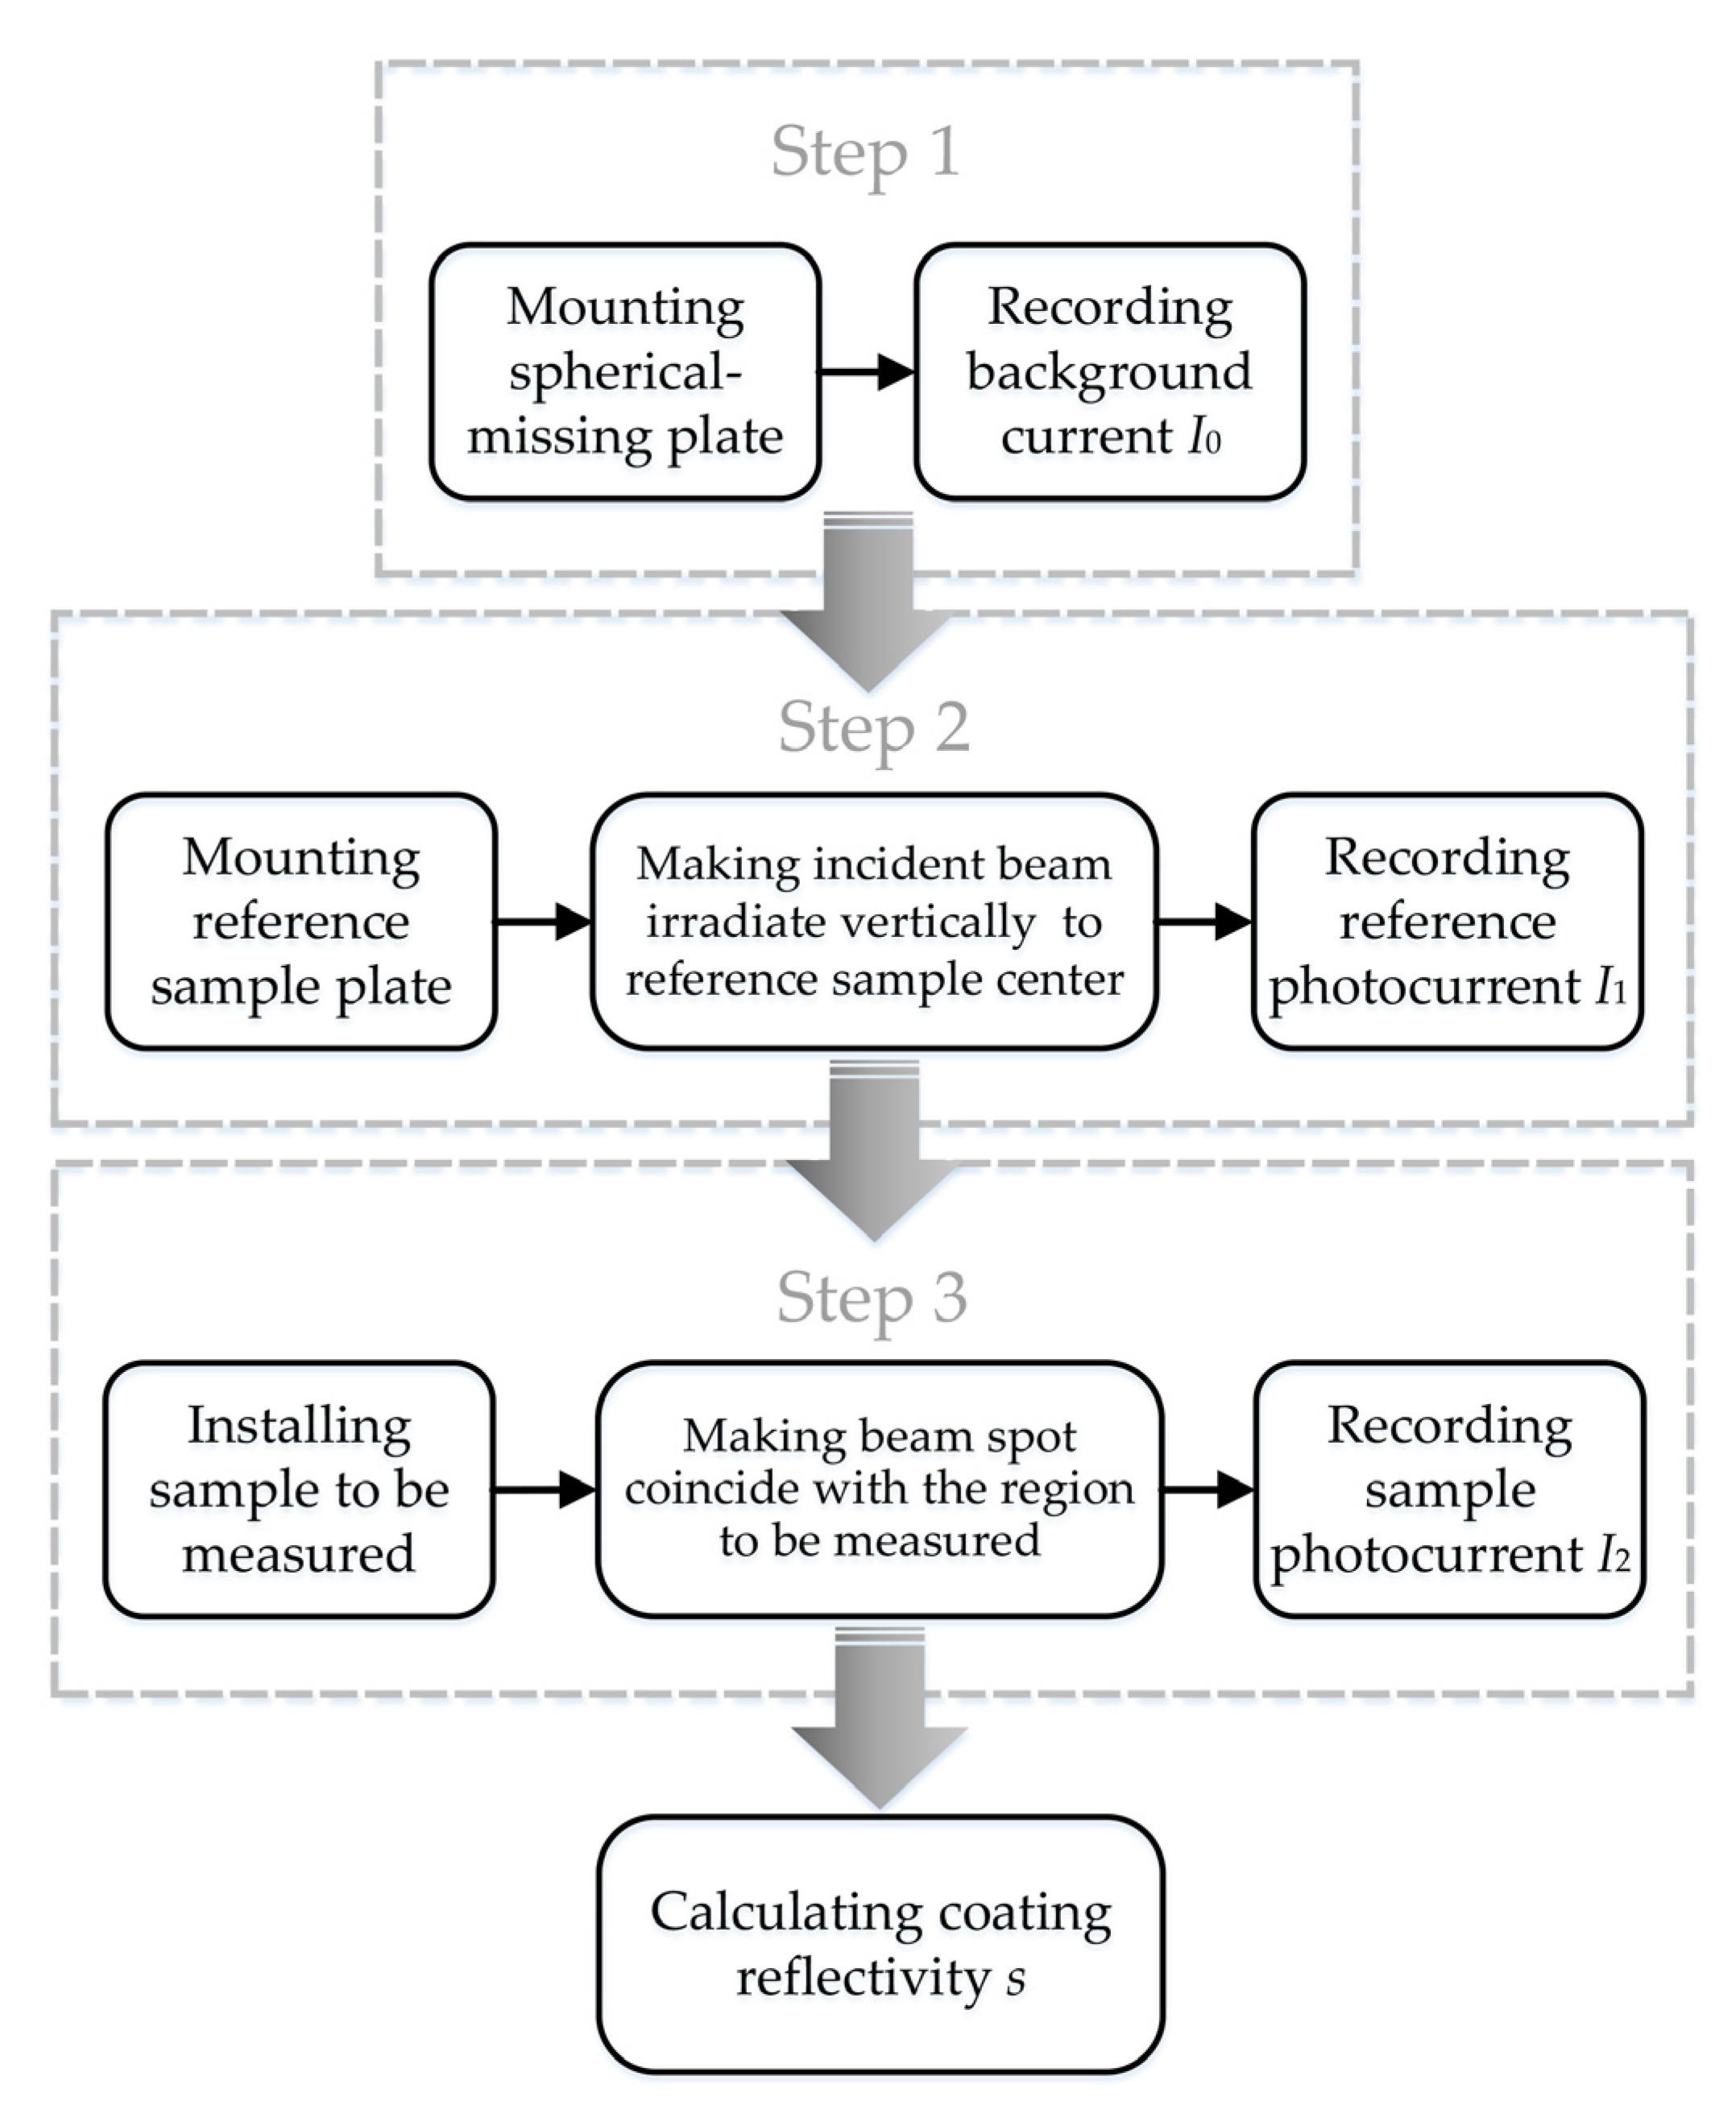
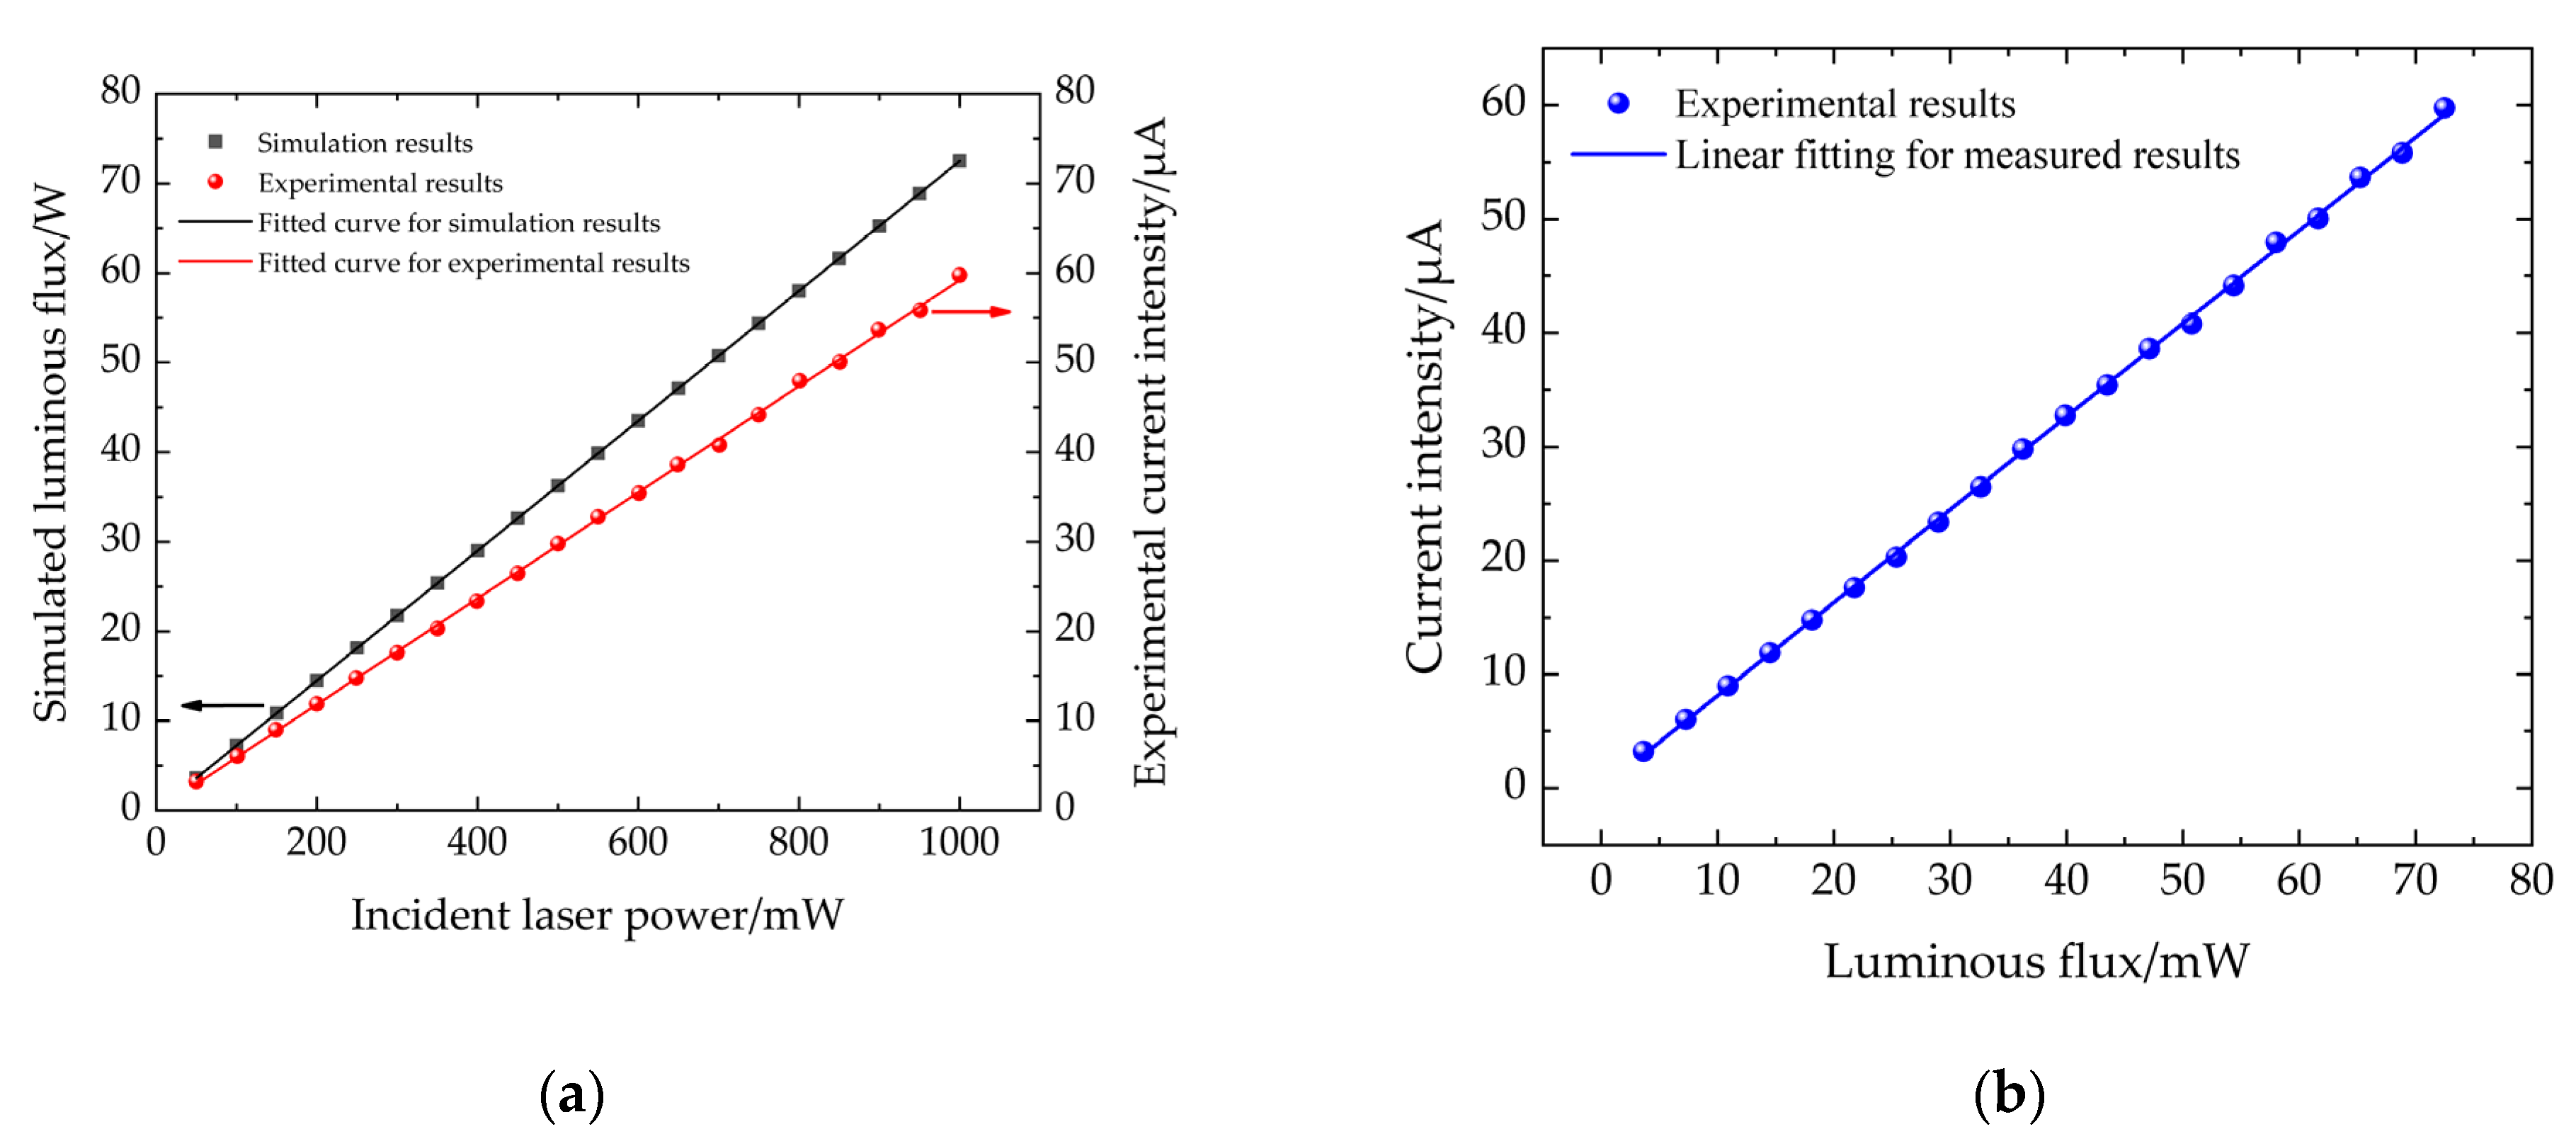
4.1. Calibration of Detector

In the measurement, the detector usually obtains the current intensity, while the physical quantity received by the detector is always expressed as the luminous flux in the simulation analysis. In order to obtain the surface reflectance of the coating, the calibration relationship between the output laser power and the detector photocurrent intensity should be established firstly according to Equation (13). In addition, the corresponding model was established in TracePro according to the technical parameters of the measurement system, in order to ensure the consistency and comparability between the simulation model and the actual measuring system. The specific simulated parameters were as follows: the opening radius of integrating sphere was 50 mm, the opening radius of incident beam was 10 mm, the radius of sample opening was 6.5 mm and the radius of measuring opening was set to 7.5 mm. The diameter of incident beam was 2 mm. The laser power increased from 0 to 1 W with an interval of 50 mW. The inner wall reflectivity of the integrating sphere was set to 96%. The scatting model employed the standard Lambert’s law scatting.
Figure 11 shows the calibration results between the output detector photocurrent intensity and the simulated luminous flux. The laser power in TracePro was consistent with the experimental laser power, and the adjustment range of both was 0–1 W. In the experiment, the output laser at 1064 nm was sampled once per second for 10 s, and then the average value of ten samples had been taken. After stabling the laser power, the photocurrent value measured by the infrared detector was recorded by consecutive reading five times and taking the mean value. It could be seen from Figure 11a that the simulated luminous flux received by the detector and the detector photocurrent intensity were linearly related to the incident laser power. Figure 11b presents the calibration relationship between the detector photocurrent intensity and the simulated luminous flux, which can be expressed by the following equation:
I o u t = 0.817 Φ d
where Iout is the responding detector photocurrent intensity to the luminous flux; Φd is the simulated luminous flux received by the detector. Equation (14) indicates that the simulated luminous flux of 1 mW corresponds to the detector photocurrent intensity of 0.817 μA.

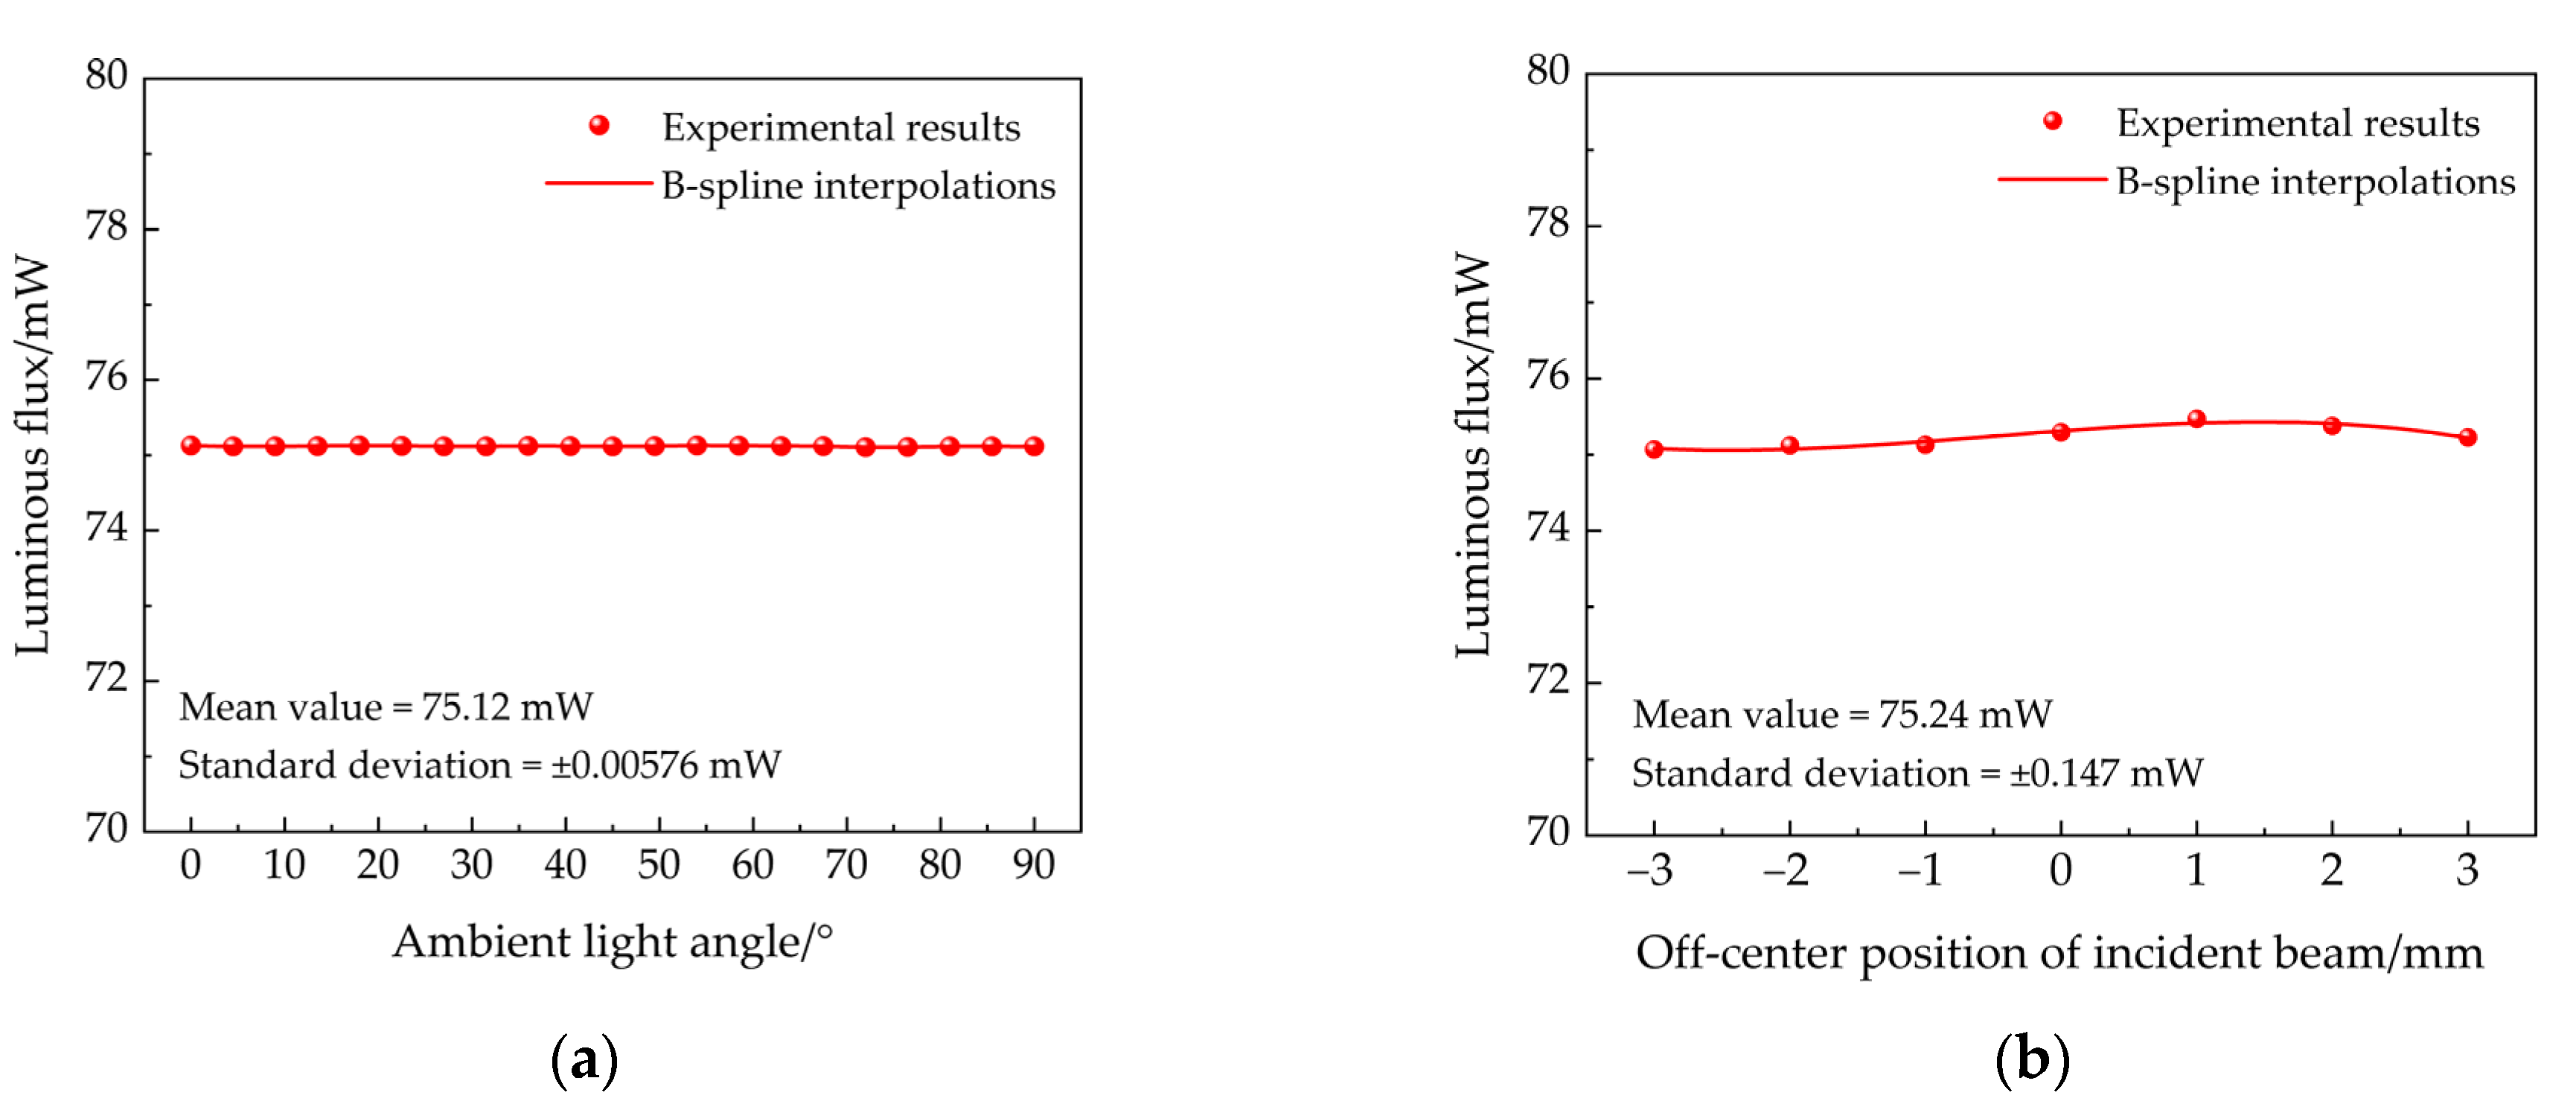
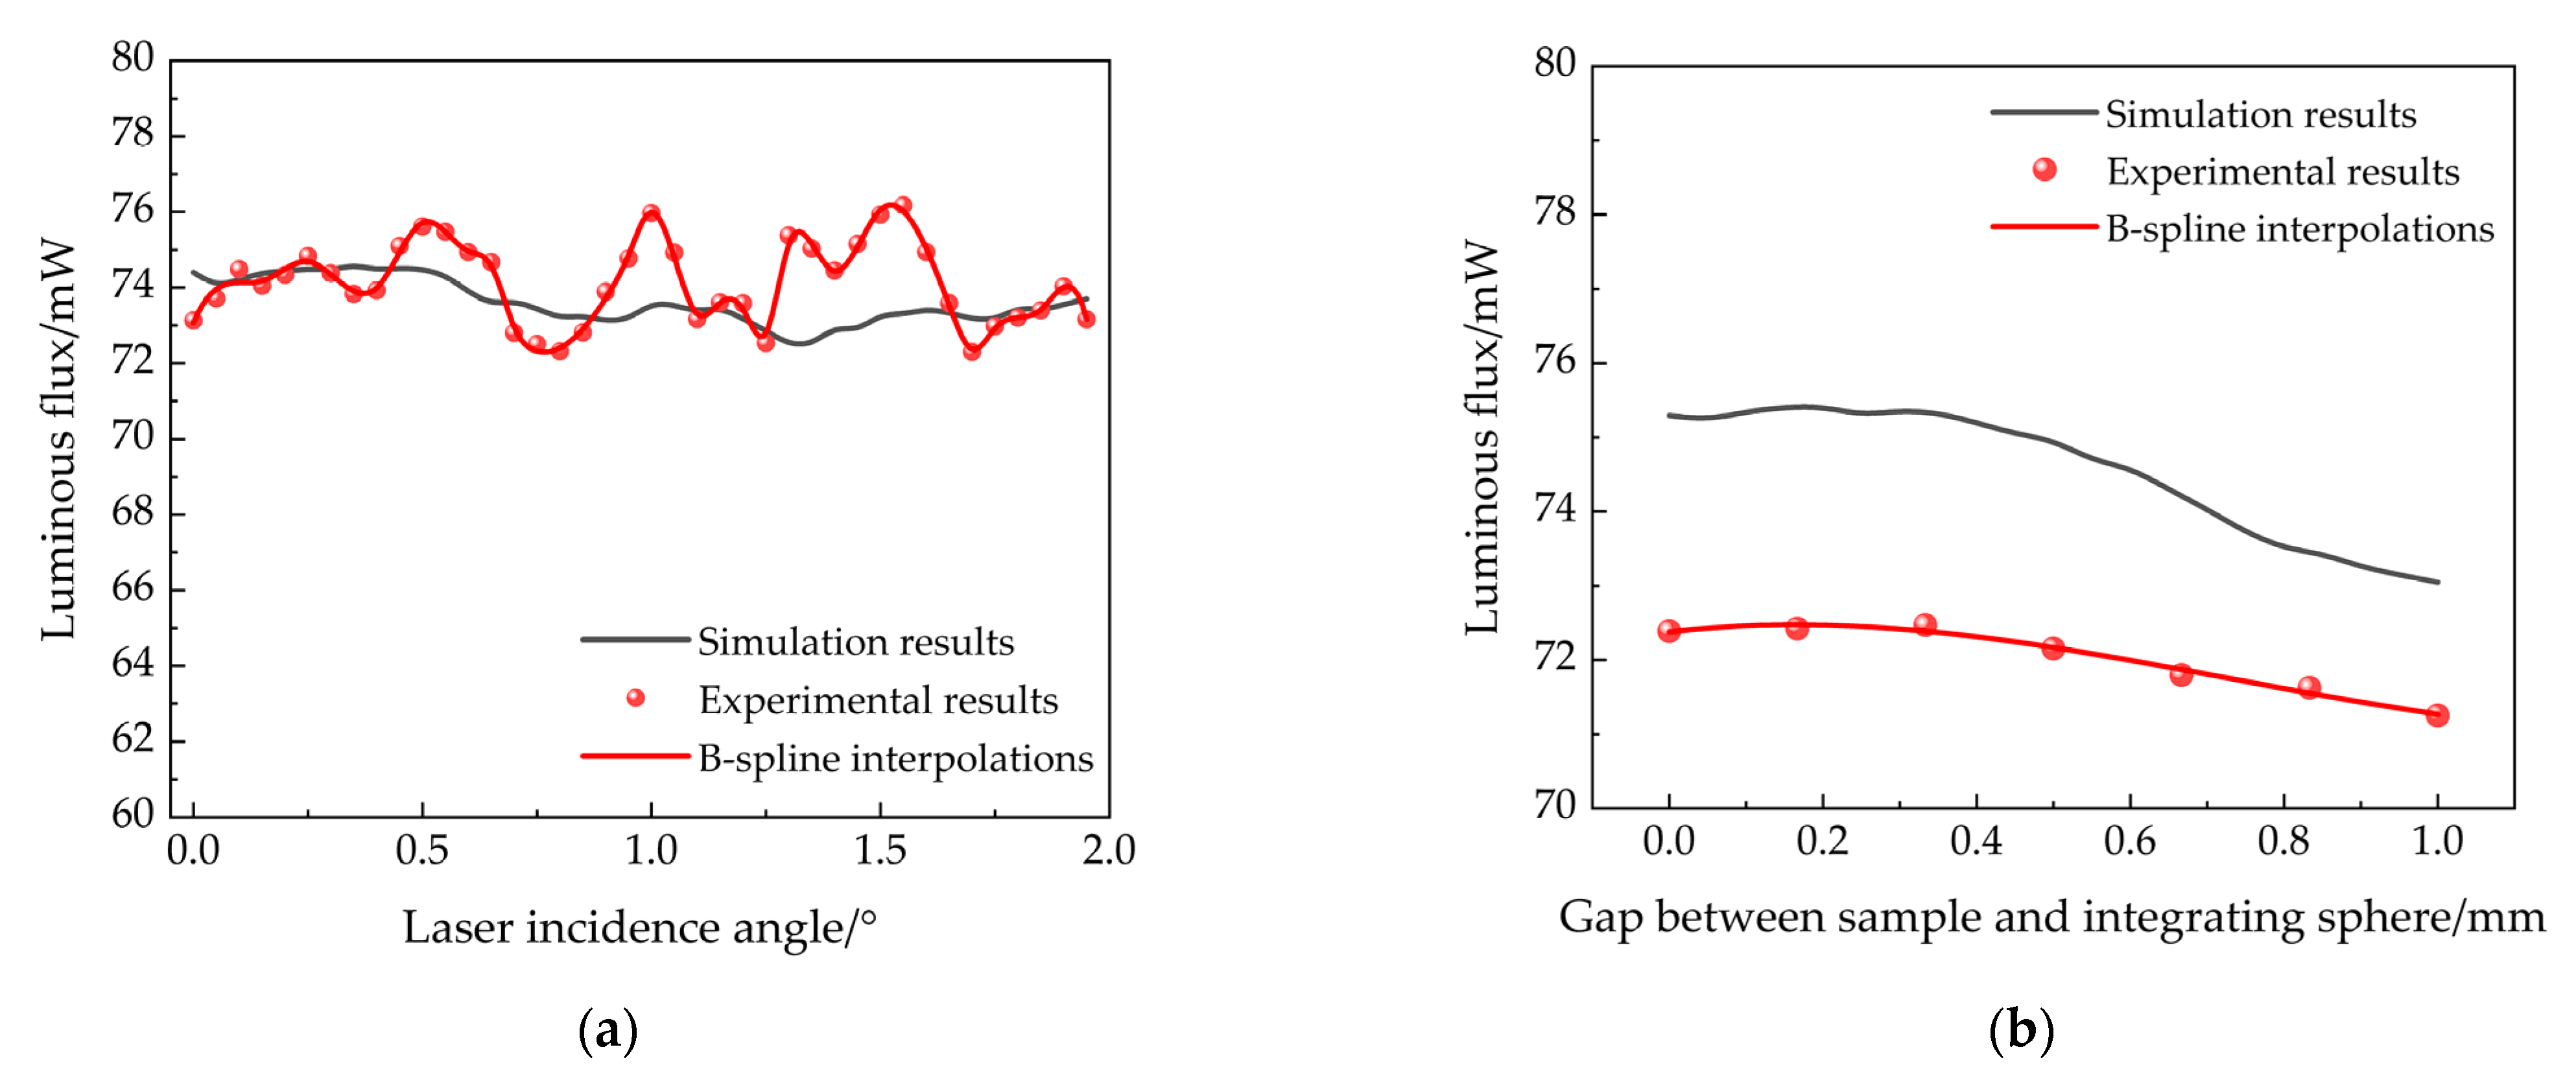
4.2. Relative Uncertainty Analysis

For the high-precision scattering-rate measurement system in this paper, the analysis shows that the following five factors could be the main relative uncertainty sources for measurement: the laser power stability, the laser incidence angle, the gap distance between the sample plate and the integrating sphere, the ambient light angle and the off-center position of the incident laser beam. The relative uncertainty is determined by the following expression:
u rel = u x ¯
where urel represents the relative uncertainty of measurement results; x ¯ is the arithmetic mean of statistics; and u represents the uncertainty of measurement results, which can be expressed by the following equation.
u = max { | x i x ¯ | , i = 1 , 2 , , n }
where n is the number of measured data.
Since the response band of the detector used in this paper lies in the infrared band, the angle and intensity of the ambient light have little effect on the detector under the condition of laboratory environment. The experimental result also show that the relative uncertainty of infrared detection caused by different incident angles of ambient light is less than ±0.018%, as shown in Figure 12a. Therefore, this relative uncertainty can be ignored in the laboratory environment. Due to the use of aiming-and-positioning system, the off-center position of the incident laser beam in the experiments is estimated to be less than 3 mm. As can be seen from Figure 12b, the fluctuation of experimental luminous flux received by the detector is rather small in the range of off-center position −3 mm to 3 mm, with an average value of 75.24 mW and a measured uncertainty of ±0.229 mW. Therefore, the maximum measurement uncertainty due to the off-center position of the incident laser beam is ±0.30%.
The maximum output power of the laser used in this experiment is 1000 mW with the measured uncertainty of 1.9 mW. Therefore, the relative stability of the laser power is ±0.19%. The laser incidence angle is different due to the working distance, that is, the longer the working distance, the smaller the allowable laser incidence angle. Therefore, a long working distance is conducive to improve the reflectivity measurement accuracy. Restricted by the opening size of the integrating sphere, the influences of the laser incidence angle in the range of 0–1.95° on the received luminous fluxes of the detector are simulated and experimentally measured. The gap distance between the sample plate and the integrating sphere is found to be in the range of 0–1 mm. The influences of laser incidence angle and gap distance on the received luminous flux has been simulated and measured respectively, and they are shown in Figure 13.
It can be seen from Figure 13a that the simulated luminous flux basically showed a slight downward trend with the increase of laser incidence angle. However, the experimental results showed a limited fluctuation in a certain range with the increase of laser incidence angle. The reason was that the change of laser incidence angle would affect the spatial distribution of scattered light energy in the integrating sphere at a certain extent. Because the surface of the standard sample could be considered as a Lambert diffuse reflection surface, the scattering brought a weak randomness. Figure 13b indicated that the luminous flux received by the detector decreased slowly with the increase of the sample gap distance. This phenomenon could be easily understood: the expanding gap distance between the sample and the integrating sphere would lead to the increasing amount of beam leakage at the sample region. Therefore, the luminous flux received by the detector also decreased. In addition, it could be seen from Figure 13b that there was an obvious overall offset between the experimental results and the simulation results. There were two main reasons for this phenomenon: On the one hand, it was assumed that the sample plate and the sample opening were parallel to each other in the experiments. However, in reality the absolute parallelism between the sample plate and the sample opening could not be achieved, resulting in the obvious offset for the measured results. On the other hand, due to the imperfection of the model itself used in this paper, it was different from the real situation, which could not perfectly reflect the real measurement situation.
In order to increase the measurement accuracy and reduce the measurement uncertainty, the working distance in the experiment is set to 500 mm. Since the actual sample opening size of the integrating sphere is 12 mm, the maximum allowable laser incidence angle is 0.57°. According to the curves in Figure 13a,b, the relative uncertainties of the received luminous fluxes obtained by simulation and experiment could be calculated under different laser incident angles and sample gap distances. The results showed that when the laser incidence angle changed from 0° to 0.57°, the relative uncertainties of the received luminous fluxes obtained by simulation and experiment were ±0.65% and ±1.77%, respectively. When the gap distance changed from the range 0 to 1 mm, the relative uncertainties of the luminous fluxes obtained by simulation and experiment were ±2.02% and ±1.06%, respectively. The above analysis results indicated that the main factors affecting the measuring relative uncertainty were the laser incidence angle and the sample gap distance. Therefore, in order to effectively reduce the experimental relative uncertainty, it is necessary to ensure that the laser beam vertically enters the integrating sphere, and keep the sample and integrating sphere close together.
Since the same measurement system is used, it can be assumed that the measurement relative uncertainty of the detector output photocurrent for the reference sample is equal to that of the measured sample. Then, according to Equation (13), and combined with the error propagation theory [34], the quantitative relationship between the reflectivity relative uncertainty us of the coating to be measured and the measured photocurrent relative uncertainty uI of the detector can be deduced as follows:
u s = ± 2 ρ r e f u I
Because there is a relationship between the measured photocurrent and the received luminous flux, as shown in Equation (14), Equation (17) can be converted into the following:
u s = ± 1.06 u Φ
where uΦ is the relative uncertainty of the luminous flux received by detector.
It can be seen from Equation (18) that there is a positive proportional relationship between the measuring relative uncertainty of the scattering rate and the measuring relative uncertainty of the luminous flux received by detector.
Due to the influences of the laser power fluctuation, the laser incident angle, the sample gap distance and the ambient light, the ambient light angle and the off-center position of the incident laser beam are independent of each other, and according to the error propagation theory, the total measuring relative uncertainty of the scattering rate on the coating surface should meet the following equation:
u total = ± u l 2 + u i 2 + u g 2 + u a 2 + u o 2
where utotal is the total measurement relative uncertainty of the coating to be tested; ul is the relative uncertainty caused by the instability of laser power; ui is the measuring relative uncertainty of the surface scattering rate due to the deviation of the incident laser angle; ug is the measuring relative uncertainty caused by the gap distance between the sample and the integrating sphere due to the surface roughness and the installation deviation of the sample; ua represents the relative uncertainty due to the influence of ambient light; uo represents the relative uncertainty due to the off-center position of the incident laser beam
By substituting the simulated and experimental relative uncertainties from the above mentioned five factors into Equation (19), the total relative measurement relative uncertainties for simulation and experiment were found to be ±2.28% and ±2.22%, respectively. Compared with the 3–5% measuring relative uncertainty for the scattering rate reported in the current works of the literature, the experimental measurement accuracy of the high-precision scattering-rate measurement system based on the three-hole integrating sphere with wide infrared band range proposed in this paper was found to be improved by 26–56%, which had achieved the high-precision measurement for the specific region on the coating surface.

5. Conclusions

Aiming at addressing the problems of low measuring accuracy, discontinuous measuring region and narrow infrared response waveband for surface-scattering-rate measurement in laser-protective-materials diagnostics, a high-precision material-surface-scattering-rate measurement system based on three-hole integrating sphere was proposed in this paper that could achieve high-precision quantitative measurement in any region on a coating surface, with a wide response waveband from near-infrared to far-infrared band. Firstly, in terms of theoretical research, the current integrating-sphere scattering model was improved, and the quantitative expression between the luminous flux received by the detector and the scattering rate on the coating surface was obtained, which was closer to the actual situation. Based on theoretical result, the simulation of the new integrating-sphere measuring system and the analysis of relative uncertainty sources were carried out. A high-precision scattering-characteristic measurement system based on a three-hole integrating sphere was designed and established. The influence of the main design parameters on the expected measuring accuracy of the system was studied by TracePro simulation, and the optimal design parameters of the system were obtained. Combined with the experimental results, the main measuring relative uncertainty sources for the scattering rate of the system were investigated. The measurement accuracy evaluation for the five main relative uncertainty factors, namely laser-power stability, laser incident angle, sample gap distance, ambient-light interference and off-center position of incident beam, was also carried out. The results showed that the laser incident angle had the greatest influence on the relative measurement uncertainty in the system, followed by the sample gap distance. The stability of the laser power depended on the selected laser performance, while the influence of the ambient light angle and the off-center position of incident beam could be ignored in the laboratory environment. Finally, according to the error propagation theory, the total experimental relative measurement uncertainty of the system was found to be ±2.22%, which was 26–56% higher than the existing measurement accuracy. The new scattering-rate measuring system proposed in this paper provides an effective experimental method for high-precision quantitative measurement and performance evaluation in the field of laser-protective-materials diagnostics.

Author Contributions

Conceptualization, Z.Y. and J.Z.; methodology, Z.Y. and Y.Y.; software, Y.Y. and Z.Y.; validation, Y.Z. and Y.Y.; formal analysis, Z.Y. and Y.Y.; investigation, Z.Y., Y.Y., J.Z. and X.G.; data curation, Y.Y. and Z.Y.; writing—original draft preparation, Z.Y. and Y.Y.; writing—review and editing, J.Z., Z.Y. and Y.Y.; supervision, Y.Z. and K.L.; project administration, J.Z. and Z.Y. All authors have read and agreed to the published version of the manuscript.

Funding

This research was funded by the National Natural Science Foundation of China (No. 61905053) and a Postdoctoral Fellowship in Heilongjiang Province (No. LBH-Z17092).

Acknowledgments

The author would like to thank J.Z., Y.Y., Y.Z., X.G. and K.L. for providing many valuable insights and substantial help.

Conflicts of Interest

The authors declare no conflict of interest.

References

  1. Ludewigt, K.; Liem, A.; Stuhr, U.; Jung, M. High-power laser development for laser weapons. Proc. SPIE 2019, 11162, 1116207. [Google Scholar]
  2. Qu, Z.; Li, Q.S. The key technology on high power fiber optic laser in laser weapon. Proc. SPIE 2018, 10844, 108440T. [Google Scholar]
  3. Chen, Z.X.; Shi, S.B.; Han, F.L.; Wu, Y.L.; Song, C.Y. Research of laser stealth performance test technology. Proc. SPIE 2014, 9282, 92820T. [Google Scholar]
  4. Wang, C.; Wang, L.; Chen, Z.H.; Zhang, F.X.; Li, J.W.; Shi, J.M.; Zhao, D.P.; Huang, M.S.; Guo, F.C.; Shao, D.X. Production of flexible photonic crystal films for compatible far infrared and laser-band camouflage by vacuum coating method. J. Russ. Laser Res. 2016, 37, 308–312. [Google Scholar]
  5. Liu, Z.W.; Zhang, B.; Chen, Y. Two-dimensional nanomaterials and their derivatives for laser protection. Acta Phys. Sin. 2020, 69, 184201. [Google Scholar]
  6. Yan, Z.Y.; Ma, Z.; Liu, L.; Zhu, S.Z.; Gao, L.H. The ablation behavior of ZrB2/Cu composite irradiated by high-intensity continuous laser. J. Eur. Ceram. Soc. 2014, 34, 2203–2209. [Google Scholar] [CrossRef]
  7. Peng, G.L.; Zhang, X.H.; Wang, Y.H.; Yan, H.; Gao, Y.J.; Zheng, Y.L. Effect of laser parameters on C/SiC composites material ablation heat. Chin. J. Lasers 2013, 40, 1103010. [Google Scholar] [CrossRef]
  8. Li, J.; Zheng, Y.; Luo, J.; Chen, S.L.; Guan, Z.W.; Liang, L. Laser ablation effect of composite coating applied to aerospace material. High Power Laser Part. Beams 2014, 26, 029003. [Google Scholar]
  9. Zhu, J.P.; Ma, Z.; Gao, L.H.; Liu, Y.B.; Wang, F.C.; Liu, L.; Zhu, S.Z. Reflective laser protective coating based on plasma spraying. Chin. Opt. 2017, 10, 578–587. [Google Scholar]
  10. Zhu, J.P.; Ma, Z.; Gao, Y.J.; Gao, L.H.; Pervak, V.; Wang, L.J.; We, C.H.; Wang, F.C. Ablation behavior of plasma-sprayed La1-xSrxTiO3+δ coating irradiated by high-intensity continuous laser. ACS Appl. Mater. Interfaces 2017, 9, 35444–35452. [Google Scholar] [CrossRef]
  11. Zhu, J.P.; Gao, L.H.; Ma, Z.; Liu, Y.B.; Wang, F.C. Optical property of La1-xSrxTiO3+δ coatings deposited by plasma spraying technique. Appl. Surf. Sci. 2015, 356, 935–940. [Google Scholar] [CrossRef]
  12. He, M.B.; Ma, Z.L.; Wei, C.H.; Liu, W.P.; Wu, T.T. Influence of pyrolysis on the laser ablation of carbon-fiber/epoxy composite. Infrared Laser Eng. 2016, 45, 0306001. [Google Scholar]
  13. Li, W.Z.; Gao, L.H.; Ma, Z.; Wang, F.C. Ablation behavior of graphite/SiO2 composite irradiated by high-intensity continuous laser. J. Eur. Ceram. Soc. 2017, 37, 1331–1338. [Google Scholar] [CrossRef]
  14. Fu, C.L.; Yang, Y.; Huang, Z.R.; Liu, G.L.; Zhang, H.; Jiang, F.; Wei, Y.Q.; Jiao, Z. Investigation on the laser ablation of SiC ceramics using micro-Raman mapping technique. J. Adv. Ceram. 2016, 5, 253–261. [Google Scholar] [CrossRef] [Green Version]
  15. Li, W.Z.; Gao, L.H.; Ma, Z.; Wang, F.C.; Wu, T.T.; Wang, L.J.; Li, H.Z. Multi-synergy ablative effects of laminated SiO2-graphite/SiO2/Cu composite irradiated by high power laser. Ceram. Int. 2019, 45, 15272–15280. [Google Scholar] [CrossRef]
  16. Wang, Y.Q.; Yao, G.; Huang, Z.J.; Huang, Y. Infrared laser protection of multi-wavelength with high optical switching efficiency VO2 film. Acta Phys. Sin. 2016, 65, 057102. [Google Scholar]
  17. Lu, Y.; Feng, Y.S.; Ling, Y.S.; Qiao, Y. The mechanism of laser disturbing infrared detector and its intelligent protection. Proc. SPIE 2013, 8904, 89040T. [Google Scholar]
  18. Kawate, E.; Hanssen, L.M.; Kaplan, S.G.; Datla, R.V. Development of an adiabatic laser calorimeter. Proc. SPIE 2000, 4103, 133–144. [Google Scholar]
  19. Kawate, E.; Hanssen, L.M.; Kaplan, S.G.; Datla, R.V. Design and operation of a highly sensitive and accurate laser calorimeter for low absorption materials. Proc. SPIE 1998, 3425, 134–145. [Google Scholar]
  20. Visan, T.; Sporea, D.; Dumitru, G. Computing method for evaluating the absorption coefficient of infrared optical elements. Infrared Phys. Technol. 1998, 39, 335–346. [Google Scholar] [CrossRef]
  21. Liu, H.; Chen, S.L.; Wei, Y.W.; Zhang, Z.; Luo, J.; Zheng, N.; Ma, P. Laser conditioning on HfO2 film monitored by calorimeter. Opt. Express 2012, 20, 698–705. [Google Scholar]
  22. Wei, J.F. In-depth analysis and discussions of water absorption-typed high-power laser calorimeter. Proc. SPIE 2017, 10250, 102501R. [Google Scholar]
  23. Johnson, T.J.; Bernacki, B.E.; Redding, R.L.; Su, Y.F.; Brauer, C.S.; Myers, T.L.; Stephan, E.G. Intensity-value corrections for integrating sphere measurements of solid samples measured behind glass. Appl. Spectrosc. 2014, 68, 1224–1234. [Google Scholar] [CrossRef] [PubMed]
  24. Sandilands, L.J.; Cote, E.; Zwinkels, J.C. Design and characterization of a new absolute diffuse reflectance reference instrument at the NRC. Proc. SPIE 2018, 10750, 107500G. [Google Scholar]
  25. Da Cruz, L.B.; Bachmann, L. Manufacture and characterization of a 3D-printed integrating sphere. Instrum. Sci. Technol. 2020, 49, 276–287. [Google Scholar] [CrossRef]
  26. Gao, Q.; Yu, J.; Zhang, Y.G.; Zhang, Z.G.; Cao, W.W. Diffuse reflectance measurement using gas absorption spectroscopy. Sens. Actuator B Chem. 2014, 196, 147–150. [Google Scholar] [CrossRef]
  27. Feng, G.J.; Wang, Y.; Ma, Y.; Li, P.; Zheng, C.D. A non-standard auxiliary integrating sphere and correction method for the realization of diffuse reflectance. Optik 2013, 124, 4325–4327. [Google Scholar] [CrossRef]
  28. Hwang, J.; Shin, D.J.; Jeong, K.R. Integrating sphere-based relative methods for reflection measurements. Metrologia 2016, 53, 1231–1242. [Google Scholar] [CrossRef]
  29. Saylan, S.; Howells, C.T.; Dahlem, M.S. Integrating sphere based reflectance measurements for small-area semiconductor samples. Rev. Sci. Instrum. 2018, 89, 053101. [Google Scholar] [CrossRef]
  30. Blake, T.A.; Johnson, T.J.; Tonkyn, R.G.; Forland, B.M.; Myers, T.L.; Brauer, C.S.; Su, Y.F.; Bernacki, B.E.; Hanssen, L.; Gonzalez, G. Methods for quantitative infrared directional-hemispherical and diffuse reflectance measurements using an FTIR and a commercial integrating sphere. Appl. Optics 2018, 57, 432–446. [Google Scholar] [CrossRef]
  31. Foschum, F.; Bergmann, F.; Kienle, A. Precise determination of the optical properties of turbid media using an optimized integrating sphere and advanced Monte Carlo simulations. Part 1: Theory. Appl. Optics 2020, 59, 3203–3215. [Google Scholar] [CrossRef] [PubMed]
  32. Bergniann, F.; Foschum, F.; Zuber, R.; Kienle, A. Precise determination of the optical properties of turbid media using an optimized integrating sphere and advanced Monte Carlo simulations. Part 2: Experiments. Appl. Optics 2020, 59, 3216–3226. [Google Scholar] [CrossRef] [PubMed]
  33. Lambda. Available online: https://lambdares.com/tracepro/ (accessed on 6 June 2021).
  34. Survey Adjustment Discipline Group, School of Geodesy and Geomatics, Wuhan University. Error Theory and Foundation of Surveying Adjustment, 1st ed.; Wuhan University Press: Wuhan, China, 2003; pp. 30–32. [Google Scholar]
Figure 1. Schematic diagram of illumination composition inside integrating sphere.
Applsci 11 09457 g001
Figure 2. Reflection model of laser in three-hole integrating sphere.
Applsci 11 09457 g002
Figure 3. Schematic diagram of the aiming-and-positioning system and the TracePro simulation result: (a) composition of aiming-and-positioning system, and (b) TracePro simulation result.
Applsci 11 09457 g003
Figure 4. Simulation results of aiming-and-positioning system with and without light-emitting diode (LED) ambient light: (a) without LED and (b) with LED.
Applsci 11 09457 g004
Figure 5. Geometric model of three-hole integrating sphere: (a) with spherical-missing plate and (b) with sample plate.
Applsci 11 09457 g005
Figure 6. Influence of trace ray number on simulation results.
Applsci 11 09457 g006
Figure 7. Influence of design parameters on the received luminous flux of the detector: (a) radius of the integrating sphere, (b) incident opening radius, (c) diameter of the incident beam and (d) reflectivity of the inner wall for the integrating sphere.
Applsci 11 09457 g007
Figure 8. Diagram of high-precision surface-scattering measurement system model.
Applsci 11 09457 g008
Figure 9. Photograph of high-precision three-hole-integrating-sphere coating-scattering-rate measurement system. (1) laser, (2) optical filter, (3) beam splitter, (4) CCD camera, (5) three-hole integrating sphere, (6) liquid-nitrogen injection port, (7) LED light switch, (8) system frame and three-dimensional adjustment platform of sample, (9) laser power meter, (10) incident beam opening and (11) measuring opening.
Applsci 11 09457 g009
Figure 10. Flowchart of scattering-rate measurement.
Applsci 11 09457 g010
Figure 11. Detector calibration results: (a) variations of simulated luminous flux and experimental current intensity with incident laser power; (b) calibration relationship between the experimental current intensity and the simulated luminous flux.
Applsci 11 09457 g011
Figure 12. Influence of ambient light angle and off-center position of incident beam on experimental luminous fluxes: (a) ambient light angle and (b) off-center position of incident beam.
Applsci 11 09457 g012
Figure 13. Influences of laser incidence angle and gap between sample and integrating sphere on measurement results: (a) laser incident angle and (b) gap between sample and integrating sphere.
Applsci 11 09457 g013
Table 1. Main technical parameters of the system.
System ComponentParameterSpecifics/Design Values
LaserWavelength for Measurement1064 nm
Wavelength for aiming532 nm
Power Stability±0.19%
Integrating SphereInner Surface Diameter100 mm
Incident Beam Opening Diameter20 mm
Sample Opening Diameter15 mm
Detector Opening Diameter12 mm
Diffuse Reflectance of Inner Wall96%
CCD CameraFocal Length of Aiming Optical System6–60 mm
f-Number1.4
Infrared DetectorSensorInSb and HgCdTe
Response Band1–13 μm
Response Time50 ms
Publisher’s Note: MDPI stays neutral with regard to jurisdictional claims in published maps and institutional affiliations.

