
Use of 2SFCA Method to Identify and Analyze Spatial Access Disparities to Healthcare in Jeddah, Saudi Arabia


Faculty of Architecture and Planning, Department of Urban and Regional Planning, King Abdulaziz University, Jeddah 80210, Saudi Arabia
*
Author to whom correspondence should be addressed.
Appl. Sci. 2021, 11(20), 9537; https://doi.org/10.3390/app11209537
Submission received: 7 September 2021
/
Revised: 1 October 2021
/
Accepted: 6 October 2021
/
Published: 14 October 2021
(This article belongs to the Collection Geoinformatics and Data Mining in Earth Sciences)
Abstract
:The issue of reducing spatial disparities in access to healthcare is one of the most important healthcare planning issues that policy makers and planners investigate and consider as a key focus until present time. A healthcare system that meets the requirements of availability and affordability will be useless if the spatial accessibility to healthcare is not provided to all equally. Therefore, this study aims to identify and analyze spatial disparities in access to healthcare centers in Jeddah, Saudi Arabia. The two-step floating catchment area (2SFCA) method was used to measure spatial accessibility of healthcare centers based on the travel time threshold (i.e., 30-min drive time in this study). The GIS technology was used to execute the 2SFCA method. A geodatabase, which includes the population districts, locations of healthcare centers, and road network, was created. Some procedures were performed within the road network database to set the travel time that is considered as an essential step to compute the origin–destination (OD) cost matrix. The OD matrix was later used as the source for calculating provider-to-population ratios and the spatial accessibility scores for population districts. The results of the study revealed spatial disparities in access to healthcare centers in Jeddah city. The majority of the Jeddah population (i.e., 97.51%) have accessibility to healthcare centers, but with disparate levels. The central districts have a higher access score compared to the rest of the city’s districts. Most districts that do not have accessibility to healthcare centers are concentrated in the southeast of the city. The results can help local health planners improve spatial equity in access to healthcare centers through giving the less-served districts a priority when allocating future healthcare centers in Jeddah city.
1. Introduction
Health is one of the most important basic requirements for a human life [1]. Improving public health for all people by ensuring equal access to healthcare is considered one of the primary Sustainable Development Goals (SDGs) [2,3]. Therefore, healthcare is one of the main pillars that governments seek to provide, finance, and manage in order to preserve communities’ public health. Furthermore, the healthcare system is considered an important indicator reflecting the level of evolution and urbanization of urban communities. Therefore, studying this field has become a priority for many researchers, especially with the evolution of computer technologies that are able to study and analyze a reality of healthcare systems in populated areas ) [4,5,6]. The healthcare system consists of organizations and institutional resources that seek to improve public health for all by providing a variety of services meeting their current and future needs, ensuring their access to these services equally with the least money, time, and effort [4]. Nevertheless, half of world’s population has difficulty accessing healthcare [7]. Thus, these communities will not be able to perform their functions with high efficiency, which negatively affects social and economic development over time. Decision makers, especially urban planners in developing and developed countries, have been seeking to overcome this challenge by providing an equitable and efficient healthcare system [5,8,9,10].
However, the issue of reducing spatial access disparities to healthcare is one of the most important issues of healthcare planning that planners and policy makers investigate and consider as a key focus until the present time. The challenge is how to ensure that spatial accessibility to healthcare is given to all individuals equitably [6,11,12]. The spatial access disparities to healthcare in urban contexts resulted from several factors. First, the rapid and continuous increase in the population and urban growth of cities. Second, the urbanization of poverty, where people living under conditions of poverty suffer from health burdens that should not be underestimated. The third factor is the lack of government expenditure on healthcare provision. Governments try to provide healthcare services to all equally, but, in contrast, they face difficulties spending on healthcare sector development, which leads to an inability of healthcare systems to meet the growing demand for healthcare [4,10]. The fourth factor is structural barriers, such as a limited availability of transportation options, a lack of road network, and poor road conditions. These barriers can prevent or limit access to healthcare providers, which may contribute to creating more spatial disparities [13,14]. Overall, availability of preceding factors contributes to creating spatial inequality in access to healthcare, thus causing the emergence of some communities spatially facing a difficulty of accessing healthcare in urban areas compared to other communities that have perfect access to healthcare [9,10].
Spatial disparities in access to healthcare can be identified and analyzed by measuring the spatial accessibility to healthcare that researchers have extensively investigated recently [15,16,17,18]. Measurement of spatial accessibility estimates the movement opportunity between two different destinations and calculates the degree of relative difficulty that individuals face in accessing healthcare [19]. There are several spatial factors (e.g., supply and demand locations, distance or travel time) and non-spatial factors (e.g., socioeconomic variables of population) that inevitably affect how people access and utilize healthcare. Many studies have used and combined such factors to obtain more accurate and realistic results of measuring spatial accessibility to healthcare [20,21,22,23,24,25]. Measuring spatial accessibility to healthcare helps in formulating planning scenarios that indicate where the healthcare services should be allocated to improve poor spatial accessibility to services. That eventually contributes to minimizing spatial disparities in access to healthcare [26,27]. Several studies have identified and analyzed spatial disparities in access to healthcare by measuring spatial accessibility. For example, Horner and Mascarenhas [28] analyzed a location-based spatial accessibility to identify regional disparities in access to dental services in the State of Ohio. The results revealed disparities in distribution of dental services. For reducing spatial disparity in access to healthcare, Jin et.al. [29] measured and analyzed the spatial accessibility to healthcare services using the travel time technique (i.e., drive time) to assess an inequality of spatial access to healthcare in Deqing County, China. Furthermore, Tseng and Wu [30] integrated spatial and nonspatial factors (i.e., socioeconomic status) to assess spatial disparities in access to community care resources for providing a comprehensive consideration of equal allocation.
The two-step floating catchment area (2SFCA) method is one of the most recent and common methods used to measure a spatial accessibility to healthcare. It is considered a special case of the gravity model. At first, Radke and Mu [31] proposed the 2SFCA method in the form of a spatial deconstruction method, and then Luo and Wang [32,33] developed it to be an appropriate method for measuring the spatial accessibility, taking into consideration supply and demand together. Studies have proven that the 2SFCA method is easier to use and can calculate scores of spatial accessibility compared to the gravity model [18,34,35,36]. Subsequently, many improvements were made to the original 2SFCA method to better deal with the effect of distance decay within the catchments of demand and supply (i.e., considering disparities in spatial accessibility within catchments as a function of distance). Improvements were started by Luo and Qi [37] who introduced the enhanced 2SFCA (E2SFCA), and then Dai and Wang [38] who provided the kernel density 2SFCA (KD2SFCA), and so on [39]. Nevertheless, many studies have used the 2SFCA method to measure the spatial accessibility to healthcare [22,36,40,41,42,43].
The geographical information systems (GIS) play an important role in spatial decision-making related to public health. Furthermore, it can effectively deal with healthcare planning issues by applying statistical and analytical methods. The GIS could be used to enhance the outputs of measuring the spatial accessibility to healthcare. This could be performed using different GIS-based measures and models depending on spatial and nonspatial factors to assess spatial inequalities, identify shortage areas of healthcare, and determine the optimal allocation of health resources [6,32,33,44] However, the GIS technology has been used in many studies concerned with measuring spatial accessibility to healthcare using the 2SFCA method. For example, Wang and Luo [22] used the GIS technology to execute the 2SFCA method to measure spatial accessibility based on travel time, which was calculated by building the (O–D) cost matrix between the physician location and the population location. Areas with poor accessibility to primary healthcare were defined by integrating spatial and nonspatial factors. In another example, [36] executed the 2SFCA method using the GIS platform to identify and analyze spatial disparities in access to healthcare in Alwar district of Rajasthan. The results of study will help decision makers improve the road network and allocate future healthcare centers in the less-served areas in this district.
Jeddah city has been witnessing a continuous increase in its population and urban growth. Globally, it has become one of the fastest growing urban areas due to its high population growth rate, which is about 3.5% annually [45]. According to the report of “Global Metro Monitor 2011”, Jeddah is among the 200 fastest growing metropolitan areas, surpassed only by Shanghai [46]. The rapid population growth in Jeddah will naturally lead to an increase in the demand for various services and creating disparities in the access to such services [47]. One of the most important strategic goals of Saudi Vision 2030 is to facilitate access to healthcare services at the right time and place [48,49]. Consequently, providing healthcare with equal access for all individuals is considered an important issue for the Saudi Ministry of Health and relevant decision makers. Hence, this study aims to identify and analyze spatial disparities in access to healthcare centers run by the Ministry of Health (MOH) in Jeddah city, Saudi Arabia. However, based on previous studies, this is the first study that applies the 2SFCA method to measure GIS-based spatial accessibility of the MOH healthcare centers in Jeddah depending on the travel time (i.e., drive-time threshold). This will help identify and analyze the spatial access disparities to healthcare centers in Jeddah. The results of this study could be helpful to the local health planners in Jeddah through giving the less-served districts a priority when allocating future healthcare centers. That will hopefully improve equity of healthcare service access, thus improving the quality of life for the Jeddah population.
2. Materials and Methods
2.1. Study Area
The study area is the City of Jeddah, which is located in the west of Saudi Arabia, and it is an important urban and commercial center, which has a great economic weight. Moreover, Jeddah is the second largest city after the capital of Saudi Arabia, Riyadh. It is one of the most important seaports on the Red Sea coast [50]. Jeddah is the first gateway that receives millions of people who annually come to Saudi Arabia to perform Hajj and Umrah rituals [51]. Jeddah urban area is approximately 1253.26 km2 [52]. Jeddah has witnessed a quantum leap in all areas of development, which has contributed to a massive increase in its population and urban growth over time. The total population of Jeddah is about 4.1 million people [53]. The rate of population growth in Jeddah is about 3.5% annually [45]. Consequently, Jeddah city is considered as an ideal case that deserves extensive research of spatial accessibility of healthcare services.
The 2SFCA can measure the spatial accessibility at different census levels for a population by using any possible spatial distance variable as an input value within the network analysis [34]. Since the data of population are available at the level of urban Jeddah districts, the 2SFCA method will be applied to the level of districts. This level can provide an accurate representation of healthcare provider shortages and reflect the level of accessibility for the population related to each demand location (i.e., the district) in Jeddah. However, Jeddah has a good structure of healthcare services run by the Ministry of Health (MOH) or other government agencies, as well as the private sector. For example, there are five general hospitals and 47 healthcare centers run by the MOH in Jeddah. Furthermore, Jeddah has a wide range of private hospitals and clinics that are well distributed throughout the city. For this study, only the healthcare centers run by the MOH will be covered.
2.2. Requirements, Collection, and Preparation of Data
As mentioned, this study aims to identify and analyze spatial disparities in the access to the MOH healthcare centers in Jeddah city by measuring spatial accessibility of such services. The original 2SFCA method executed by the GIS technology was used to calculate spatial accessibility scores by considering the catchment area based on the travel time threshold. Spatial factors (i.e., locations of population, locations of healthcare centers, and travel time) were only used to measure spatial accessibility using the 2SFCA method. We did not include nonspatial factors in this study (i.e., socioeconomic variables and demographic characteristics of the population) due to a lack of this type of data at the districts level of Jeddah city. However, to achieve the purpose of this study, we captured three GIS coverages, adding their nonspatial data (Table 1). These coverages were (1) healthcare center locations, (2) population districts, and (3) the road network linking between the population threshold and the healthcare centers. As shown in Table 1, some characteristics of roads (i.e., length and speed limit of roads) were added to the attribute table of road network to estimate a travel time for the car-based transportation between the population threshold and the healthcare centers, where the transportation by buses, bikes, and walking is remarkably low in Jeddah city. All of the preceding data were processed in the ArcGIS Software and used to measure the spatial accessibility to healthcare centers in order to identify and analyze disparities of spatial access to such services in Jeddah.
The above data were collected from various sources in paper format (data were not digital), then entered into the GIS through the digitization method. First, spatial boundaries of districts and related census data were collected from the report of Jeddah Urban Indicators Production issued by the Jeddah Urban Observatory (JUO) in 2015. To build the database within the ArcGIS Software, the census data were converted from paper format to Excel table by the digitization method. Furthermore, the spatial boundaries of districts were represented as a polygon format within the ArcGIS Software, where each polygon represents one district that has a unique ID number (record) within the census attribute table. Second, the addresses of the MOH healthcare centers in Jeddah city were identified through the interactive map on the MOH website (https://www.moh.gov.sa/Pages/Default.aspx) [accessed on 27 June 2021]. Those were later geo-coded to be the locations of facilities that were represented in a points format within the ArcGIS Software. Each point represents one location that has a unique ID number (record) within the related attribute table. The attribute data of the locations were collected from various references, such as the report of Jeddah Urban Indicators Production issued by the Jeddah Urban Observatory (JUO) in 2015, and the General Census of Population, Housing, and Facilities reports issued by the General Authority for Statistics in Saudi Arabia. The attribute data were then converted from paper format to Excel table by the digitization method to build the database within the ArcGIS Software. Third, the roads network and related attribute data were collected from the report of Jeddah Local Plan issued by Jeddah Municipality in 2015 [54], and Jeddah Explorer website (http://maps.jeddah.gov.sa/) [accessed on 21 May 2021]. Centerlines of roads were identified and represented as a lines format within the ArcGIS Software. Each line represents one road that has a unique ID number (record) within the related attribute table. The attribute data were also converted from paper format to Excel table by the digitization method to build the database within the ArcGIS Software.
2.3. Network Analysis
An approach of network analysis is an appropriate approach to deal with routing and transport issues by providing accurate and quick solutions [55]. Several inquiries related to linear networks can be answered by network analysis, especially with advances in the GIS technology recently. This type of analysis requires an availability of network data to find distance between two points within the network. The network data are represented in linear features, such as streets, roads, rivers, etc. A set of applications could be created using the network analysis, the most common of which are: (1) finding the best route or the closest facility by travel time or distance, (2) calculating service areas to determine areas within a specific travel threshold, (3) creating the OD cost matrix to find the cost to access the closest destinations from each origin, and (4) identifying the location of the new facility that provides the best response times for the community, etc. [50,56,57].
The ArcGIS Network Analyst Extension provides the network-based analysis that can spatially solve various routing problems. This analysis could be performed using many spatial tools, such as new route, new closest facility, new service area, new OD cost matrix, and new location-allocation analysis [50,55]. Users use the Network Analyst to solve many problems and inquiries of their network requirements. In other words, the Network Analyst provides several features that enable users to find the quickest or shortest route, plan routes, allocate new facilities, estimate drive-time service area, and so on. The network could also include some cost values (e.g., slope, distance, time, or other flow attributes) [50]. Furthermore, users could utilize the Network Analyst to dynamically produce a network based on realistic conditions, such as speed limits of roads, turn restrictions, and traffic characteristics. To run tools of Network Analyst Extension, the network dataset under ArcCatalog module should firstly be created based on the road network that includes the travel time value for each road (line segment) within the study area [55].
To perform the network analysis task, all data, such as population districts’ boundaries and healthcare centers, should be consistent with the road network dataset, as well as in a format that a user could spatially map and analyze (e.g., population districts’ boundaries that are presented as polygons should be converted to point shapefile) [34]. The point shapefile can be produced by using the “Feature to Point” function within the ArcGIS Software. In other words, this function creates centroids that are used to represent the districts of Jeddah. The use of this feature allows snapping of centroids along the road lines at the closest point to the network for the analysis. By this process, network distance measurements from the facility location can be determined. The district centroid represents the center of demand point for a population that a district polygon includes. Such a demand point is then used, along with the facility location point, to calculate the network distance that identifies which populations are within the drive-time catchment area [35]. Overall, using this feature is useful, especially given that some districts of Jeddah include limited main and secondary roads. However, the tool of “Origin–Destination (OD) Cost Matrix”, which falls under the ArcGIS Network Analyst Extension, is used in this study to execute the 2SFCA method. The OD matrix is used as a source for calculating provider-to-population ratios, and scores of spatial accessibility for population districts.
2.3.1. Setting Travel Time
As mentioned, the 2SFCA method is used to measure the spatial accessibility of the MOH healthcare centers in Jeddah based on a travel time (i.e., drive-time threshold in this study). Therefore, some procedures should firstly be performed within the road network database to set the travel time that is also considered as an essential step to create the OD cost matrix later. According to the available data, four types of roads were used for this study, which are expressways, main, secondary, and local. The Ministry of Municipal and Rural Affairs (MOMRA) in Saudi Arabia issued the Engineering Design Manual for Roads in 2019. In this manual, speed limits are identified according to types of roads, where the desired speed of expressways is 100 km/h, the desired speed of main roads is 80 km/h, the desired speed of secondary roads is 60 km/h, while the desired speed of local roads is 50 km/h. To create a network capable of calculating the travel time, three main fields were added to the road network database within the GIS environment. First, the field of road length was added to calculate the length of each road (line segment) in meters. Assigning the length value for each road was performed by using the “Calculate Geometry Tool”. Second, the field of speed limit was also added to assign a speed limit of travel for each road type in kilometer/hour. Third, the field of travel time was also added to assign the travel time value in minutes it would take to travel within each road type based on its speed limit. Assigning the travel time value for each road type was performed by using the “Field Calculator Tool”. After calculating the travel time for each road type (line segment), some procedures were performed to identify potential problems of the road network shapefile, before producing a network dataset under ArcCatalog module. The problem of duplicated segments resulting from the existence of multiple names and features was solved by applying the “Must Not Overlap” rule within the ArcMap, where the road network does not consider travel or turn restrictions. Furthermore, the (Integrate) tool was used to ensure that all segments were connected, where many segments had no connectivity; thus, the Network Analyst Tools could not be perfectly run.
2.3.2. Creating the Origin–Destination (OD) Cost Matrix
After estimating the travel time and performing a set of procedures within the road network database, a network dataset was produced under the ArcCatalog module in preparation for creating the OD cost matrix that is used as a source to execute the 2SFCA method. Nevertheless, this study used the maximum travel time, which was the 30-min drive time, as a reference to calculate the accessibility score of the MOH healthcare centers in Jeddah. This value of time was determined according to many sources indicating that the 30-min drive time is the rational time to access the healthcare service. For example, Nichols et al. [58] mentioned that a 30-min drive time is a reasonable value for accessing healthcare facilities in Mississippi, USA. One of the most important results of the Project of Ontario CR Pilot was that 66% of sick people could access the healthcare within a specific travel time, estimated at 30 min [59]. Furthermore, the Health Resources and Services Administration (HRSA) has considered populations traveling more than 30 min to access healthcare are at risk for inadequate healthcare [60]. In other words, these populations reside in areas that have a shortage of physicians or facilities.
However, the tool of “OD Cost Matrix” is performed within the GIS environment to calculate scores of spatial accessibility within the drive-time threshold. This tool creates a dataset built by capturing all district centroids within a 30-min drive time (catchment threshold) from each healthcare center. It begins at the location of the first record of healthcare center by searching for all records of locations of district centroids that are located within the cut-off limit of 30-min drive time. This process is repeated through all records of locations of healthcare centers [34,35]. The result of this process is a table containing all the origin–destination pairs. This table shows origins first and then destinations that are sorted from closest to farthest based on travel time. Overall, this process is an important step for calculating scores of spatial accessibility using the 2SFCA method.
2.4. Measuring Spatial Accessibility of the MOH Healthcare Centers Using 2SFCA Method
During the past decade, the 2SFCA method has been used widely to study and analyze the spatial interaction between healthcare providers (supply) and populations (demand) by measuring and assessing spatial accessibility to healthcare. Researchers have preferred to use the 2SFCA method to evaluate healthcare accessibility due to several factors, the most important of which are (1) the ease and flexibility of data requirements, (2) the possibility of representing the capability of a population to travel over boundaries, (3) the unrestricted utilization of all locations within a catchment threshold with a possibility to deal with overlapping catchments, thus giving more realistic modeling results, as well as, (4) the possibility of using the travel-time threshold to overcome problems of distance impedance within catchment areas. Therefore, the 2SFCA method was identified as the appropriate method to achieve the purpose of this study, which is to identify and analyze spatial access disparities to the MOH healthcare centers in Jeddah.
The 2SFCA method could catch an area twice according to demand (i.e., population) and supply (i.e., healthcare providers). The 2SFCA method represents a model of healthcare provider-to-population ratio [36]. It is a method for creating an index that includes a set of combined information to compare among different locations. Measuring spatial accessibility depends on three main factors, which are supply (healthcare providers), demand (population), and travel time between them. Using the 2SFCA method, a spatial accessibility could be measured as a ratio between demand and supply in two steps with consideration of the impedance measure (i.e., travel time). Practically, such two steps evaluate the availability at the locations of healthcare providers as a ratio to the population who fall within the travel time catchments, and then sum up the ratios resulting from the first step for each population location [35].
The 2SFCA method uses the dichotomous distance decay function to create a map of spatial accessibility scores to be classified as accessible–inaccessible by considering the travel time catchment areas. Practically, this function assigns accessible value = 1 within the travel time catchments and inaccessible value = 0 outside of catchments. In other words, equal weights of 1 are given to all population falling within the catchments in both steps (i.e., full accessibility score); thus, they have accessibility to healthcare services. In contrast, equal weights of 0 are given to all population falling outside the catchments (i.e., accessibility score is zero); thus, they have no accessibility to healthcare services, and this indicates that the population of such areas should travel beyond the catchment threshold to access healthcare service [32,34,35].
The results are indexed scores of spatial accessibility that reflect the level of accessibility for population related to each demand location (i.e., district centroid). A spatial accessibility to healthcare services is evaluated according to a scale that includes a lowest score and the highest possible score. The lowest score is zero, which means no accessibility to healthcare, while, the higher the accessibility score, the greater the access to healthcare. Thus, if the supply is greater than demand, it is expected that the score of accessibility will be greater for the population residing close to healthcare services. On the other hand, the score of accessibility will be low if the demand is highly greater than the supply, even if the distance between the demand and supply is small [35]. Nevertheless, the 2SFCA method could be represented by the following two steps [32]:
Step 1. Calculating the provider-to-population ratio (R) for each healthcare provider; thus, for each provider (j), search all population locations (k) that are within a threshold travel time (d0) from location (j) (that is, catchment area j), and calculate the provider-to-population ratio, (Rj), within the catchment area:
where (Pk) is the population of district (k) whose centroid falls within the catchment (dkj < d0), (Sj) is the number of providers at location (j); and (dkj) is the travel time between (k) and (j). Shortly, this defined the provider-to-population ratio (Rj) within a catchment area. This represents a potential demand for the healthcare provider.
Step 2. Calculating the accessibility score (A) for each population district; thus, for each population location (i), search all provider locations (j) that are within the threshold travel time (d0) from location (i) (that is, catchment area i), and sum up the provider-to-population ratios, (Rj), at these locations:
where () represents the accessibility at population location (i) based on the (2SFCA) method, (Rj) is the provider-to-population ratio at the provider location (j) whose centroid falls within the catchment centered at (i) (i.e., dij < d0), and (dij) is the travel time between (i) and (j). A greater value of () means a better accessibility at a location. Shortly, the second step allocates provider-to-population ratios to the population.
To perform this process, the ID fields were added to attribute tables of healthcare centers and population districts to create the origin–destination (OD) cost matrix. These reference fields actually represent the OriginID and DestinationID in the matrix table. After creating the matrix table, functions such as “Join” and “Sum” were used to assign the provider-to-population ratios and calculate the accessibility score for each population district. Use of these functions created a series of tables that actually represent the procedures of execution of the 2SFCA method. However, the results of 2SFCA will show the level of spatial accessibility to healthcare centers within a catchment threshold. In other words, the provider-to-population ratios will be calculated and summed up to identify and analyze spatial access disparities to healthcare services within the catchment threshold.
3. Results
3.1. Spatial Distribution of the MOH Healthcare Centers and Analysis
The first step after creating the geo-database was to understand the current condition about the healthcare centers and initially analyze their spatial distribution in Jeddah city. Healthcare centers are distributed in various parts of Jeddah city. They provide a primary healthcare to the population of Jeddah. A closer look at Figure 1 and Figure 2 indicates that there is imbalanced spatial distribution of healthcare centers in the city. Healthcare centers highly cover most of the central districts; in contrast, the northern and southern districts are less covered by healthcare centers. In other words, the primary healthcare delivery system is not responding to continuous spatial expansion of Jeddah. It is also clear that healthcare centers are concentrated in the high population density areas, which are often concentrated in the city core, where they can serve a larger population, while the spatial concentration of these centers decreases in medium to low population density areas. Furthermore, most of the healthcare centers are located near to main roads, which means that they—in principle—can be accessed by public and private transport.
For further investigation, the tool of standard deviational ellipses (SDE) was used to analyze the spatial distribution of healthcare centers and defining its relationship to the population concentration in Jeddah. Nevertheless, this spatial statistic function can analyze and compare spatial distribution of features and determine their patterns, orientations, and potential spatial directions. This tool is useful for identifying point patterns that take a directional orientation. The standard deviational ellipse could be calculated using point locations or weights to various points based on their attributes. Using this tool, the directional distribution and tendency for a group of features (e.g., areas or points) can be measured by computing the standard distance in directions of x, y, and z separately. Practically, the standard deviation of the x co-ordinates and the y co-ordinates is calculated from the mean center for identifying the ellipse axes. A new feature class containing an elliptical polygon centered on the mean center for all point features will be created. The attribute values for this output ellipse polygon include two standard distances represented in the long and short axes, and the orientation of the ellipse. The orientation represents the rotation of the long axis measured clockwise from noon. The GIS could provide a sense of directional orientation through a set of features drawn on the map; in contrast, calculation of the standard deviational ellipse helps make the trend more obvious. This tool can be helpful to several GIS applications, for instance, comparing the distributions of categories of health conditions, identifying ellipses for the spread of disease with passage of time, defining the directional distribution for a series of crimes, and detecting distributional trends of travel behavior [53].
However, the SDE was selected based on the healthcare center location (i.e., point features) in this study. Figure 3 shows the output of SDE for the spatial distribution of the healthcare centers in Jeddah, which took the clustered pattern. It is clear that the directional orientation for healthcare centers is in line with the population concentration in Jeddah, where most of the centers are more concentrated and spread most widely over the central part of the city, while this concentration for centers decreases towards the north, south, and east (i.e., peripheral districts). This significant concentration of centers in the central part of the city may be due to the availability of many districts with a small area and high population density in this part, where these centers can serve a larger population.
3.2. Spatial Access Disparities to the MOH Healthcare Centers: Analysis of 2SFCA Results
The primary analysis in the previous section indicated that there is a disparity in the spatial distribution of the MOH healthcare centers in Jeddah, where it turns out that the central districts are well covered by centers compared to the peripheral districts that are less served by centers. However, the map of accessibility score (Figure 4) was created using the function of dichotomous distance decay (weight stands at 1 within a 30-min drive-time catchment area and 0 outside). The results of 2SFCA show remarkable disparities in spatial accessibility to healthcare centers within a catchment. Naturally, the difference in the number of healthcare centers available within the catchments contributed to creating the disparities in access to such centers. As shown in Figure 4, the results show that each possible district has an indexed accessibility score based on population. Scores of spatial accessibility were classified by Natural Breaks (Jenks) within the GIS environment. The scores do not reflect acceptable accessibility to healthcare centers, while they provide a relative measure by which accessibility can be evaluated and spatial disparities in access to services can be identified within the 30-min drive-time catchment area. This measure was created by comparing the spatial relationships between the supply and demand across space. The lowest score was zero, which means no accessibility to services, while, the higher the score of spatial accessibility, the greater the opportunity to access services. Thus, the score of spatial accessibility increases if the supply was greater than demand; in contrast, the score decreases if the demand was highly greater than the supply, even if the distance between the demand and supply was small. Nevertheless, the results obtained for urban Jeddah districts showed that the maximum accessibility score was 0.000013, which was obtained by 20 districts concentrated in the central part of the city, while the minimum accessibility score was 0, which was obtained by 14 districts concentrated in the peripheral parts of the city. The mean was 0.000011 and the standard deviation was 0.000002.
As shown in Figure 4, districts can be divided into two main parts (red part and green part). First, for the red part with a score of zero, it represents districts that have no accessibility because they are beyond a 30-min travel time to access healthcare centers. These districts represent 12.39% of the total number of urban Jeddah districts. Despite the fact that the area of these districts represents about a quarter of the total area of urban Jeddah districts, they include about 2.49% of the total Jeddah population. Residents of these districts should travel a more than 30-min drive time to access the healthcare centers. It was expected that such peripheral districts would have a score of zero (i.e., no accessibility), where they are less served by the healthcare centers compared to other districts in the city. Furthermore, they have a limited road network that does not sufficiently connect them with other parts of the city. Second, for the green part, it represents the districts that have accessibility to healthcare centers within the catchment threshold, but with disparate levels of accessibility. These districts represent 87.61% of the total number of urban Jeddah districts and include 97.51% of the total Jeddah population. The darker the green districts, the greater the accessibility to services. Central districts have a higher score of accessibility compared to the rest of the Jeddah districts that have a low accessibility score, especially in the north and south of the city. Nevertheless, districts with the greatest accessibility have a vast majority of the Jeddah population that are concentrated in the city center, while districts with the lowest accessibility have smaller numbers of the population. The largest part of the central districts is located in the highest indexed accessibility score, reflecting the higher provider-to-population ratios, where this part contains a large number of districts with a small area and high population density. In contrast, the lowest classification within the indexed accessibility score reflects the low provider-to-population ratios because the districts associated with such a classification are large in area compared to central districts. Consequently, there were fewer districts within the catchment of healthcare centers. Overall, a vast majority of the Jeddah population had a spatial accessibility to the healthcare centers. Table 2 summarizes the relevant results.
It is clear from (Figure 5) that there is a relationship between a high accessibility and the spatial concentration for healthcare centers, as well as the road network. Districts with the greatest accessibility (e.g., central districts) have many healthcare centers and contain a good and highly efficient road network. Although there are the large number of central districts with a large population concentration, and although most of the central districts’ roads have low speed limits and witness high traffic density that may increase the travel time between origin and service, the score of accessibility of these districts was high due to the spatial concentration of a large number of healthcare centers in such districts, where a large number of the population falls within their catchments. In addition, it is also clear from Figure 5 the proximity of healthcare centers to the expressways and main roads that cross many central districts and taken by the population to access healthcare centers. These levels of roads also have high traffic density within certain segments of them, but, nevertheless, they contribute to reducing travel time between origin and service due to their high speed limits. In contrast, the score of accessibility of peripheral districts decreases and may reach zero, despite the proximity of healthcare centers to the population of these districts. This is attributed to the high population number compared to the number of healthcare centers available within the catchments. Consequently, the population of these districts should compete more for healthcare close to them or should take a longer travel time that may exceed the catchment threshold to access services. This is because these districts have fewer healthcare centers than the central districts; in addition, such healthcare centers are located far from the expressways and main roads. The spatial accessibility of the population of these districts can be improved by increasing the healthcare center-to-population ratios. This can be achieved through multiple approaches, such as allocating additional healthcare centers in the less-served areas (i.e., the southern districts), or optimizing locations of some centers to achieve a more equitable distribution. In addition, it is important to improve the infrastructure of the road network in the southern or even northern districts, along with completing the construction of some roads located in these districts. Furthermore, new roads should be built in the southern districts to enhance their connectivity with other parts of the city, especially given that these districts basically have a limited road network. This will greatly contribute to improving spatial equity in accessibility by reducing travel times taken between the population residing in these districts and healthcare facilities.
Figure 6 shows the 2SFCA results histogram of the healthcare centers at the districts level. The histogram shows that results depart from the normal distribution; however, the distribution of accessibility scores was not random, and the results were due to the interaction between supply, demand, and the travel-time threshold. The analysis indicates that the data distribution is greatly skewed negatively with a high kurtosis. According to DeCarlo [61] and Becker [35], this high kurtosis is a significant indication that there is a profusion of outliers derived from multivariate data within the large dataset, where the data have a greater peak than the normal distribution, and the distribution has more values in the tails compared to the normal distribution. Thus, the result was a high frequency of incidences around the mean, with a long left tail containing sets of incidences away from the mean. This high frequency of incidences, especially on the right side of the mean, is attributed to the presence of a large portion of central districts in the highest indexed accessibility score that reflects the higher provider-to-population ratios, where this part contains many districts with a small area and high population density. On the other hand, the low frequency of incidences away from the mean, especially on the left side of the mean, is attributed to the low provider-to-population ratios within the indexed score, reflecting the presence of districts that are large in area and less in number and population density compared to the central districts. Therefore, this confirms that the distribution does not follow a normal distribution of data.
4. Discussion
Governments seek to provide an equitable and efficient healthcare system that can improve the public health for all and ensure equal access to healthcare. Nevertheless, half of the world’s population has a difficulty of accessing healthcare; thus, communities will not be able to perform their functions efficiently, which negatively affects social and economic development over time. Therefore, studying the reality of the healthcare system and how to improve its performance in populated areas has attracted the attention of many researchers and city planners recently, especially with the development of computer technologies (e.g., GIS technology). One of the most important healthcare planning issues is how to reduce the spatial disparities in access to healthcare. This issue results from the unbalanced spatial distribution of health resources, which contributes to the emergence of communities having poor spatial access to healthcare compared to others. Therefore, it is important to identify and analyze the spatial disparities in access to healthcare within the populated areas to give answer to where the healthcare services should be allocated. This will eventually minimize such disparities and ensure that spatial access to healthcare is given to all individuals equitably. Hence the importance of this study, which aimed to identify and analyze spatial disparities in access to the MOH healthcare centers in Jeddah city. Using GIS, the 2SFCA method was used to measure spatial accessibility to healthcare centers based on a 30-min drive time.
There is an extensive use of travel time in studies concerned with measuring spatial accessibility to healthcare than a travel distance, where the travel time can provide a better indication of spatial barriers to healthcare. Using GIS, the travel time can be estimated for each line segment within the road network based on (1) the speed limit specified for each segment and (2) the physical barriers [62]. In this study, the road network of Jeddah was used to estimate the travel time (impedance measure) in preparation for using a car-based drive-time threshold to measure the spatial accessibility to healthcare centers in Jeddah. The private car is the dominant mode of transportation, which is used more than buses, bikes, or even walking in Jeddah. It represents 95% of all trips within the city, and there is a lack of public transportation [52]. Accordingly, car ownership rates have been witnessing a huge increase in Jeddah, where about 90% of households own one or more cars, while the other 10% rely heavily on local taxis and buses for transportation purposes [63]. The use of different modes of transportation is not preferred in Jeddah due to (1) bad condition of buses, deficient infrastructure, and low accessibility [64], which leads to taking long times to access the desired destination, especially with the availability of high traffic congestion resulting from the full reliance on using private cars; and (2) districts are not suitable for walking or bicycling; thus, residents travel long distances by private cars in order to access required services.
Since private car is the only convenient way to travel in Jeddah, what about those who do not have a private car and reside, for example, in areas away from healthcare facilities? How can they access healthcare at the right time, especially with the lack of public transportation in Jeddah? In fact, the use of drive time as a measure of spatial accessibility to healthcare may not reflect the experience of those who do not have a private car. According to Jordan et.al. [65], spatial access to healthcare needs to select an appropriate measure, where there are several measures of varying complexity and specificity. However, better measures, which integrate public and private transportation, are needed to accurately reflect the experience of those who are without their own transport. This will contribute to mitigating spatial inequity in access to healthcare. There are several studies such as Mao and Nekorchuk [66] and Zhou et al. [67] that used multiple transportation modes to measure spatial accessibility to healthcare. Accordingly, decision makers should formulate intervention priorities aimed at improving the public transportation system in Jeddah, which contributes to facilitating access to healthcare services at the right time, especially for those who do not have cars. Furthermore, a future study that integrates multiple modes of transportation is needed to accurately assess spatial access disparities to healthcare services in Jeddah.
However, the results of study indicate that the MOH healthcare centers are insufficient in Jeddah city, where the outputs of the 2SFCA method revealed spatial disparities in access to healthcare centers. Spatial accessibility to healthcare centers is unevenly distributed and concentrated, where it is remarkably higher in central districts than peripheral districts. The disparity in access is largely a result of the unbalanced spatial distribution of healthcare centers, where most of which are concentrated in central districts and their concentration decreases towards the edge of the city. Furthermore, peripheral districts have a limited road network that does not sufficiently connect them with other parts of the city, which negatively affected the accessibility of the population residing in these districts. About 97.51% of the Jeddah population have access to healthcare centers, but with disparate levels of accessibility. In contrast, the area of districts that has no accessibility is approximately a quarter of the total area of urban Jeddah districts, and it includes about 2.49% of the total population of Jeddah. The percentage of the population that has no accessibility is, in fact, very small compared to the total population in the study area. However, identifying the areas in which these populations live is a necessary procedure for formulating planning interventions that can reduce spatial disparities in access to health resources, where a healthcare system that meets the requirements of availability and affordability will be useless if the spatial accessibility to healthcare is not provided to all equally [68].
It seems logical that government institutions or even the private sector focus on allocating healthcare services in densely populated areas in order to provide access to the majority of the population. For instance, it was found that the population of the central districts in Al-Madinah, Saudi Arabia can easily access health services with the least distance and fastest time because of the high spatial concentration of these services at the level of central districts [69]. Moreover, according to Luo et al. [18], the central urban areas of Wuhan have a higher or the highest level of medical accessibility that is attributed to the spatial concentration for most population and medical services in these areas. In the case of Jeddah, it is clear that the Ministry of Health has given a priority to densely populated districts (i.e., central districts) when allocating healthcare centers in order to serve a larger population. Therefore, we find that the central districts had a higher or the highest spatial accessibility scores because of the spatial concentration for the population and healthcare centers in these districts. However, one of the most important strategic goals of Saudi Vision 2030 is to facilitate access to healthcare services at the right time and place. Therefore, the Ministry of Health has recently focused on how to provide healthcare with equal access for all populations of Saudi cities. In Jeddah, for example, a number of new healthcare centers have recently been operated at the level of peripheral districts, especially in the northern and southern districts of the city, in order to reduce spatial disparities in access to healthcare in Jeddah. This is confirmed by the results of this study, which indicated that the peripheral districts, especially those located in the southern part of the city, are less-served areas by healthcare centers.
This study used the 30-min drive-time threshold to calculate spatial accessibility scores, similar to some previous studies that considered that the acceptable travel time to access healthcare should not exceed a 30-min drive time [58,59,60]. However, it might come to mind, if the travel time threshold was increased by more than 30 min or reduced by less than 30 min, would this affect spatial accessibility scores? Furthermore, would this change affect the magnitude of spatial disparities, especially given that 5–10 min in travel time is a reasonable fluctuation in travel time for daily commutes in and out of the city? In fact, several studies [16,18,70] indicated that the use of different travel-time thresholds can affect the analysis and evaluation of healthcare accessibility. For example, in the study of Luo et al. [18], the accessibility of medical services for elderly people in Wuhan, China was measured using the E2SFCA method based on different travel-time thresholds (i.e., 10 min and 60 min). The results of the study indicated that accessibility scores were affected when using two time thresholds, which led to the change in the magnitude of spatial disparities. When using the 10-min threshold, the accessibility scores presented the pattern of cluster spatial distribution and there were 84.01 million elderly people who had higher medical accessibility. In contrast, the scores increased when using the 60-min threshold, and there were more than 128.31 million elderly people who had higher medical accessibility.
In the case of Jeddah city, we expect that the use of different time thresholds will affect the results of the accessibility scores. Increasing the threshold by more than 30 min may improve the overall level of spatial accessibility, where healthcare centers further away from the population centroid will become accessible. Spatial accessibility scores may excessively increase at the level of central districts, with a slight increase for peripheral districts due to the existence of a limited road network in these districts. In general, increasing the threshold may contribute to reducing the spatial disparities in access to healthcare centers, especially given that some districts may be reclassified as districts with access to healthcare centers. On the other hand, reducing the threshold by less than 30 min may contribute to creating more spatial disparities, especially with the shortage of healthcare centers and the existence of a limited road network in certain districts without others. However, further research is needed to determine the effect of using different time thresholds on the magnitude of spatial disparities in access to healthcare centers in Jeddah. Therefore, our future work could investigate this issue by applying the E2SFCA method to measure spatial accessibility based on different time thresholds.
Although the study successfully demonstrated that remarkable spatial disparities in access to healthcare centers exist within urban Jeddah districts, it has certain limitations: (1) the presented study was based on population data that exceeded five years, and, therefore, more recent data are required to obtain more accurate results; (2) the study only covered the healthcare centers run by the Ministry of Health without considering private healthcare centers due to the lack of a spatial database for these centers. In contrast, identifying and geo-coding the addresses of these centers will cost researchers great time and effort that is not consistent with the time schedule given to complete this study. We expect that including private healthcare centers will improve the overall level of spatial accessibility, even with the limited road network in the peripheral districts, where these centers are well distributed over most parts of the city. However, more research is needed on the extent to which the inclusion of these centers contributes to reducing spatial disparities in access to healthcare in Jeddah. (3) Our initial research orientation was to integrate spatial and nonspatial factors (i.e., social and economic variables and demographic characteristics of the population) to accurately assess spatial disparities in access to healthcare centers in Jeddah, but the lack of data related to nonspatial factors at the districts level has led to the use of only the spatial factors in this study.
Researchers have become aware of the importance of integrating spatial and nonspatial factors to be an effective method for assessing access to healthcare [22]. Nonspatial factors, such as poverty, income, age, language, disability status, or even availability and cost of transportation, can affect access to healthcare facilities [71]. For instance, Law et.al. [72] found that the utilization of physicians and meeting healthcare needs differ from one neighborhood to another in Hamilton, Ontario. They revealed that residents of the lowest income neighborhoods have lower utilization of physicians, as well as their health needs not being met [73]. Furthermore, entire district populations aged 65 and over have poor access to primary health services in Naples, Italy, especially in the city suburbs [74]. Accordingly, it is important that future research investigates the assessment of spatial disparities in access to healthcare services in Jeddah by integrating spatial and nonspatial factors, using improved versions of the original 2SFCA method, where these improvements can better deal with the effect of distance decay within the supply and demand catchments compared to the original method that is limited to using the dichotomous distance decay function.
5. Conclusions
Providing equal spatial access to healthcare has become crucial, especially with increasing population growth in urban contexts. In other words, a healthcare system that meets the requirements of availability and affordability will be useless if the spatial accessibility to healthcare is not provided to all equally. Hence, this study sought to identify and analyze spatial disparities in access to the MOH healthcare centers in Jeddah city. Using GIS, spatial accessibility was measured using the original 2SFCA method based on the 30-min drive-time threshold.
Overall, the results showed that 97.51% of the Jeddah population have access to healthcare centers, but with disparate levels of accessibility. The majority of those are concentrated in the central districts of the city. In contrast, 2.49% of the population is classified as unserved populations, where they should travel more than 30 min to access a healthcare center. Most of these districts are concentrated in the southeast of the city. Nevertheless, spatial disparities in access to healthcare centers can be reduced in Jeddah by applying several approaches, such as allocating new centers in less-served areas or optimizing locations of some centers at the level of Jeddah districts. Moreover, it is necessary to enhance the spatial connectivity between districts with poor access and other parts of the city. This can be achieved by building or completing road construction in some districts that basically have a limited road network, such as the southern districts. In addition, strengthening the existing collective transport network at the level of peripheral districts may improve spatial access to healthcare centers. Consequently, implementing such recommendations could reduce travel time taken between populations residing in peripheral districts and healthcare facilities by less than 30 min; thus, some of these districts may be reclassified as districts with access to healthcare centers. However, there is a need for further investigation on how much the spatial access to healthcare would be improved if road and public transport networks were developed in Jeddah, especially at the level of peripheral districts.
This study only covered the MOH healthcare centers in Jeddah according to the available data and the time schedule given for preparing this study; however, this is not enough to take a comprehensive conception of the reality of the healthcare system in Jeddah. Therefore, this study can be considered as a basis for further investigations, which is important to focus on measuring spatial accessibility to healthcare providers (governmental and private) in Jeddah or even other Saudi cities using the methodology of the 2SFCA method or its enhanced versions. Furthermore, it is also essential that these investigations consider integrating spatial and nonspatial factors to identify and assess spatial disparities in access to healthcare more accurately. However, in contrast, the lack of spatial data on healthcare providers (i.e., facility location address) and nonspatial data (e.g., socioeconomic variables at the level of urban population districts) may constitute an obstacle to conducting such investigations. It is possible to conduct surveys to collect this data at the level of urban population districts, but it may require more time, effort, and resources to accomplish this task.
However, the results of this study can be considered as an assistant reference for the MOH decision makers when developing the primary healthcare sector in Jeddah by giving the less-served districts defined by this study a priority when allocating future healthcare centers. This will contribute to improve spatial equity in access to healthcare centers.
Author Contributions
Conceptualization, A.M.; methodology, A.M. and B.F.K.; software, B.F.K.; validation, A.M. and B.F.K.; formal analysis, A.M. and B.F.K.; investigation, A.M. and B.F.K.; resources, A.M. and B.F.K.; data creation, B.F.K.; writing—original draft preparation, B.F.K.; writing—review and editing, A.M. and B.F.K.; visualization, B.F.K.; supervision, A.M. All authors have read and agreed to the published version of the manuscript.
Funding
This research received no external funding.
Institutional Review Board Statement
Not applicable.
Informed Consent Statement
Not applicable.
Data Availability Statement
Not applicable.
Conflicts of Interest
Authors declare no conflict of interest.
References
- CESCR—Committee on Economic, Social and Cultural Rights. The Right to the Highest Attainable Standard of Health. United Nations Human Rights. 2020. Available online: https://www.refworld.org/pdfid/4538838d0.pdf (accessed on 26 May 2020).
- Griggs, D.; Stafford-Smith, M.; Gaffney, O.; Rockstrom, J.; Ohman, M.C.; Shyamsundar, P.; Steffen, W.; Glaser, G.; Kanie, N.; Noble, I. Policy: Sustainable development goals for people and planet. Nature 2013, 495, 305–307. [Google Scholar] [CrossRef] [PubMed]
- United Nations. Transforming our world: The 2030 Agenda for Sustainable Development. 2021. Available online: https://sdgs.un.org/2030agenda (accessed on 8 July 2021).
- Sherif, A. Towards Spatial Justice in Urban Health Services Planning. Ph.D. Thesis, University of Utrecht, Utrecht, The Netherlands, 2007. [Google Scholar]
- Drissy, A. The Evolution of Health Expenditure in Algeria and its Effectiveness in the Reform of the Health System during the Period (2013–2004). Algerian J. Glob. Econ. Policies 2015, 6, 137–145. [Google Scholar]
- Khashoggi, B.F.; Murad, A. Issues of Healthcare Planning and GIS: A Review. ISPRS Int. J. Geo Inf. 2020, 9, 352. [Google Scholar] [CrossRef]
- World Health Organization. World Bank and WHO: Half the World Lacks Access to Essential Health Services, 100 Million Still Pushed into Extreme Poverty Because of Health Expenses. 2017. Available online: https://www.who.int/news-room/detail/13-12-2017-world-bank-and-who-half-the-world-lacks-access-to-essential-health-services-100-million-still-pushed-into-extreme-poverty-because-of-health-expenses (accessed on 21 December 2019).
- Geertman, S.C.M.; Van Eck, J.R.R. GIS and models of accessibility potential: An application in planning. Int. J. Geogr. Inf. Sci. 1995, 9, 67–80. [Google Scholar] [CrossRef]
- Curtis, S. Health and Inequalities: Geographical Perspectives; Sage: London, UK, 2004. [Google Scholar]
- Mokgalaka, H. GIS-Based Analysis of Spatial Accessibility: An Approach to Determine Public Primary Healthcare Demand in Metropolitan Areas. Master’s Thesis, University of Cape Town, Cape Town, South Africa, 2015. [Google Scholar]
- McGrail, M.; Humphreys, J. Spatial access disparities to primary health care in rural and remote Australia. Geospat. Health 2015, 10, 358. [Google Scholar] [CrossRef] [PubMed] [Green Version]
- Oladimeji, A. Measurement of Spatial Accessibility and Disparities to Pharmacies in Lucas County and Multnomah County. Master’s Thesis, The University of Toledo, Toledo, OH, USA, 2018. [Google Scholar]
- Mandal, A.; Disparities in Access to Health Care. News Medical Life Sciences. 2019. Available online: https://www.news-medical.net/health/Disparities-in-Access-to-Health-Care.aspx (accessed on 26 September 2021).
- Varela, C.; Young, S.; Mkandawire, N.; Groen, R.; Banza, L.; Viste, A. Transportation Barriers to Access Health Care for Surgical Conditions in Malawi a cross sectional nationwide household survey. BMC Public Health 2019, 19, 1–8. [Google Scholar] [CrossRef]
- Shrestha, J. Evaluation of Access to Primary Healthcare: A Case Study of Yogyakarta, Indonesia. Master’s Thesis, University of Twente, Enschede, The Netherlands, 2010. [Google Scholar]
- Ye, H.; Hyun, K. Measuring Spatial Health Disparity Using a Network-Based Accessibility Index Method in a GIS Environment: A Case Study of Hillsborough County, Florida. Int. J. Geospat. Environ. Res. 2014, 1, 2. [Google Scholar]
- Tao, Z.; Cheng, Y.; Zheng, Q.; Li, G. Measuring spatial accessibility to healthcare services with constraint of administrative boundary: A case study of Yanqing District, Beijing, China. Int. J. Equity Health 2018, 17, 7. [Google Scholar] [CrossRef] [Green Version]
- Luo, J.; Chen, G.; Li, C.; Xia, B.; Sun, X.; Chen, S. Use of an E2SFCA Method to Measure and Analyse Spatial Accessibility to Medical Services for Elderly People in Wuhan, China. Int. J. Environ. Res. Public Health 2018, 15, 1503. [Google Scholar] [CrossRef] [Green Version]
- Long, J. Modelling Accessibility. In Geographic Information Science & Technology Body of Knowledge; 3rd Quarter 2019 ed.; Wilson, P.J., Ed.; 2017. [Google Scholar] [CrossRef]
- Mohan, J.; Joseph, A.E.; Phillips, D.R. Accessibility and Utilization: Geographical Perspectives on Health Care Delivery. Trans. Inst. Br. Geogr. 1986, 11, 121. [Google Scholar] [CrossRef]
- Khan, A.A.; Bhardwaj, S.M. Access to Healthcare: A Conceptual framework and its relevance to Health Care Planning. Eval. Health Prof. 1994, 17, 60–76. [Google Scholar] [CrossRef] [PubMed]
- Wang, F.; Luo, W. Assessing spatial and nonspatial factors for healthcare access: Towards an integrated approach to defining health professional shortage areas. Health Place 2005, 11, 131–146. [Google Scholar] [CrossRef] [PubMed]
- World Health Organization. Barriers and Facilitating Factors in Access to Health Services in the Republic of Moldova. Health Policy Paper; WHO: Geneva, Switzerland, 2012; pp. 4–22. Available online: http://www.euro.who.int/__data/assets/pdf_file/0018/183510/e96775-final.pdf (accessed on 9 July 2021).
- Zhang, L. Measuring Primary Health Care Accessibility in Mississippi State Using an Extended Kernel Density 2SFCA Method. Master’s Thesis, Louisiana State University, Baton Rouge, LA, USA, 2015. [Google Scholar]
- Bauer, J.; Klingelhöfer, D.; Maier, W.; Schwettmann, L.; Groneberg, D.A. Spatial accessibility of general inpatient care in Germany: An analysis of surgery, internal medicine and neurology. Sci. Rep. 2020, 10, 19157. [Google Scholar] [CrossRef] [PubMed]
- Murad, A. Using GIS for Planning Public General Hospitals at Jeddah City. JKAU 2005, 3, 3–22. [Google Scholar] [CrossRef]
- Fu, C. Planning Towards Equal Spatial Accessibility of NCI Cancer Centers Across Geographic Areas and Demographic Groups in the U.S. Ph.D. Thesis, Louisiana State University, Baton Rouge, LA, USA, 2015. [Google Scholar]
- Horner, M.W.; Mascarenhas, A.K. Analyzing location-based accessibility to dental services: An Ohio case study. J. Public Health Dent. 2007, 67, 113–118. [Google Scholar] [CrossRef]
- Jin, C.; Cheng, J.; Lu, Y.; Huang, Z.; Cao, F. Spatial inequity in access to healthcare facilities at a county level in a developing country: A case study of Deqing County, Zhejiang, China. Int. J. Equity Health 2015, 14, 67. [Google Scholar] [CrossRef] [Green Version]
- Tseng, M.-H.; Wu, H.-C. Integrating Socioeconomic Status and Spatial Factors to Improve the Accessibility of Community Care Resources Using Maximum-Equity Optimization of Supply Capacity Allocation. Int. J. Environ. Res. Public Health 2021, 18, 5437. [Google Scholar] [CrossRef]
- Radke, J.; Mu, L. Spatial decomposition, modeling and mapping service regions to predict access to social programs. Geogr. Inf. Sci. 2000, 6, 105–112. [Google Scholar] [CrossRef]
- Luo, W.; Wang, F. Spatial accessibility to primary care and physician shortage area designation: A case study in Illinois with GIS approaches. In Geographic Information Systems and Health Applications; Skinner, R., Khan, O., Eds.; Idea Group Publishing: Hershey, PA, USA, 2003; pp. 260–278. [Google Scholar]
- Luo, W.; Wang, F. Measures of spatial accessibility to health care in a GIS environment: Synthesis and a case study in the Chicago region. Environ. Plan. B Plan. Des. 2003, 30, 865–884. [Google Scholar] [CrossRef] [PubMed] [Green Version]
- Almudaris, S. Measuring Accessibility to Primary Care Physicians in The Nashville Metropolitan Statistical Area. Master’s Thesis, Western Kentucky University, Bowling Green, KY, USA, 2011. [Google Scholar]
- Becker, C. A Spatial Analysis of Veteran Healthcare Accessibility. Master’s Thesis, University of Southern California, Los Angeles, CA, USA, 2016. [Google Scholar]
- Kanuganti, S.; Sarkar, A.; Singh, A. Quantifying Accessibility to Health Care Using Two-step Floating Catchment Area Method (2SFCA): A Case Study in Rajasthan. Transp. Res. Procedia 2016, 17, 391–399. [Google Scholar] [CrossRef]
- Luo, W.; Qi, Y. An enhanced two-step floating catchment area (E2SFCA) method for measuring spatial accessibility to primary care physicians. Health Place 2009, 15, 1100–1107. [Google Scholar] [CrossRef]
- Dai, D.; Wang, F. Geographic disparities in accessibility to food stores in southwest Mississippi. Environ. Plan. B Plan. Des. 2011, 38, 659–677. [Google Scholar] [CrossRef]
- James, B., Jr.; Delamater, P.L. Examination of spatial accessibility at micro- and macro-levels using the enhanced two-step floating catchment area (E2SFCA) method. Ann. GIS 2018, 25, 219–229. [Google Scholar] [CrossRef] [Green Version]
- Guagliardo, M.F. Spatial accessibility of primary care: Concepts, methods and challenges. Int. J. Health Geogr. 2004, 3, 3. [Google Scholar] [CrossRef] [PubMed] [Green Version]
- Yang, D.H.; Goerge, R.; Mullner, R. Comparing GIS-Based Methods of Measuring Spatial Accessibility to Health Services. J. Med. Syst. 2006, 30, 23–32. [Google Scholar] [CrossRef]
- McGrail, M.R. Spatial accessibility of primary health care utilising the two step floating catchment area method: An assessment of recent improvements. Int. J. Health Geogr. 2012, 11, 50. [Google Scholar] [CrossRef] [PubMed] [Green Version]
- Putra, M.; Utami, N. Measuring Spatial Healthcare Facilities Accessibility Using Two-Step Floating Catchment Analysis (2SFCA) (Case Study: Cianjur Regency, Indonesia). Semin. Nas. Geomatika 2021, 11, 11–20. [Google Scholar]
- Fradelos, E.; Papathanasiou, I.; Mitsi, D.; Tsaras, K.; Kleisiaris, C.; Kourkouta, L. Health Based Geographic Information Systems (GIS) and their Applications. Acta Inform. Med. 2014, 22, 402–405. [Google Scholar] [CrossRef] [Green Version]
- Jeddah Municipality. The Importance of Jeddah City. 2020. Available online: https://www.jeddah.gov.sa/Jeddah/About/index.php (accessed on 3 November 2020).
- Brookings Institution. Global Metromonitor 2011: Volatility, Growth, and Recovery. Global MetroMonitor. Brookings Institution 2011. p. 11. Available online: https://www.brookings.edu/wp-content/uploads/2016/06/0118_global_metro_monitor.pdf (accessed on 24 September 2020).
- Al-Enezi, N. Analyzing Urban Growth and its Directions in Jeddah City of Using Remote Sensing Techniques and Geographic Information Systems (GIS). Ph.D. Thesis, Umm Al-Qura University, Al-Qura, Saudi Arabia, 2019. [Google Scholar]
- MOH. Annual Report of the Ministry of Health for the Financial Year 2018; Annual Reports; MOH: Riyadh, Saudi Arabia, 2018; pp. 180–182. Available online: https://www.moh.gov.sa/Ministry/About/Documents/MOH-Report-2018.pdf (accessed on 13 October 2020).
- Vision 2030. National Transformation Program. 2020. Available online: https://vision2030.gov.sa/ar/programs/NTP (accessed on 16 October 2020).
- Murad, A. Using GIS for Determining Variations in Health Access in Jeddah City, Saudi Arabia. ISPRS Int. J. Geo-Inf. 2018, 7, 254. [Google Scholar] [CrossRef] [Green Version]
- Helmi, M. The Ability of the Local Planning Authority to Implement Zoning Regulations: A Case Study of Jeddah, Saudi Arabia. Ph.D. Thesis, University of Newcastle upon Tyne, Newcastle, UK, 2015. [Google Scholar]
- Jeddah Urban Observatory. Report of Urban Indicators Production for Jeddah City; Issue of 2015; Jeddah Municipality: Jeddah City, Saudi Arabia, 2015. [Google Scholar]
- Murad, A.; Khashoggi, B.F. Using GIS for Disease Mapping and Clustering in Jeddah, Saudi Arabia. ISPRS Int. J. Geo-Inf. 2020, 9, 328. [Google Scholar] [CrossRef]
- Jeddah Municipality. Jeddah Local Plan. Jeddah Plans; Jeddah Municipality: Jeddah City, Saudi Arabia, 2015; p. 47. [Google Scholar]
- Akay, A.; Aziz, B. GIS-Based Forest Road Network Model for Forest Protection Purposes. In Proceedings of the 38th Annual COFE Meeting—Engineering Solutions for Non-Industrial Private Forest Operations, Kentucky, KY, USA, 19–22 July 2015; p. 267. Available online: https://cofe.org/pdfs/COFE_2015.pdf (accessed on 18 July 2021).
- Comber, A.; Brunsdon, C.; Radburn, R. A spatial analysis of variations in health access: Linking geography, socio-economic status and access perceptions. Int. J. Health Geogr. 2011, 10, 44. [Google Scholar] [CrossRef] [Green Version]
- Esri. Types of Network Analysis Layers. 2021. Available online: https://desktop.arcgis.com/en/arcmap/latest/extensions/network-analyst/types-of-network-analyses.htm#ESRI_SECTION1_DEAE22E63F944F6C958668B8C4AA96DA (accessed on 19 August 2021).
- Nichols, E.N.; Bradley, D.L.; Zhang, X.; Faruque, F.; Duhé, R.J. The geographic distribution of mammography resources in Mississippi. Online J. Public Health Inform. 2014, 5, 226. [Google Scholar] [CrossRef] [Green Version]
- Brual, J.; Gravely-Witte, S.; Suskin, N.; Stewart, D.; Macpherson, A.; Grace, S. Drive time to cardiac rehabilitation: At what point does it affect utilization? Int. J. Health Geogr. 2010, 9, 27. [Google Scholar] [CrossRef] [Green Version]
- Allred, J.; Duffrin, C.; Brinkley, J.; Jones, J. High-risk travel distance and number of primary care visits in a North Carolina Medicaid population. Front. Public Health Serv. Sys. Res. 2015, 4, 55–60. [Google Scholar] [CrossRef]
- DeCarlo, L.T. On the Meaning and Use of Kurtosis. Psychol. Methods 1997, 2, 292–307. [Google Scholar] [CrossRef]
- Murad, A. Using geographical information systems for defining the accessibility to health care facilities in Jeddah City, Saudi Arabia. Geospat. Health 2014, 8, 661. [Google Scholar] [CrossRef] [PubMed] [Green Version]
- Qurnfulah, E. The Negative Impacts of Subdivision Regulation on The Residential Built Environment: Jeddah’S Experience. Ph.D. Thesis, University of Newcastle, Newcastle, UK, 2015. [Google Scholar]
- Aljoufie, M. Exploring the Determinants of Public Transport System Planning in Car-dependent Cities. Procedia Soc. Behav. Sci. 2016, 216, 535–544. [Google Scholar] [CrossRef] [Green Version]
- Jordan, H.; Roderick, P.; Martin, D.; Barnett, S. Distance, rurality and the need for care: Access to health services in South West England. Int. J. Health Geogr. 2004, 3, 21. [Google Scholar] [CrossRef] [PubMed] [Green Version]
- Mao, L.; Nekorchuk, D. Measuring spatial accessibility to healthcare for populations with multiple transportation modes. Health Place 2013, 24, 115–122. [Google Scholar] [CrossRef]
- Zhou, X.; Yu, Z.; Yuan, L.; Wang, L.; Wu, C. Measuring Accessibility of Healthcare Facilities for Populations with Multiple Transportation Modes Considering Residential Transportation Mode Choice. ISPRS Int. J. Geo Inf. 2020, 9, 394. [Google Scholar] [CrossRef]
- Li, Y.; Vo, A.; Randhawa, M.; Fick, G. Designing utilization-based spatial healthcare accessibility decision support systems: A case of a regional health plan. Decis. Support Syst. 2017, 99, 51–63. [Google Scholar] [CrossRef]
- Abdelkarim, A. Integration of Location-Allocation and Accessibility Models in GIS to Improve Urban Planning for Health Services in Al-Madinah Al-Munawwarah, Saudi Arabia. J. Geogr. Inf. Syst. 2019, 11, 633–662. [Google Scholar] [CrossRef] [Green Version]
- Zhu, L.; Zhong, S.; Tu, W.; Zheng, J.; He, S.; Bao, J.; Huang, C. Assessing Spatial Accessibility to Medical Resources at the Community Level in Shenzhen, China. Int. J. Environ. Res. Public Health 2019, 16, 242. [Google Scholar] [CrossRef] [Green Version]
- NCBI. Health-Care Utilization as a Proxy in Disability Determination: 2. Factors That Affect Health-Care Utilization. 2021. Available online: https://0-www-ncbi-nlm-nih-gov.brum.beds.ac.uk/books/NBK500097/ (accessed on 30 September 2021).
- Law, M.; Wilson, K.; Eyles, J.; Elliott, S.; Jerrett, M.; Moffat, T.; Luginaah, I. Meeting health need, accessing health care: The role of neighbourhood. Health Place 2005, 11, 367–377. [Google Scholar] [CrossRef] [PubMed]
- Shah, T.; Bell, S.; Wilson, K. Spatial Accessibility to Health Care Services: Identifying under-Serviced Neighbourhoods in Canadian Urban Areas. PLoS ONE 2016, 11, e0168208. [Google Scholar]
- Carpentieri, G.; Guida, C.; Masoumi, H. Multimodal Accessibility to Primary Health Services for the Elderly: A Case Study of Naples, Italy. Sustainability 2020, 12, 781. [Google Scholar] [CrossRef] [Green Version]
Figure 1.
Spatial distribution of population districts and healthcare centers. Note: districts classified by population using the Natural Breaks (Jenks) within the ArcGIS Software.
Figure 1.
Spatial distribution of population districts and healthcare centers. Note: districts classified by population using the Natural Breaks (Jenks) within the ArcGIS Software.

Figure 2.
Spatial distribution of healthcare centers and population density. Note: population density classified by Kernel Density Model within the ArcGIS Software.
Figure 2.
Spatial distribution of healthcare centers and population density. Note: population density classified by Kernel Density Model within the ArcGIS Software.

Figure 3.
Standard deviational ellipse (SDE) for the spatial distribution of healthcare centers using ArcGIS Software.
Figure 3.
Standard deviational ellipse (SDE) for the spatial distribution of healthcare centers using ArcGIS Software.

Figure 4.
Results of spatial accessibility score of healthcare centers using 2SFCA method at the districts level within the ArcGIS Software.
Figure 4.
Results of spatial accessibility score of healthcare centers using 2SFCA method at the districts level within the ArcGIS Software.

Figure 5.
Districts with the greatest accessibility and their relationship to healthcare centers and road ne work. Note: The local road level was excluded from this map.
Figure 5.
Districts with the greatest accessibility and their relationship to healthcare centers and road ne work. Note: The local road level was excluded from this map.

Figure 6.
2SFCA results histogram of MOH healthcare centers. Note: (1) districts with a score of 0 were excluded from the results, and (2) the red lines are the classification breaks.
Figure 6.
2SFCA results histogram of MOH healthcare centers. Note: (1) districts with a score of 0 were excluded from the results, and (2) the red lines are the classification breaks.


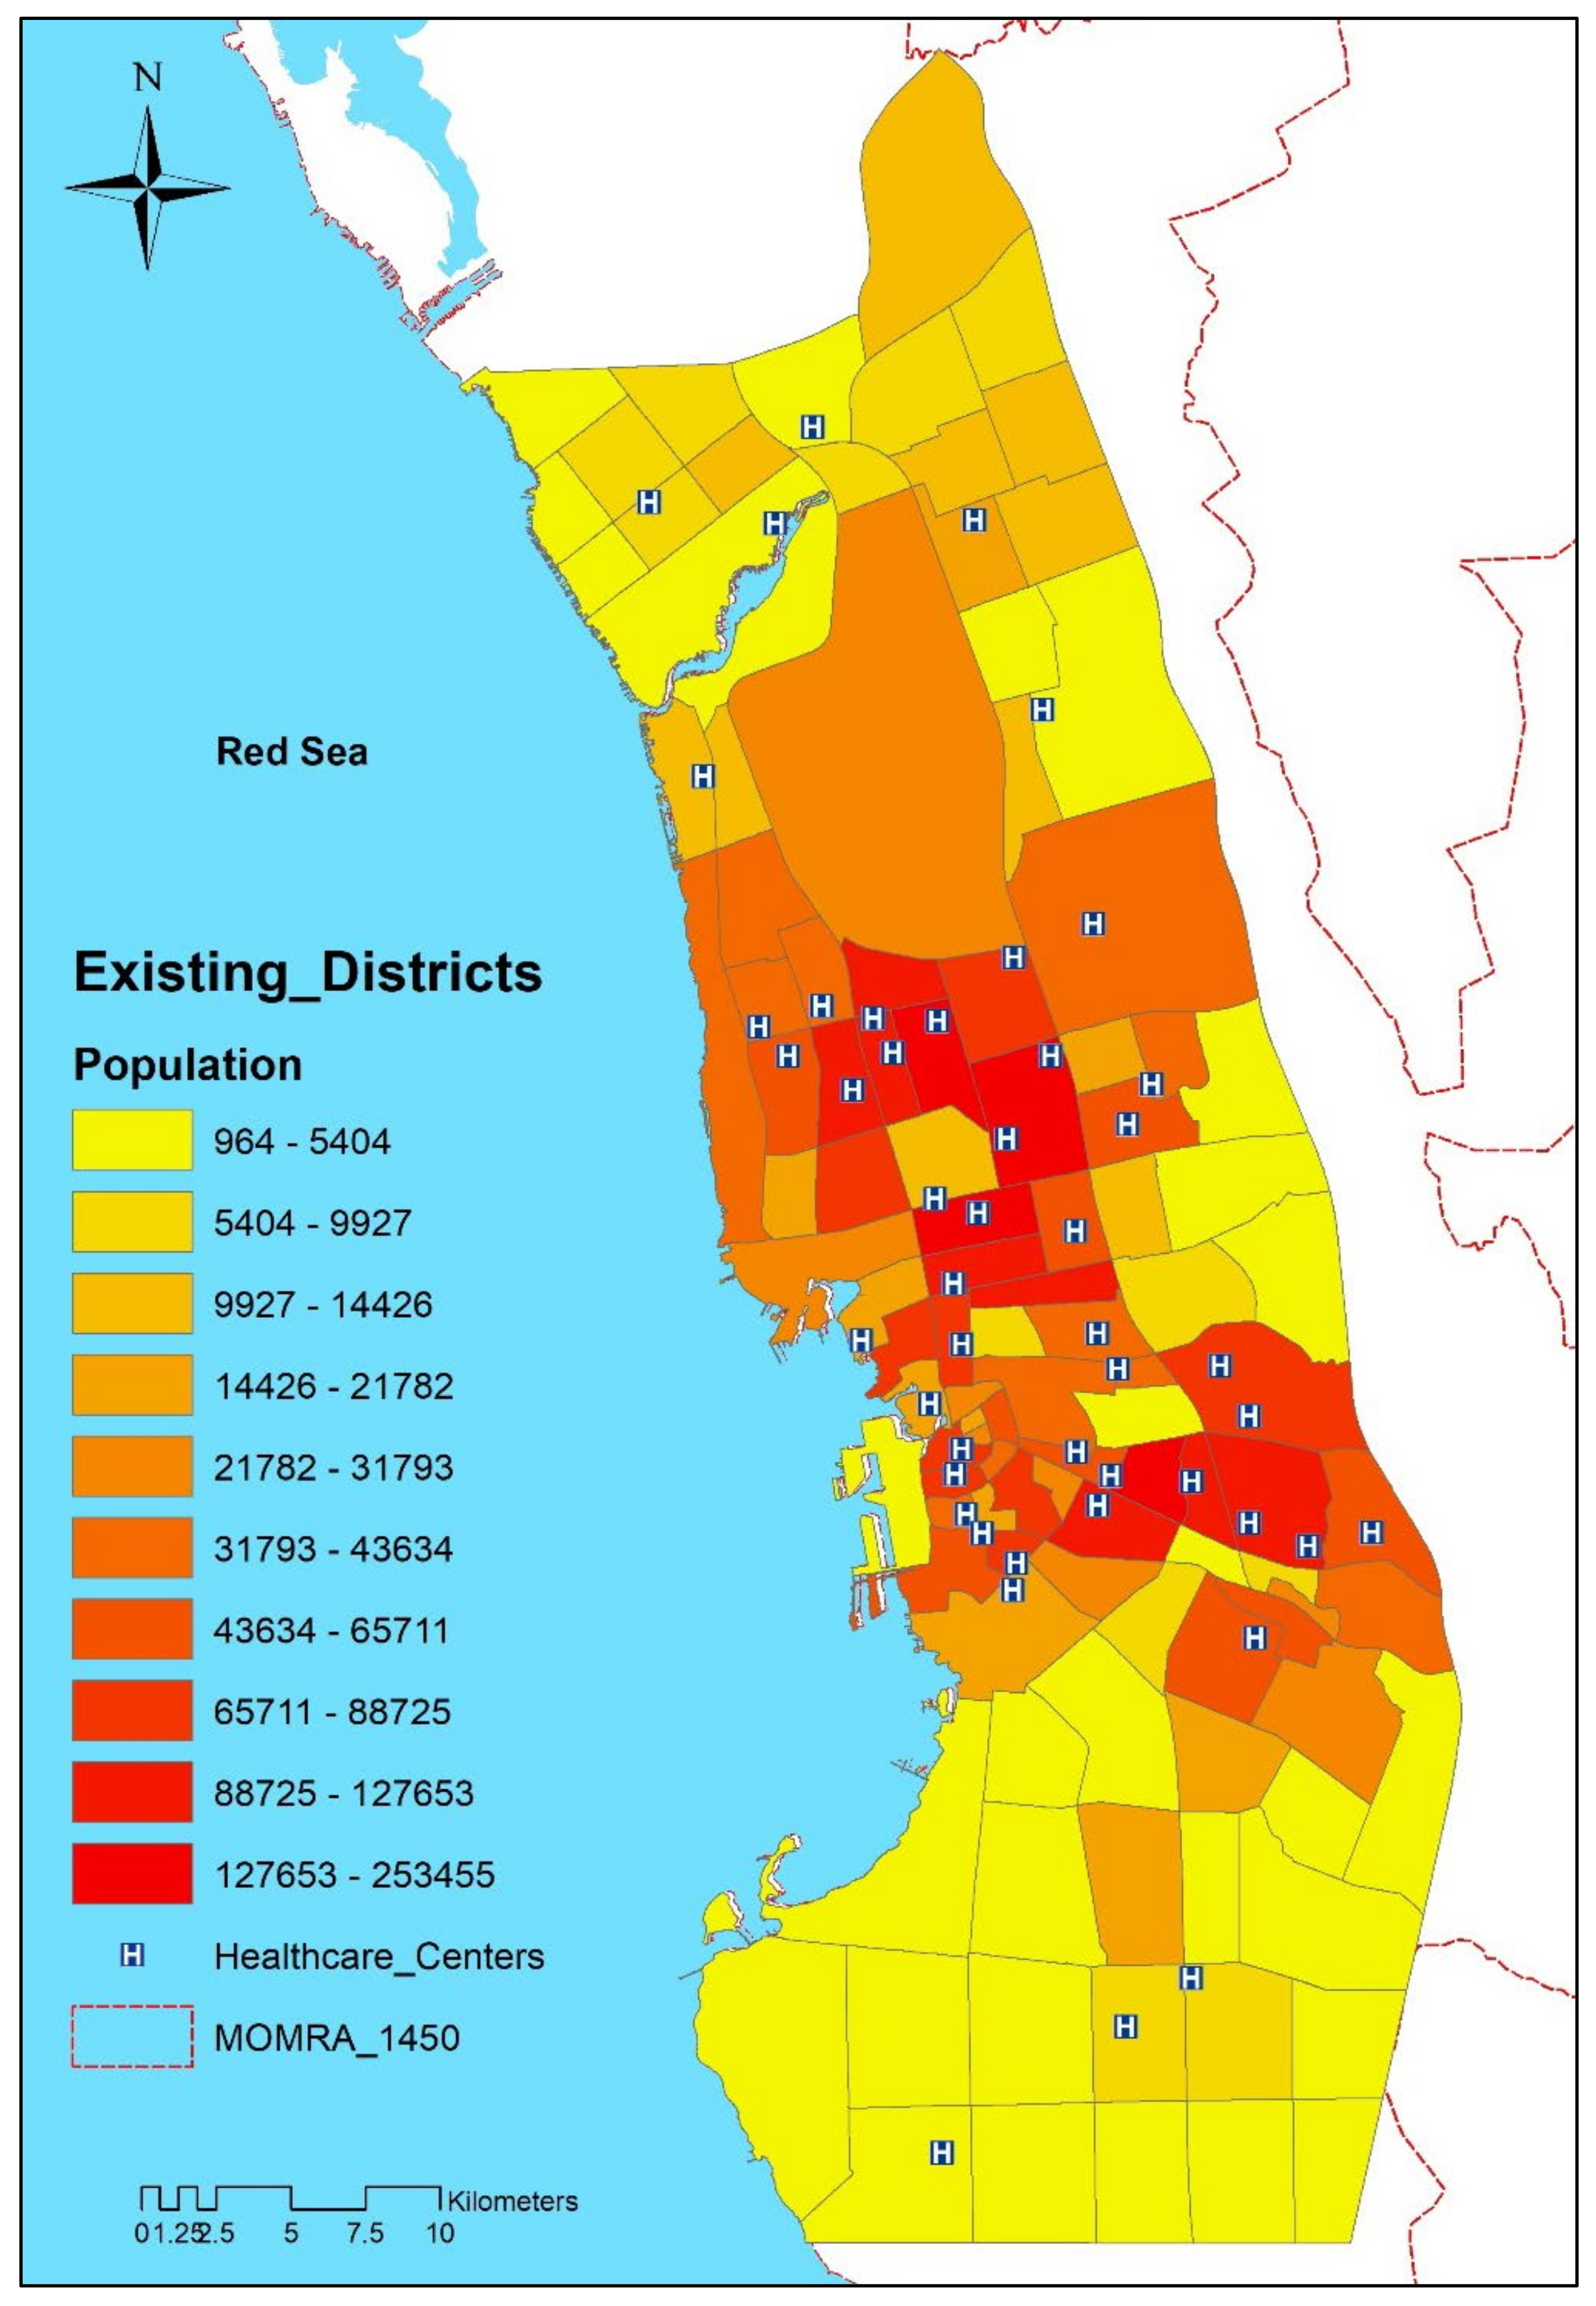
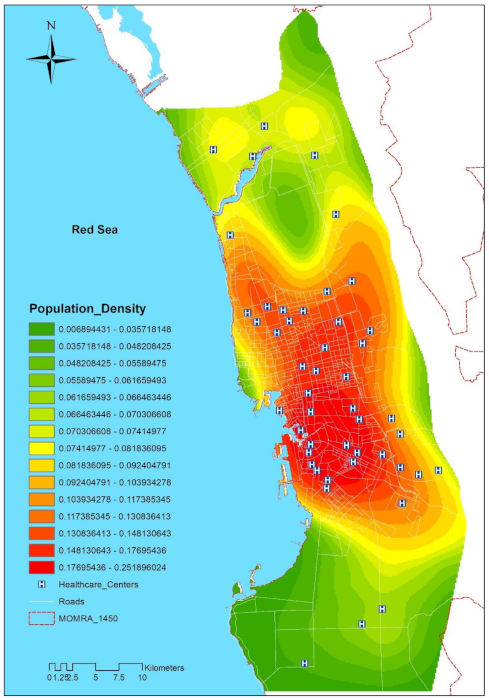
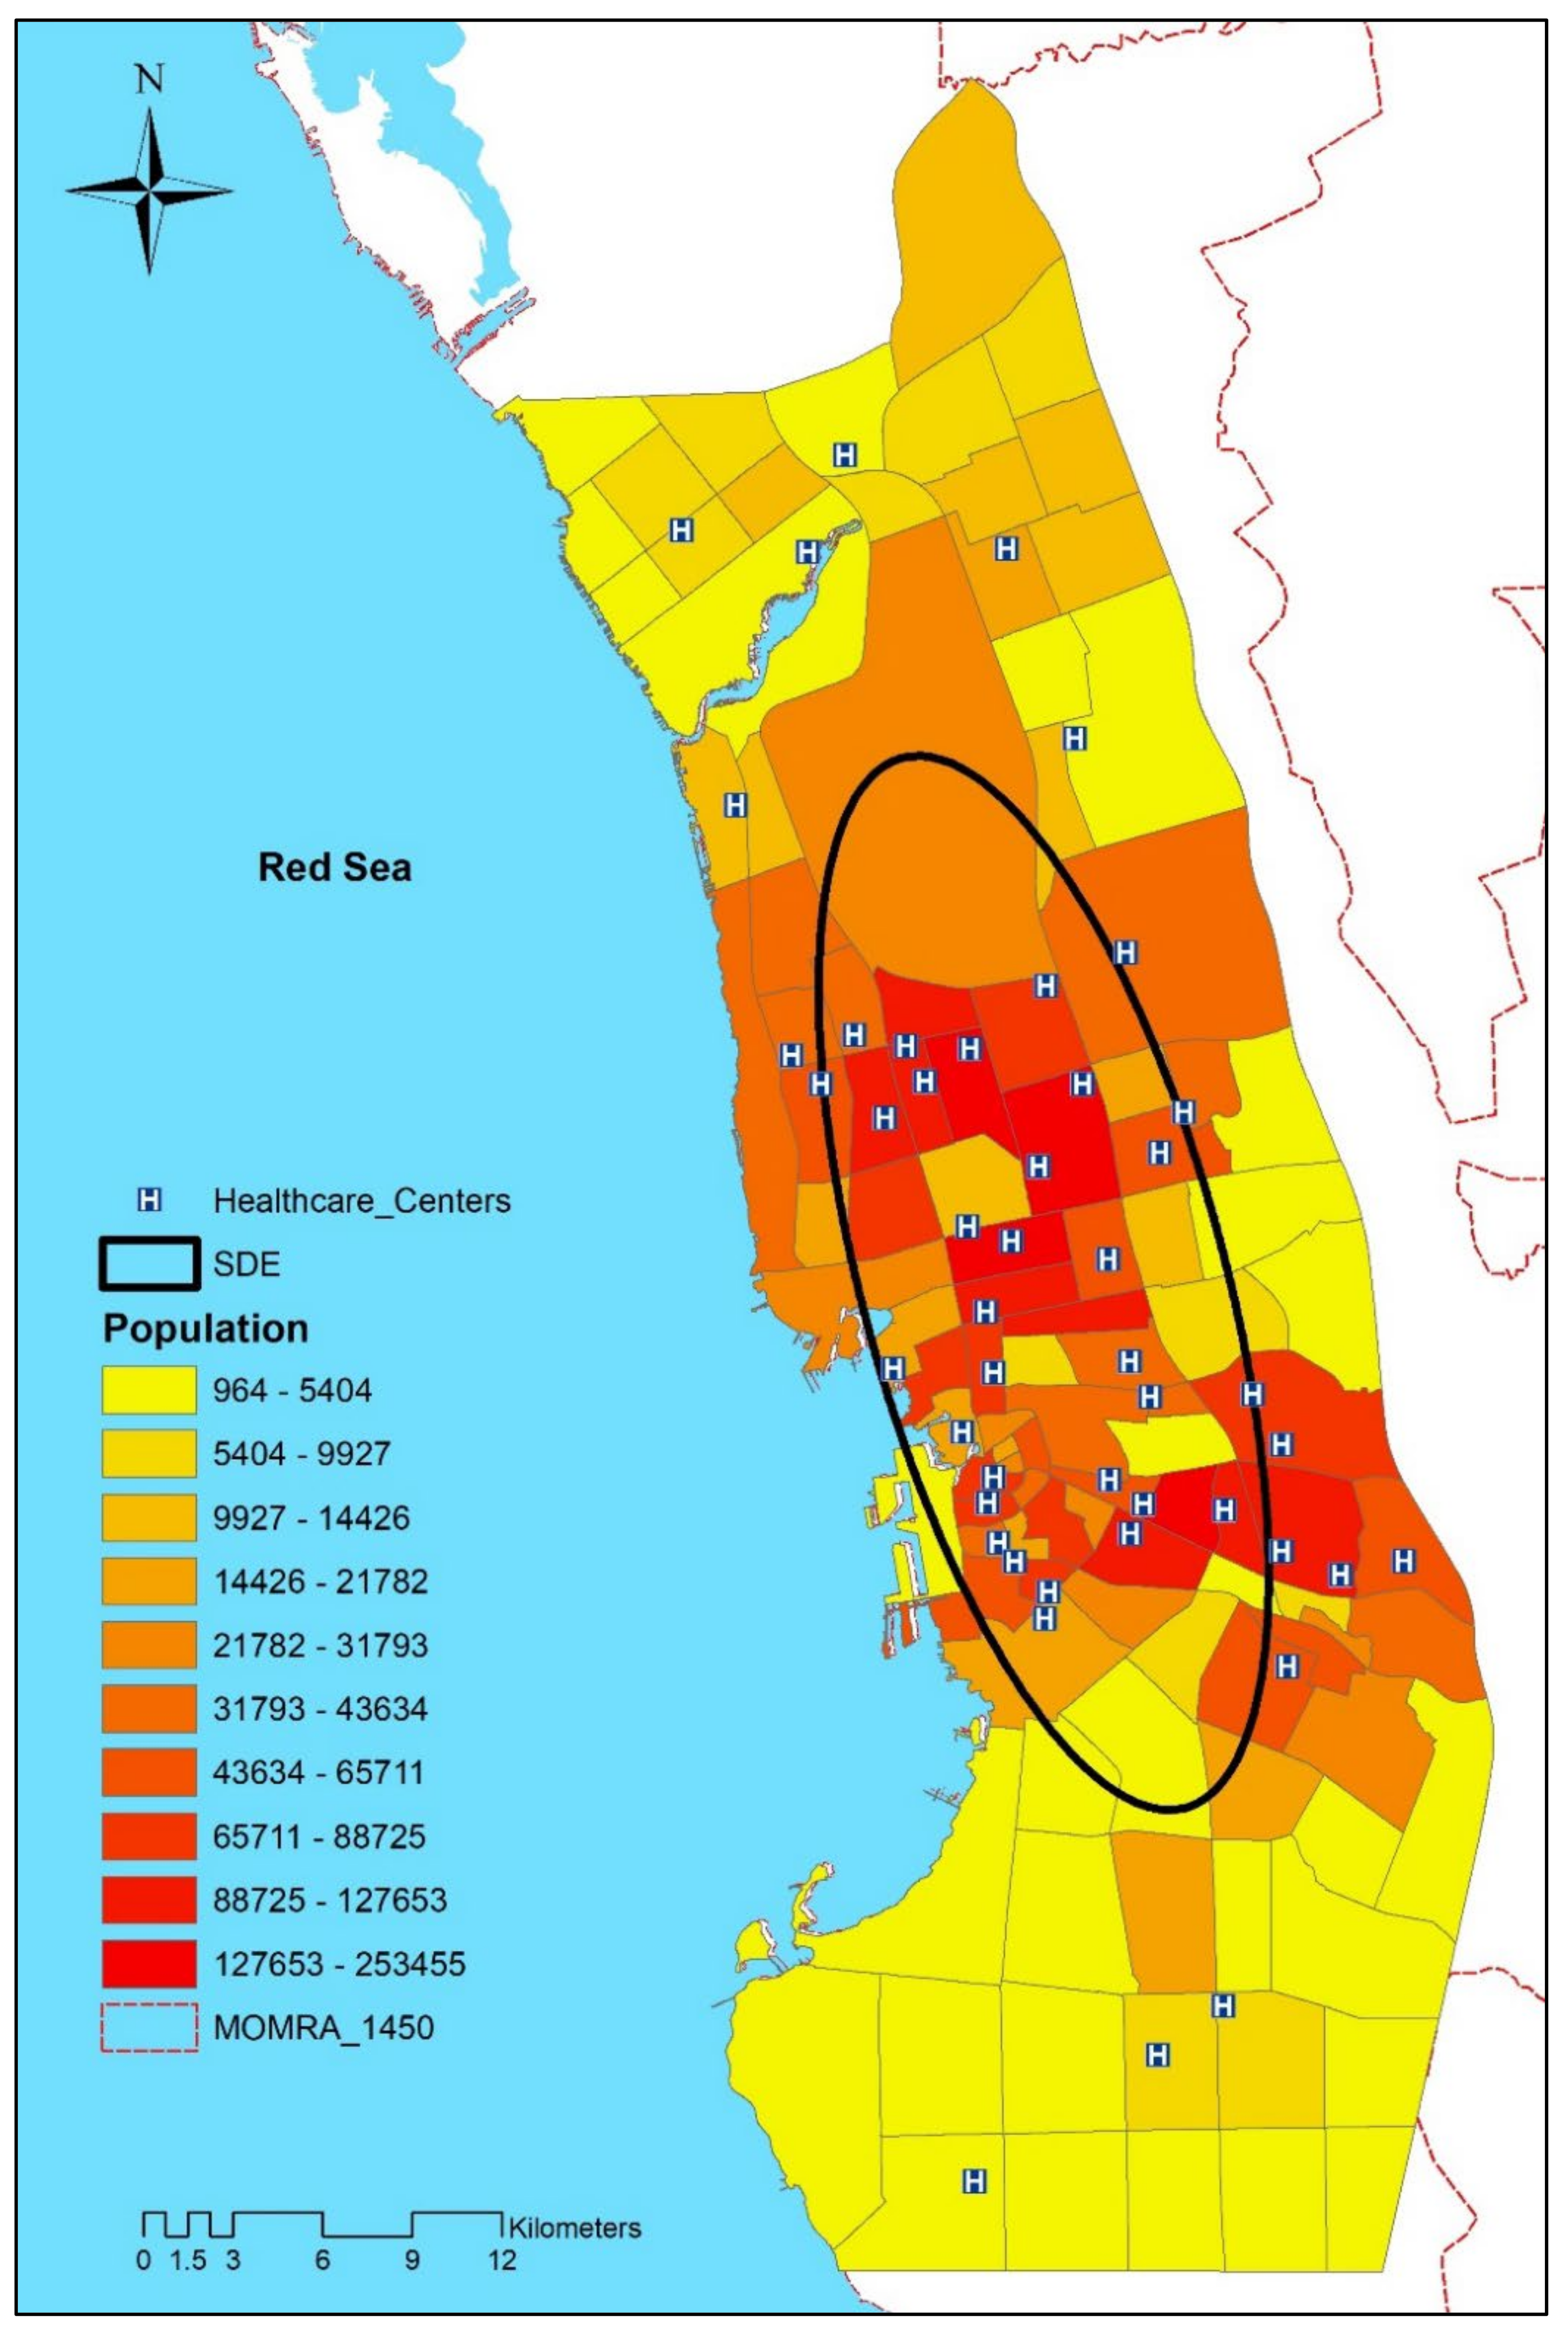
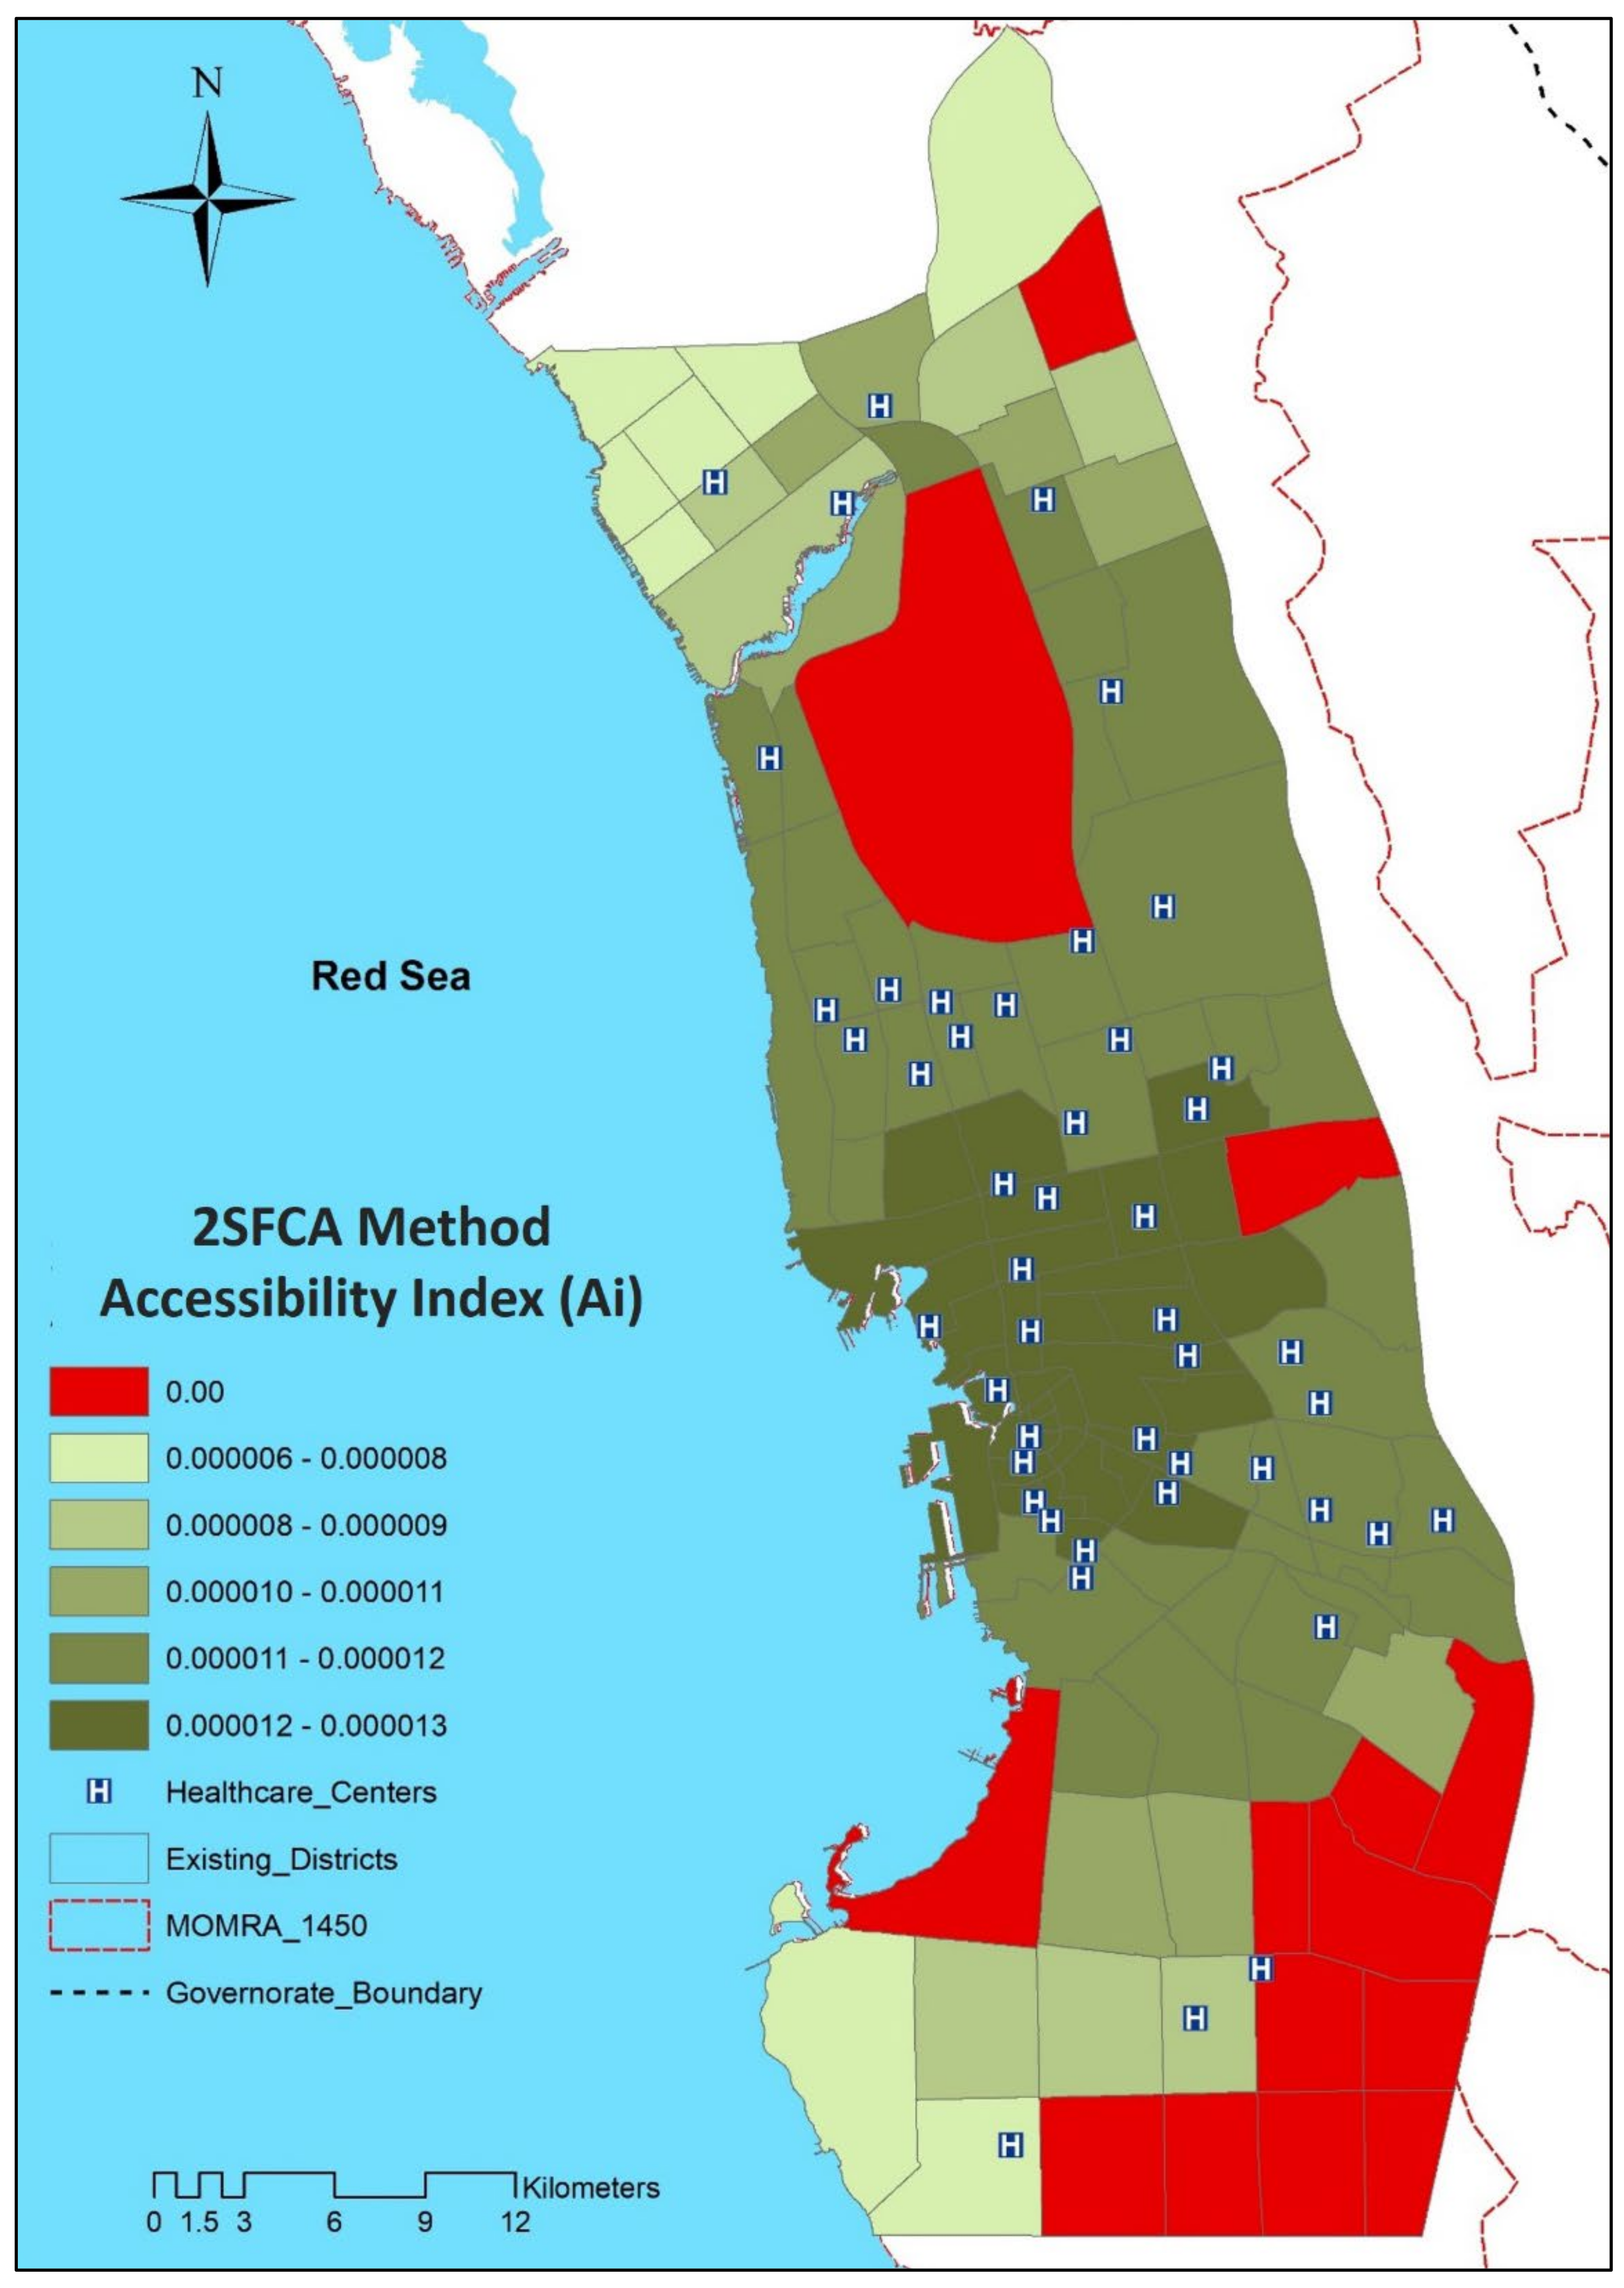
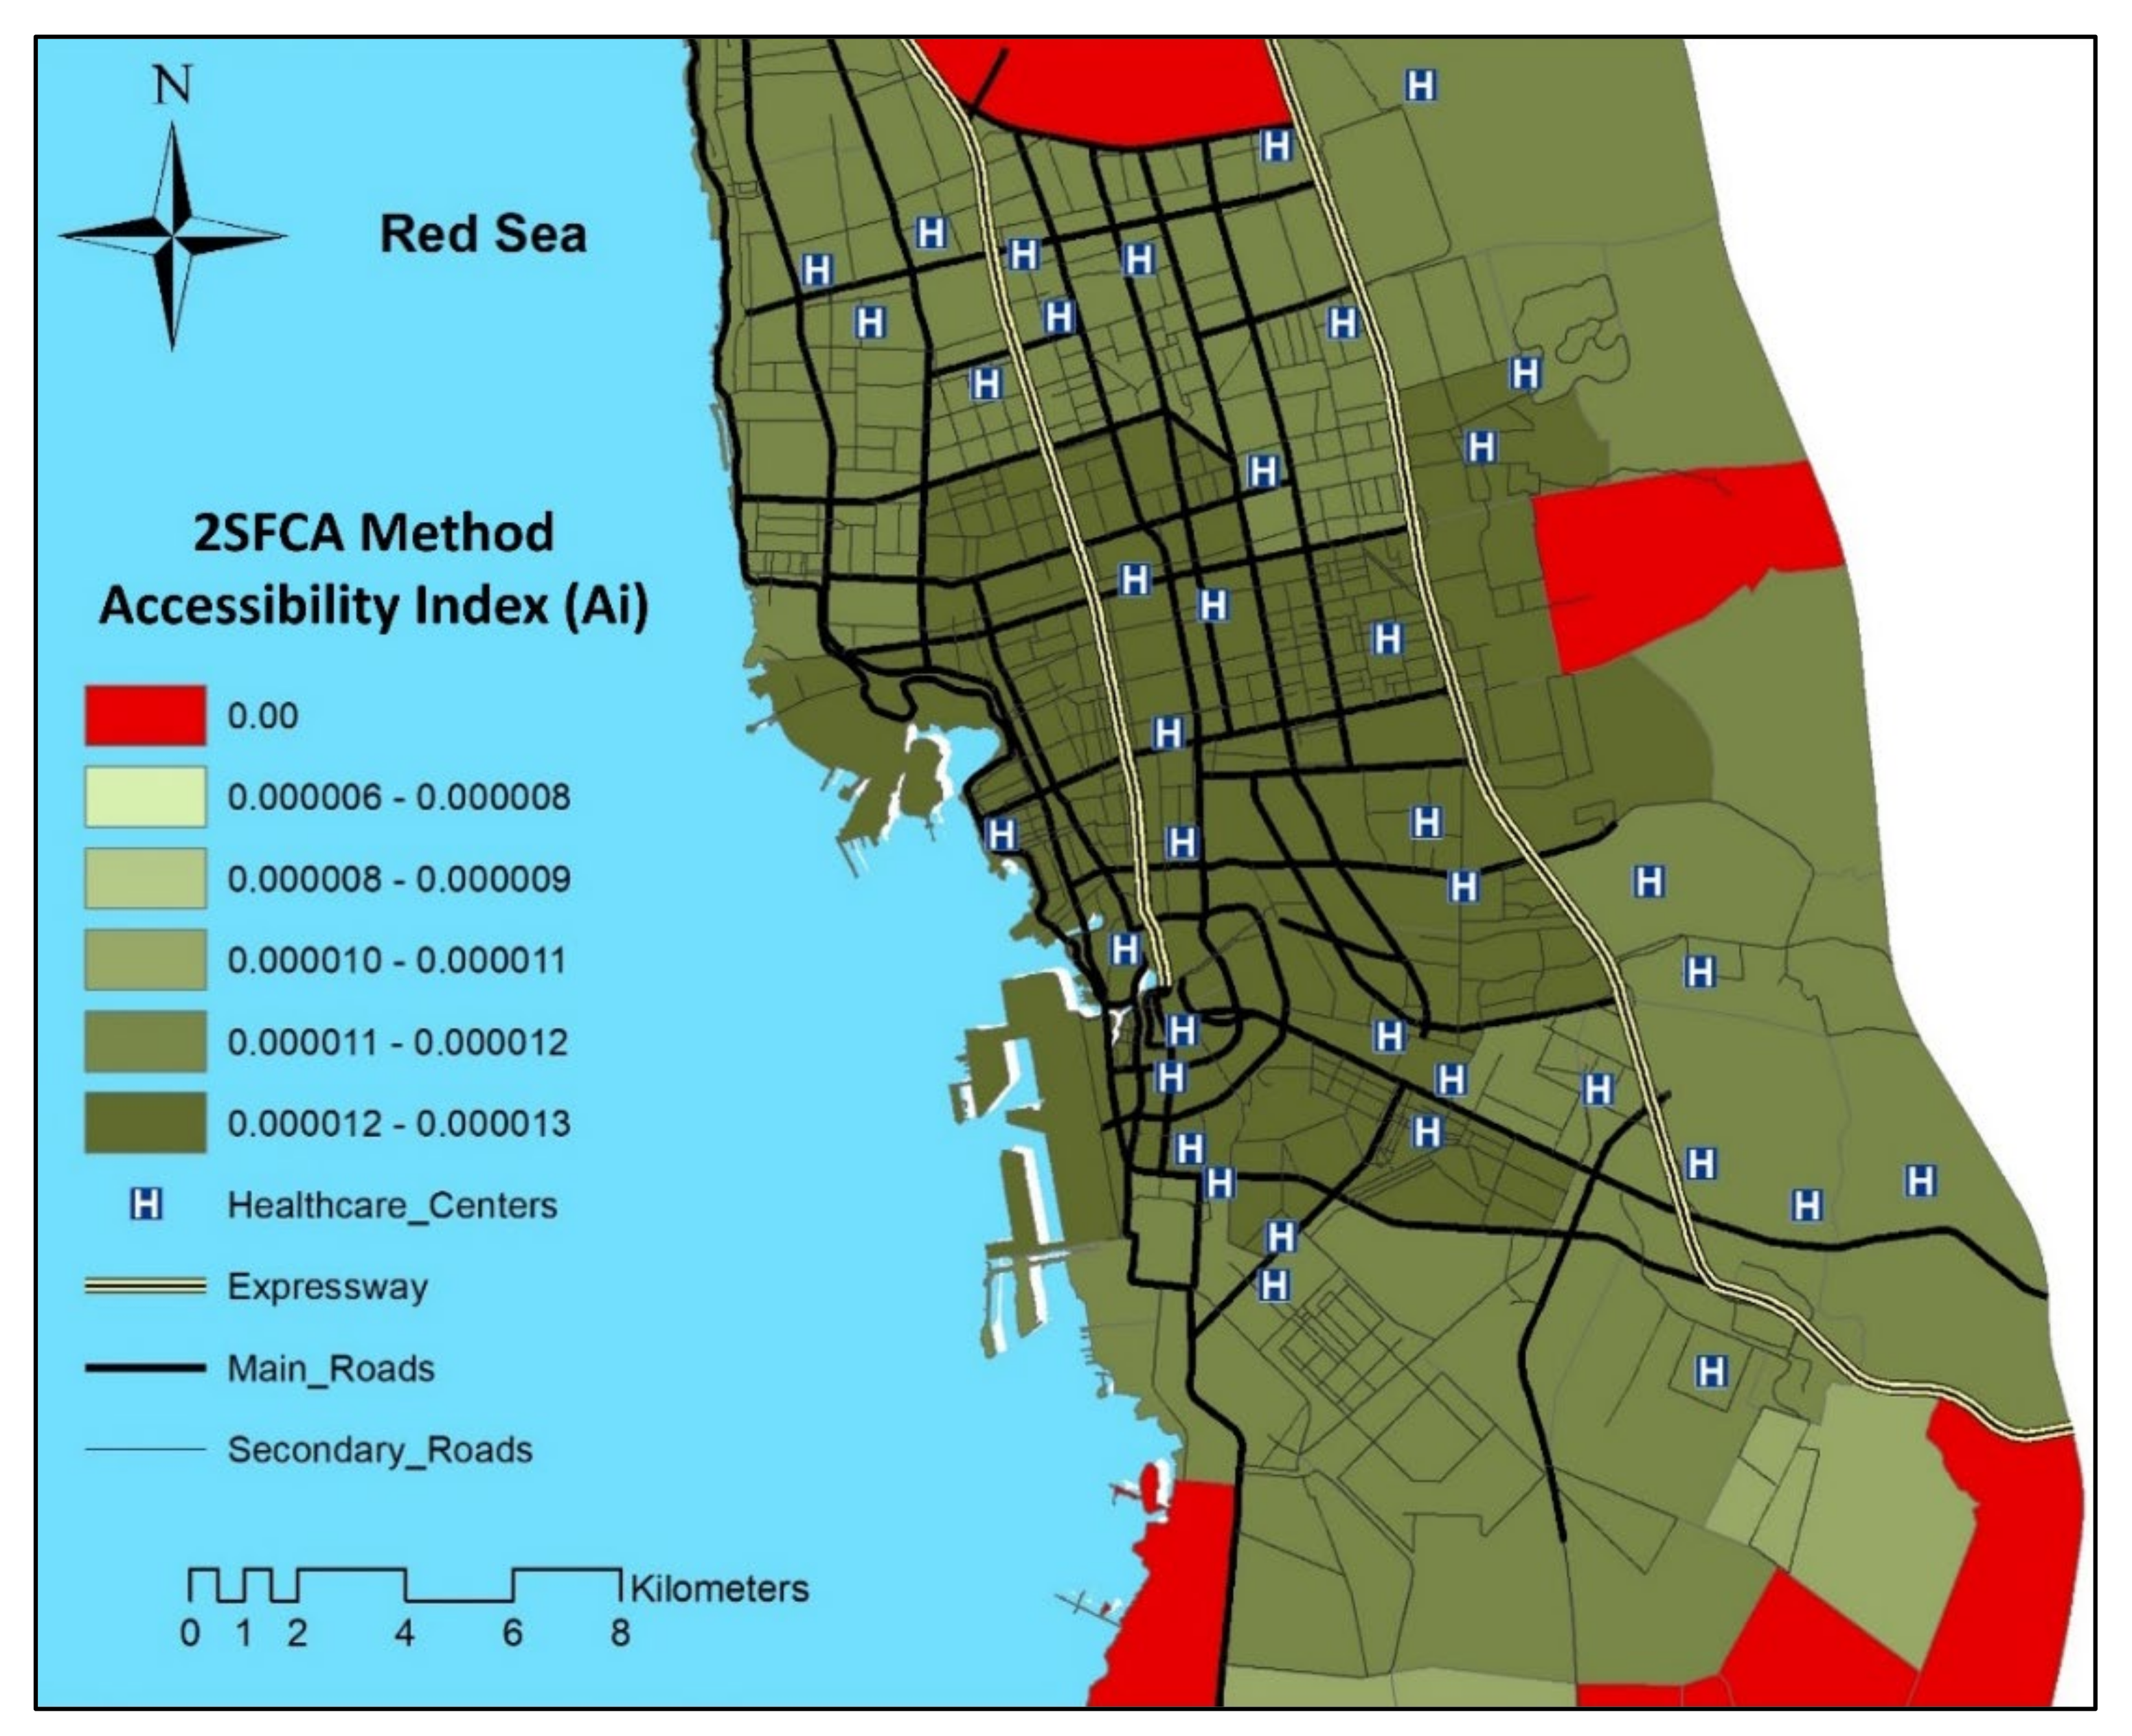
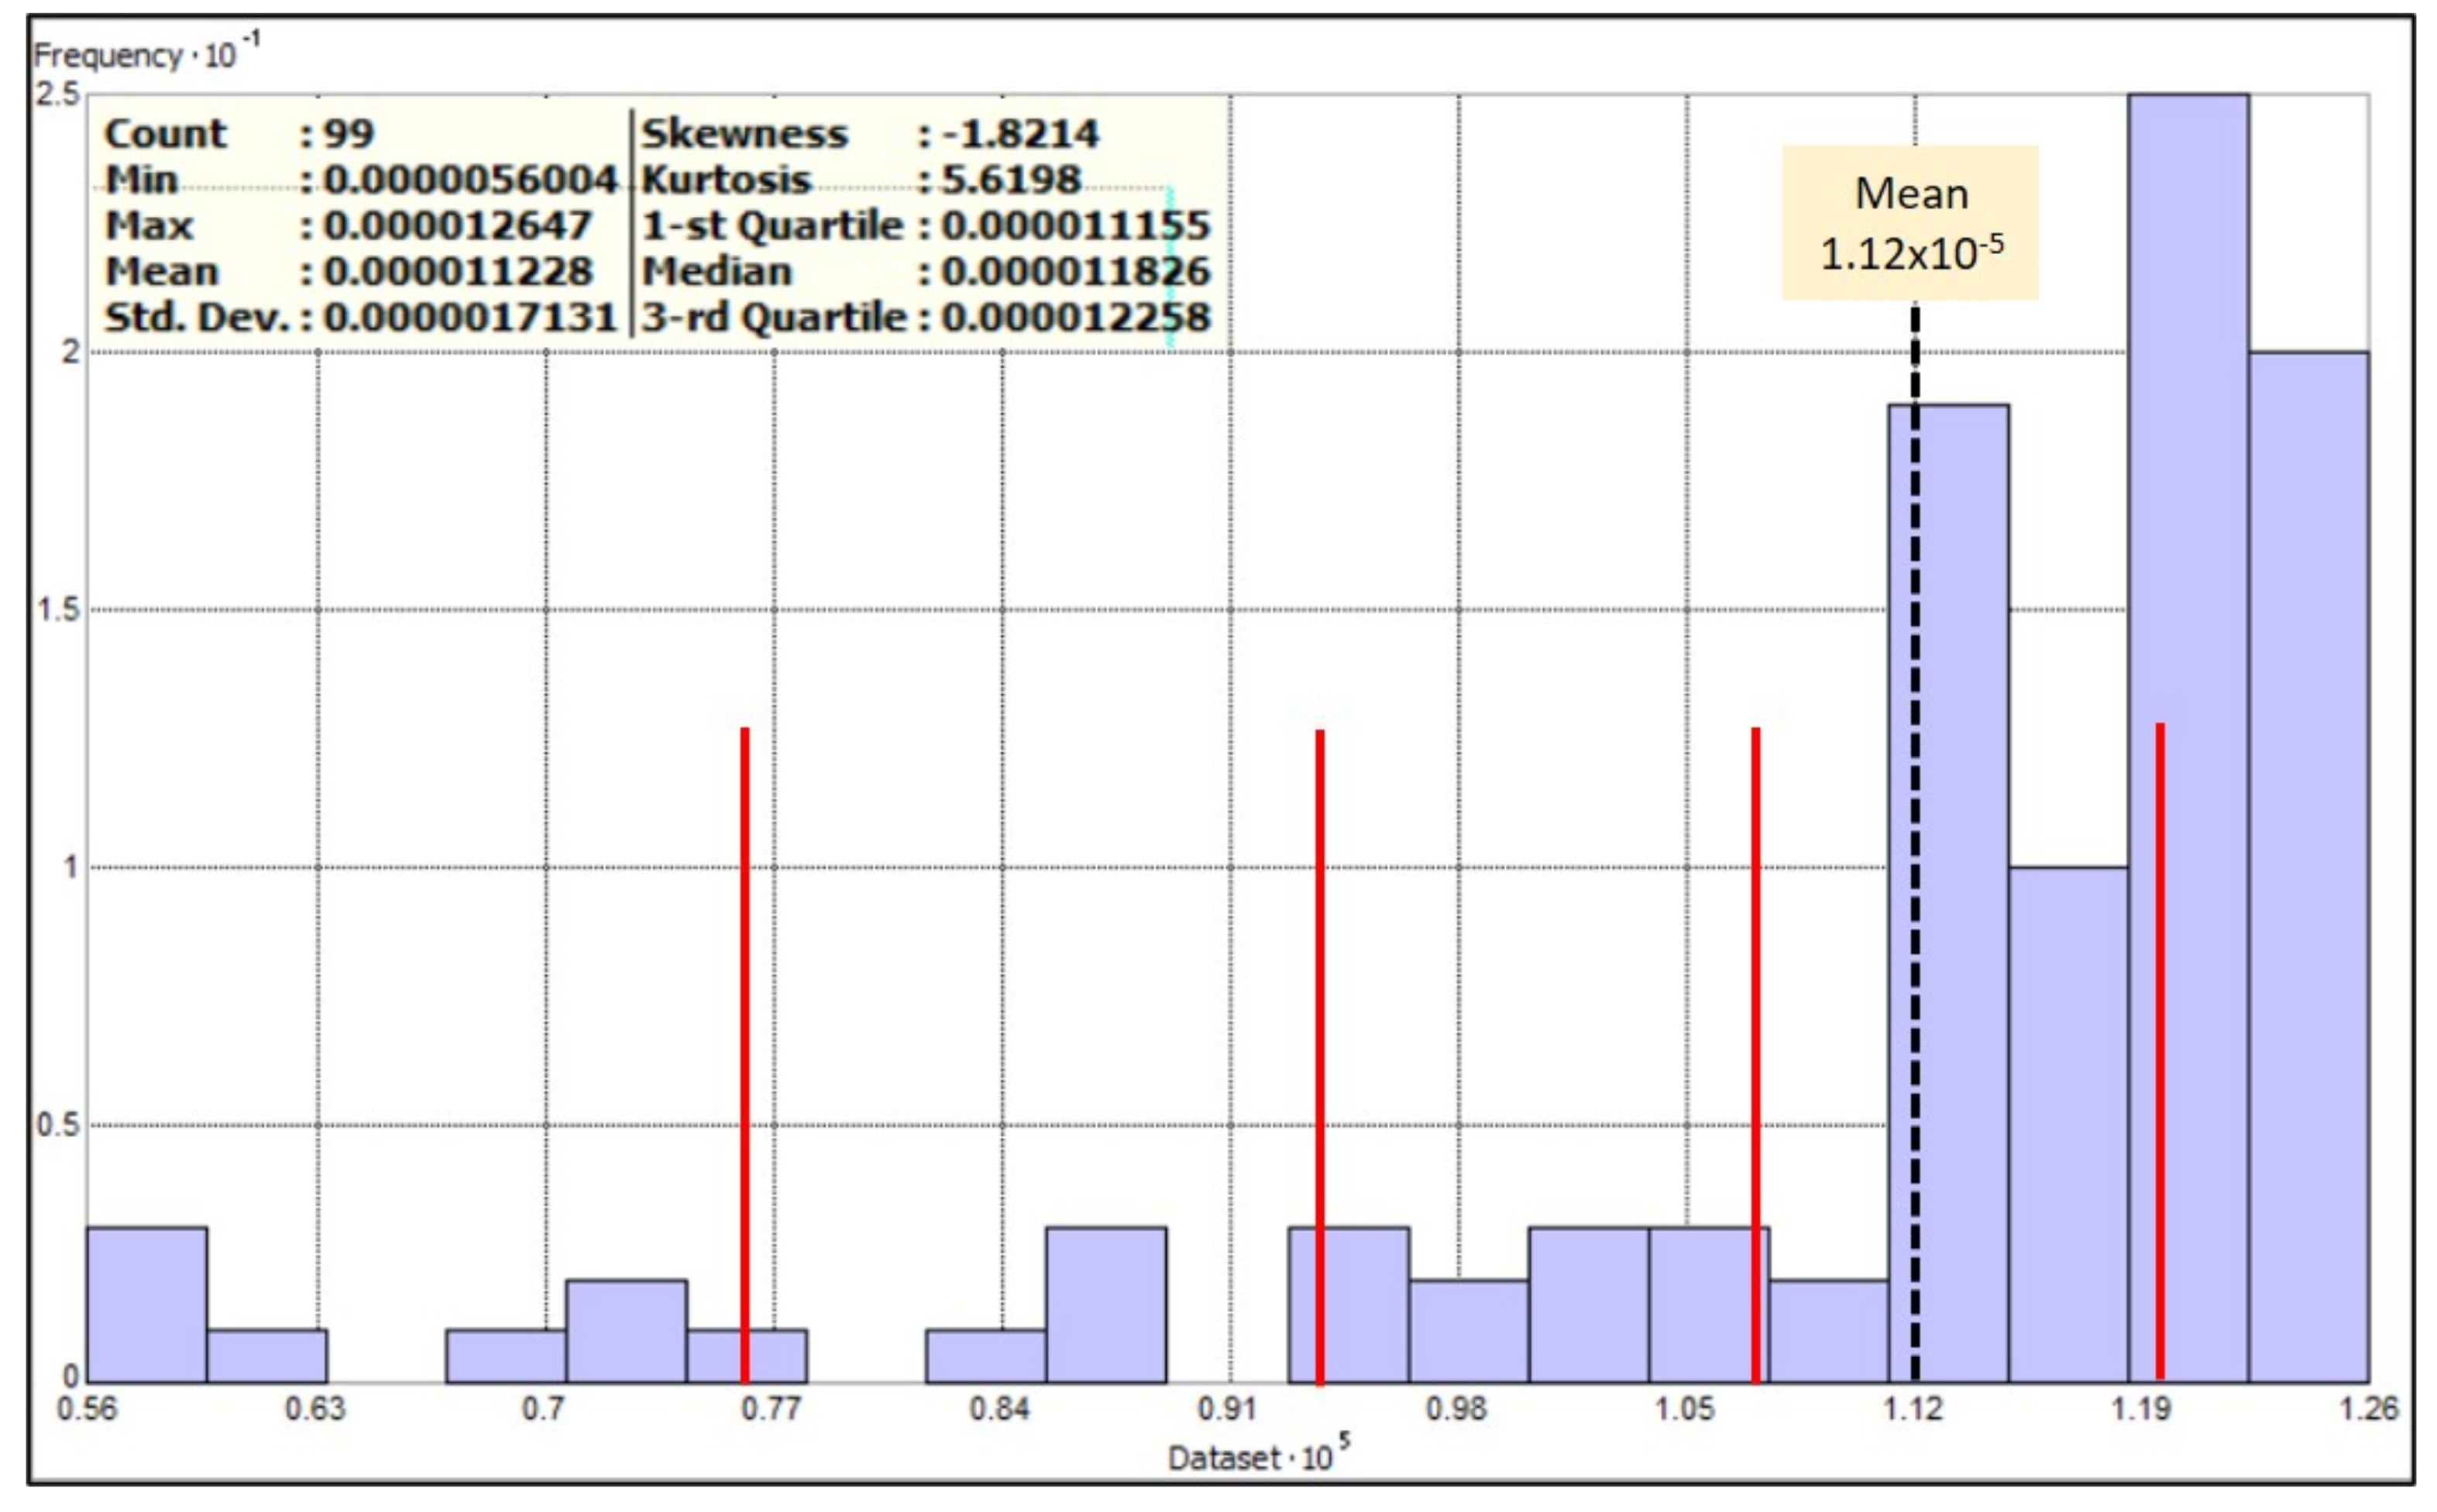
Table 1.
A summary of data requirements.
| Dataset | Data Type | Description | Data Format |
|---|---|---|---|
| Population | Spatial | Urban district boundaries | Polygon |
| Attribute | Census data at the level of urban districts: numbers and density of population, etc. | Excel table | |
| MOH healthcare centers | Spatial | Locations of healthcare centers | Point |
| Attribute | Name and location address, etc. | Excel table | |
| Road network | Spatial | Road centerline | Line |
| Attribute | Road ID, name, type, length, and speed limit of roads, etc. | Excel table |
Table 2.
Districts and population with spatial accessibility using 2SFCA.
| Statement | Total | (%) of Total |
|---|---|---|
| Districts with accessibility | 99 | 87.61% |
| Districts without accessibility | 14 | 12.39% |
| Population with accessibility | 3,941,169 | 97.51% |
| Population without accessibility | 100,715 | 2.49% |
| Area with accessibility (km2) | 949.55 | 75.74% |
| Area without accessibility (km2) | 303.71 | 24.22% |
Publisher’s Note: MDPI stays neutral with regard to jurisdictional claims in published maps and institutional affiliations. |
© 2021 by the authors. Licensee MDPI, Basel, Switzerland. This article is an open access article distributed under the terms and conditions of the Creative Commons Attribution (CC BY) license (https://creativecommons.org/licenses/by/4.0/).
Share and Cite
MDPI and ACS Style
Khashoggi, B.F.; Murad, A. Use of 2SFCA Method to Identify and Analyze Spatial Access Disparities to Healthcare in Jeddah, Saudi Arabia. Appl. Sci. 2021, 11, 9537. https://0-doi-org.brum.beds.ac.uk/10.3390/app11209537
AMA Style
Khashoggi BF, Murad A. Use of 2SFCA Method to Identify and Analyze Spatial Access Disparities to Healthcare in Jeddah, Saudi Arabia. Applied Sciences. 2021; 11(20):9537. https://0-doi-org.brum.beds.ac.uk/10.3390/app11209537
Chicago/Turabian StyleKhashoggi, Bandar Fuad, and Abdulkader Murad. 2021. "Use of 2SFCA Method to Identify and Analyze Spatial Access Disparities to Healthcare in Jeddah, Saudi Arabia" Applied Sciences 11, no. 20: 9537. https://0-doi-org.brum.beds.ac.uk/10.3390/app11209537
Note that from the first issue of 2016, this journal uses article numbers instead of page numbers. See further details here.