Article

Smart Grid Data Management in a Heterogeneous Environment with a Hybrid Load Forecasting Model

by
Ammar Albayati
1,*,
Nor Fadzilah Abdullah
1,*,
Asma Abu-Samah
1,
Ammar Hussein Mutlag
2 and
Rosdiadee Nordin
1
1
Faculty of Engineering & Built Environment, Universiti Kebangsaan Malaysia, Bangi 43600, Malaysia
2
Faculty of Electrical Engineering, Middle Technical University, Baghdad 10001, Iraq
*
Authors to whom correspondence should be addressed.
Submission received: 11 August 2021 / Revised: 1 October 2021 / Accepted: 12 October 2021 / Published: 15 October 2021

Abstract

:
The power consumption model can be represented in multiple dimensions, and it is proliferating to include structured and unstructured data. Dealing with such heterogeneous data and analyzing it in real-time is an ongoing challenge in the energy sector. Moreover, converting these data into useful information remains an open research area. This study focuses on modeling realistic and efficient power consumption data management in the heterogeneous environment for the Iraq energy sector and suggested a novel hybrid load forecasting model. The proposed system is named the Power Consumption Information and Analytics System (PIAS), which can perform various roles such as data acquisition from mechanical and smart meters, data federation, data management, data visualization, data analysis, and load forecasting. The proposed system has a four-tier framework (Data, Analytics, Application, and Presentation). Each layer is discussed in detail in this study to overcome the anticipated challenges. Furthermore, this study discusses the proposed system by applying two case studies. The first case study discusses power consumption data management, while the second introduces a novel hybrid load forecasting model using Fuzzy C-Means clustering, Auto Regressive Integrated Moving Average (ARIMA), and Gradient Boosted Tree Learner. The dataset used in this forecasting is based on a 1-year duration dated 1 January 2019 to 31 December 2019, on an hourly basis (365 * 24) for the Baghdad governorate. The results showed high accuracy in load forecasting with improved error rates (MAPE, MAE, and RMSE) achievements in comparison with other evaluated models such as standalone ARIMA and Gradient Boosted Trees methods.

1. Introduction

Modern technology in the energy sector is currently on the rise with the emergence of digital twin, smart grid, Internet of Things, big data analytics, machine learning, and artificial intelligence. These technologies have enabled the efficient utilization and management of resources and effective monitoring and control of the energy sector. However, substantial work needs to be conducted for developing countries to adopt these technologies in their energy sector. Due to various constraints on the economy and infrastructure, it is difficult for developing countries to efficiently manage the generation and distribution of power. Big data analytics is an emerging concept that aims to solve several problems currently faced in the world [1]. As the name suggests, big data can be defined as a huge dataset with great variety and is growing fast. It can be characterized based on the 7 Vs: Volume, Velocity, Variety, Variability, Veracity, Visualization, and Value. [2]. Big data analytics has the potential to accurately identify trends and concepts related to human behavior and the environment. Big data can be retrieved from various sources such as local databases and social media platforms, where an enormous amount of data is available for analysis or solving problems, such as the energy sector usage, and specifically to solve the energy crisis [3]. Energy’s big data defines the system of big data technology applied to the energy sector. Additionally, energy’s big data has made an immense contribution in managing huge datasets containing information about energy consumption patterns, energy demand, etc., enabling the sector to bridge the demand and supply gap [4]. Different data types, such as operational data, line data, transformer data, and load data can be collected and used together to enable the entire grid system to act intelligently. Stored data can be used to predict customer profiling, automatic demand response, efficient energy planning, and adequate pricing to enable reduced losses and conserve more energy.
Big data analytics have been incorporated with smart grids to improve power distribution efficiency while optimizing energy consumption [5]. It can be divided into three mains stages: data collection, communication, and pre-processing. Data collection can be conducted using smart devices integrated into the grid, i.e., sensors, Phasor Measurement Units (PMU), smart meters, etc. [6]. The collected data are then communicated via different wireless and wired communication technologies such as Power Line Communication (PLC), WiFi, etc. [7]. The data also require a pre-processing procedure to sort, clean, and transform them into an asset for efficient use. Big data analytics can also help detect faults through an automated system that is usually impossible in conventional systems.
Moreover, it can also facilitate real-time monitoring of all the consumers, hence obtaining accurate data related to power consumption patterns and eventually performing load profiling and forecasting accordingly [8]. All these features result in optimizing power consumption while reducing the demand–supply fluctuations. Power consumption has become one of the most significant concerns of developing countries, especially after the energy crises that occurred during the 1970s [9]. Considering the situation, countries worldwide are continually striving to make all possible efforts to track and optimize their power consumption. In this situation, Machine Learning (ML) and Artificial Intelligence (AI) approaches have been the biggest breakthrough that facilitate modeling, predicting, and designing an energy system that eventually optimizes power consumption. It has been established that ML and AI can be integrated into energy systems (primarily grids), where they can act smartly to reduce energy losses, improve efficiency, and collect real-time data [10]. AI can be integrated into different electrical grid units, such as generation, distribution, and consumption, to collect data that are later used to make automated decisions without human support [11]. While highlighting the significance of ML, Salam and El Hibaoui [12] stated that forecasting power consumption is one of the essential tasks that offer intelligence to utilities and facilitates them in bringing improvements to the system’s performance. All these tasks are only possible through the implementation of ML. Based on this evidence, it can be affirmed that ML has a great role in optimizing power consumption, specifically through forecasting. However, AI technology facilitates solving different power system problems by forecasting, scheduling, planning, and controlling using the stored data. The selection of an appropriate algorithm is determined by several factors, including the nature of the data, homogeneity, and features. This paper proposes an effective power consumption data management system for a hybrid mechanical and smart meter environment, using the Iraqi energy sector as a case study. The proposed system, abbreviated as PIAS, offers an effective methodology for data gathering and pre-processing. It will create an efficient database that can perform different types of functionalities. It also includes data analytic capability, which can increase productivity and data control in the energy sector. The main contributions of this proposed system are highlighted as follows:
  • The Capability of Heterogeneous Data Acquisition and Data Federation
In developing countries such as Iraq, there is a state of instability and unpredictability due to a huge gap between reality (mechanical meters) and ambition (smart meters) in terms of shifting cost and time in addition to logistical difficulties. Additionally, data uncertainty results from decades of manual meter reading [13,14]. This situation continues to the time of this study, so embarking on any transformation process will take years, especially with 5 million subscribers that are constantly growing. The need to build an efficient system capable of dealing with the current situation (mechanical meters) and prospective (smart meters) has emerged. The literature evaluated suggested employing data mining approaches to integrate data from heterogeneous surroundings [15], while another researcher developed a tensor-based big data management scheme to reduce data divergence in datasets obtained from various meters [16]. Despite the fact that the majority of these researchers showed promising suggestions for data management in heterogeneous environments, they assumed the existence of a set of physical databases or datasets without suggestions on how the data coming from the mechanical meters can be processed. The suggested PIAS system in current research is designed to address this challenge, where it acts as a data collector or data acquisition point in such heterogeneous environments. The system is designed to handle data from various sources, such as offline data (sources mechanical meters) and real-time data (smart meters) through API Gateway; moreover, the proposed PIAS is designed to offer multi-structured data in a unified database scheme. The federation of data obtained from different structures can enhance the proposed scheme and unstructured data, which are heterogeneous. This type of federation can be used to create correlations and dependencies among variables that allow the data to become dynamic visualization, informative, and comprehensible.
  • A Hybrid Load Forecasting Model (Clustering, Historical Data, and External Factors)
The literature that has been reviewed suggested a hybrid load forecasting model by applying historical data analytics and/or clustering such as Nepal et al., Japan [17] and Sulandari et al., Indonesia [18], or historical data with/without combination with external factors such weather conditions, such as He, F. et al., China [3] and S. Karthika et al., India [19]. Our research proposes a novel hybrid load forecasting model combining fuzzy C-means for data clustering and auto-regressive integrated moving average (ARI‘MA) for historical load data analytics. Additionally, the system is complemented with Gradient Boosted Tree Learner external factors weather conditions analytics. The suggested PIAS system database is integrated with the Knime analytics platform [20]. The Knime platform can perform real-time analytics of high-volume data and predict power consumption through its many plugged-in machine learning and artificial intelligence algorithms, depending on users’ specific purposes. As a result, the system can enhance the load forecasting modeling, and this will contribute positively to helping make the right determinations for the decision maker to save time and costs in the energy sector in Iraq.
The rest of the paper is structured as follows. Section 2 elaborates on Iraq’s energy sector as a case study and Section 3 discusses the most relevant related works. Section 4 explains the proposed PIAS throughout many sub-sections such as data, analytics, application, and presentation. Section 5 and Section 6 discuss the results obtained through two case studies. Finally, Section 7 concludes the paper.

2. Problem Statement: A Case Study for Energy Sector in Iraq

The energy crisis is one of the world’s major problems, and the case is ultimately worse for developing countries such as Iraq that do not have efficient and advanced energy systems. For the Iraq case study, the energy sector’s challenges can be divided into direct and indirect factors.

2.1. Direct Factors

Infrastructure is considered one of the most critical factors for any energy sector’s success [3]. Despite this knowledge, developing countries often suffer from backwardness in this aspect. Specifically, in Iraq, energy infrastructure is not in a very good condition based on the many conducted field visits, views, and discussions. This is due to the lack of funds and unstable political conditions. According to the Iraqi Ministry of Energy, Iraq has about 5 million registered subscribers in the distribution sector. Around 95% of them are managed by the ministry using mechanical meters, while the remaining 5% are handled by other private companies using electronic or smart meters. To handle this large number of power consumption subscribers and reading values from a huge number of mechanical meters, the main issue is mandatory physical or manual reading. This is a big challenge, especially with the limited human resources and the digital transformation requirement for these manual readings. [13]. The Iraqi ministry of electricity lacks an efficient system to satisfy their actual needs. Therefore, a gap between the demand in the distribution sector and resource allocation in the generation sector also exists [14].
Moreover, the number of subscribers is bound to increase dramatically. In the case of Iraq, there are many unregistered subscribers in the distribution sector. Hence, the power consumption demand in Iraq will increase exponentially, further widening the energy production and consumption gap. As a result, the Iraqi ministry has an ambitious plan to transform the current mechanical meters’ data extraction by incorporating smart meters and a smart grid into their architecture.

2.2. Indirect Factors

Iraq has an unbalanced supply and demand for energy. The uncertain political situation and the impact of wars have severely affected the energy sector. Iraq has the second-largest oil reserves, unfortunately, they are not managed efficiently [13]. Iraq is in the rehabilitation stage after the civil war that had hit the country from 2014–2017. This war had caused severe damage to energy infrastructure, making it fall short in its energy supply. After Iraq was fully liberated in 2017, it had only one-fifth of its transmission system in operable condition, and 4.5 Gigawatt of generating capacity was damaged [14]. Currently, Iraq is revamping its power generating capacity and the transmission system, for which a significant investment is being made. The country is also working on its security mechanisms to ensure a safe oil supply to revamp its energy sector [13,14,15,16,17,18,19,20,21].
Furthermore, Iraq has an enormous potential to attract foreign investors in its energy and oil industry due to the large oil reserves. However, since 2003 Iraq has faced various wars that did not allow the country to grow according to its potential [13]. Therefore, there is a great need for an efficient energy system that considers all the above circumstances.

3. Related Works

A wide range of applications has been proposed or discussed over the past ten years. They have been categorized into three main types: namely application, approach, and area of interest. For application, examples are forecasting, predictions, clustering, control, data management, and monitoring, big data analytics, and other applications. The approach includes time-series, regression, descriptive statistics, neural networks, decisions tree, and many hybrid machine learning approaches) [22]. Meanwhile, for the area of interest, some examples are generation, transmission, distribution and consumption, and the trading sector. Additionally, another emerging classification is based on the scope of the network that these applications can operate in, such as Home Area Networks (HANs), Neighbor Area Networks (NANs), and Wide Area Networks (WANs) [23]. This wide and varied vision horizon leads to the emergence of applications in different fields that may share some general characteristics, but each case can be considered unique due to the diversity and the difference of data types or the purpose for which it is created. In this context, many studies have contributed to the discussion of the challenges facing energy sectors. In this section, we focused on the most related works to our case study. It is divided into two main categories: (i) existing and potential applications in power consumption for both data management and load forecasting and (ii) challenges of applications in power consumption.

3.1. Existing and Potential Applications in Power Consumption for Data Management

Big data analytics techniques are becoming a norm globally, especially in the developed countries. Therefore, power systems applications were introduced for various purposes in the energy sector. Power systems have become increasingly efficient since the concept of machine learning is integrated with power consumption. Moreover, the increased reliance on advanced infrastructure such as Smart Grid (SG) leads to the increasing number and quality of power applications, which work collaboratively to make power consumption more efficient [24]. Typically, SGs consist of smart devices like smart meters, sensors, two-way communication channels, and advanced control systems that enable effective power management. These SGs have brought substantial advantages for the suppliers and consumers as it enables them to predict the cost of energy, load, and demand [24,25]. Furthermore, smart meters in SG are integrated with multiple sensors to track power usage data and e-pricing details to the electricity company and conserve energy by monitoring their real-time usage. This saves a substantial amount of money for the consumers and lessens the electricity suppliers’ burden, who work tirelessly to bridge the gap between energy supply and demand [26].
Additionally, the presence of a heterogeneous environment of smart and mechanical meters adds a lot of challenge to any data management proposed system. Juan I. Guerrero et al. [15] proposed an efficient system to integrate data into heterogeneous environments based on data mining techniques. While Sun, L. et al. [27], proposed a method to manipulate the growing smart grid data by treating it as outlier data (a data that differs exceptionally from other observations), then categorize them into outlier rejection and outlier mining groups based on data-driven analytics and data mining techniques.
Moreover, D. Kaur et al. [16] proposed a tensor-based big data management scheme to reduce the data divergence problem in the dataset generated from diverse meters. Likewise, Xia, H et al. [28] proposed a system that can extract good quality data from a large-scale heterogeneous database environment resulting from multiple data sources. This study suggests using edge computing infrastructure and a unified data representation model for data integration. In addition, Dhupia B. et al. [29] suggested using many other big data techniques and/or many other machine learning approaches for data integration purposes in heterogeneous environments. Although most of these studies presented a promising result in heterogeneous environments, they have only discussed the existence of a set of physical databases or datasets of smart meters with different data structures, and without addressing the handling of the data when a structural database is lacking such as when data are transferred or generated from mechanical meters. Therefore, a heterogeneous environment and diverse data without a digital transformation structure due to mechanical meters strongly motivate further study.

3.2. Existing and Potential Applications in Power Consumption for Load Forecasting

A variety of applications have significantly added various beneficial features to the smart grid, hence making the system more user-friendly [30]. By predicting the parameters, consumers and suppliers can adapt their behavior to keep power consumption efficient while avoiding losses. these applications have been implemented in various areas of power consumption that bring several benefits to consumers. One of the most famous implementations is the concept of smart homes that control all the electrical appliances to enable highly efficient consumption. It also connects these electrical appliances to various sensors from where data are collected and sent to the distributors, who can then use the data for predictive analysis [22,23,24,25,26,27,28,29,30]. Smart homes are becoming increasingly popular in developed countries because they provide a high level of automation in controlling electrical appliances while ensuring that energy is not wasted by unnecessarily turning on the appliances [31]. Moreover, smart homes also allow users to track their energy usage at any time to monitor and control their energy bills. Therefore, smart homes make power consumption very efficient while reducing energy costs [24,25,26,27,28,29,30,31,32]. These existing and potential applications are highly effective in solving some of the energy problems, but there is still a need for more research to handle the energy problems that are more prevalent in developing countries.
Moreover, many ML and AI algorithms have been used to develop forecasting applications, such as Auto Regressive Integrated Moving Average (ARIMA), Artificial Neural Networks (ANN), Linear Regression (LR), and Fuzzy Logic (FL) [33], while forecast techniques are a complementary part of designing and operating power systems and planning in the energy sector. The forecasting techniques can be classified into three main areas, namely long-term load forecasting (LTLF) for yearly observations, medium-term load forecasting (MTLF) for monthly observations, and short-term load forecasting (STLF) for daily or weekly observations. [30,31,32,33,34]. The suitable algorithms, techniques, and observed periods for load forecasting will fully depend on the forecast horizon type and the features of the data. In this study, we focused on STLF as it is more relevant to our collected dataset volume. In Japan [17], STLF is performed using a hybrid K-means clustering and ARIMA for load forecasting for one hour ahead; the results showed high accuracy in load forecasting with the proposed method. In Indonesia [18], a hybrid methodology using linear Recurrent Neural Networks (RNN) has been proposed for short-term forecasting to overcome the shortcomings of each method. Although hybrid algorithms can give good results, the accuracy was unclear in this study.
Aside from that, in China [3], another hybrid method with a decomposition-based quantile regression forest has been proposed, where the results show the proposed modeling can acquire the narrowest prediction intervals at various confidence values. Likewise, in India [19], a hybrid STLF using the ARIMA-SVM model has been proposed, where the results show an ideal situation, where the study was based not only on energy consumption data but also on external factors such as weather. Moreover, in the Russian Federation [35], many algorithms have been proposed, such as long short-term memory (LSTM), artificial neural networks (ANN), and support vector machine (SVM) regression for different periods. It was found that SVM regression gives 21% better accuracy in the power consumption forecasting problem, while in Argentina [36], a hybrid ARIMA and Regression Tree (RT) models have also been used for STLF, although this study relied on an interval-valued time-series dataset. The proposed models show good accuracy. The most related works are summarized in Table 1.

3.3. Challenges of Applications in Power Consumption

3.3.1. Energy Efficiency Monitoring and Management

Although smart grid and big data analytics can bring a great revolution to the energy sector, it has challenges and constraints that make its employability a complex endeavor. The most immediate constraint is the overhaul of the conventional infrastructure that would require a high cost [37]. Apart from this, the smart grid and big data analytics have other challenges to their application, owing to complex systems [38]. Smart grids use various smart components that work together to form a system. However, these components working under different environmental conditions is challenging as various devices can become damaged under harsh conditions. This situation makes it more difficult for developing countries to monitor and manage energy efficiency adequately.
In addition to this, security is one of the most significant concerns of smart grids and big data analytics. Smart grids collect huge volumes of data from their consumers stored in databases and other areas, such as cloud platforms, prone to cyber-attacks [26]. Additionally, smart systems can gather different types of data about the consumers that may also include their private information, and this can undermine their privacy. Additionally, trust is an issue in this regard as consumers may not want to equip their houses with smart devices that continuously store and share their information with others, i.e., power managing authorities [30].

3.3.2. Power Consumption and Big Data Analytics Processing

Big data requires a very efficient and fast communication system to communicate at a high speed with minimum latency to gain optimum efficiency [39]. In developing countries, a fast communication system may not be available or feasible. Hence, integrating big data analytics in the energy sector poses a big challenge. Furthermore, big data technologies must handle large data from various sources, which require very large and efficient databases to store and retrieve data during operations. A system’s ability to transport and process the data may become a bottleneck if the rate is slow, making the smart grid work inefficiently [37]. Moreover, most of the devices used in big data analytics technologies, such as sensors, operate on batteries that consume energy. The more devices, the higher the energy consumption [40]. The availability and implementation of these devices is also a challenge as they require experts and professionals to deploy and manage the smart devices, which seems quite challenging in Iraq. Additionally, data retrieval is also challenging, especially in remote areas, where an extensive network would have to be laid, thus requiring extra cost [41,42,43,44]. In short, these smart systems’ actual power consumption is unknown, and there is a need for thorough research to determine the actual consumption of these devices so that the accurate implementation feasibility of big data analytics can be determined.

4. The Proposed System

The system has been named the “Power Consumption Information & Analytics System (PIAS)”. The proposed system can deal with various data types in a heterogeneous environment by hosting the data in two independent databases, namely (i) a structured database for mechanical meters after the digital transformation process and data cleaning process, and (ii) an unstructured (NoSQL) database for smart meters. Meanwhile, the integration is carried out through the system back-end through API and system interfaces that have access to each independent database. The system retrieves the power consumption data from different geographic regions and can be coupled with other information such as climatic conditions. It is structured into four tiers: the data, analytics, application, and presentation tiers. The design is based on a serverless infrastructure design as a block of services suggested in a recent study [45], which also states the scalability and performance discussion in more detail. Figure 1 shows the PIAS tiers diagram.

4.1. Data Tier Structure

The data tier consists of structured and unstructured databases. The structured database will be concerned with many processes such as historical data cleaning and pre-processing. Aside from that, online data that can directly be injected by API Gateway, as shown in Figure 1, will be dedicated to subscriber information management only. In contrast, the second part of the data tier contains the time-series database (No-Sql) unstructured database where the data are stored and retrieved in both hot and cold form from the API for all objects connected to our systems. Data are kept independent from the analytics, application, and presentation tiers [46]. The data tier works on the data persistence mechanisms that include database servers, file shares, etc. Data persistence mechanisms are enclosed by the data access layer that reveals the data. The data access layer provides an API to the application tier that shows the methods of managing stored data without revealing or creating dependencies on the data storage mechanisms. This allows the data tier to be updated or changed without affecting the application tier clients [47]. However, the cost is incurred by the separation of tier to bring further scalability and maintainability improvements. These costs include the model’s implementation costs and operational costs that ensure the model’s higher accuracy and efficiency. The proposed framework was built using an SQL server database that employs the following operations to operate the proposed structure. These processes allow the data to be ready for further processes in the analytics tier and application tier, so the proposed model can achieve its objectives and is easily scalable to more resources and information. The following steps have been applied in the data tier using the structured query language (SQL):
  • Step 1: Database Scheme creation: Structure definition, data format, and correlation among the tables
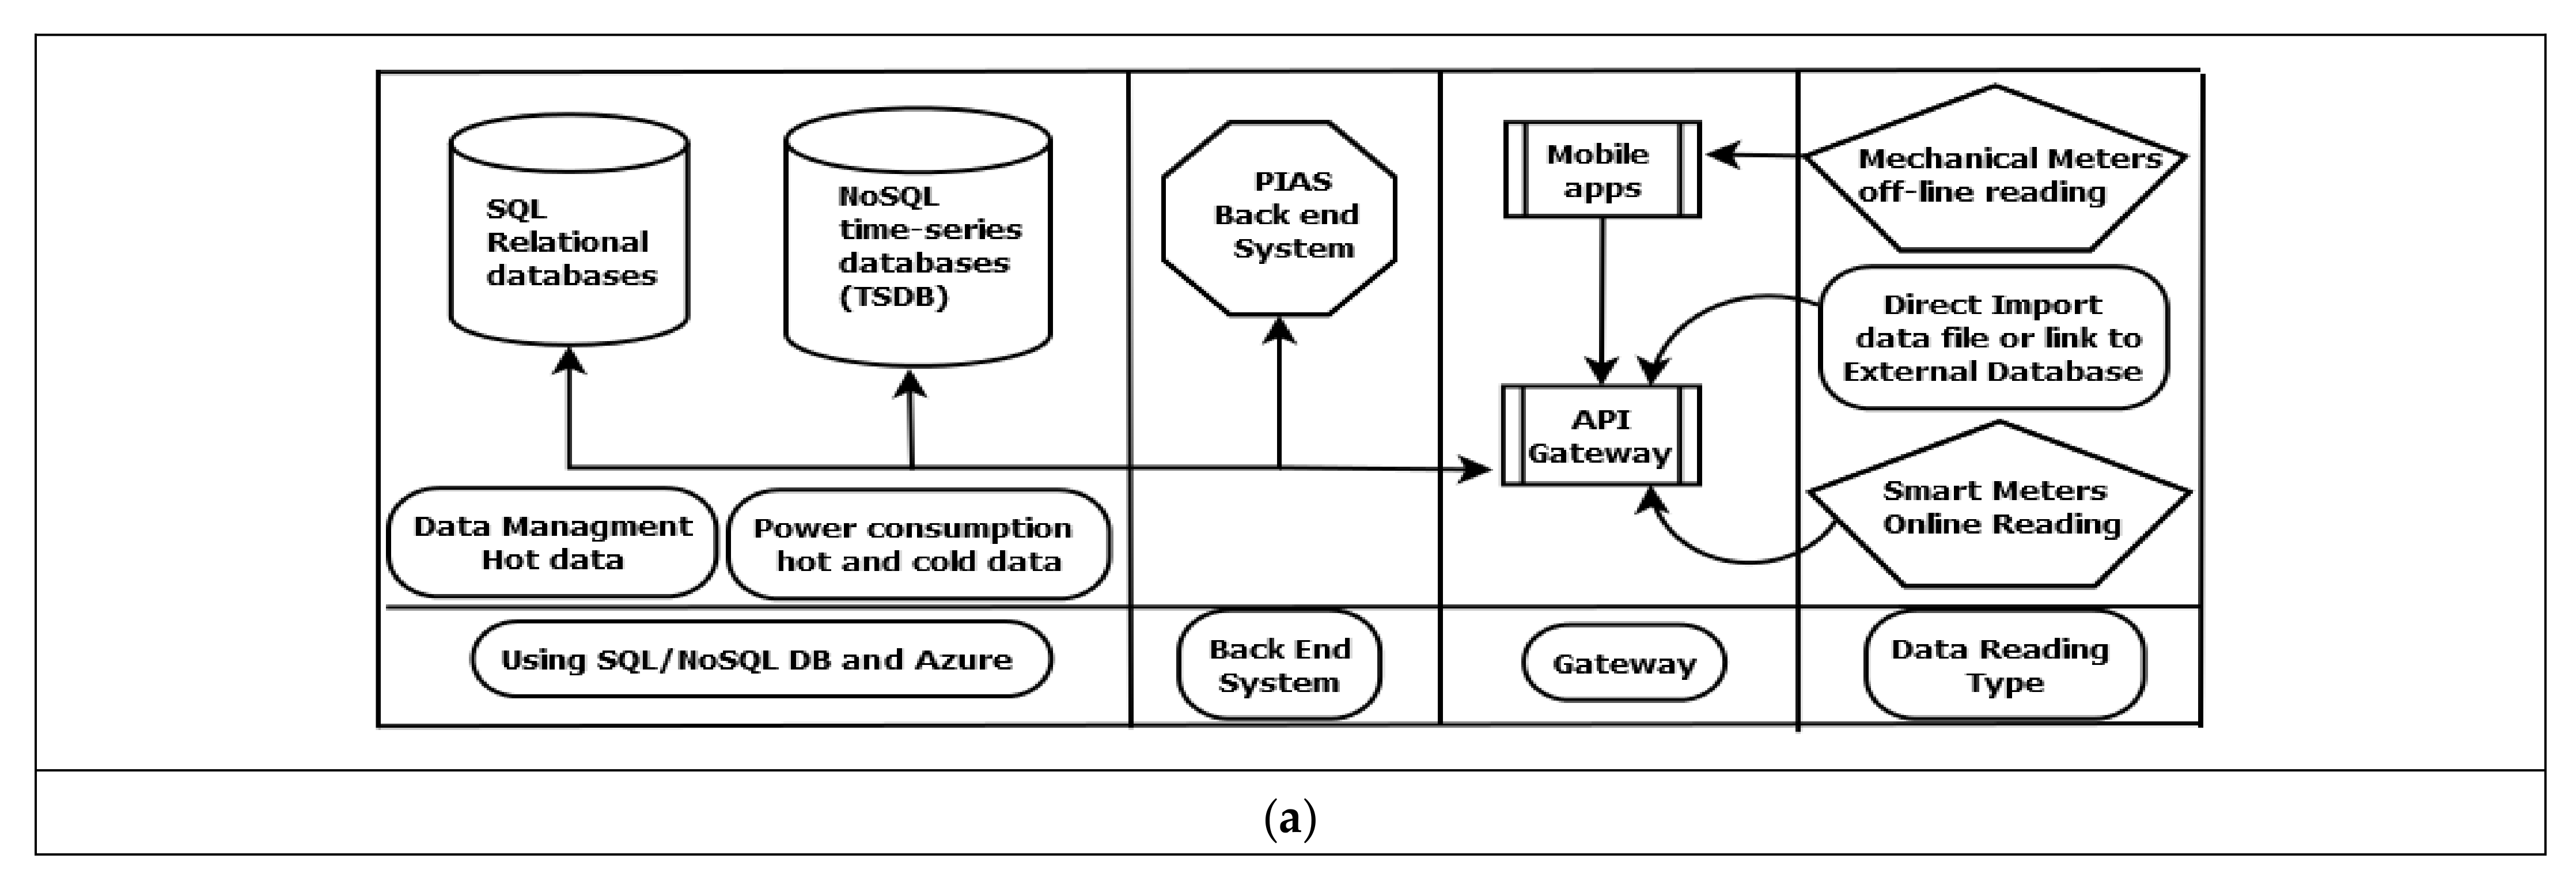
  • Step 2: Data Acquisition: The collected data can be inserted into the database using many techniques, such as API Gateway, links to other databases as well as direct import to the data files, and direct reading from smart meters through PLC, the Data Concentrator Unit (DCU), and GPRS, in addition to reading offline data (mechanical meters) through the PIAS mobile application, as shown in Figure 2a,b. This mobile app is designed to work offline, connected to our system through API Gateway with the capability of reading the meter’s value from the image of mechanical meter measurement. The identified measurement value is transferred to a digital value and stored in the mobile devices which were used at the time of reading. Then, the stored data are sent along with the unique ID of each subscriber and meter ID to the PIAS through API Gateway when the mobile device is connected to any internet network. This will effectively reduce human errors in reading the values and reduce the costs required for this process.
  • Step 3: Data manipulation: Create, read, update, and delete (CRUD) operations of any data from the database.
  • Step 4: Querying: Retrieval of stored data to be used by the analytics and application tier.
  • Step 5: Integration of security modules: Authorizing access to the data and ensuring which data to reveal.

4.2. Analytics Tier Structure

Data analytics is the core tier of the system because it enables the data to be analyzed and used for further predictions [48]. This tier uses real-time analytics to perform analysis of any events right after their occurrence. This process requires an efficient structure to monitor many events to perform an efficient analysis [49,50]. In this context, the big data must be partitioned to evaluate the model. Data partitioning is a critical process that makes the data more powerful by dividing them into smaller pieces. This data are then used for various purposes to improve data functionality, such as improvements in prediction accuracy [51]. Our study suggests using the Knime analytics platform in the analytics tier to make the system more efficient. Knime can perform real-time analysis of high-volume data and predict power consumption through its many plugged-in machine learning and artificial intelligence algorithms, depending on specific purposes. One of the features is to forecast future energy consumption and conditions. Figure 3 shows the top view of the process flow in the PIAS analytics tier.

4.3. Application Tier Structure

The application tier is the third tier of the proposed application, and it is the logic tier that contains the business logic. This tier controls the application’s functionality by performing detailed processing while interacting with the data tier to process the customer’s information [52]. It ensures that the customer’s queries are effectively transmitted to the analytics and database tier, hence enabling them to retrieve the desired information. Moreover, the application tier is a core part of the application, where logical decisions are made, and problems are solved [53]. The business rules and algorithms are built into this tier by writing the application tier in programming languages such as C# and ASP.net.
This activity’s main objective is to provide the user with the desired results [54]. This tier is also known as server back-end development. A part of the application works at the back of the application without letting the user know about the processes being performed. The proposed application’s portal system is the application tier that forms the basis of all the operations being performed by the application. All the user’s information input into the application must pass the logic gateway, i.e., application tier, to display the correct information to the user. For example, when the user logins to the portal using their User ID and password, the information is sent to the application tier, where it is processed to check if the user has entered both fields correctly. If the fields match, the user is granted access to his account, and if the fields do not match, the user is denied access. Similarly, several other logical operations are carried out by the application tier. Therefore, it can be regarded as the application’s brain. The application tier also sends commands to the database tier and analytics tier to retrieve the right data from the information and analytics presentation [55].

4.4. Presentation Tier Structure

The presentation tier is part of the PIAS application, which is visible to the user. It is the outermost tier of the application and performs its critical task by displaying information and retrieving queries from the user [56]. The presentation tier has a user interface, which can be various types of graphical user interface (GUI) and API gateway. The GUI is the most common and user-friendly interface, while API is used as a gateway to connect another database or objects with the right authorities and keys [57]. The presentation tier interacts with the user to input and relate to the application tier to pass it. The application tier then logically processes the information and performs the desired operations by interacting with the database tier and analytics tier that performs the functions to achieve the desired results [58]. These results are then sent to the presentation tier, which displays them to the user in various formats such as graphs, tables, and charts as an interactive visualization shown in Figure 1 (PIAS Tiers Diagram).

5. Results and Discussion (Case Study 1)

This section discusses the proposed system through the implementation of first case study, which it discusses data quality, PIAS web interface, and data visualization.

5.1. Case Study 1: Data Management

The data were produced by the Iraqi Ministry of Electricity (MOELC) [59]. It is available on the Iraqi ministry of electricity’s main website. The original consumption dataset included 9 months of monthly aggregated reading values (one read per month/per subscriber) for a total of 5,189,000 mechanical meters. Each meter also provides nine (9) subscription information parameters. The data covers insights from the four seasons, as it starts from winter (January–February) to spring (March–May), summer (June–August), and the beginning of autumn (September). The summary of the dataset is referred to in Table 2.
The information obtained from the mechanical meters lacks detailed information, where it only includes reading value per month as a dynamic parameter and lacks important time-series (timestamps) or cluster information. These can be considered as a limitation in the current case study, but using PIAS, other objectives can still be achieved. Moreover, any database design should consider the ability to deal with heterogeneous data types resulting from current mechanical meters and the possibility of having smart meters soon. The presence of heterogeneous data leads to the need to go through a delicate transition phase, i.e., processing the current mechanical meter data, while the gradual replacement takes place on and shifts to smart meters in the future. This process can take many years and can be considered as another limitation in the current study. In addition to that, the nature of the data and its dimensions are different, as the smart meters possess an average of 20 to 30 different pieces of information about power consumption over time, while the mechanical meter only has reading value and date of physical data.

5.1.1. Data Quality and Design Structure

To overcome the above limitations, this study proposes to isolate data in the transitional phase instead of data integration itself, i.e., designing two independent databases constructed of a structured database for mechanical meters and an unstructured database for smart meters until the transition phase to smart meters is fully completed. As a result, the system will fully operate using the unstructured database in the future, while the structured database will be converted into historical data. Many procedures must be completed before these data can be ready for any following processes such as data visualization and data analysis. These procedures are further elaborated as follows:
  • Design an independent structured database to host mechanical meter data and an independent unstructured database (NoSQL) to host future smart meter data. The unstructured database will have a dynamic scheme with horizontal scalability, as it can be a document, key-value, images, or wide column store, which can be modified at any stage. This scheme will be fully dependent on the future controls that are set by the ministry of electricity requirements, where both databases are connected through the API gateway of our system. The system can access both databases with an integrated interface through the PIAS’s front-end. This proposed design gives the capability to host data from various sources such as mechanical and smart meters independently but integrated into the system’s back-end through API and the front end of the system using GUI.
  • Data Quality: Data cleaning and data pre-processing will be applied before any data import process. These processes will be only applied to mechanical meter data in the offline form (i.e., after manual reading and direct data feeding or digital transformation through the mobile application platform designed specifically for this purpose) or any other historical data form. This process can also be used to migrate the historical data, while the real-time data from smart meters will be a direct injection into our unstructured database through an enterprise API. Moreover, this process can remove irrelevant and obsolete data in historical data from the mechanical meters. These might include inactive accounts, missing information, closed accounts, or empty accounts from the dataset. A powerful cleaning procedure with Microsoft SQL was used to gain clean data. For the case study, a meter must fulfill the following four requirements to be considered. After the cleaning process was completed, 1,445,000 active and clean record entries of subscribers (mechanical meters) were retrieved. The following steps have been followed to ensure the data quality:
    • Step 1: Check if the basic account information has been updated in the last 15 years.
    • Step 2: Check if the account opens or active flags.
    • Step 3: Check and remove special characters such as (\.|\,|\!|\@|\#|\‘|\~|\$|\%|\^|\+|\/|\-|\&|\*|\(|\)|_|\+| |\=|\[|\]|\{|\}|\:|\”|\;|\’|\,|\.|\/|\<|\>|\?)
    • Step 4: Check and remove white spaces such as the word tab and new line spaces.
    • Step 5: Check if some record fields contain letters and numbers together; this must be split and standardized.
    • Step 6: Check if any record fields need type conversion.
    • Step 7: Check if the account has any missing or empty information.
    • Step 8: Recheck the database normalization and unify the lookup table value.
    • Step 9: Check and remove any duplicates account records (merge, update and/or isolate the duplicate records).
  • Additionally, the structured database can be joined to the climate condition data [60] where the subscribers’ information was linked to the climatic data that was retrieved from the Iraqi Weather Authority. In this work, the database source can either be by direct data injection or automated link via the API gateway of the proposed system. The climatic information is comprised of parameters such as maximum and minimum temperature, average temperature, amount of rainfall, humidity, and the length of daytime. The climatic data were collected simultaneously with power consumption data to determine an effective and accurate link between the two datasets. Figure 4 shows the step-by-step data cleaning and pre-processing process that was applied to the collected raw data. Moreover, additional fields were added to the database to create the final structure. These fields are comprised of information such as personal information, address, and the subscriber’s geographical location, which will be used for the proposed PIAS later.
The designed structured database has two main tables and five lookup tables, as seen in Table 3 and Table 4. It includes the reading information tables linked to the account information table by a unique identifier (GUID) with (many-to-one) relationships to enable multiple readings for the same account over time. Information such as reading value is a dependent variable in our model, while the maximum temperature, minimum temperature, average temperature, amount of rainfall, humidity, and the length of daytime are the independent variables.
d.
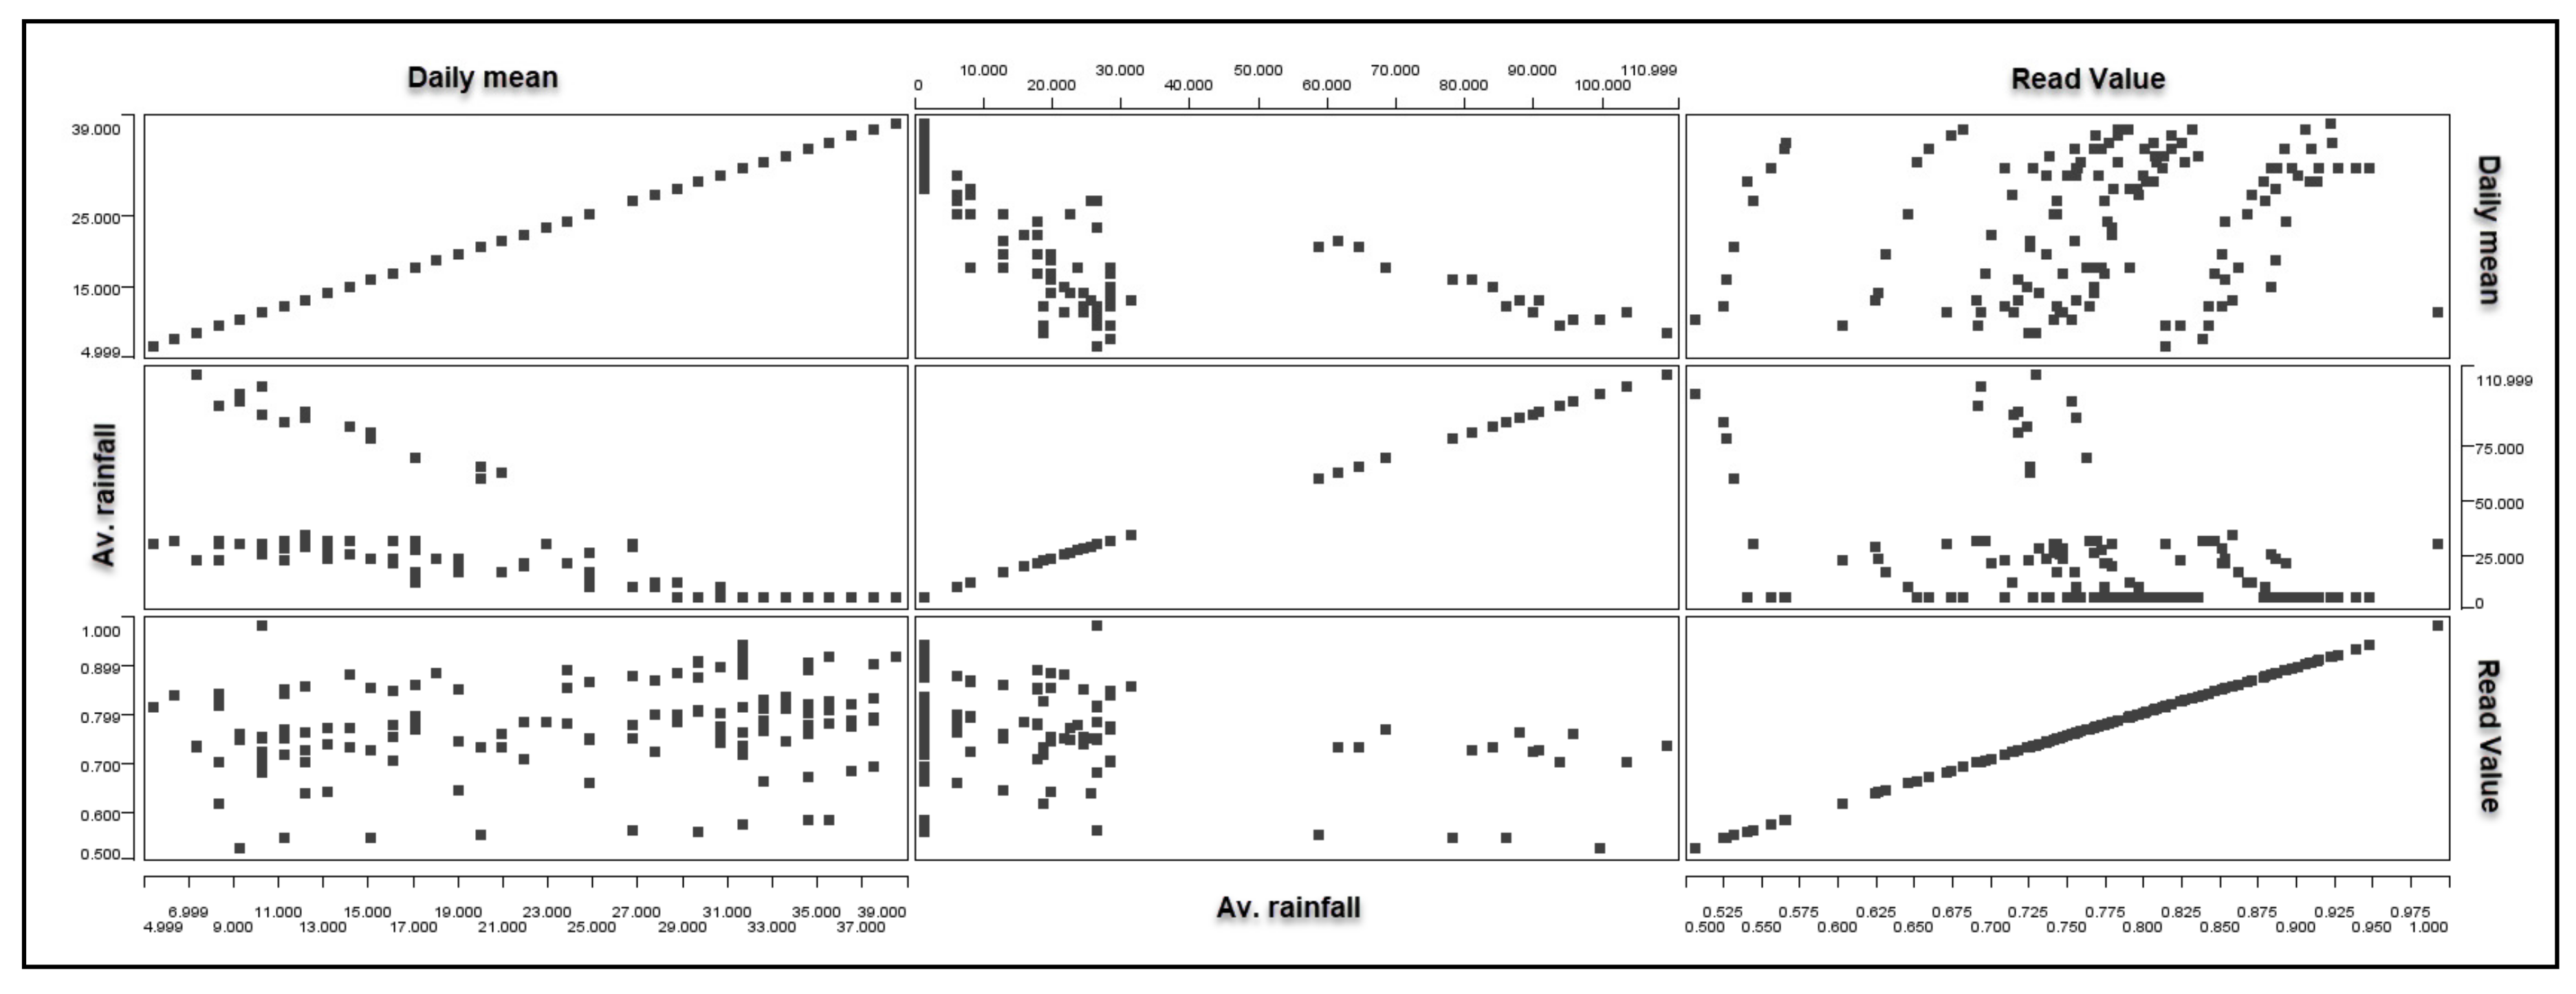
Basic statistical analysis can be applied to the variables of the clean dataset. Table 5 shows the statistical analysis of the dataset variables after pre-processing and linking to climatic information, where the skewness was used to measure the symmetry of a dataset [61]. A higher value of these parameters means the data have high divergence. Similarly, skewness was used to describe our dataset; skewness of zero means that it is symmetrical, whereas a positive value means a shift towards the right side and a negative value towards the left [61]. Furthermore, kurtosis was used to measure the ‘tiredness’ of data or measure the data distribution peak [34]. A high kurtosis means that data are highly tailed and vice versa. The kurtosis is used to measure the degree of a distribution’s peaks. A kurtosis value close to (0) means that normal distribution is observed, a kurtosis value lower than (0) means the distribution has a light tail, and a kurtosis value larger than (0) represents a distribution with heavier tails. Moreover, a scatter matrix was used to determine the correlation between the variables and identify the correlation’s nature (if it exists) between the variables [62]. Figure 5 below shows the scatter matrix of the temperature variables used in this research. The range of reading values is from 0.5 to 1.0, against which other variables are plotted in the diagram. The daily mean temperature lies in the range of 4.999 to 39.000 and shows an increasing trend. The graph also shows positive correlations between several variables that can act as predictive indicators for the future.

5.1.2. PIAS Web Interface

PIAS is a web-based application that allows users to access their accounts at any place. The most common feature in the presentation tier is the interactive buttons that perform the users’ desired operations [63,64]. The application’s main interface allows the user to enter their account credentials to access the account. Additionally, the user who logs into the account can choose several options, such as account information, subscriber information, reading the information, etc., that can be accessed. For example, by choosing the reading information option, the user can view the period’s power consumption information. The application interface allows the user to select the period of choice and view the power consumed for that period while seeing the future forecast based on past trends. The user can also view the month’s expected bill and detailed information about the peak hours of power consumption. It also shows climatic data to the users and their link with power consumption. All this information is displayed to the user in a compact and legible form, i.e., through graphs and tables to easily comprehend and optimize the power consumption information, decreasing the energy bills. The presentation tier is the most significant and essential part of the application’s visualization that shows information to the user in an interactive manner. The proposed PIAS portal’s web interfaces will allow users to access and gain information about various parameters such as energy consumption and climatic changes. The users’ accounts will be encrypted using a protected password so that no one else can access the client’s portal, hence protecting the client’s information from unauthorized access. The portal interface is very user-friendly, which allows the user to access the account very quickly.
Figure 6 shows the portal’s main dashboard that the users can view after signing into their account. This dashboard displays the information about the subscriber’s account and other details such as location, electricity supplier, and the type of energy phase used. Moreover, the dashboard also has a “reading information” tab that displays information about the subscriber’s power consumption in a specified period, along with the future forecasts. This also helps the subscribers to estimate their monthly bills. By keeping track of power consumption data, monthly bills can be saved and managed. Additionally, the subscriber can also determine the peak time of usage that will promote more efficient electricity use during that period, conserving a significant amount of monthly consumption.
In Figure 7, the “account information” tab shows all the subscriber’s account details. This information includes account number, subscriber number, meter number, account type, phase name, account status, and managed by name. Additionally, the GPS location of each meter will be recorded by PIAS along with complete account profile information and meter maintenance history. Furthermore, PIAS offers the feasibility of updating the power consumption reading information without having any difficulty synchronizing with the smart meters’ API gateway to automatically update records through PIAS RESTful API.

5.1.3. Data Visualization

The PIAS visualization shows the data after they were analyzed and compared with the hypothesis to testify their validity [65]. Moreover, the application’s visualization displays the result in graphs and tables that summarize the lengthy information in a compact form that is easy to be understood by the user. The information displayed includes the data about the climate of various geographic locations of Iraq. The climatic information consists of the data about rainfall, temperature, and humidity in various Iraq cities. The visualization dynamics enable the desired data to be retrieved by the user to perform a descriptive analysis [65]. Therefore, visualization is a critical feature that enables easy and fast analysis of huge power consumption and climatic data. The dynamic chart below displays how the data are presented by visualization in an intelligible format. Microsoft’s Power BI tools have been used in the proposed model as interactive visualizations and business intelligence tools to represent the digital data after passing all the previous operations such as the organization and cleaning processes.
Figure 8 shows the geographical distribution of different parameters such as population, distribution of rainfall, average maximum temperature, and the average reading value for different regions of Iraq. The general average was calculated and represented in a circle representing the different regions and governorates from the north, center, and south. The bigger the circle, the higher the rates (population, rainfall, etc.) are distributed on the interactive map.
The temperature and the amount of rainfall that affect the energy consumption rate in different seasons can be extracted through the map, where the northern governorates record lower energy consumption than their central or southern counterparts, with a higher average temperature and a lower precipitation rate despite some northern governorates having a higher population. This can considerably help the Iraqi Ministry of Electricity to effectively supply and plan the power generation as well as give information on expected power consumption. Additionally, putting this information together gives a more in-depth insight into decision making in the energy sector. In the available dataset, the GPS information for each account is not provided. The map can be more dynamic and detailed if GPS information is available.
Another approach to review and analyze the obtained data is the interactive view. A dynamic analysis of different cities is a highly significant feature of the proposed system, where the decision maker can view the analytical data for several different regions from one dynamic view. With dynamic analysis, the authority can view various climatic conditions and power consumption information simultaneously in graphs. It will allow them to analyze various regions’ energy conditions accurately. Moreover, it will also enable the ministry to accurately analyze the energy demand while making an effective future plan to meet rising power demands. Figure 9 shows an example of a dynamic analysis of different Iraqi regions. The analysis of the data obtained in dynamic analysis supports the research hypotheses reviewed in a previous section; as shown by the dynamic interfaces below, the rate of energy consumption decreased when we are facing a decrease in temperatures and vice versa during different seasons of the year, and this is evident in the ninth-month readings. Although the reduction is minimally affected by the rate of consumption, it is expected to continue with the decrease in temperatures in the winter season.
To promote a deeper understanding of the strength of the data visualization and analyzed results, a dynamic analysis of three major cities of Iraq, Nineveh (Mosul City), Baghdad, and Basrah, was performed. These three cities were chosen based on the population density, as they are considered the three largest cities in Iraq, and their geographical location is distinctive (north, center, and south of Iraq, respectively) with three different climatic conditions in temperatures, the amount of rainfall and the number of daylight hours in the day. Figure 10 shows the dynamic analysis of the monthly average rainfall, monthly average read value, and monthly average minimum temperature in Baghdad. The figure shows that rainfall is highest in January, February, and March. Read value does not show much fluctuation and remains almost constant for the last nine months, with the highest value recorded in August. Baghdad shows the highest minimum temperature in July and August and has the lowest minimum temperature in January and September, offset by a decrease in energy consumption rates.
Figure 11 shows Basrah’s dynamic analysis with the highest rainfall in January with no rainfall from May to September. It has the same trend of reading value as Baghdad, i.e., uniform, and has the highest minimum temperature in August, with the lowest in January and September, which is also offset by a decrease in energy consumption rates.
Figure 12 shows the dynamic analysis of Nineveh city (Mosul). Unlike Baghdad and Basrah, it has the highest rainfall in February, with no rainfall from June to September. Again, the read value trend remains the same for Mosul, i.e., uniform, and has the highest minimum temperature in August, with the lowest in January.
The results reinforce the following understanding that the rate of power consumption is greatly affected by different climate conditions, where consumption rises as the temperature rises, and the power consumption decreases with lower temperatures recorded. It was also noticed that the power consumption increases gradually whenever there is a decrease in the rainfall rate. All of this strengthens the research hypotheses, as the researcher could predict power consumption rates by linking them with different climatic condition data.

6. Results and Discussion (Case Study 2)

This section discusses the proposed system through the implementation of a second case study, which discusses the data analytics for load forecasting.

6.1. Case Study 2: Data Analytics (Load Forecasting)

Due to the lack of sufficient time-series information in Case Study 1, for data analytics of load forecasting, we have obtained another dataset from the Iraqi Ministry of Electricity. The dataset contained the power load specific to the Baghdad Governorate for 12 months of 2019 (1 January 2019 to 31 December 2019) and distributed according to a timestamp in a matrix of 24 h per day. The summary of the dataset is shown in Table 6.

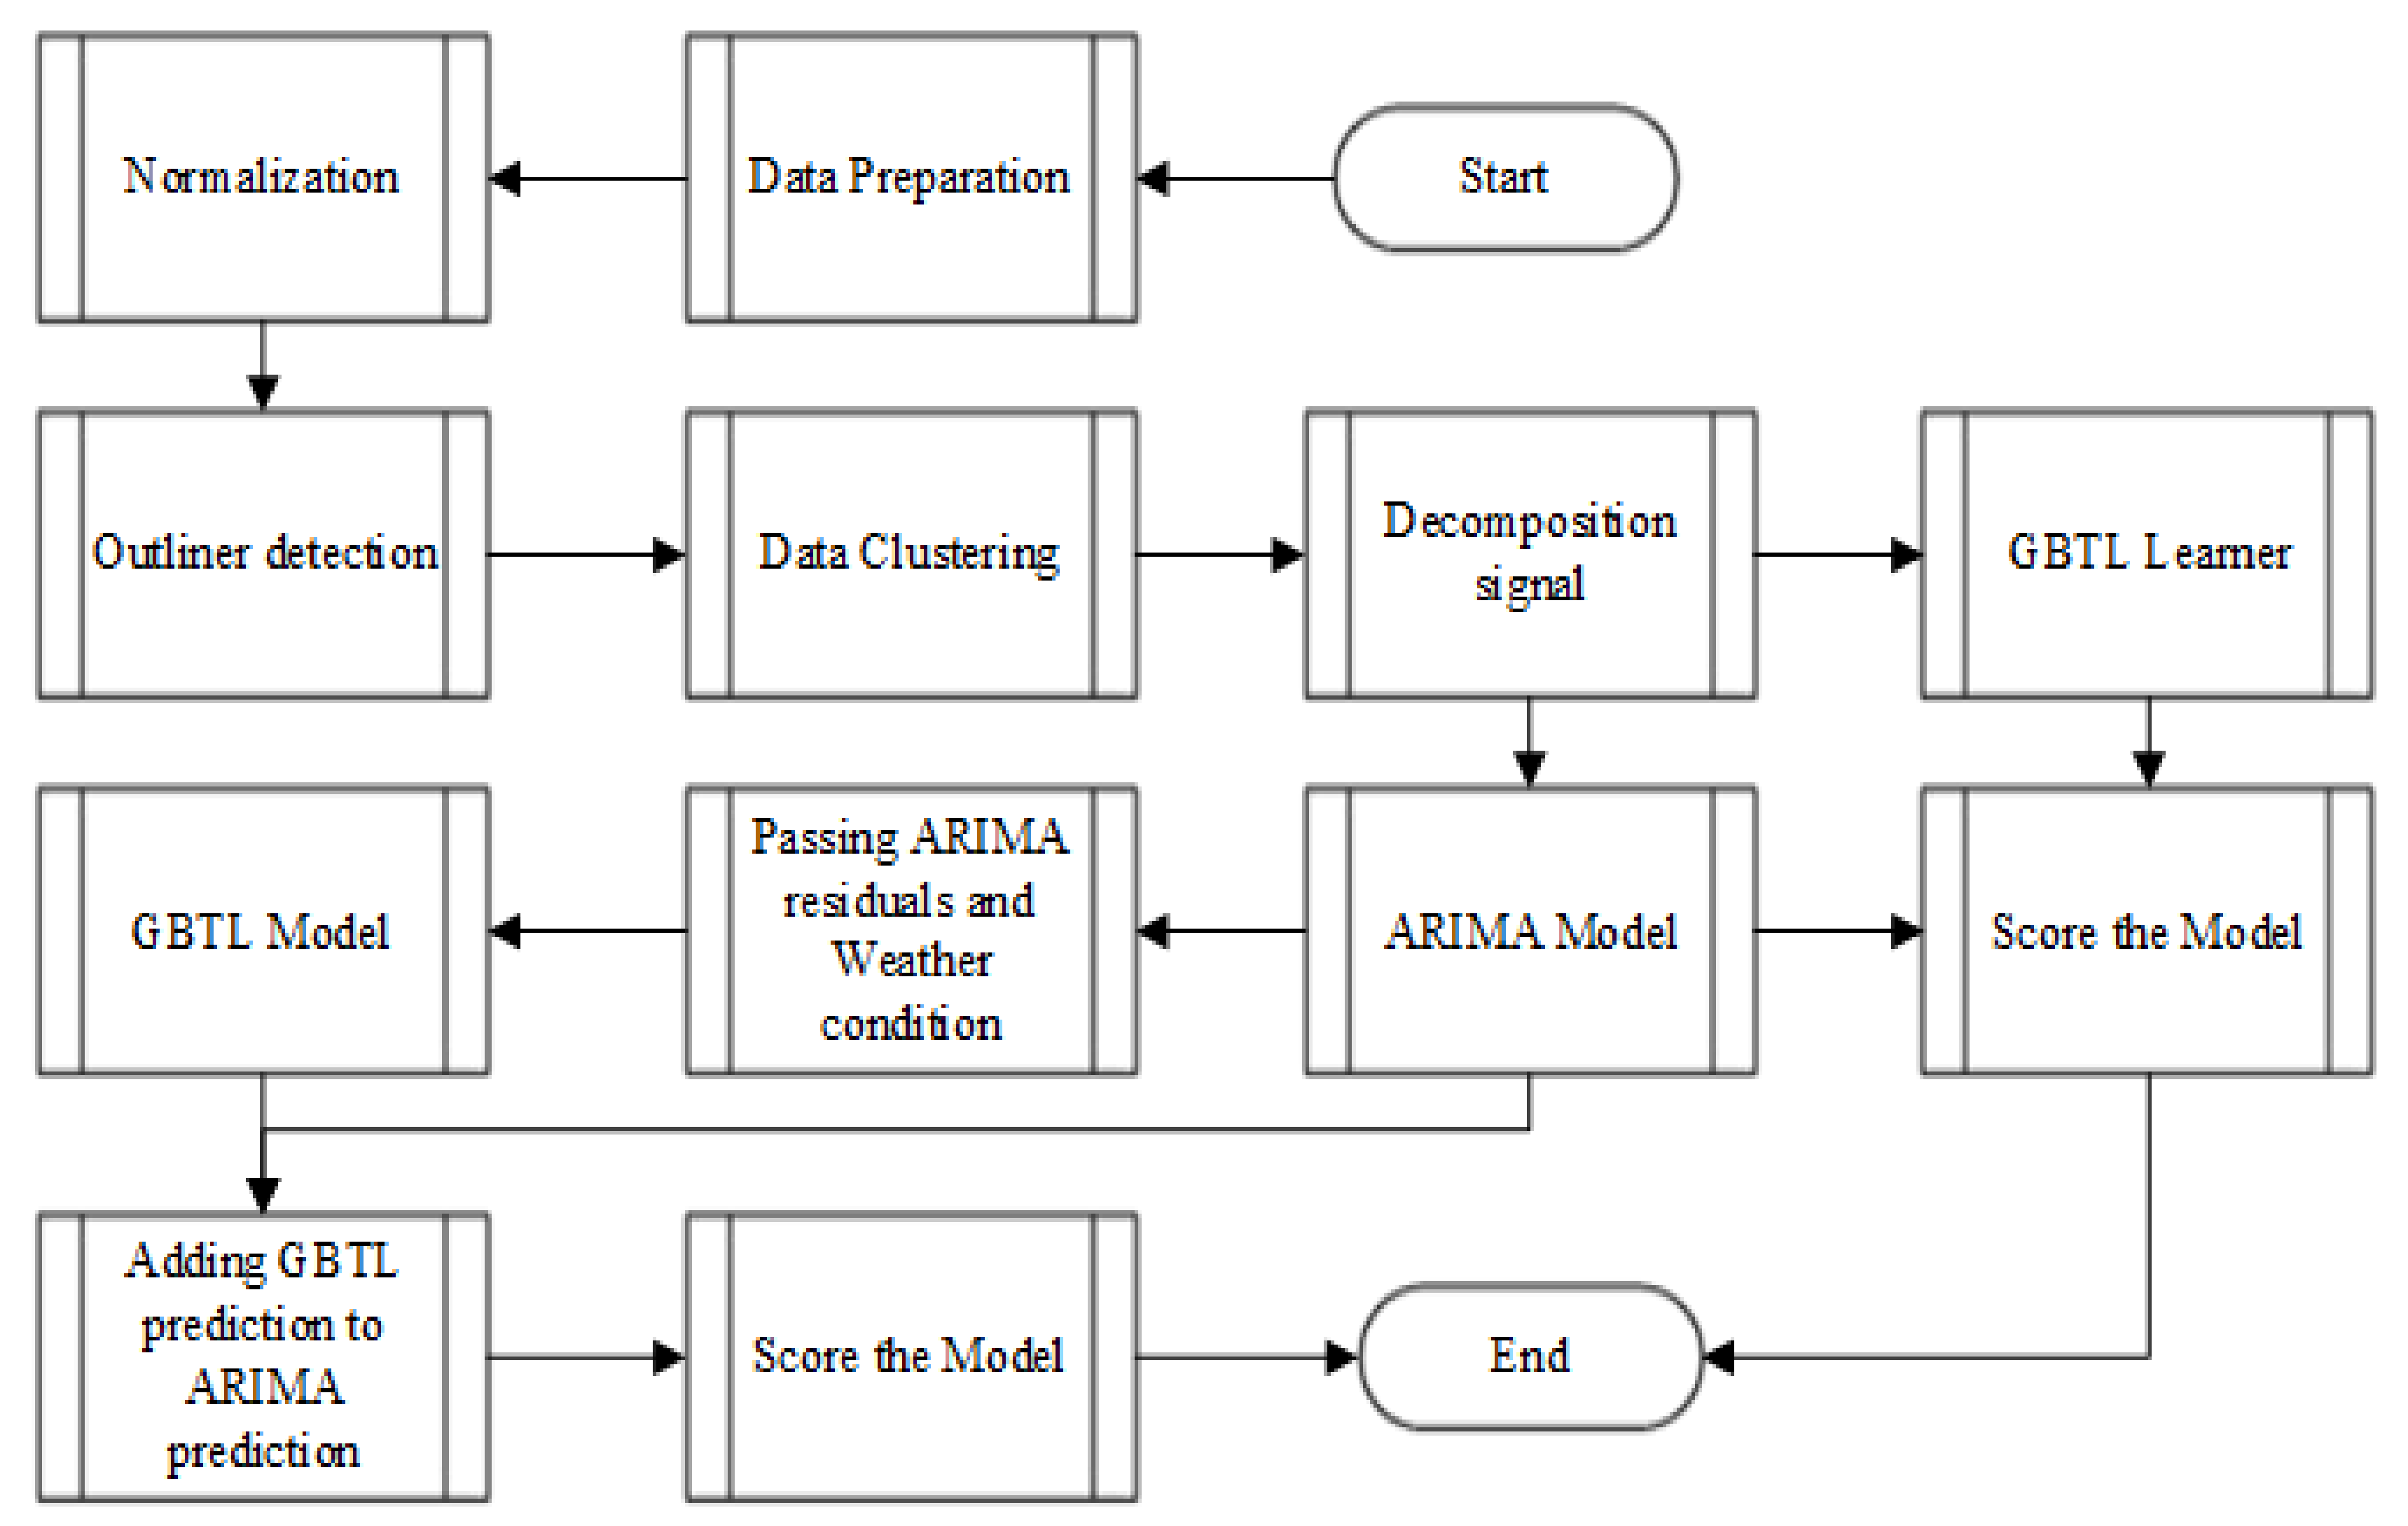
6.1.1. The Proposed Model

In this research, we proposed a novel approach for the load forecasting of the Baghdad governorate using a hybrid model encompassing a fuzzy C-means clustering (FCM), the Auto Regressive Integrated Moving Average (ARIMA) model, and Gradient-Boosted Tree Learner (GBTL). The proposed method consists of five stages, as shown in Figure 13.
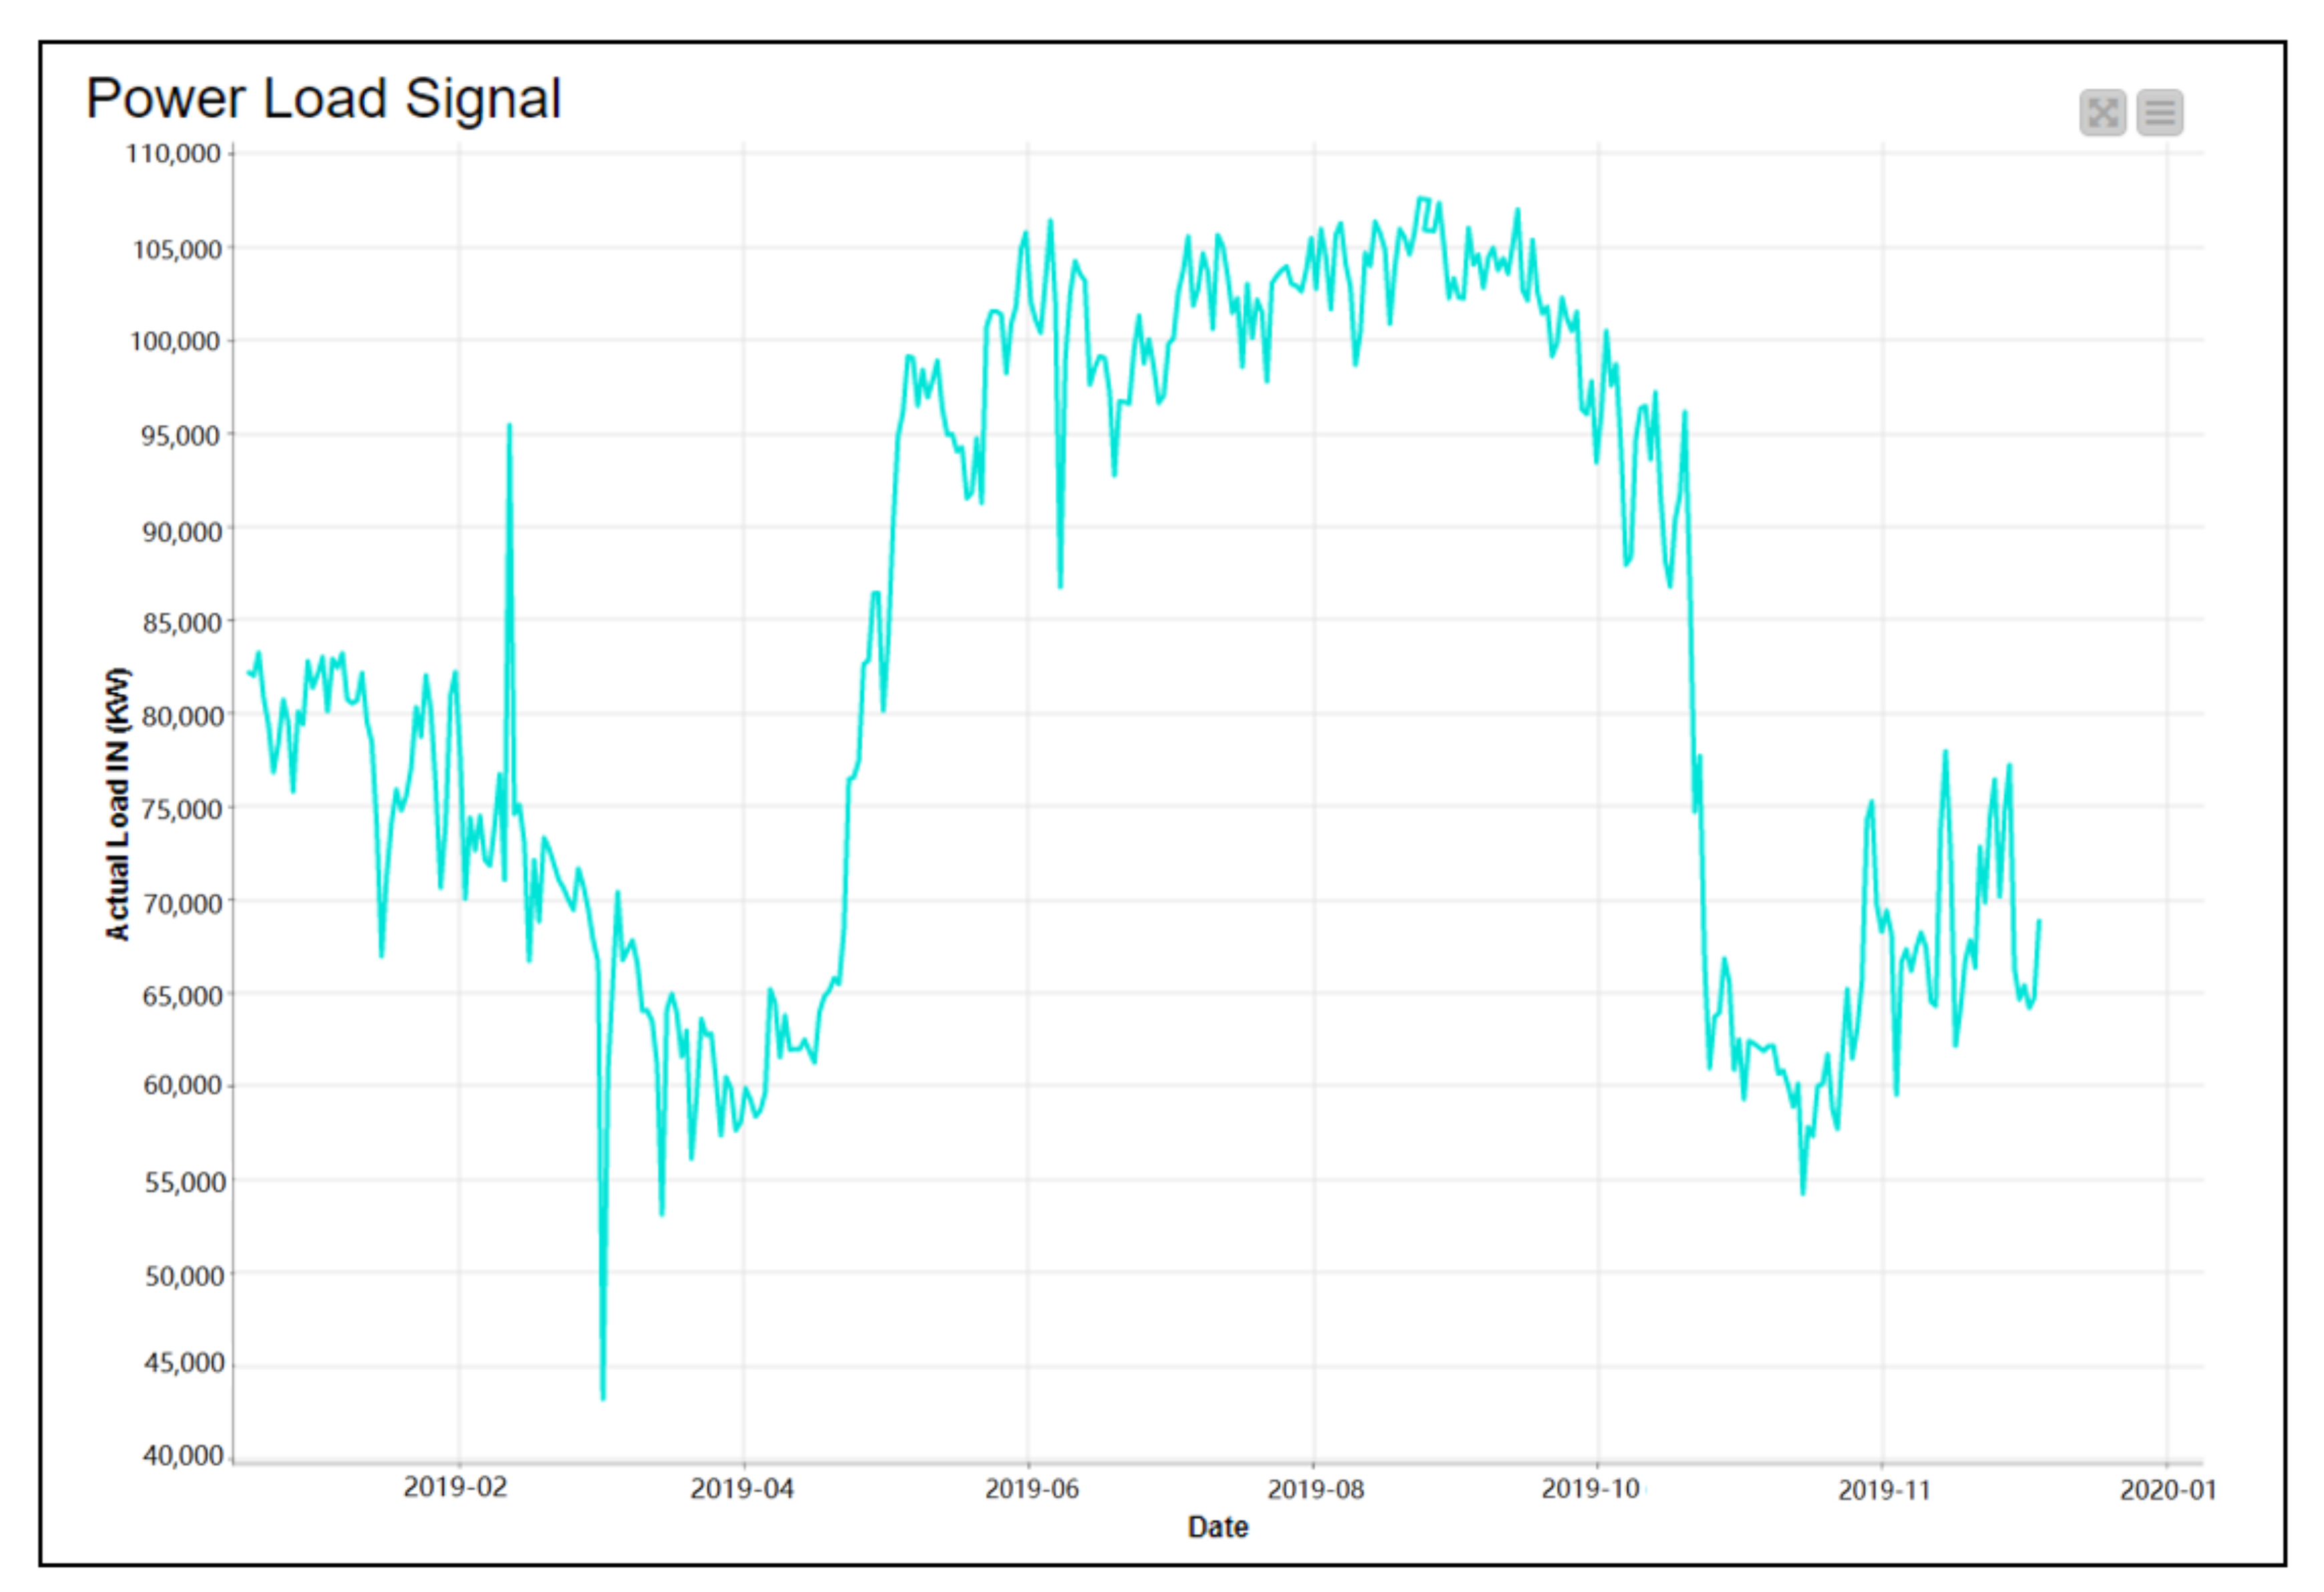
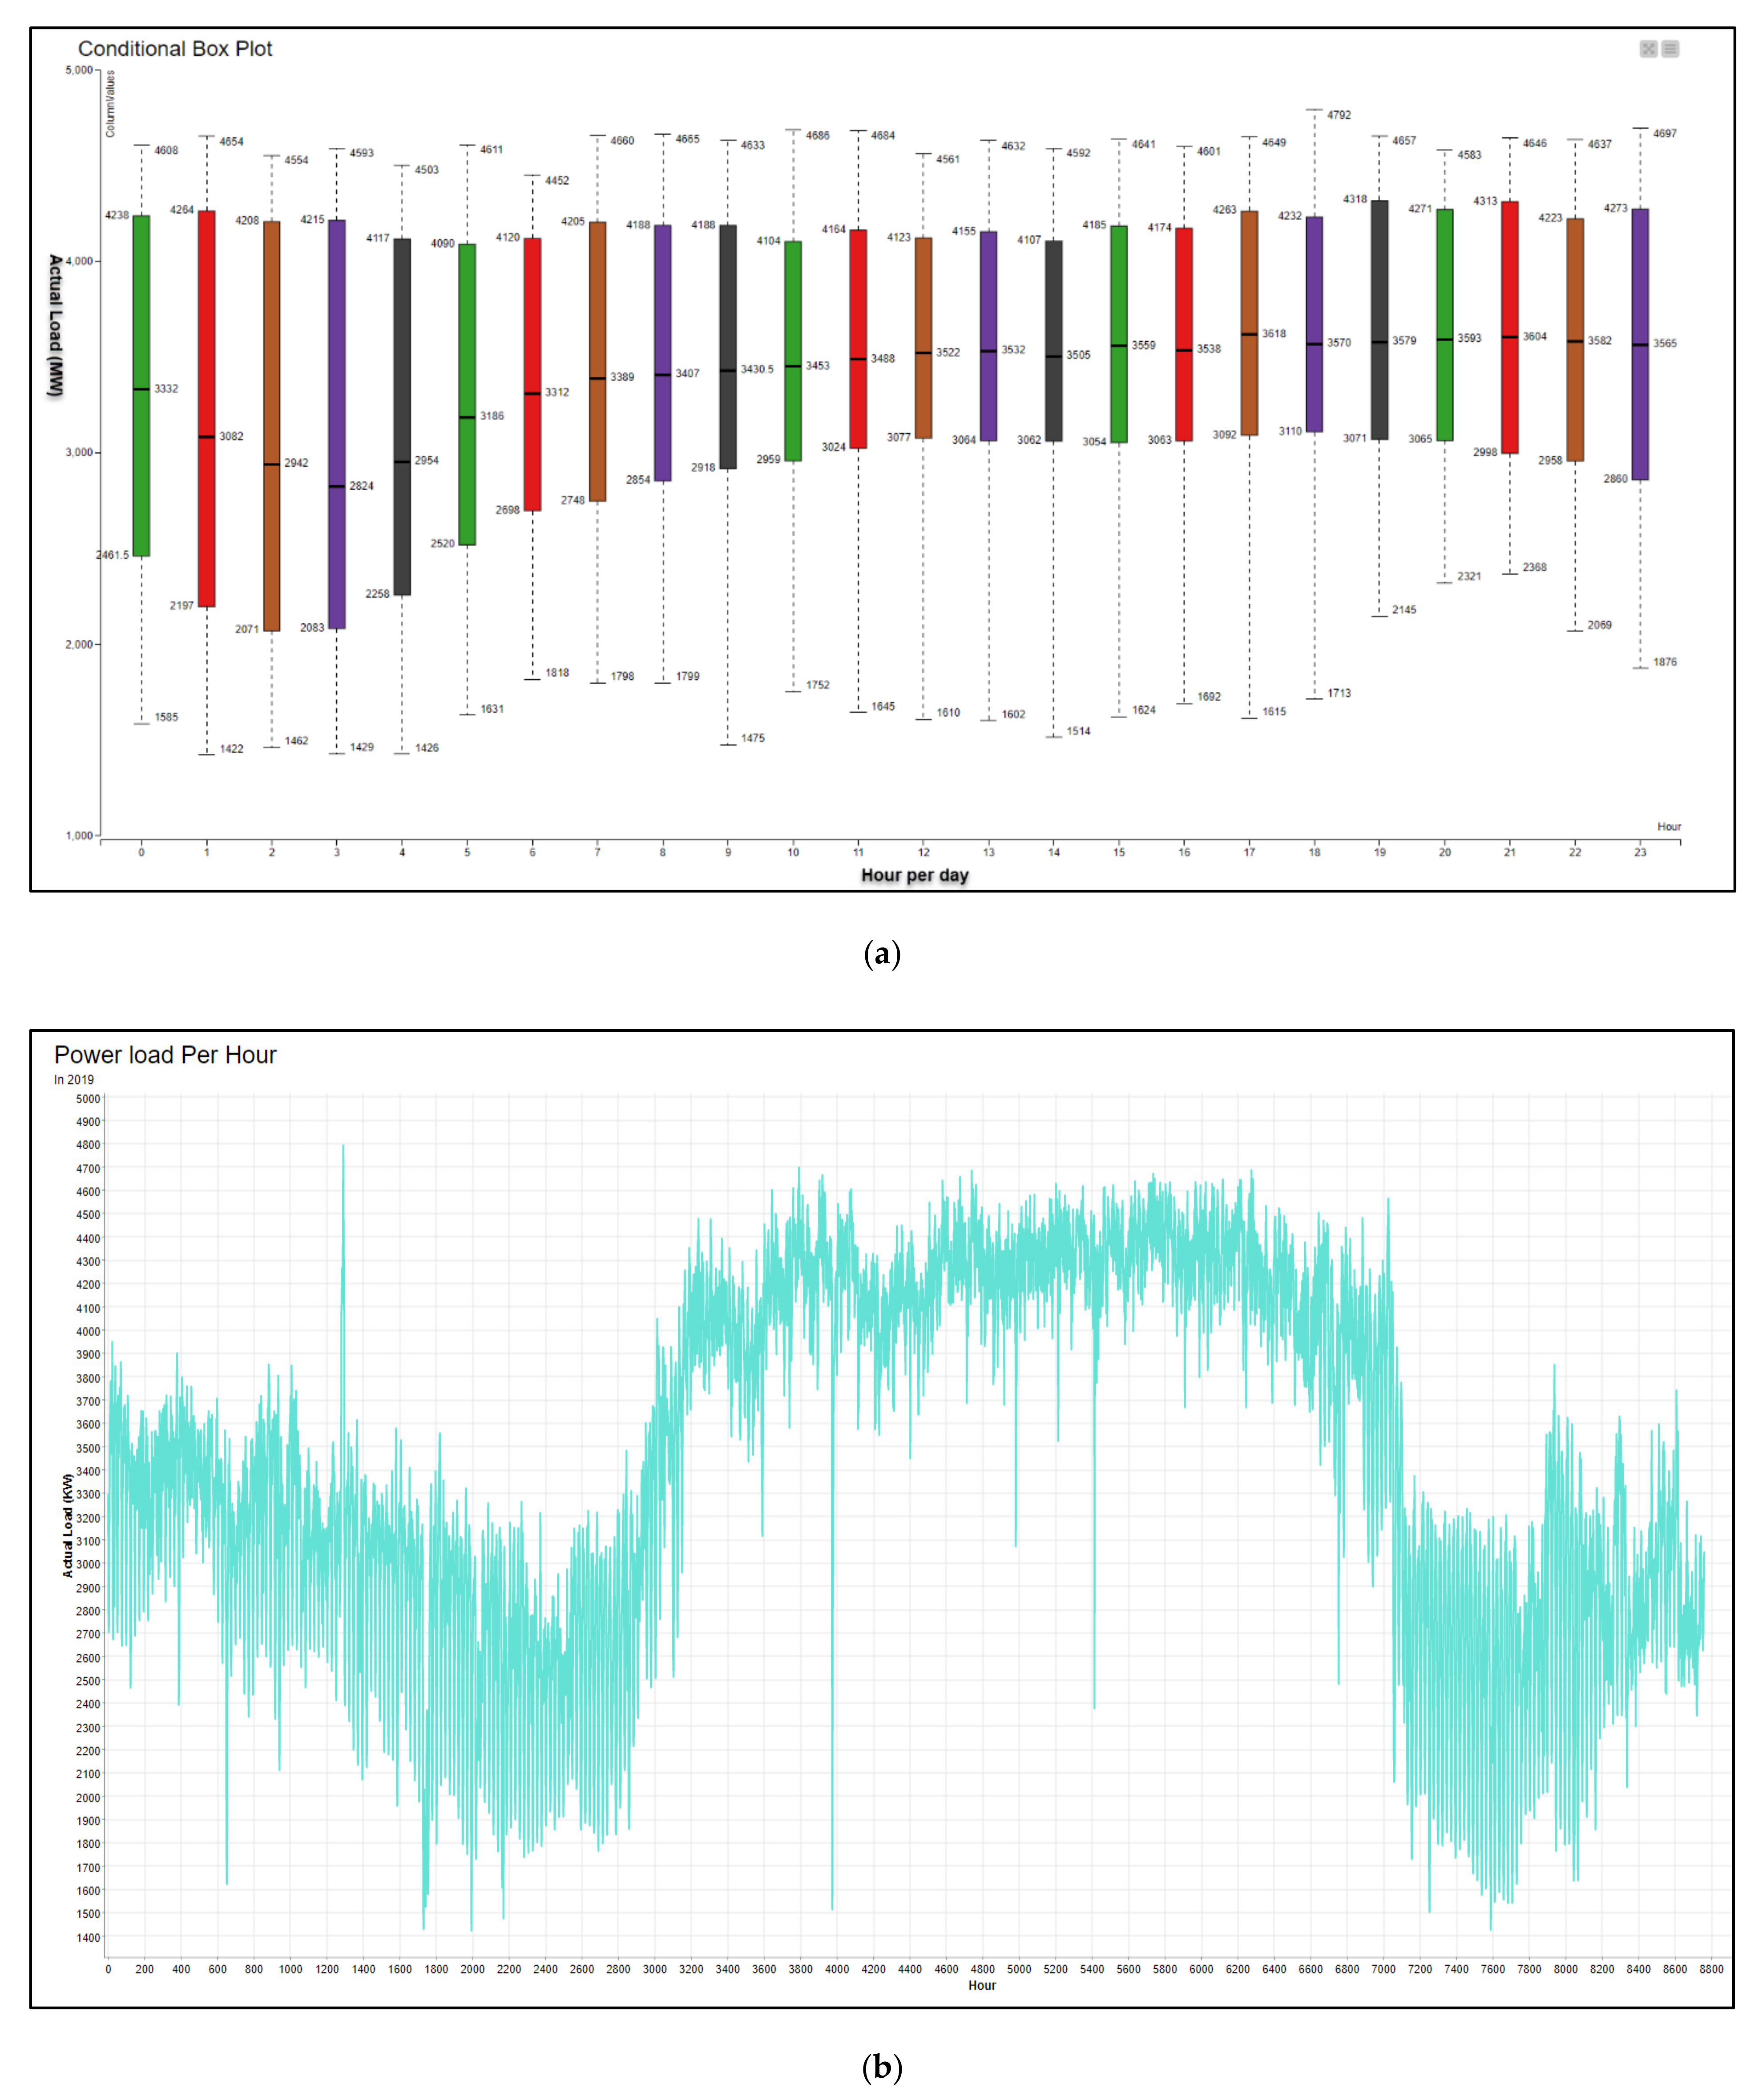
  • First Stage (Data Reading and Preparation): data can be imported directly or linked to different databases through the internal API of our system and integrated and connected with the Knime platform. The next step is to un-pivot data from a 365/24 matrix to an hourly data form, 365*24. Figure 14 shows the daily Baghdad governorate load distribution (kW) for 2019, while Figure 15a,b show the hourly Baghdad governorate load distribution (kW) for 2019; in addition, we are checking missing values and normalization the load value between 0 and 0.5. Moreover, to handle rapid or irregular fluctuations and outliers (irregular patterns). Additionally, we applied outlier detection to smooth our data for the next stage process.
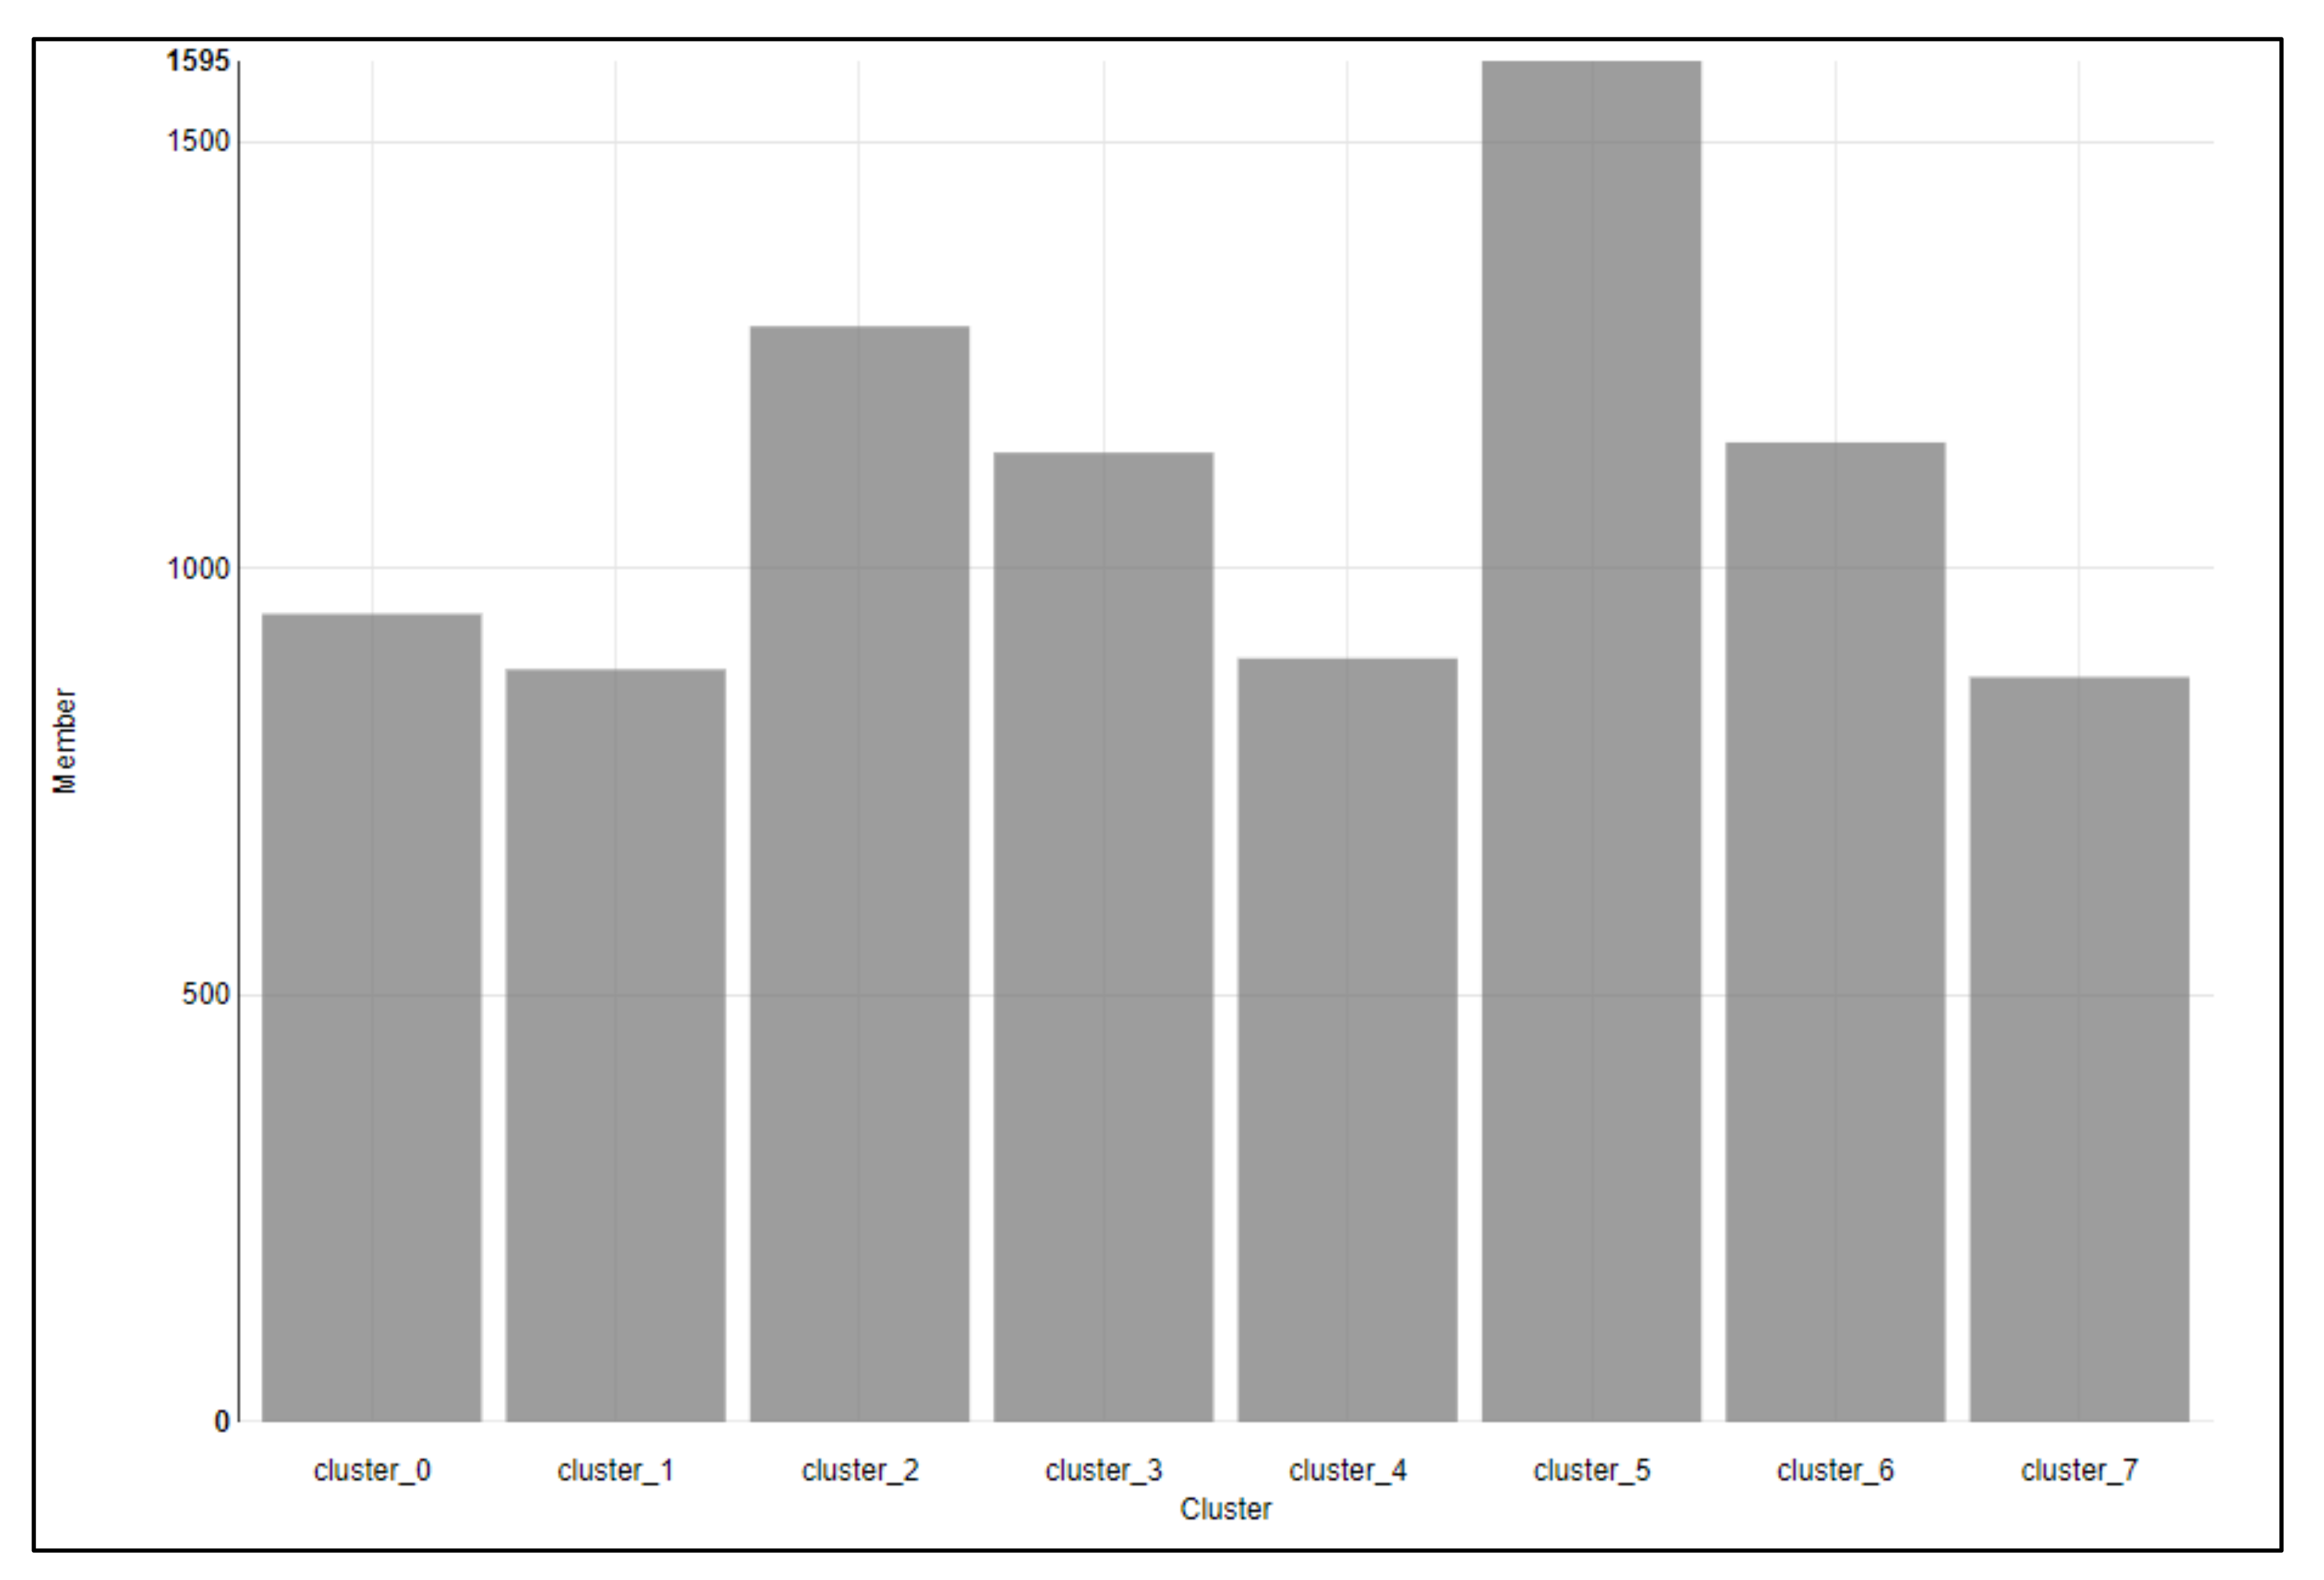
  • Second Stage (Data Clustering with FCM): our novel approach includes clustering data of an entire period, i.e., for 365*24 (8760 H) of 2019. The clustering analysis is an unsupervised method that behaves as a keystone in data analysis developments, which is especially helpful in an irregular patterns dataset. For that, FCM clustering was used to discover a set of homogeneous patterns in a heterogeneous load dataset [30]. The number of eight cluster groups that share the same characteristics in load was appropriate for the entire period, where each data input (value) is assigned, a likelihood score appropriate to that cluster. The formula of FCM is given in Equation (1) [30]. Figure 16 shows the cluster group membership.
J U ,   V = i = 1 N k = 1 C U i , k m   D i , k 2
where:
  • Xi = {X1, X2, , Xn}: the input value
  • U i , k is the membership value of the element Xi in a cluster with center Vk, 1 ≤ iN; 1 ≤ kC
  • The bigger U i , k is, the higher the degree of confidence that the element Xi belongs to the cluster k.
  • m is the fuzzification coefficient of the algorithm.
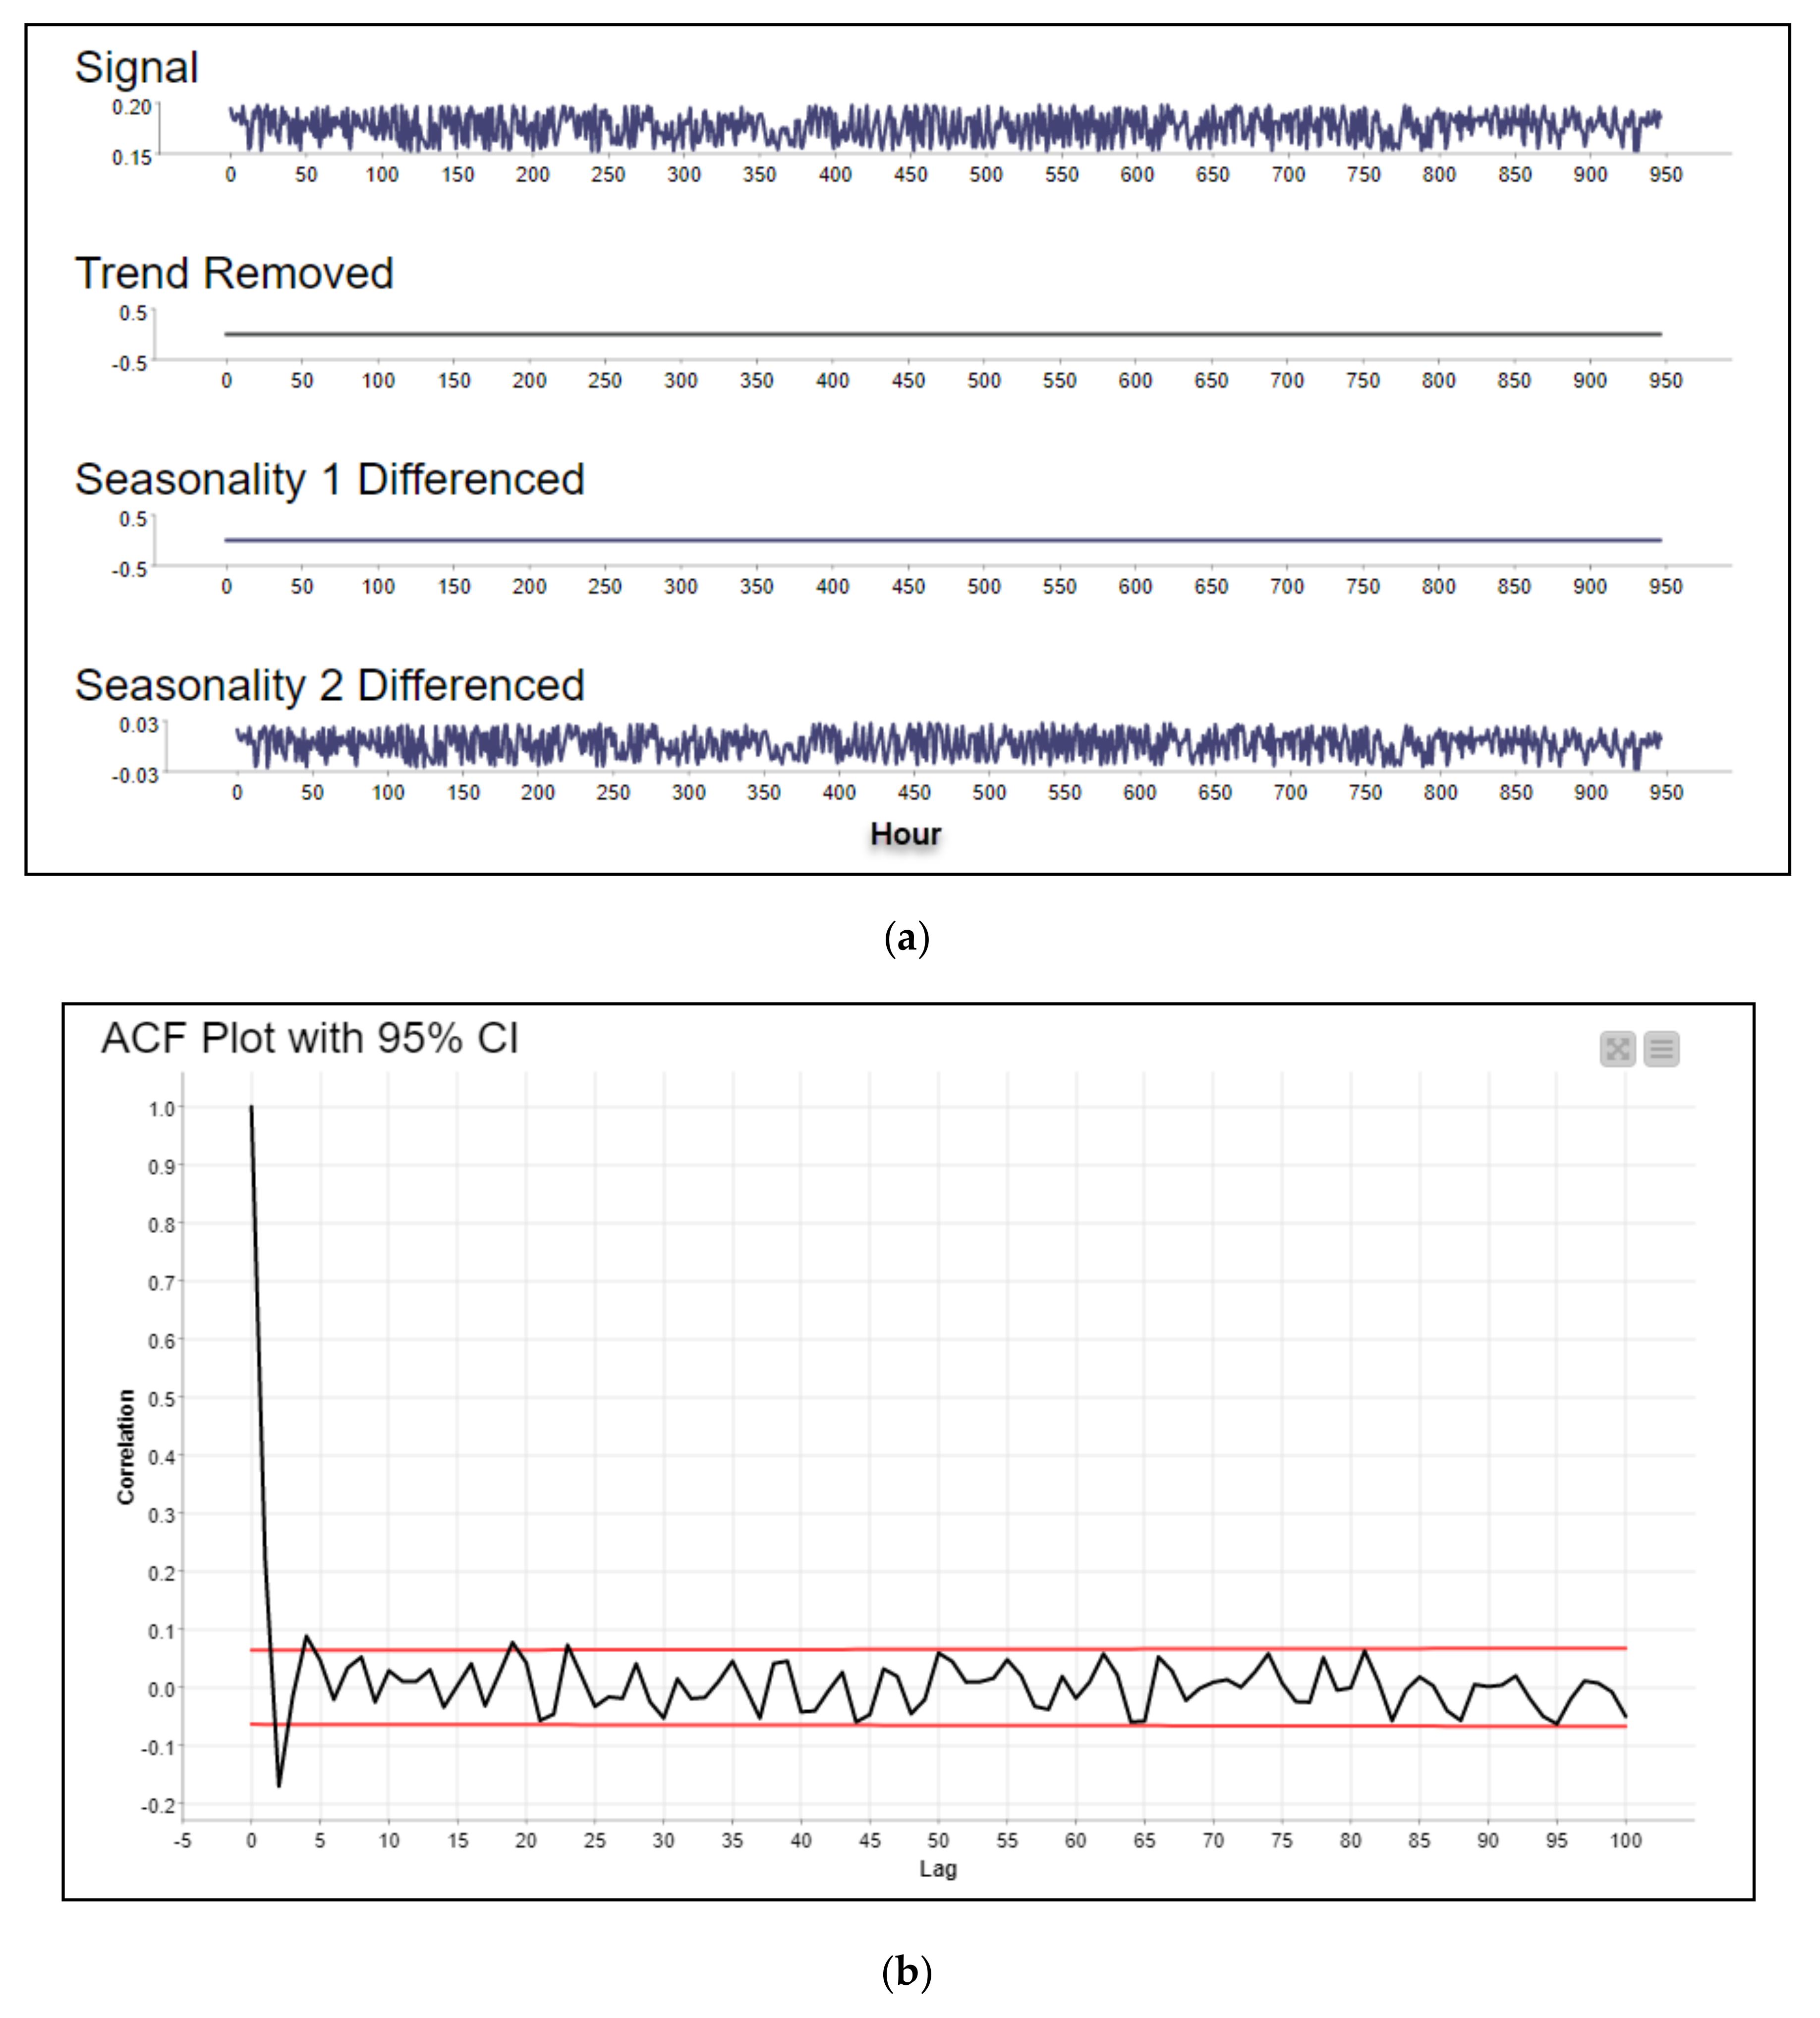
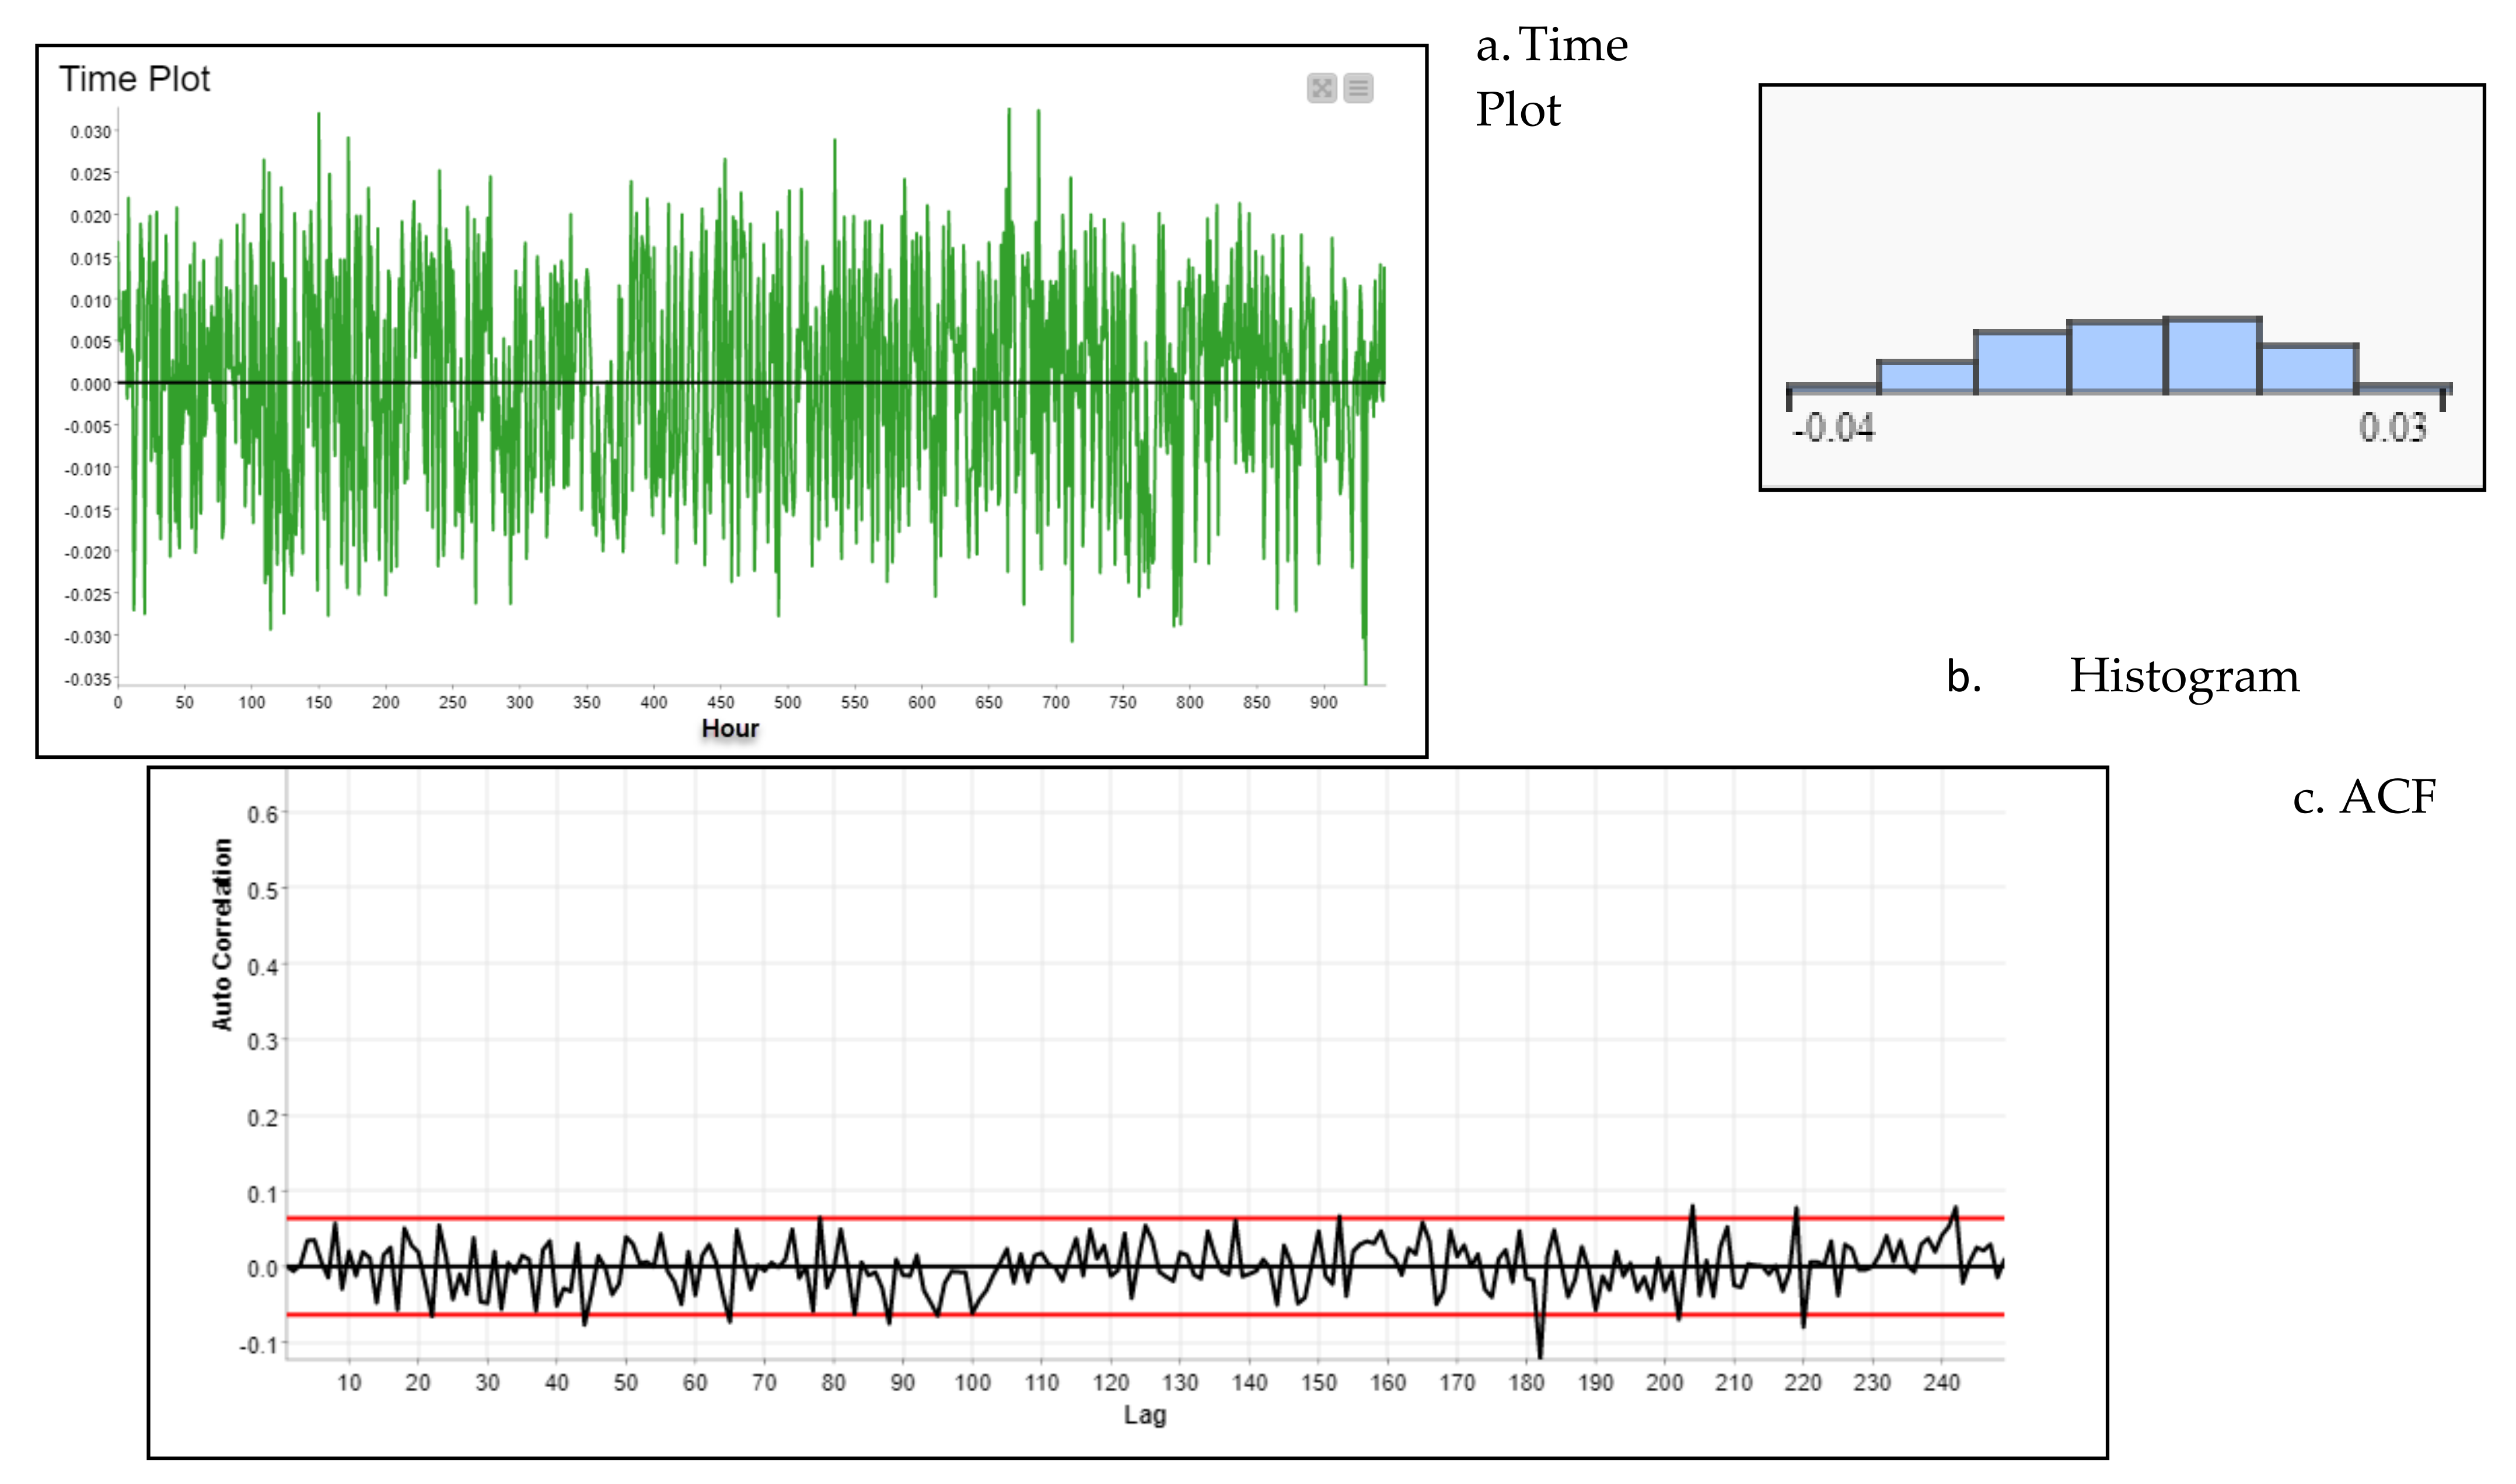
  • Third Stage (Signal Decomposition): to provide a good benchmark for our forecasting, the seasonality inspection and a decomposition signal model have been applied to each cluster. A decomposition signal is a process of extracting the information from the reading value data over time ( y t ), into a much smaller component, such as (i) seasonality ( S t   ), which represents the major spike in the autocorrelation of the data over time, (ii) trend ( T t ), from fitting a regression model of data over time, and (iii) residual ( R t ), the component for further analysis, which represents the remaining data over time (Equation (2)). The knime auto decomposition signal (loess regression) was applied with max observation lags of 100, lag step of 1, and correlation cut-off value of 0.5. This will automatically check the tested signal for trend, seasonality, and the residual. We can inspect seasonality in a time series in an Autocorrelation Function (ACF) and Partial Autocorrelation Function (PACF). The regular and unregular peaks in the plot can give information about seasonality, which can be eliminated by differencing the data at the lag with the highest correlation. An example from Cluster 0 can be seen in Figure 17a–c to show the decomposition signal, ACF and PACF, respectively.
y t = S t   + T t + R t
  • Fourth Stage (ARIMA Model): After observation and removing the trend ( T t ) and seasonality ( S t ) from our main signal, the residual ( R t ) will pass to the next node which is used as the training data for the forecasting model. The ARIMA models have been used to forecast a given time series dataset based on its historical values. As we have one year period in an hourly based time stamp, our proposed model can predict the load of one value which represents one hour ahead, or one day ahead, 24 h value, or one week ahead, 168 h value, etc. The time, date, or period that needs to be forecast can be controlled before the ARIMA model is applied. Cases such as a certain day or a certain period must be considered along with selecting the right cluster that they belong to. An ARIMA consists of two parts: an autoregressive (AR) model where the variable depends only on its lags, and a moving (MA) model [34] that combines the dependence between observation and residual of the forecast errors. ARIMA is written with the notation ARIMA (p,d,q), where ‘p’ represents the number of lag observations, ‘d’ represent the number of differences necessary to make the dataset stationary, and ‘q’ represents the size of the moving average window. The formula of ARIMA is given in Equation (3).
Y t = c + 1 Y t 1   + + p Y t p   + θ 1   e t 1 + + θ q   e t q + e t
where:
  • p = is the order of the autoregressive part.
  • q = is the order of the moving average part.
  • c = constant.
  • et = residuals (error in time t).
The process of choosing the appropriate values for the ARIMA model (p,d,q) parameters is very important since all the prediction values will depend on these values. To find the best ARIMA (p,d,q) parameters for this dataset, we fit different ARIMA models using auto function and select the model with the minimum Akaike Information Criteria (AIC) value. The AIC is an estimator of the relation quality of statistical models for a given dataset. Table 7 shows the parameters (p,d,q) of the best fit model for each cluster training dataset, where it was calculated using the auto.arima function in a Python programming language. A lower AIC value indicates a better fit model. When the series is found to be stationary (by using the auto.arima function), then the “d” parameter can be chosen to be zero in the ARIMA model.
The auto.arima function is valuable for the following reasons: the forecasting process needs a fast and flexible performance process on a daily, weekly, or monthly basis, and it need advance experience by the user to make sure it selects the appropriate value of these parameters. Furthermore, fitting a model normally takes heavy effort; the automated procedure is preferable to manual techniques for determining the proper value of these parameters (p, d, and q), which can result in more reliable forecasting results.
The next step is the analysis of the residuals of the ARIMA model by using a test such as ACF, Histogram, and Ljung–Box statistics to see if the residuals are white noise. Figure 18a–c show the analysis of the residuals of Cluster 0.
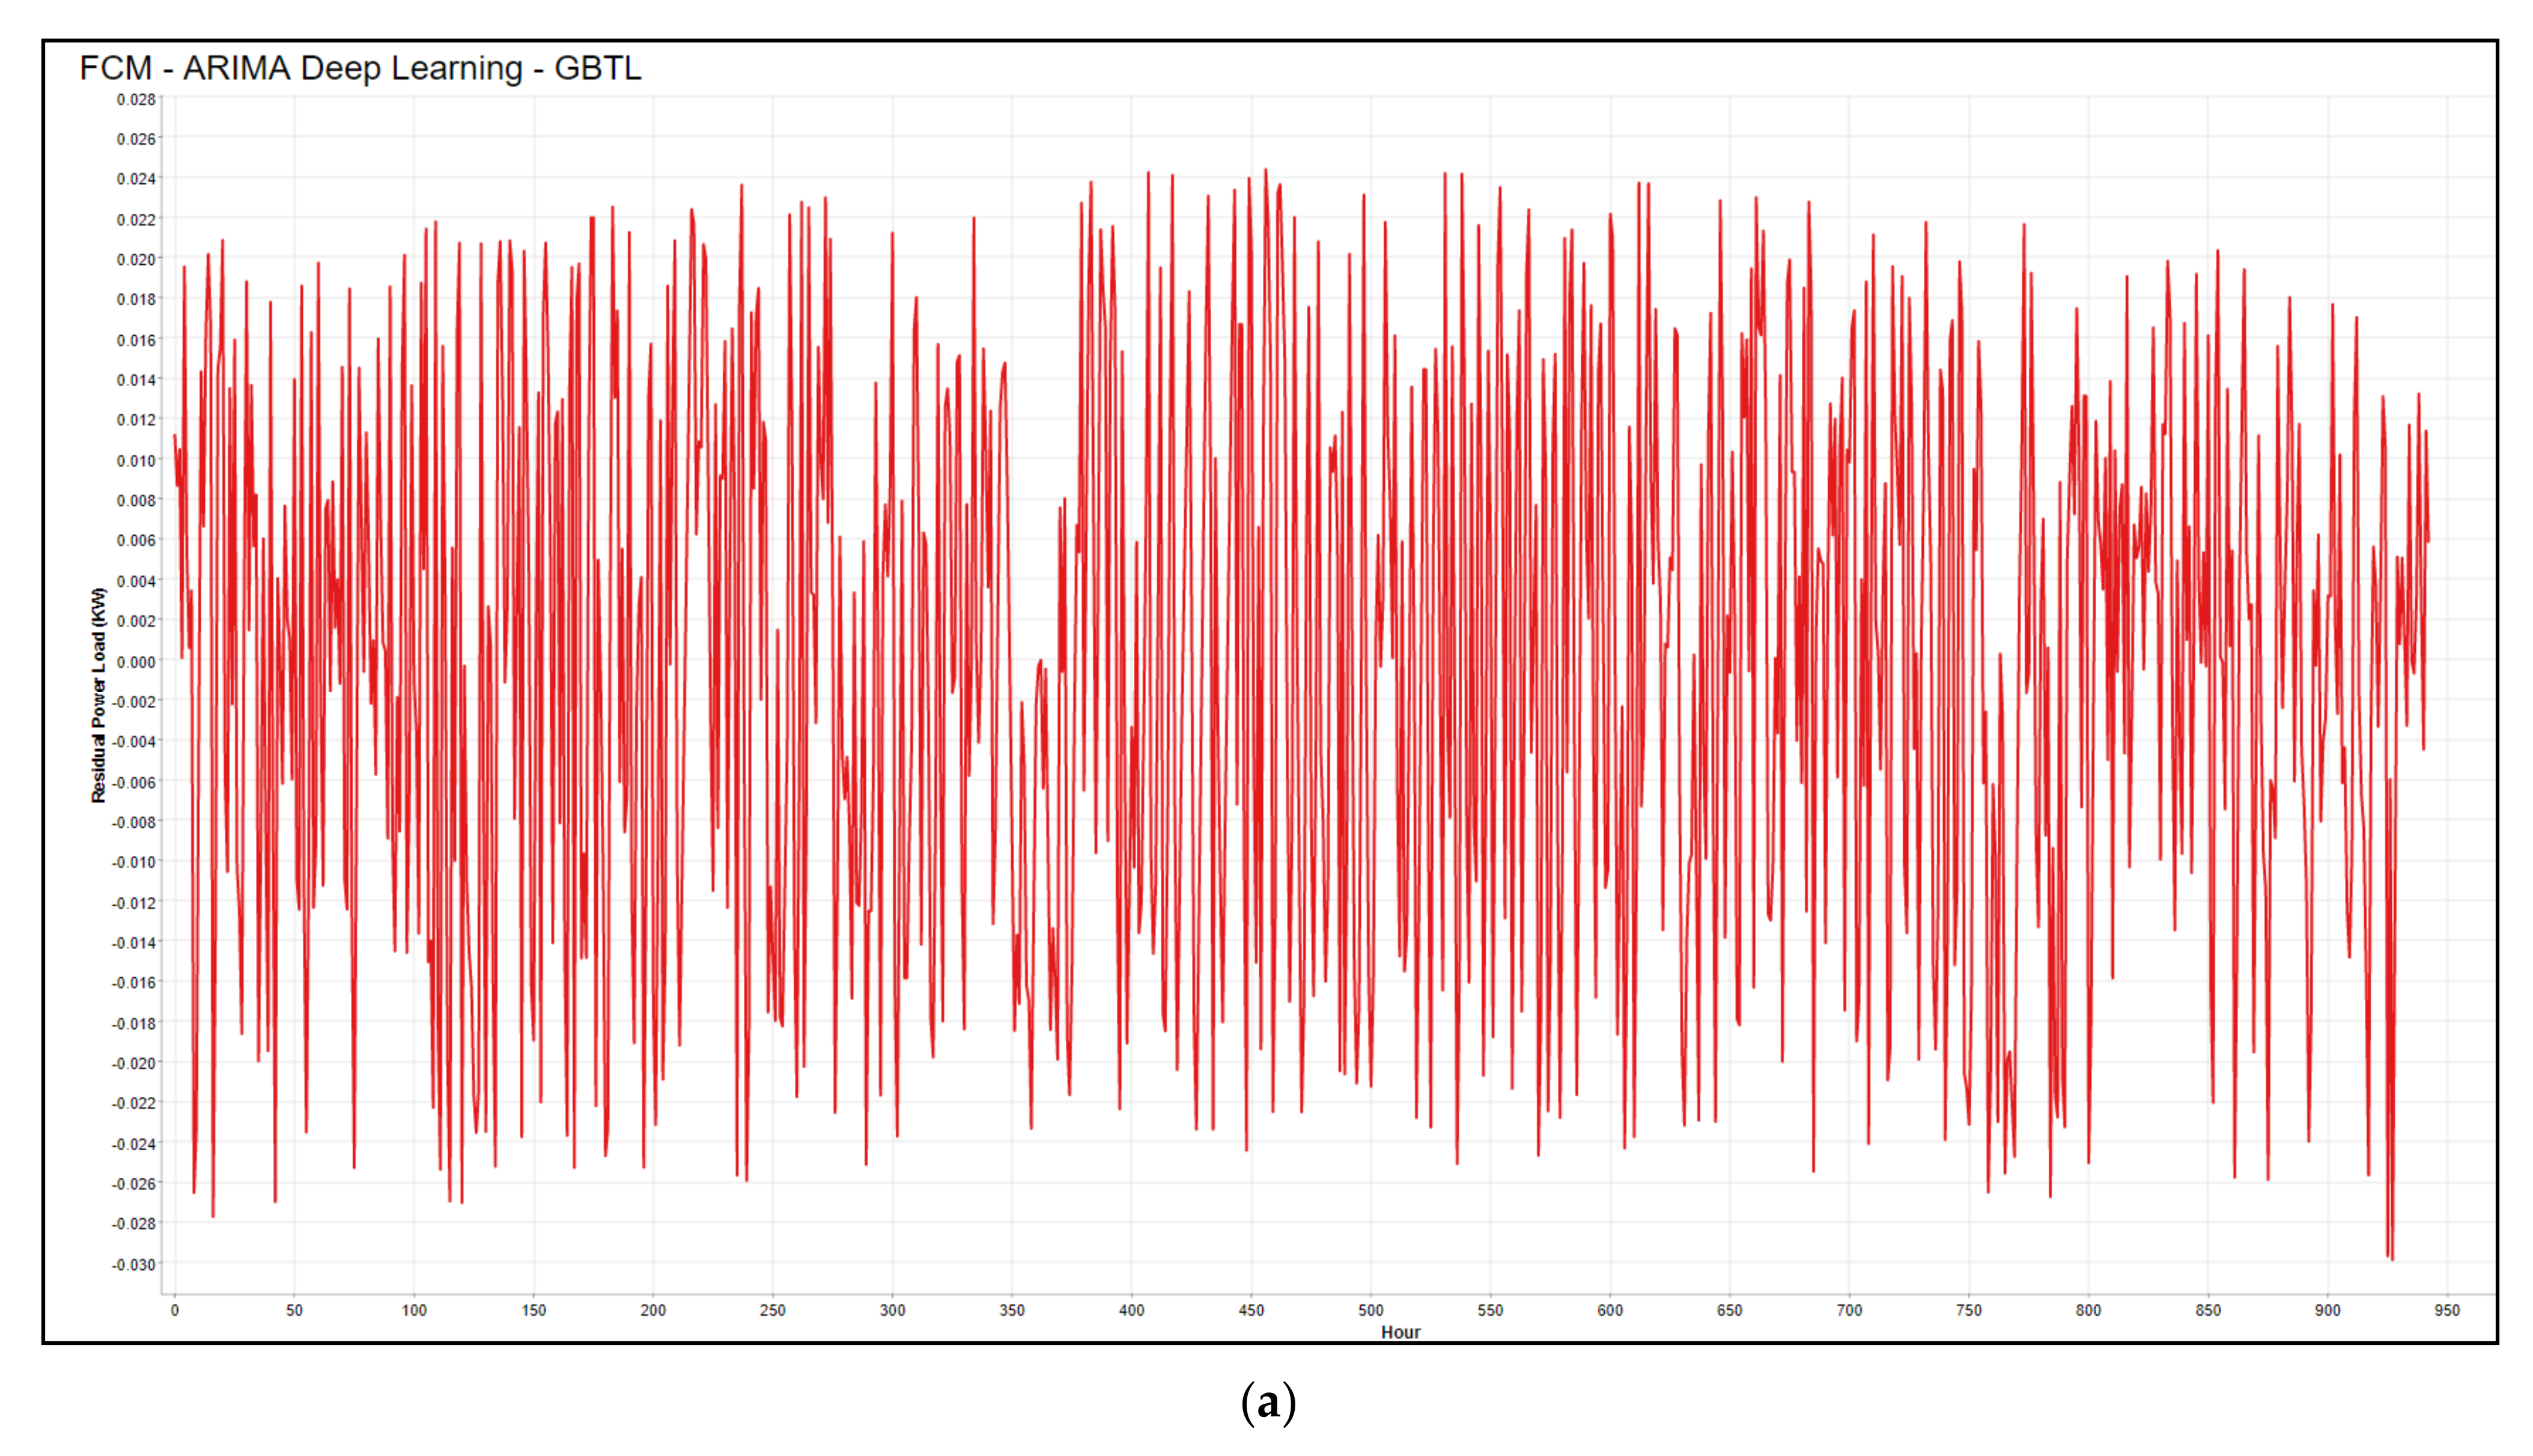
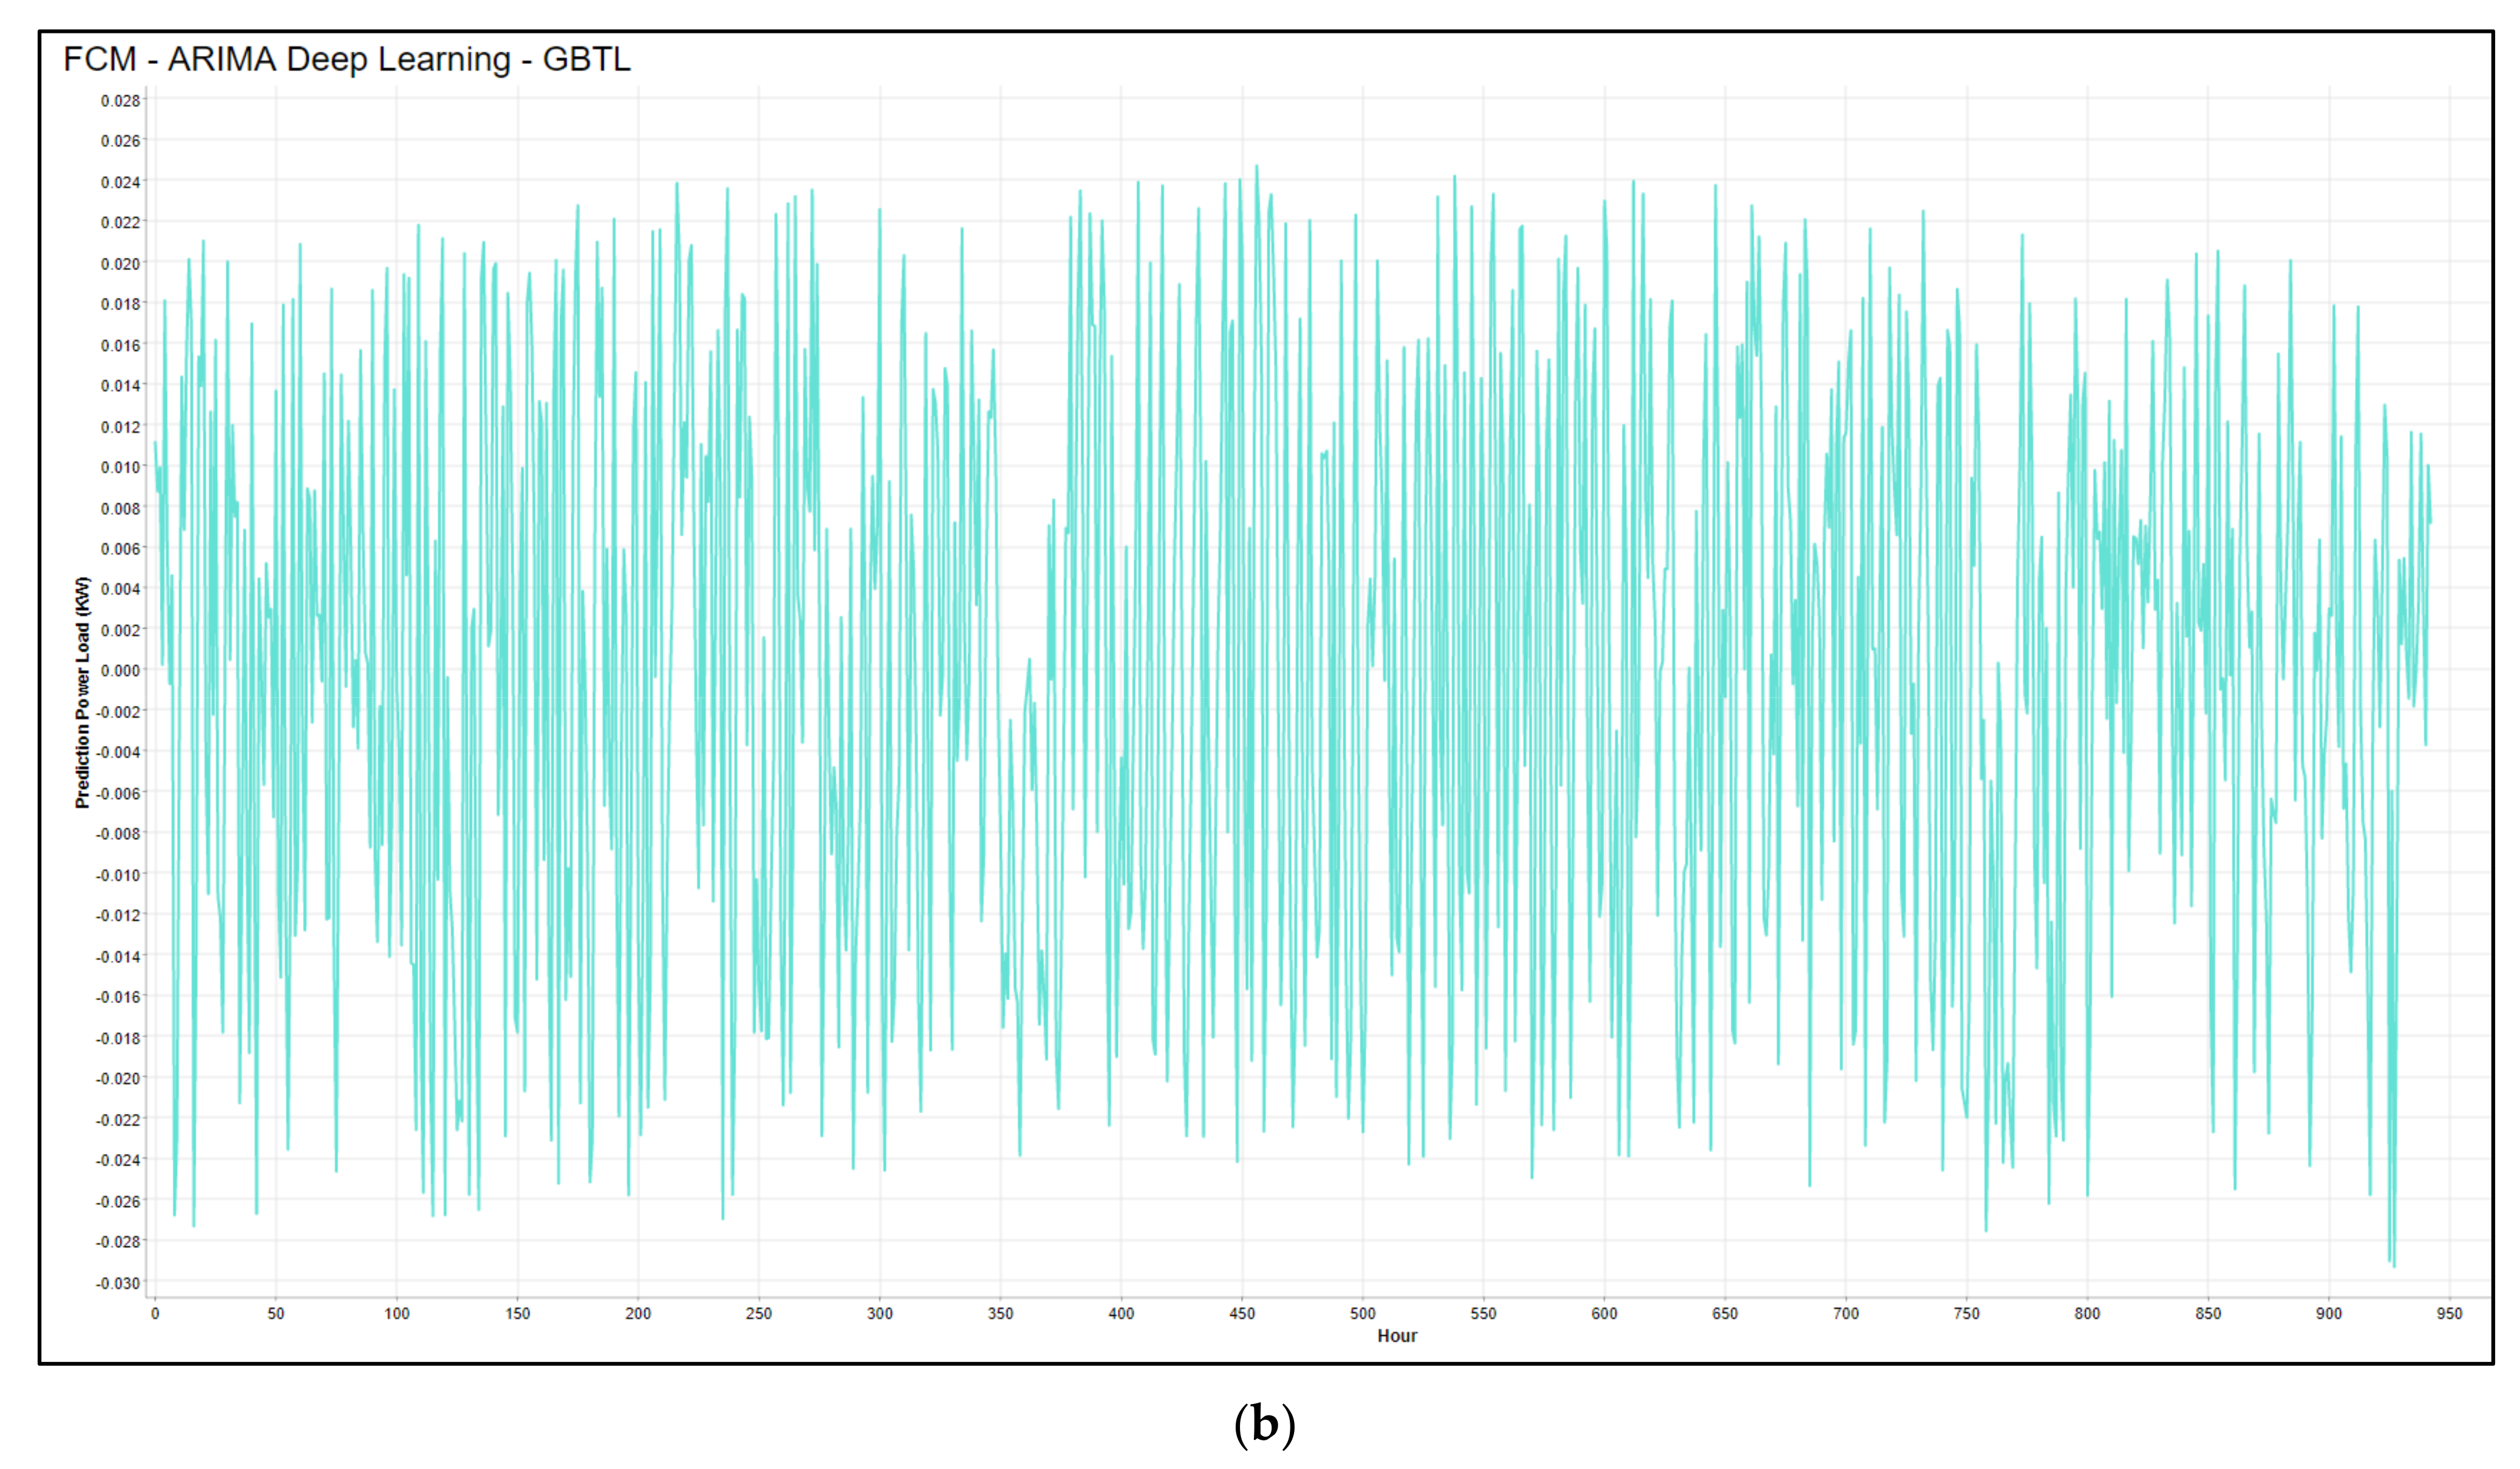
  • Fifth Stage (GBTL Model): the ARIMA model can only predict value based on its previous lags (historic data), while no other assumptions are considered, such as weather conditions or any other external factors. Therefore, external variables might improve the forecast accuracy. Consequently, the residuals error resulting from the previous step will pass to the GBTL model to be trained and predicted with external factors such as Maximum, Minimum, and Average Degree. The Gradient-Boosted Trees model has multiple X t T features to predict X t   . The target variable then adds to the predictor sequentially to ensemble data while following the same sequence to correct the preceding predictors [15]. The GBTL can be represented mathematically, as given in Equation (4).
X t   = X t   +     δ   Σ   X t T X t   2 / δ   X t    
where:
X t T = the target values, X t   = the prediction values and ∝ = learning rate
The gradient-boosting model is supportive in our case, as it is an easy-to-read algorithm and gives efficient interpretations. The GBTL prediction result for the residuals error will be added to the load predicted using ARIMA as given in Equation (5). Figure 19a,b show the actual and the forecasting load of cluster 0. The proposed method tested using the Knime analytic platform using a computer with an Intel CPU Core i7-7500U 2.7 GHz and 16 GB RAM. The execution time of the proposed model was around 30 s.
F t = Y t + X t
where:
  • F t = the overall forecasting results.
  • Y t = the forecasting result from the ARIMA model.
  • X t = the forecasting result from the GBTL model.
The observations from Figure 19a,b show a perfect match between the actual load and the forecasting load, and this is an indication of the high accuracy of the proposed mode, and that the dependence on external factors such as weather conditions enhance the improvement of the forecasting model invariably.

6.1.2. Model Evaluation

After training a model, the next step is scoring the model to evaluating the proposed model. This evaluation, conducted by computing various statistics such as the Mean Absolute Percentage Error (MAPE), was calculated using the formula shown in Equation (6), where an MAPE value (<10) means highly accurate forecasting, MAPE between (10 and 20) means good forecasting, MAPE value between 20 and 50 reasonable forecasting, and MAPE higher than (50) mean weak forecasting [35]. In addition, a Mean Absolute Error (MAE) to measure inaccuracy in the data was used. The difference between actual values and accurate values is known as the absolute error, and the average of these absolute errors is known as the mean absolute error [66,67]. It can be calculated using the formula shown in Equation (7). Moreover, the Mean Squared Error (MSE) was used to measure the difference between prediction and the actual value, the average of the squared absolute errors. It is calculated by first squaring the absolute error and then taking their average [66]. The formula is shown in Equation (8). Additionally, Root Mean Squared Error (RMSE) is used to measure the error between the actual data and the model of estimation [54,55,56,57,58,59,60,61,62,63,64,65,66]. It is calculated by simply taking the root of MSE. It can be calculated using the formula shown in Equation (9).
MAPE = Σ p i r i p i × 100 % n
MAE = Σ p i r i n
MSE = Σ p i r i 2 n
RMSE = Σ p i r i 2 n 2
where:
  • n = number of times the summation iteration happens.
  • pi = actual value.
  • ri = forecast value.
For a comprehensive study, the same dataset is trained and predicted using the ARIMA model and GBTL independently. Table 8 shows the three-model evaluation, i.e., the Proposed Hybrid Model, ARIMA, and GBTL where MAPE, MAE, and RMSE were used to evaluate the process. The results show that our proposed model gives better results where lower MAPE is obtained. It can be concluded that the proposed methods have the highest accuracy. Additionally, very low values can be observed in MAE and RMSE to indicate a high forecasting accuracy.

7. Conclusions

The current grid system in developing countries still has many limitations, such as manual data collection, leading to data uncertainty. Moreover, the dataset obtained from MOELC could only access the governorate level in the distribution section. Currently, the cluster information is not available to the Iraqi MOELC. Our PIAS was presented to perform different roles, such as data acquisition, data federation, data management, data visualization, data analytics, and load forecasting. This system considers the potential use of smart meters in the future, where the cost will be very high without prior planning or preparing an advanced system to deal with the massive digital transformation and big data. Moreover, big data analytics has a prospective opportunity to solve many challenges, especially in developing countries. Meanwhile, the integration between data federation and big data analytics in smart grids (SG) could boost growth in the energy sector and reduce expenses, time, and effort, and enhance and develop knowledge in this sector. The PIAS is designed on top of a series of operations that preceded it, such as data quality of heterogeneous data collected from different sources. Different techniques based on real datasets were used to verify and validate the PIAS system.
The first presented case study confirmed that the proposed system can be used to overcome challenges such as heterogeneous data acquisition and data federation. The second presented case study introduced a novel hybrid load forecasting model using fuzzy C-means clustering before applying ARIMA and the Gradient-Boosted Tree Learner model (FCM-ARIMA-GBTL). The proposed model improves the load forecasting performance in terms of Mean Absolute Percentage Error (MAPE), Mean Absolute Error (MAE), and Root Mean Squared Error (RMSE) rather than when using the ARIMA or GBTL model alone. Additionally, this study can be expanded in the future to override many other challenges such as reducing power loss and monitoring loss and thefts between generation, transportation, and distribution lines. Although maintaining simplicity is an advantage in a time-series dataset, it is also possible to perform many other artificial intelligence models such as Recurrent Neural Network (RNN), long short-term memory (LSTM), and Support Vector Machine (SVM).

Author Contributions

Conceptualization, R.N.; Methodology, A.A., N.F.A. and A.A.-S.; Software, A.A.; Supervision, N.F.A. and A.A.-S.; Writing—review and editing, N.F.A., A.A.-S. and A.H.M. All authors have read and agreed to the published version of the manuscript.

Funding

This research received funding from the Malaysian Ministry of Higher Education grant FRGS/1/2018/ICT03/UKM/02/3.

Institutional Review Board Statement

Not applicable.

Informed Consent Statement

Not applicable.

Data Availability Statement

The data presented in this study are available on request from the corresponding author. The data are not publicly available due to Iraqi MOELC Policies.

Acknowledgments

A. Albayati would like to thank the Iraqi Ministry of Higher Education and the Ministry of Electricity for their support of this research.

Conflicts of Interest

The authors declare no conflict of interest.

References

  1. Jiang, H.; Wang, K.; Wang, Y.; Gao, M.; Zhang, Y. Energy big data: A survey. IEEE Access 2016, 4, 3844–3861. [Google Scholar] [CrossRef]
  2. Wu, J.; Guo, S.; Li, J.; Zeng, D. Big data meet green Challenges: Big data toward green applications. IEEE Syst. J. 2016, 10, 888–900. [Google Scholar] [CrossRef]
  3. He, F.; Zhou, J.; Mo, L.; Feng, K.; Liu, G.; He, Z. Day-ahead short-term load probability density forecasting method with a decomposition-based quantile regression forest. Appl. Energy 2020, 262, 114396. [Google Scholar] [CrossRef]
  4. Jeong, S.-Y.; Kim, J.-W.; Joo, H.-Y.; Kim, Y.-S.; Moon, J.-H. Development and Application of a Big Data Analysis-Based Procedure to Identify Concerns about Renewable Energy. Energies 2021, 14, 4977. [Google Scholar] [CrossRef]
  5. Refaat, S.S.; Mohamed, A.; Abu-Rub, H. Big data impact on stability and reliability improvement of smart grid. In Proceedings of the 2017 IEEE International Conference on Big Data (Big Data), Boston, MA, USA, 11–14 December 2017; pp. 1975–1982. [Google Scholar]
  6. Alahakoon, D.; Yu, X. Smart Electricity Meter Data Intelligence for Future Energy Systems: A Survey. IEEE Trans. Ind. Inform. 2016, 12, 425–436. [Google Scholar] [CrossRef]
  7. Hasan, M.K.; Ahmed, M.M.; Hashim, A.H.A.; Razzaque, A.; Islam, S.; Pandey, B. A Novel Artificial Intelligence Based Timing Synchronization Scheme for Smart Grid Applications. Wirel. Pers. Commun. 2020, 114, 1067–1084. [Google Scholar] [CrossRef]
  8. Al-Turjman, F.; Abujubbeh, M. IoT-enabled smart grid via SM: An overview. Future Gener. Comput. Syst. 2019, 96, 579–590. [Google Scholar] [CrossRef]
  9. Mosavi, A.; Bahmani, A. Energy Consumption Prediction Using Machine Learning: A Review. Preprints 2019. [Google Scholar] [CrossRef]
  10. Ayob, A.; Salim Reza, S.M.; Hussain, A.; Saad, M.H.M.; Amin, N. Cyber vulnerabilities in smart grid and safety measures for energy meters in advanced metering system and smart meter communications. Int. J. Adv. Trends Comput. Sci. Eng. 2019, 8. [Google Scholar] [CrossRef]
  11. Strasser, T.; Siano, P.; Ding, Y. Methods and Systems for a Smart Energy City. IEEE Trans. Ind. Electron. 2019, 66, 1363–1367. [Google Scholar] [CrossRef] [Green Version]
  12. Salam, A.; Hibaoui, A. Comparison of Machine Learning Algorithms for the Power Consumption Prediction—Case Study of Tetouan city–. In Proceedings of the 2018 6th International Renewable and Sustainable Energy Conference (IRSEC), Rabat, Morocco, 5–8 December 2018. [Google Scholar]
  13. Istepanian, L. Iraq’s Draft Electricity Law: What’s Right, What’s Wrong? Brookings. 2019. Available online: https://www.brookings.edu/research/iraqs-draft-electricity-law-whats-right-whats-wrong/ (accessed on 15 September 2020).
  14. IEA. Iraq’s Energy Sector. International Energy Agency. 2019. Available online: https://www.connaissancedesenergies.org/sites/default/files/pdf-actualites/Iraq_Energy_Outlook.pdf (accessed on 12 November 2020).
  15. Guerrero, J.I.; García, A.; Personal, E.; Luque, J.; León, C. Heterogeneous data source integration for smart grid ecosystems based on metadata mining. Expert Syst. Appl. 2017, 79, 254–268. [Google Scholar] [CrossRef]
  16. Kaur, D.; Aujla, G.S.; Kumar, N.; Zomaya, A.Y.; Perera, C.; Ranjan, R. Tensor-Based Big Data Management Scheme for Dimensionality Reduction Problem in Smart Grid Systems: SDN Perspective. IEEE Trans. Knowl. Data Eng. 2018, 30, 1985–1998. [Google Scholar] [CrossRef] [Green Version]
  17. Nepal, B.; Yamaha, M.; Yokoe, A.; Yamaji, T. Electricity load forecasting using clustering and ARIMA model for energy management in buildings. Jpn. Arch. Rev. 2020, 3, 62–76. [Google Scholar] [CrossRef] [Green Version]
  18. Sulandari, W.; Subanar; Lee, M.H.; Rodrigues, P.C. Indonesian electricity load forecasting using singular spectrum analysis, fuzzy systems and neural networks. Energy 2020, 190, 116408. [Google Scholar]
  19. Karthika, S.; Margaret, V.; Balaraman, K. Hybrid short term load forecasting using ARIMA-SVM. In Proceedings of the 2017 Innovations in Power and Advanced Computing Technologies (i-PACT), Vellore, India, 21–22 April 2017; pp. 1–7. [Google Scholar] [CrossRef]
  20. Knime Analytics Platform. Available online: https://www.knime.com/ (accessed on 14 September 2021).
  21. Grover, P. Gradient Boosting from Scratch. Medium. 1 August 2019. Available online: https://medium.com/mlreview/gradient-boosting-from-scratch-1e317ae4587d (accessed on 10 November 2020).
  22. Vom Scheidt, F.; Medinová, H.; Ludwig, N.; Richter, B.; Staudt, P.; Weinhardt, C. Data Analytics in the Electricity Sector—A Quantitative and Qualitative Literature Review. Energy 2020, 100009. [Google Scholar] [CrossRef]
  23. Saleem, Y.; Crespi, N.; Rehmani, M.; Copeland, R. Internet of Things-Aided Smart Grid: Technologies, Architectures, Applications, Prototypes, and Future Research Directions. IEEE Access 2019, 7, 62962–63003. [Google Scholar]
  24. Zhan, J.; Huang, J.; Niu, L.; Peng, X.; Deng, D.; Cheng, S. Study of the key technologies of electric power big data and its application prospects in smart grid. In Proceedings of the 2014 IEEE PES Asia-Pacific Power and Energy Engineering Conference (APPEEC), Hong Kong, China, 7–10 December 2014; pp. 1–4. [Google Scholar]
  25. Zhang, Y.; Huang, T.; Bompard, E. Big data analytics in smart grids: A review. Energy Inform. 2018, 1. [Google Scholar] [CrossRef]
  26. Fahim, M.; Sillitti, A. Analyzing Load Profiles of Energy Consumption to Infer Household Characteristics Using Smart Meters. Energies 2019, 12, 773. [Google Scholar] [CrossRef] [Green Version]
  27. Sun, L.; Zhou, K.; Zhang, X.; Yang, S. Outlier Data Treatment Methods toward Smart Grid Applications. IEEE Access 2018, 6, 39849–39859. [Google Scholar] [CrossRef]
  28. Xia, H.; Zhao, M.; Chen, Y.; Wang, Z.; Yu, Z.; Yang, J. Multi-Source Heterogeneous Core Data Acquisition Method in Edge Computing Nodes. In Proceedings of the 2019 IEEE 43rd Annual Computer Software and Applications Conference (COMPSAC), Milwaukee, WI, USA, 15–19 July 2019. [Google Scholar] [CrossRef]
  29. Dhupia, B.; Usha Rani, M.; Alameen, A. The Role of Big Data Analytics in Smart Grid Management. In Emerging Research in Data Engineering Systems and Computer Communications; Venkata Krishna, P., Obaidat, M., Eds.; Advances in Intelligent Systems and Computing; Springer: Singapore, 2020; Volume 1054. [Google Scholar] [CrossRef]
  30. Bhattarai, B.P.; Paudyal, S.; Luo, Y.; Mohanpurkar, M.; Cheung, K.; Tonkoski, R.; Hovsapian, R.; Myers, K.S.; Zhang, R.; Zhao, P.; et al. Big data analytics in smart grids: State-of-the-art, challenges, opportunities, and future directions. IET Smart Grid 2019, 2, 141–154. [Google Scholar] [CrossRef]
  31. Rossi, B.; Chren, S. Smart Grids Data Analysis—A Systematic Mapping Study; Masaryk University: Brno, Czech Republic, 2019; pp. 1–26. [Google Scholar]
  32. Gnatyuk, V.I.; Kivchun, O.R.; Lutsenko, D.V. Digital platform for management of the regional power grid consumption. IOP Conf. Ser. Earth Environ. Sci. 2021, 689, 012022. [Google Scholar] [CrossRef]
  33. Ahmad, T.; Chen, H. A review on machine learning forecasting growth trends and their real-time applications in different energy systems. Sustain. Cities Soc. 2019, 54, 102010. [Google Scholar] [CrossRef]
  34. Mir, A.A.; Alghassab, M.; Ullah, K.; Khan, Z.A.; Lu, Y.; Imran, M. A Review of Electricity Demand Forecasting in Low- and Middle-Income Countries: The Demand Determinants and Horizons. Sustainability 2020, 12, 5931. [Google Scholar] [CrossRef]
  35. Babich, L.; Svalov, D.; Smirnov, A.; Babich, M. Industrial Power Consumption Forecasting Methods Comparison. In Proceedings of the 2019 Ural Symposium on Biomedical Engineering, Radioelectronics and Information Technology (USBEREIT), Yekaterinburg, Russia, 25–26 April 2019; pp. 307–309. [Google Scholar]
  36. Xu, M.; Qin, Z. A novel hybrid ARIMA and regression tree model for the interval-valued time series. J. Stat. Comput. Simul. 2020, 91, 1000–1015. [Google Scholar] [CrossRef]
  37. Sivarajah, U.; Kamal, M.; Irani, Z.; Weerakkody, V. Critical analysis of Big Data challenges and analytical methods. J. Bus. Res. 2017, 70, 263–286. [Google Scholar] [CrossRef] [Green Version]
  38. Marlen, A.; Maxim, A.; Ukaegbu, I.A.; Nunna, H.S.V.S.K. Application of Big Data in Smart Grids: Energy Analytics. In Proceedings of the 21st International Conference on Advanced Communication Technology (ICACT), Pyeongchang, Korea, 17–20 February 2019; p. 402. [Google Scholar]
  39. Samie, F.; Bauer, L.; Henkel, J. From Cloud Down to Things: An Overview of Machine Learning in Internet of Things. IEEE Internet Things J. 2019, 6, 4921–4934. [Google Scholar] [CrossRef]
  40. Michael, K.; Miller, K. Big Data: New Opportunities and New Challenges [Guest editors’ introduction]. Computer 2013, 46, 22–24. [Google Scholar] [CrossRef]
  41. Jain, P.; Gyanchandani, M.; Khare, N. Big data privacy: A technological perspective and review. J. Big Data 2016, 3, 25. [Google Scholar] [CrossRef] [Green Version]
  42. Li, J.; Zhao, Y.; Sun, C.; Bao, X.; Zhao, Q.; Zhou, H. A Survey of Development and Application of Artificial Intelligence in Smart Grid. IOP Conf. Ser. Earth Environ. Sci. 2018, 186, 012066. [Google Scholar] [CrossRef]
  43. Li-Baboud, Y.; Nguyen, C.; Weiss, M.; Anand, D.; Goldstein, A.; Allnutt, J.; Noseworthy, B.; Subramaniam, R. Timing Challenges in the Smart Grid, Special Publication (NIST SP); National Institute of Standards and Technology: Gaithersburg, MD, USA, 2017. Available online: https://0-doi-org.brum.beds.ac.uk/10.6028/NIST.SP.1500-08 (accessed on 14 October 2021).
  44. Joshi, A.V. Essential Concepts in Artificial Intelligence and Machine Learning. In Machine Learning and Artificial Intelligence; Springer: Cham, Switzerland, 2019; pp. 9–20. [Google Scholar]
  45. Albayati, A.; Abdullah, N.F.; Abu-Samah, A.; Mutlag, A.H.; Nordin, R. A Serverless Advanced Metering Infrastructure Based on Fog-Edge Computing for a Smart Grid: A Comparison Study for Energy Sector in Iraq. Energies 2020, 13, 5460. [Google Scholar] [CrossRef]
  46. Bi, J.; Yuan, H.; Tie, M.; Song, X. Heuristic virtual machine allocation for multi-tier Ambient Assisted Living applications in a cloud data center. China Commun. 2016, 13, 56–65. [Google Scholar] [CrossRef]
  47. Häberle, T.; Charissis, L.; Fehling, C.; Nahm, J.; Leymann, F. The Connected Car in the Cloud: A Platform for Prototyping Telematics Services. IEEE Softw. 2015, 32, 11–17. [Google Scholar] [CrossRef]
  48. Barik, R.K.; Dubey, H.; Samaddar, A.B.; Gupta, D.R.; Ray, P.K. FogGIS: Fog Computing for geospatial big data analytics. In Proceedings of the 2016 IEEE Uttar Pradesh Section International Conference on Electrical, Computer and Electronics Engineering (UPCON), Varanasi, India, 9–11 December 2016; pp. 613–618. [Google Scholar] [CrossRef] [Green Version]
  49. Birkin, M. Big Data Challenges for Geoinformatics. Geoinfor. Geostat. Overview 2012, 1, 1. [Google Scholar] [CrossRef] [Green Version]
  50. Tuaimah, F.M.; Abbas, H.M.A. Iraqi Short Term Electrical Load Forecasting Based On Interval Type-2 Fuzzy Logic. Int. J. Electr. Robot. Electron. Commun. Eng. 2014, 8, 1262–1268. [Google Scholar]
  51. Raak, F.; Susuki, Y.; Hikihara, T. Data-Driven Partitioning of Power Networks Via Koopman Mode Analysis. IEEE Trans. Power Syst. 2016, 31, 2799–2808. [Google Scholar] [CrossRef] [Green Version]
  52. IBM. IBM Knowledge Center. Ibm.com. 2019. Available online: https://www.ibm.com/support/knowledgecenter/en/SSAW57_8.5.5/com.ibm.websphere.nd.multiplatform.doc/ae/covr_3-tier.html (accessed on 14 November 2019).
  53. Kikuchi, S.; Matsumoto, Y. Impact of Live Migration on Multi-tier Application Performance in Clouds. In Proceedings of the 2012 IEEE Fifth International Conference on Cloud Computing, Honolulu, HI, USA, 24–29 June 2012; pp. 261–268. [Google Scholar] [CrossRef]
  54. Takahashi, N.; Tanaka, H.; Kawamura, R. Analysis of Process Assignment in Multi-tier mobile Cloud Computing and Application to Edge Accelerated Web Browsing. In Proceedings of the 2015 3rd IEEE International Conference on Mobile Cloud Computing, Services, and Engineering, San Francisco, CA, USA, 30 March–3 April 2015; pp. 233–234. [Google Scholar] [CrossRef]
  55. Alam, K.; El Saddik, A. C2PS: A Digital Twin Architecture Reference Model for the Cloud-Based Cyber-Physical Systems. IEEE Access 2017, 5, 2050–2062. [Google Scholar] [CrossRef]
  56. Liu, X.; Heo, J.; Sha, L. Modeling 3-tiered Web applications. In Proceedings of the 13th IEEE International Symposium on Modeling, Analysis, and Simulation of Computer and Telecommunication Systems, Atlanta, GA, USA, 27–29 September 2005; pp. 307–310. [Google Scholar] [CrossRef]
  57. Li, Y.; Yang, W.; Xu, Y. Multi-Tier Granule Mining for Representations of Multidimensional Association Rules. In Proceedings of the Sixth International Conference on Data Mining (ICDM’06), Hong Kong, China, 18–22 December 2006; pp. 953–958. [Google Scholar] [CrossRef] [Green Version]
  58. Qin, L.; Huang, T.; Zhang, H.; Gu, J. Development of archives management information system based on NET multi-tier architecture. In Proceedings of the 2009 3rd IEEE International Symposium on Microwave, Antenna, Propagation and EMC Technologies for Wireless Communications, Beijing, China, 27–29 October 2009; pp. 1210–1213. [Google Scholar] [CrossRef]
  59. Iraqi Ministry of Electricity (MOELC). Available online: https://www.moelc.gov.iq/ (accessed on 15 September 2021).
  60. Iraqi General Authority for Meteorology and Seismic Monitoring. Available online: http://meteoseism.gov.iq/ (accessed on 10 January 2021).
  61. Chu, X.; Ilyas, I.F.; Krishnan, S.; Wang, J. Data cleaning: Overview and emerging challenges. In Proceedings of the 2016 International Conference on Management of Data, San Francisco, CA, USA, 26 June–1 July 2016; pp. 2201–2206. [Google Scholar]
  62. Data Science. Understanding Descriptive Statistics. Medium. 2019. Available online: https://towardsdatascience.com/understanding-descriptive-statistics-c9c2b0641291 (accessed on 13 November 2019).
  63. Liu, X.; Heo, J.; Sha, L.; Zhu, X. Adaptive Control of Multi-Tiered Web Applications Using Queueing Predictor. In Proceedings of the 2006 IEEE/IFIP Network Operations and Management Symposium NOMS 2006, Vancouver, BC, USA, 3–7 April 2006; pp. 106–114. [Google Scholar] [CrossRef]
  64. Keim, D.; Qu, H.; Ma, K. Big-Data Visualization. IEEE Comput. Graph. Appl. 2013, 33, 20–21. [Google Scholar] [CrossRef] [Green Version]
  65. Donalek, C.; Djorgovski, S.G.; Cioc, A.; Wang, A.; Zhang, J.; Lawler, E.; Yeh, S.; Mahabal, A.; Graham, M.; Drake, A. Immersive and collaborative data visualization using virtual reality platforms. In Proceedings of the 2014 IEEE International Conference on Big Data (Big Data), Washington, DC, USA, 27–30 October 2014; pp. 609–614. [Google Scholar] [CrossRef] [Green Version]
  66. Shah, D.; Rajwade, A. Projection Design for Compressive Source Separation Using Mean Errors and Cross-Validation. In Proceedings of the 2019 IEEE International Conference on Image Processing (ICIP), Taipei, Taiwan, 22–25 September 2019; pp. 2035–2039. [Google Scholar] [CrossRef]
  67. Vandeput, N. Forecast KPI: RMSE, MAE, MAPE & Bias. Medium. 2019. Available online: https://medium.com/analytics-vidhya/forecast-kpi-rmse-mae-mape-bias-cdc5703d242d (accessed on 15 February 2021).
Figure 1. PIAS Tiers Diagram.
Applsci 11 09600 g001
Figure 2. PIAS Data Acquisition. (a) Acquisition Block Diagram. (b) Process Diagram.
Applsci 11 09600 g002aApplsci 11 09600 g002b
Figure 3. PIAS Data Analytics Process Flow.
Applsci 11 09600 g003
Figure 4. Data Cleaning and Pre-processing.
Applsci 11 09600 g004
Figure 5. Scatter Matrix as Visual Indicators.
Applsci 11 09600 g005
Figure 6. Main Dashboard of PIAS.
Applsci 11 09600 g006
Figure 7. Update Account Information on PIAS.
Applsci 11 09600 g007
Figure 8. Distribution of Population Density, Average of Rainfall Intensity, An Average of Maximum Temperature, and Consumption Read Value Over Different Iraqi Region.
Applsci 11 09600 g008
Figure 9. Dynamic Analysis of Rainfall Distribution and Minimum Temperature and Account Types Over Region and Months.
Applsci 11 09600 g009
Figure 10. Dynamic Analysis of The City of Baghdad.
Applsci 11 09600 g010
Figure 11. Dynamic Analysis of Basrah City.
Applsci 11 09600 g011
Figure 12. Dynamic Analysis of Nineveh (Mosul City).
Applsci 11 09600 g012
Figure 13. The Proposed Model.
Applsci 11 09600 g013
Figure 14. Daily Baghdad Governorate Load Distribution (KW) for 2019.
Applsci 11 09600 g014
Figure 15. (a) Hourly Baghdad Governorate Load Distribution (MW) in 24-Hour Box-plot; (b) Hourly Baghdad Governorate Load Distribution (KW) for 2019.
Applsci 11 09600 g015
Figure 16. Cluster Group Membership based on load values.
Applsci 11 09600 g016
Figure 17. (a) Signal, Trend, and Seasonality Differences of Cluster 0; (b) The Autocorrelation (ACF) of Decomposition Signal of Cluster 0; (c) The Partial Autocorrelation Function (PACF) of Decomposition Signal of Cluster 0.
Applsci 11 09600 g017aApplsci 11 09600 g017b
Figure 18. Analysis of The Residuals of Cluster 0.
Applsci 11 09600 g018
Figure 19. (a) The Actual Load (KW) of Cluster 0; (b) The Forecasting Load (KW) of Cluster 0.
Applsci 11 09600 g019aApplsci 11 09600 g019b
Table 1. Summary of Most Recent Short-Term Forecasting (STLF).
Reference Country Forecasting
Techniques
DatasetResult and Finding Limitations Accuracy
This workIraqA hybrid load forecasting model using fuzzy c-means clustering, ARIMA, and gradient-boosted tree model. (FCM-ARIMA-GBTL)Power consumption data, weather dataThe results showed high accuracy in load forecasting with the proposed method (FCM-ARIMA-GBTL) which gives improved MAPE, MAE, and RMSE achievement in comparison with other evaluated models such as ARIMA and Gradient Boosted Trees alone.The need for more historical
data to improve accuracy.
Presented in results section
Ref. [17], 2020JapanA hybrid model comprising a clustering technique and the Auto Regressive Integrated Moving Average (ARIMA) model.
(K-means—ARIMA)
Power consumption dataThe results show that a combination of clustering and the ARIMA model has proved to increase the performance of the forecasting model more accurately than that using the ARIMA model alone.Forecasting per hour per
day from 6 to 9 AM is used, which may cause uncertainty in the results due to an incomplete cycle.
MAPE = 2.7
Ref. [18], 2020IndonesiaA hybrid methodology—Linear Recurrent Formula (SSA-LRF) and Neural Networks (NN)Power consumption dataThe study showed ideal results, as it relies only on energy consumption data without indicating any external factors that may increase or decrease energy consumption.The performance in implementation of hybrid methodology Not provided
Ref. [3], 2019ChinaA hybrid method with a decomposition-based quantile regression forestPower consumption data, weather dataThe results show that the hybrid method can improve prediction accuracy and providing more prediction information.Not specifiedMAPE = 0.48
Ref. [19], 2018IndiaA hybrid Short Term Load Forecasting using ARIMA-SVM.Power consumption data, weather dataThe proposed ARIMA-SVM gives very good accuracy in STLF, especially if it was fed by external factors such as weather conditions. The need for more historical
data to improve the accuracy.
MAPE = 4.15
Ref. [35], 2019Russian FederationLong short-term memory (LSTM)
artificial neural networks (ANN), and support vector machine (SVM) regression
Power consumption dataThe results showed superiority for artificial neural networks (ANN), and support vector machine (SVM) regression for time series forecastingThe need to increase the amount of training data to improve prediction accuracyMAPE range from 0.11 to 0.54 for different periods
Ref. [36], 2020ChinaA hybrid ARIMA and regression tree (RT) models (ARIMA—RT).Interval-valued time-series dataset of the energy sector.The results show that the
ARIMA-RT model has a strong ability to capture the nonlinear part of the time-series dataset.
The period for which the model was applied was not sufficiently appropriateMAPE = 0.56
Table 2. Dataset Profile Information.
LanguageEnglish
Privacy Private
Source and Ownership Iraqi Ministry of Electricity (MOELC).
Sampling5,189,000 subscribers
Sampling After Data Cleaning 1,445,000 Active subscribers
Data Collection PeriodJanuary 2019 to September 2019
Database Type CSV and Microsoft SQL Database
Parameters9
Disc Size Around 3.5 GB
Table 3. Account information parameters.
ParametersDescriptions
GUIDUnique identifier—Primary Key
Acc. Num.Account Number
RegionAccount Province (Fifteen provinces in Iraq)—Lookup Table
Met. Num.Meter Number
Acc. TypeAccount Type (Household, Commercial, Agricultural, Unclassified, Governmental, Industrial)—Lookup Table
Sub. Num.Subscriber Number
PhaseNumber of Phase per Subscriber (Single-phase or Tri-phase)—Lookup Table
StatusMeter status: Open or Close—Lookup Table
Managed byManaged by (Managed by Local company, Managed by Ministry of Electricity)—Lookup Table
Table 4. Reading Information Parameters (Many to One).
ParametersDescription
GUIDUnique identifier—Primary Key
Account_ GUIDUnique identifier for each account (Many to one linked to Table 3)—Foreign Key
Read valueRead value
read dateDate of Each Reading
Maximum_TemperatureMaximum Temperature
Minimum_TemperatureMinimum Temperature
Daily_MeanDaily Mean
Average_RainfallAverage Rainfall
Averag_Rainy_DaysAverage Rainy Per Days
Average_Relative_HumidityAverage Relative Humidity
Table 5. Statistical Analysis of Dataset.
MinMaxMeanStd. DeviationVarianceSkewnessKurtosis
Read value (Energy consumption)36,83564,34451,896.45479.9730K+−0.580.50
T. max125432.7911.14124.18−0.26−1.31
Daily mean53923.9310.14102.78−0.28−1.41
T. min23017.698.4371.15−0.32−1.38
Av. rainfall011118.4627.21740.211.922.96
Av. Rainy days0102.612.898.370.73−0.64
Av. humidity207640.6319.55382.380.36−1.48
Sunshine hours192353283.6559.933592.02−0.27−1.44
Table 6. Power Load Dataset Profile Information.
LanguageEnglish
Privacy Private
Source and Ownership Iraqi Ministry of Electricity (MOELC).
SamplingOne Year for Baghdad Governorate (24 H*365 D)
Data Collection Period1 January 2019 to 31 December 2019
Database Type CSV
Parameters(Load value Per Hour, Max, Min, AV Degree Per days)
Disc Size Around 65 KB
Table 7. Akaike Information Criteria and Best ARIMA (p,d,q) for Each Cluster.
(p,d,q)AIC
Cluster 0(3,0,4)5518.749
Cluster 1(1,0,3)5252.404
Cluster 2(3,0,2)8001.193
Cluster 3(1,0,4)6900.293
Cluster 4(2,0,3)5301.737
Cluster 5(4,0,3)10,274.279
Cluster 6(3,0,1)7033.124
Cluster 7(4,0,2)5924.249
Table 8. The Model Evaluation.
Proposed Model
(ARIMA-GBTL)
ARIMA GBTL
Cluster 0
MAPE0.2982412541.5954700532.102847728
MAE0.0008024110.0109439980.009823649
RMSE0.0010401840.0130070150.012507055
Cluster 1
MAPE1.2689342924.5658982123.116166309
MAE0.0016817910.0100464620.01249306
RMSE0.0022701590.0122395790.014918207
Cluster 2
MAPE0.7259484492.227812362.675913816
MAE0.0008635620.0085801840.009404522
RMSE0.0011350380.0106762580.011427171
Cluster 3
MAPE0.3910790942.210319441.746144331
MAE0.0005066080.0097948270.010266868
RMSE0.0006577170.0115369680.012405158
Cluster 4
MAPE0.3190130422.0197495566.070942807
MAE0.000736050.0102645970.011093827
RMSE0.0009709410.012417230.013213787
Cluster 5
MAPE0.5516687862.6687323586.894689216
MAE0.0009292490.0080820020.008988616
RMSE0.0012262140.0096057950.010734888
Cluster 6
MAPE0.4122759841.9258890282.076377338
MAE0.0009679220.0093086340.009529595
RMSE0.001252750.0112498350.011664366
Cluster 7
MAPE0.1125222151.0892373431.144672198
MAE0.000429320.0057863120.005946305
RMSE0.0006613910.0080602030.008308765
Publisher’s Note: MDPI stays neutral with regard to jurisdictional claims in published maps and institutional affiliations.

