
Renal Ultrasound Elastography: A Review of the Previous Reports on Chronic Kidney Diseases


Division of Gastroenterology and Nephrology, Faculty of Medicine, Tottori University, Nishi-cho 36-1, Tottori 683-8504, Japan
*
Author to whom correspondence should be addressed.
Appl. Sci. 2021, 11(20), 9677; https://0-doi-org.brum.beds.ac.uk/10.3390/app11209677
Submission received: 24 September 2021
/
Revised: 8 October 2021
/
Accepted: 15 October 2021
/
Published: 17 October 2021
(This article belongs to the Special Issue Elastography and Applications)
Abstract
:The early detection of a kidney injury is essential to protect against the progression of kidney damage owing to the progressive nature of chronic kidney disease. A renal biopsy is the gold standard for the assessment of pathological alterations such as interstitial fibrosis and glomerulosclerosis. However, there are concerns regarding potential complications including bleeding and a reduction in renal function. Ultrasound elastography is an ideal modality for assessing the alterations in various organs and diagnosing malignant tumors. This technique has the potential to help detect early changes in renal function and pathological alterations. However, the careful application and interpretation of this technique in the kidney is required because of its complex hemodynamics and architecture. Shear wave elastography is the most widely investigated technique among ultrasound elastography. This review aims to summarize the previous investigations of the kidney using shear wave elastography, particularly for renal malignancy, kidney transplantation, and chronic kidney disease. Additionally, we have highlighted the influencing factors concerning the practical measurement of renal elasticity.
1. Introduction
The number of patients with chronic kidney disease (CKD) is increasing worldwide [1]. CKD is a risk factor for cardiovascular disease and the incidence rate of cardiovascular events increases with the progression of CKD [2]. Furthermore, CKD is progressive in nature, leading to end-stage renal disease [3]. Therefore, the early detection and management of CKD is needed. The clinical assessment of CKD relies on the glomerular filtration rate, which is estimated by the serum creatinine levels in most cases and urinary protein levels or albumin excretion rates. However, because the kidney has a compensatory mechanism in response to nephron loss, serum creatinine or urinary protein levels are not accurate indices for detecting early changes in CKD patients. Another issue requiring improvement in the clinical practice in patients with CKD is that renal pathological changes such as glomerulosclerosis, tubular atrophy, and interstitial fibrosis can be assessed only by a renal biopsy. A renal biopsy is also necessary to assess the alterations in transplanted kidneys; thus, it is an undisputed procedure for assessing renal damage and determining treatment strategies in the clinical practice of nephrology. However, a renal biopsy should be performed with a careful consideration of its benefits and potential complications such as hemorrhages and a loss of renal function. Several studies have investigated the potential benefits of serum or urinary markers in predicting renal histological changes or renal outcomes [4,5,6,7]. Additionally, a few methods to reduce the potential risk of renal biopsies have been proposed [8]. As there is no established method for assessing pathological changes without a renal biopsy, it has been clinically challenging to detect early changes in kidney injuries and to non-invasively assess the pathological changes.
Ultrasound elastography is a non-invasive technique for assessing tissue elasticity on the basis of the pathological and physiological principle that solid tumors or fibrotic tissues have different elasticities compared to normal tissues. Ultrasound elastography provides useful information and is convenient and non-invasive. Moreover, it has been validated in many clinical settings including liver disease, breast cancer, thyroid or parathyroid diseases, and pancreatic cancer [9,10,11,12,13,14]. Ultrasound elastography is a well-established and widely used technique for the non-invasive assessment of liver fibrosis in chronic liver disease [15,16]. Furthermore, the elastography value obtained using this technique correlated positively with the degree of hepatic fibrosis in patients with chronic hepatitis caused by hepatitis B and C virus infections [17]. In a meta-analysis, Lin et al. demonstrated that ultrasound elastography had a good diagnostic performance in non-viral hepatic diseases especially severe fibrosis [18]. For a better understanding of this technique, we have reviewed and summarized the clinical evidence for renal ultrasound elastography and the technical aspects necessary for its practical application.
2. Principles of Ultrasound Elastography
Ultrasound elastography can be classified into two techniques based on the physical quantity measured [19]. One of these is strain elastography where the compression of the target tissue induces tissue displacement; the displacement in the same direction as the compression is quantified. The target is manually compressed using an ultrasound transducer or an acoustic radiation force impulse (ARFI) [20]. The manual compression method can be applied only to superficial organs such as the breast and thyroid [19] owing to the poor transmission of the compression. Thus, this method may not be suitable for organs located deeper, including the kidneys. An ARFI employs a short-duration push-pulse from the transducer that is used to induce the tissue displacement.
The second technique is shear wave elastography (SWE). In SWE, tissue deformation induced by an ARFI or mechanical vibration by an ultrasound device generates a shear wave that propagates perpendicular to the push-pulse [21]. There are three approaches to generate a shear wave; point shear wave elastography (pSWE), two-dimensional shear wave elastography (2D-SWE), and one-dimensional transient elastography (1D-TE). pSWE uses an ARFI to generate the tissue displacement in a single focal location; the shear wave propagates perpendicular to the excitation and is then measured. The result of the pSWE is directly reported as the shear wave velocity (SWV) or converted to Young’s modulus E according to the equipment. Two-dimensional shear wave elastography (2D-SWE) is a newly invented technique using an ARFI. Instead of a single focal location in pSWE, 2D-SWE generates shear waves from multiple focal zones. This enables a real-time monitoring of the SWV or Young’s modulus in a relatively wide target region of interest (ROI) [19]. In contrast with the other two techniques, the 1D-TE technique uses physical vibrations from the transducer to generate the shear wave. The diagnostic accuracies for the tissue elasticity differ among the techniques. pSWE and 2D-SWE can accurately detect liver fibrosis compared to 1D-TE [19]. Although 1D-TE has been widely applied to the superficial organs such as the liver and thyroid, its usefulness seems to be limited in deeply located organs, especially the kidney. The tissue elasticity can be assessed by measuring the propagation speed of the shear waves. In general, the shear waves transmit faster in hard tissues and slower in soft tissues. The results of the tissue elastography can be reported as a shear wave speed (meters per second) or Young’s modulus (kilopascals) according to the ultrasound system. The equations for these parameters were well-described in a previous study [19]. The SWV correlated positively with the stage of fibrosis in chronic liver disease [9,21].
In reporting the results of tissue elasticity, the quality of the measurement needs to also be addressed. It is recommended in ultrasound liver elastography to report the number of the required acquisitions with at least ten measurements and the interquartile range-to-median ratio [22].
3. The Use of Renal Ultrasound Elastography
Ultrasound elastography of the kidney has been investigated in renal malignant tumors, transplanted kidneys, and native kidneys in patients with kidney diseases. Although several reports have used strain elastography, most of the previous reports on the kidney were based on SWE. The basic technical procedure of renal ultrasound elastography in the kidney is similar to that of other organs; however, several aspects specific to performing SWE on the kidney have been reported.
First, the target ROI must be carefully selected (Figure 1). Bob et al. investigated the potential factors influencing the results of the ARFI measurements. The depth of the ROI affects the SWV [23,24]. The push-pulse to induce shear waves tends to attenuate in deeply located tissues; thus, the elastography values correlate negatively with the depth of the ROI. Therefore, in contrast with the superficial organs such as the breast and thyroid, the depth of the ROI should be matched to the best extent. For this reason, it is preferable to perform SWE of the kidney with the patients placed in prone or unilateral positions. Most previous reports set the ROI at the renal cortex or parenchyma. It has been suggested that the measurement in the cortex is more reliable than in the medulla [25]. In patients with an impaired renal function, the kidneys show atrophic changes. The shortening of the kidney length and lessening of the parenchymal thickness in advanced kidney disease are widely recognized changes often observed by an abdominal ultrasound [26,27]. Although a careful determination of the ROI is required, the SWV can be measured reproducibly even in a patient with end-stage renal disease with a thin parenchymal thickness [28].
Breathing also needs to be considered whilst measuring the renal elasticity. Breathing does not affect the SWV in the liver [29]. However, because the kidney moves along with the breath, the SWV should be measured whilst the breath is held. In addition, a compression with an applied ultrasound transducer affects the SWV in the liver and kidney [30,31]. Therefore, the operator must carefully apply the transducer to minimize the pressure of the transducer to the best extent.
Third, the complexity of the renal structure must be considered. The anisotropy of the target organ influences the SWE results. Shear waves spread faster and slower parallel and perpendicular to the structure, respectively [32]. The renal parenchyma is anatomically divided into two compartments with different anatomical structures. The renal cortex contains glomeruli, proximal convoluted tubules, and distal convoluted tubules. The renal medulla contains the loop of Henle, collecting duct, and vasa recta. The structures in the medulla are organized and radially oriented whereas the structures in the cortex are unevenly distributed and oriented in a convoluted manner [33]. According to the principle of shear wave propagation, the elasticity values are low when the shear waves propagate perpendicular to the renal structure and parallel to the renal capsule. Therefore, the position of the ultrasound transducer and the direction of the kidney must be set under the same condition. Most previous studies on renal elasticity investigated renal parenchymal stiffness with the shear waves parallel to the renal capsule.
The other factor that influences the SWE results is the viscoelasticity of the tissue. Shear wave generation is attenuated in tissues with a high fluid composition. Considering the complex anatomical structure of the kidney, the ROI should be placed in an area without vasculature or cysts.
4. Ultrasound Elastography of a Renal Malignancy
The feasibility of ultrasound elastography for the assessment of renal neoplasms has been investigated in several studies. Tan et al. investigated the renal elasticities of 28 patients with angiomyolipomas and 19 patients with renal cell carcinomas. They reported that renal angiomyolipomas could be differentiated from renal cell carcinomas based on the elasticity patterns obtained using strain elastography [34]. Similarly, strain elastography revealed the differences between the strain index values of benign and malignant cells [35]. Others have investigated the usefulness of SWE in assessing renal masses. In a study with 197 patients with renal lesions, the SWV in renal cell carcinomas was significantly higher than that in angiomyolipomas and the tumor-to-cortex SWV ratio was significantly higher in patients with renal cell carcinomas [36]. Another study by Göya et al. investigated the ability to differentiate between benign and malignant renal tumors [37]. They showed that the SWVs in normal parenchyma were different from those in benign lesions, malignant tumors, and infectious lesions. Among them, the SWV in the hematoma was significantly lower than that in the adjacent renal parenchyma. The SWVs in malignant tumors were significantly higher than those in benign lesions. However, there were no significant differences between the SWVs of infectious and malignant tumors.
Although the SWV in renal malignant tumors tends to be higher than that in benign lesions and normal parenchyma, contradictory results have also been reported. Cai et al. investigated the elasticity in renal malignant masses with respect to the lesion size. They recruited patients with malignant and solid renal tumors < 4 cm. The elasticity values in the malignant masses, mostly composed of clear cell carcinomas, showed lower elasticity values compared to benign angiomyolipomas [38]. They suggested that the heterogeneity within the tumor influenced the SWE values. Clear renal cell carcinomas frequently present with cystic lesions such as a hemorrhage or necrosis causing decreased SWE values. Considering these results, the application of ultrasound elastography in differentiating renal solid lesions is limited.
5. Ultrasound Elastography of Transplanted Kidneys
Interstitial fibrosis, tubular atrophy, and glomerular sclerosis are important factors strongly associated with graft loss in transplanted kidneys [39]. The assessment of these pathological changes in transplanted kidneys relies on protocol biopsies; non-invasive modalities have not been established.
Several studies have investigated the usefulness of ultrasound elastography in transplanted kidneys. However, the relationship between the pathological changes, particularly in interstitial fibrosis and elasticity, is controversial. Stock et al. performed SWE in 18 patients who underwent a renal transplantation and investigated the association between renal elasticity and the Banff score or interstitial fibrosis [40]. They found a positive correlation between the SWV and the grade of fibrosis and the Banff score. Another study by Syversveen et al. also investigated the relationship between the SWV and the grade of fibrosis in patients who underwent a kidney transplantation. In 30 patients with renal transplants, the SWVs showed no significant differences with respect to the degree of fibrosis [41]. They further confirmed their observation by precisely eliminating the influence of ultrasound transducer compression. As a result, they revealed no correlation between the SWV and fibrosis [42]. The discrepancies between these reports could be explained by the variations in the histological changes and the time since the transplantation. The histological changes observed in the early phase are characterized by fibrogenesis and tubulointerstitial alterations due to immunologic reactions whereas interstitial fibrosis, tubular atrophy, and glomerular sclerosis can be observed in the late phase [43]. Most patients recruited in the two studies by Syversveen et al. were within one year after transplantation, which might reflect the early phase of the histological changes. Indeed, a stronger correlation between the chronic phase changes in the kidney and the SWV has been shown in a larger cohort [42]. Thus, the duration after transplantation and the heterogeneity of the histological changes should be considered when performing and interpreting the ultrasound elastography results. The variability in the SWE values obtained from transplanted kidneys has been discussed previously [44]. In a single-center prospective study on patients who underwent a renal transplantation, the SWE values in patients with renal allograft dysfunction were significantly higher than those in patients with a stable renal function. However, there was a significantly higher variability in patients with allograft dysfunction. A study by Kennedy et al. compared the diagnostic abilities of SWE and magnetic resonance elastography for detecting renal allograft dysfunction [45]. SWE could not differentiate between patients with a stable renal function and allograft dysfunction; in contrast, magnetic resonance elastography was a sensitive modality to predict allograft loss.
6. Ultrasound Elastography in Chronic Kidney Disease
CKD is a major public health concern. The prevalence of CKD and the number of patients requiring renal replacement therapy are increasing worldwide. As CKD leads to an increased risk of cardiovascular disease and end-stage renal disease, the early detection of kidney dysfunction and the prevention of CKD progression are crucial. Regardless of the etiology of kidney disease, glomerular sclerosis, tubular atrophy, and interstitial fibrosis dominate the progression of renal dysfunction. Therefore, the early detection of the pathological alterations would be an early marker of a decline in renal function. Conventional methods for the assessment of kidney disease mostly depend on the functional assessment of serum or urinary biomarkers and a morphological assessment by ultrasound, computed tomography, and magnetic resonance imaging. However, there are no established modalities for the detection or assessment of pathological changes except for a renal biopsy.
Ultrasound elastography is an alternative modality for the non-invasive assessment of pathological changes. Several reports have investigated the feasibility of ultrasound elastography in patients with kidney disease. SWE has been used in most previous investigations in the field of CKD (Table 2). However, previous studies that investigated the relationship between the SWV and renal function or the CKD stage are not consistent with each other. Guo et al. performed ARFI elastography in 64 patients with CKD and 327 healthy subjects and investigated the differences in the SWVs. They found that the SWVs in patients with CKD were significantly lower than those in healthy subjects [46]. Similarly, in 148 non-CKD and 227 CKD patients, renal elasticity tended to decrease in patients with advanced-stage kidney disease [47]. Although the etiology of CKD was not shown in their report, the decreasing trend of the SWV with the progression of renal dysfunction was also shown in other reports. In another study with 163 CKD patients, most of whom were diagnosed with glomerulonephritis, the SWV correlated positively with the glomerular filtration rate (GFR) [48]. Similarly, positive correlations between the SWV and renal function have been observed in patients with diabetic nephropathy and nephrosclerosis [49,50]. As interstitial fibrosis is often observed in patients with advanced kidney disease, these positive correlations between the SWV and renal function are the opposite of those observed in other organs such as the liver, with high SWVs in the advanced stage of fibrosis.
In contrast with these observations, negative correlations between the SWV and GFR were observed in CKD patients with diabetic nephropathy and glomerulonephritis [51,52]. In a study including patients with stage 3 to 4 CKD with diabetes mellitus, Hassan et al. reported an increased renal cortical stiffness in patients with kidney disease. In addition, the cortical stiffness correlated negatively with the estimated GFR [51]. Makita et al. investigated the association between renal elasticity and patient characteristics in those who underwent renal biopsies; renal stiffness correlated inversely with renal function [52]. Another study in 25 patients with CKD showed that the SWE values were higher in patients with CKD than in healthy subjects [53]. The SWV in patients undergoing hemodialysis was previously investigated. There were no significant differences in the SWVs between patients without kidney disease and those with end-stage renal disease [28]. Thus far, there is no consensus regarding the changes in renal elasticity according to the decline in renal function.
Among several factors that influence the results of SWE, one explanation for this discrepancy is the heterogeneity of the patient cohort. The patient age influences the SWV; the SWV tends to be higher in elderly subjects [46,52]. However, it has been demonstrated that age-adjusted SWVs in patients undergoing hemodialysis were not significantly different from those in patients without kidney disease [28]. Renal blood flow is another factor that influences the SWV. In a relatively large cohort of 319 patients with CKD, Asano et al. showed a significant correlation between the SWV and GFR when the effect of cardiac pulsation was minimized by performing the SWV measurement in synchrony with the cardiac cycle [50]. This positive correlation was observed in both the renal cortex and medulla. This observation was further confirmed by the negative correlation between the SWV and the brachial ankle pulse wave velocity. They further divided the patients according to their etiologies and investigated the positive correlations between the SWV and renal function. As a result, positive correlations between the SWV and estimated GFR were still observed in patients with diabetic nephropathy, nephrosclerosis, and glomerulonephritis. Another study investigated the SWVs in patients with atherosclerosis [54]. Patients with coronary artery disease (whose renal blood flow is supposed to be reduced) showed significantly lower SWVs compared to healthy subjects [54]. In addition, hypertension was an influencing factor for a high renal elasticity in patients with glomerulonephritis [52]. Considering these investigations, renal elasticity is—in part—influenced by renal hemodynamics. Although there have been no reports showing the exact correlations, SWE might be a suitable modality to distinguish hemodynamic-associated renal dysfunction such as nephrosclerosis or renal arterial infarction.
Various diseases can lead to renal dysfunction. However, the histological alterations observed in advanced kidney disease are quite similar regardless of the etiology of kidney disease. Therefore, a renal injury, particularly histological alterations, is one of the targets of renal elastography. Among the major histological changes often observed in advanced kidney disease including interstitial fibrosis, glomerular sclerosis, and tubular atrophy, correlations of the renal elasticity with interstitial fibrosis have been extensively investigated. Cui et al. showed that SWE values were significantly higher in patients with CKD who manifested mild or moderate fibrosis [55]. Similarly, Makita et al. reported positive correlations between the grades of fibrosis and the renal elasticity in patients who underwent a renal biopsy [52]. Based on the principle of the ultrasound elastography technique and the fact that the elasticity values increase with the degree of fibrosis in the liver [9,22], these positive correlations of the tissue elasticity and the degree of fibrosis observed in the kidney were as expected. However, other reports on renal elasticity have shown contradictory results. Wang et al. investigated the relationship between the SWV and the degree of fibrosis in patients with CKD mostly caused by glomerulonephritis. They found no significant correlation between the degree of interstitial fibrosis and the SWV [56]. They also reported no significant correlation between glomerulosclerosis and the SWV. Another report in patients who underwent a renal biopsy also showed that there was no correlation between the SWV and the degree of fibrosis or the degree of glomerulosclerosis [57]. As observed in transplanted kidneys, the variation in the histological alterations in patients with CKD affects the renal elasticity. A substantial degree of interstitial fibrosis is observed in patients with advanced kidney disease. Therefore, other microstructural changes occurring in the damaged kidney are likely to affect the renal elasticity. In patients who underwent a renal biopsy, the association between the SWV and nephron hypertrophic changes was investigated [57]. Nephron hypertrophy was assessed by measuring the glomerular density, glomerular volume, and tubular tuft area. The glomerular volume and tubular tuft area negatively affected the SWV, indicating that hypertrophic changes in both the glomeruli and renal tubules affect renal elasticity [57]. As these hypertrophic changes are often observed as compensation for nephron loss, these changes are simultaneously observed with interstitial fibrosis and glomerulosclerosis. In addition, hypertrophic changes in the glomeruli and renal tubules can be found in the kidneys without significant nephrosclerosis [58]. Moreover, the enlargement of Bowman’s capsule and tubular dilatation would affect the viscoelasticity of the tissue, causing the attenuation of the shear wave generation. The coexistence of sclerotic changes such as interstitial fibrosis and glomerulosclerosis and hypertrophic changes such as glomerular hypertrophy and tubular tuft expansion result in an increased tissue heterogeneity. In addition, these changes affect the anisotropy of the renal structural labyrinth. Thus, a decrease in the renal elasticity would be an index for early pathological changes in CKD. SWE is a potentially useful modality for the early detection of kidney injuries.

Table 2.
Summary of the previous findings of shear wave elastography in patients with chronic kidney disease.
Table 2.
Summary of the previous findings of shear wave elastography in patients with chronic kidney disease.
| Ref. (Year) | Number of Subjects | Age (year) | Sex (M/F) | Method | Correlation of the SWE Value with the CKD Stage or GFR | Correlation of the SWE Value with the Pathological Findings |
|---|---|---|---|---|---|---|
| [46] (2013) | 327 control 64 CKD | 64.7 ± 14.3 | 37/27 | pSWE | Lower in CKD Lower in stage 5 CKD than the other stages | N/A |
| [56] (2014) | 45 CKD | 37.1 ± 13.4 | 22/23 | pSWE | No difference between CKD stages | No correlations with glomerular sclerosis, tubulointerstitial injury, and fibrosis |
| [55] (2014) | 76 CKD | 40.4 ± 16.1 | 43/33 | pSWE | N/A | Increased in mild or moderate fibrosis |
| [50] (2014) | 14 control 319 CKD | 62.0 ± 15.7 | 198/121 | pSWE | Positive correlation with GFR | N/A |
| [48] (2014) | 32 control 163 CKD | 41.3 (18–79) | 91/72 | pSWE | Decrease with the degree of CKDPositive correlation with GFR | Negative correlations with glomerulosclerosis and tubulointerstitial damage |
| [25] (2015) | 58 non-CKD 46 CKD | 58.4 ± 13.8 | 28/18 | pSWE | Positive correlation with GFR | N/A |
| [53] (2015) | 20 control 25 CKD | 61 (56–70) | 16/9 | 2D-SWE | High in CKD | N/A |
| [51] (2016) | 23 control 29 CKD | 61.1 ± 10.9 | 17/12 | pSWE | Negative correlation with GFR | N/A |
| [28] (2016) | 59 control 31 non-CKD 39 ESRD | 72.0 (38–86) | 25/14 | pSWE | No difference between ESRD and non-CKD | N/A |
| [49] (2017) | 84 control 80 CKD | 59.8 ± 11.5 | 49/31 | pSWE | Positive correlation with GFR | N/A |
| [57] (2018) | 22 CKD | 61.5 (18–86) | 13/9 | pSWE | N/A | Negative correlation with nephron hypertrophy. No correlation with fibrosis |
| [47] (2021) | 29 CKD | 58.8 ± 14.9 | 19/10 | SE | Negative correlation with GFR | Positive correlation with the grade of fibrosis and tubular atrophy |
SWE: shear wave elastography; CKD: chronic kidney disease; pSWE: point SWE; 2D-SWE: two-dimensional SWE; SE: strain elastography; GFR: glomerular filtration rate; NS: nephrosclerosis; DN: diabetic nephropathy; GN: glomerulonephritis; ESRD: end-stage renal disease.
7. Conclusions
Ultrasound elastography is widely applied to CKD in native and transplanted kidneys. In native kidneys, the pathological changes observed in advanced kidney disease are characterized by interstitial fibrosis regardless of the etiology. Interstitial fibrosis is a hallmark of allograft failure in transplanted kidneys. Thus, many previous studies on ultrasound elastography have investigated the association between renal elasticity and the degree of interstitial fibrosis or the renal function. However, because there is no consensus on the elastic changes in various renal diseases, the results of ultrasound elastography should be interpreted carefully. In contrast to other organs such as the liver, the kidney has a heterogenous structure. Although various studies have been conducted on patients with kidney diseases, the changes in renal elasticity with respect to renal dysfunction and the histological changes have not been determined. One reason for the burdened consensus would be the quality of the measurement. It is recommended to measure at least ten times and report the results with the interquartile range-to-median ratio. Although ultrasound elastography should be applied with careful consideration, this technique has the potential to help detect early changes in kidney injury or hemodynamic-associated kidney dysfunction. Further studies are needed to clarify the combined influence of renal hemodynamics and the pathological heterogeneity on renal elasticity.
Author Contributions
Curation, T.I., T.S. and T.T.; original draft, T.I.; review and editing, T.S. and T.T.; supervision, H.I. All authors have read and agreed to the published version of the manuscript.
Funding
This research received no external funding.
Institutional Review Board Statement
Not applicable.
Informed Consent Statement
Not applicable.
Conflicts of Interest
The authors declare no conflict of interest.
References
- Meguid El Nahas, A.; Bello, A.K. Chronic kidney disease: The global challenge. Lancet 2005, 365, 331–340. [Google Scholar] [CrossRef]
- Anavekar, N.S.; Mcmurray, J.; Velazquez, E.J.; Solomon, S.D.; Kober, L.; Rouleau, J.-L.; White, H.D.; Nordlander, R.; Maggioni, A.P.; Dickstein, K.; et al. Relation between renal dysfunction and cardiovascular outcomes after myocardial infarction. N. Engl. J. Med. 2004, 351, 1285–1295. [Google Scholar] [CrossRef]
- Imai, E.; Horio, M.; Yamagata, K.; Iseki, K.; Hara, S.; Ura, N.; Kiyohara, Y.; Makino, H.; Hishida, A.; Matsuo, S. Slower decline of glomerular filtration rate in the Japanese general population: A longitudinal 10-year follow-up study. Hypertens. Res. 2008, 31, 433–441. [Google Scholar] [CrossRef] [Green Version]
- Lee, D.Y.; Han, K.; Yu, J.H.; Park, S.; Heo, J.-I.; Seo, J.A.; Kim, N.H.; Yoo, H.J.; Kim, S.G.; Kim, S.M.; et al. Gamma-glutamyl transferase variability can predict the development of end-stage of renal disease: A nationwide population-based study. Sci. Rep. 2020, 10, 11668. [Google Scholar] [CrossRef]
- Mae, Y.; Takata, T.; Ida, A.; Ogawa, M.; Taniguchi, S.; Yamamoto, M.; Iyama, T.; Fukuda, S.; Isomoto, H. Prognostic value of neutrophil-to-lymphocyte ratio and platelet-to-lymphocyte ratio for renal outcomes in patients with rapidly progressive glomerulonephritis. J. Clin. Med. 2020, 9, 1128. [Google Scholar] [CrossRef] [Green Version]
- Goerlich, N.; Brand, H.A.; Langhans, V.; Tesch, S.; Schachtner, T.; Koch, B.; Paliege, A.; Schneider, W.; Grützkau, A.; Reinke, P.; et al. Kidney transplant monitoring by urinary flow cytometry: Biomarker combination of T cells, renal tubular epithelial cells, and podocalyxin-positive cells detects rejection. Sci. Rep. 2020, 10, 796. [Google Scholar] [CrossRef] [PubMed] [Green Version]
- Perez-Gomez, M.V.; Pizarro-Sanchez, S.; Gracia-Iguacel, C.; Cano, S.; Cannata-Ortiz, P.; Sanchez-Rodriguez, J.; Sanz, A.B.; Sanchez-Niño, M.D.; Ortiz, A. Urinary growth differentiation factor-15 (GDF15) levels as a biomarker of adverse outcomes and biopsy findings in chronic kidney disease. J. Nephrol. 2021, 1–14. [Google Scholar] [CrossRef]
- Iyama, T.; Takata, T.; Yamada, K.; Mae, Y.; Taniguchi, S.; Ida, A.; Ogawa, M.; Yamamoto, M.; Hamada, S.; Fukuda, S.; et al. A novel method for assessing the renal biopsy specimens using an activatable fluorescent probe. Sci. Rep. 2020, 10, 12094. [Google Scholar] [CrossRef]
- Takahashi, H.; Ono, N.; Eguchi, Y.; Eguchi, T.; Kitajima, Y.; Kawaguchi, Y.; Nakashita, S.; Ozaki, I.; Mizuta, T.; Toda, S.; et al. Evaluation of acoustic radiation force impulse elastography for fibrosis staging of chronic liver disease: A pilot study. Liver Int. 2010, 30, 538–545. [Google Scholar] [CrossRef] [PubMed]
- Wang, S.-D.; Wang, L.; Li, Z.-X.; Wei, K.-L.; Liao, X.-H.; Chen, Y.-Y.; Huang, X. Differential diagnostic performance of acoustic radiation force impulse imaging in small (≤20 mm) breast cancers: Is it valuable? Sci. Rep. 2017, 7, 8650. [Google Scholar] [CrossRef] [PubMed] [Green Version]
- Fukuhara, T.; Matsuda, E.; Donishi, R.; Koyama, S.; Miyake, N.; Fujiwara, K.; Takeuchi, H. Clinical efficacy of novel elastography using acoustic radiation force impulse (ARFI) for diagnosis of malignant thyroid nodules. Laryngoscope 2018, 3, 319–325. [Google Scholar] [CrossRef]
- Onoyama, T.; Koda, M.; Fujise, Y.; Takata, T.; Kawata, S.; Okamoto, T.; Miyoshi, K.; Matono, T.; Sugihara, T.; Matsumoto, K.; et al. Utility of virtual touch quantification in the diagnosis of pancreatic ductal adenocarcinoma. Clin. Imaging 2017, 42, 64–67. [Google Scholar] [CrossRef]
- Cepeha, C.; Paul, C.; Borlea, A.; Fofiu, R.; Borcan, F.; Dehelean, C.; Ivan, V.; Stoian, D. Shear-wave elastography—Diagnostic value in children with chronic autoimmune thyroiditis. Diagnostics 2021, 11, 248. [Google Scholar] [CrossRef]
- Amzar, D.; Cotoi, L.; Sporea, I.; Timar, B.; Schiller, O.; Schiller, A.; Borlea, A.; Pop, N.; Stoian, D. Shear wave elastography in patients with primary and secondary hyperparathyroidism. J. Clin. Med. 2021, 10, 697. [Google Scholar] [CrossRef]
- Chimoriya, R.; Piya, M.K.; Simmons, D.; Ahlenstiel, G.; Ho, V. The use of two-dimensional shear wave elastography in people with obesity for the assessment of liver fibrosis in non-alcoholic fatty liver disease. J. Clin. Med. 2020, 10, 95. [Google Scholar] [CrossRef]
- Honda, Y.; Yoneda, M.; Imajo, K.; Nakajima, A. Elastography techniques for the assessment of liver fibrosis in non-alcoholic fatty liver disease. Int. J. Mol. Sci. 2020, 21, 4039. [Google Scholar] [CrossRef] [PubMed]
- Aksakal, M.; Oktar, S.O.; Sendur, H.N.; Esendaglı, G.; Ozenirler, S.; Cindoruk, M.; Hızel, K. Diagnostic performance of 2D shear wave elastography in predicting liver fibrosis in patients with chronic hepatitis B and C: A histopathological correlation study. Abdom. Radiol. 2021, 46, 3238–3244. [Google Scholar] [CrossRef]
- Lin, Y.; Li, H.; Jin, C.; Wang, H.; Jiang, B. The diagnostic accuracy of liver fibrosis in non-viral liver diseases using acoustic radiation force impulse elastography: A systematic review and meta-analysis. PLoS ONE 2020, 15, e0227358. [Google Scholar] [CrossRef] [Green Version]
- Sigrist, R.M.; Liau, J.; El Kaffas, A.; Chammas, M.C.; Willmann, J.K. Ultrasound elastography: Review of techniques and clinical applications. Theranostics 2017, 7, 1303–1329. [Google Scholar] [CrossRef] [PubMed]
- Doherty, J.R.; Trahey, G.E.; Nightingale, K.R.; Palmeri, M. Acoustic radiation force elasticity imaging in diagnostic ultrasound. IEEE Trans. Ultrason. Ferroelectr. Freq. Control 2013, 60, 685–701. [Google Scholar] [CrossRef] [PubMed]
- Lupsor, M.; Badea, R.; Stefanescu, H.; Sparchez, Z.; Branda, H.; Serban, A.; Maniu, A. Performance of a new elastographic method (ARFI technology) compared to unidimensional transient elastography in the noninvasive assessment of chronic hepatitis C. Preliminary results. J. Gastrointest. Liver Dis. 2009, 18, 303–310. [Google Scholar]
- Barr, R.G.; Wilson, S.R.; Rubens, D.; Garcia-Tsao, G.; Ferraioli, G. Update to the society of radiologists in ultrasound liver elastography consensus statement. Radiology 2020, 296, 263–274. [Google Scholar] [CrossRef]
- Bota, S.; Bob, F.; Sporea, I.; Şirli, R.; Popescu, A. Factors that influence kidney shear wave speed assessed by acoustic radiation force impulse elastography in patients without kidney pathology. Ultrasound Med. Biol. 2015, 41, 1–6. [Google Scholar] [CrossRef] [Green Version]
- Bob, F.; Bota, S.; Sporea, I.; Sirli, R.; Petrica, L.; Schiller, A. Kidney shear wave speed values in subjects with and without renal pathology and inter-operator reproducibility of acoustic radiation force impulse elastography (ARFI)—Preliminary results. PLoS ONE 2014, 9, e113761. [Google Scholar] [CrossRef] [Green Version]
- Yoǧurtçuoǧlu, B.; Damar, Ç. Renal elastography measurements in children with acute glomerulonephritis. Ultrasonography 2021, 40, 575–583. [Google Scholar] [CrossRef] [PubMed]
- Takata, T.; Koda, M.; Sugihara, T.; Sugihara, S.; Okamoto, T.; Miyoshi, K.; Hodotsuka, M.; Fujise, Y.; Matono, T.; Okano, J.; et al. Left renal cortical thickness measured by ultrasound can predict early progression of chronic kidney disease. Nephron 2015, 132, 25–32. [Google Scholar] [CrossRef]
- Hoi, S.; Takata, T.; Sugihara, T.; Ida, A.; Ogawa, M.; Mae, Y.; Fukuda, S.; Munemura, C.; Isomoto, H. Predictive value of cortical thickness measured by ultrasonography for renal impairment: A longitudinal study in chronic kidney disease. J. Clin. Med. 2018, 7, 527. [Google Scholar] [CrossRef] [PubMed] [Green Version]
- Takata, T.; Koda, M.; Sugihara, T.; Sugihara, S.; Okamoto, T.; Miyoshi, K.; Matono, T.; Hosho, K.; Mae, Y.; Iyama, T.; et al. Renal shear wave velocity by acoustic radiation force impulse did not reflect advanced renal impairment. Nephrology 2015, 21, 1056–1062. [Google Scholar] [CrossRef] [PubMed]
- Shin, H.J.; Kim, M.-J.; Kim, H.Y.; Roh, Y.H.; Lee, M.-J. Optimal acquisition number for hepatic shear wave velocity measurements in children. PLoS ONE 2016, 11, e0168758. [Google Scholar] [CrossRef]
- Gallotti, A.; D’Onofrio, M.; Mucelli, R.P. Acoustic radiation force impulse (ARFI) technique in ultrasound with virtual touch tissue quantification of the upper abdomen. Radiol. Med. 2010, 115, 889–897. [Google Scholar] [CrossRef]
- Syversveen, T.; Midtvedt, K.; Berstad, A.E.; Brabrand, K.; Strøm, E.H.; Abildgaard, A. Tissue elasticity estimated by acoustic radiation force impulse quantification depends on the applied transducer force: An experimental study in kidney transplant patients. Eur. Radiol. 2012, 22, 2130–2137. [Google Scholar] [CrossRef] [PubMed]
- Bruno, C.; Minniti, S.; Bucci, A.; Mucelli, R.P. ARFI: From basic principles to clinical applications in diffuse chronic disease—A review. Insights Imaging 2016, 7, 735–746. [Google Scholar] [CrossRef] [PubMed] [Green Version]
- Lim, W.T.; Ooi, E.H.; Foo, J.J.; Ng, K.H.; Wong, J.H.; Leong, S.S. Shear wave elastography: A review on the confounding factors and their potential mitigation in detecting chronic kidney disease. Ultrasound Med. Biol. 2021, 47, 2033–2047. [Google Scholar] [CrossRef] [PubMed]
- Tan, S.; Özcan, M.F.; Tezcan, F.; Balcı, S.; Karaoğlanoğlu, M.; Huddam, B.; Arslan, H. Real-time elastography for distinguishing angiomyolipoma from renal cell carcinoma: Preliminary observations. Am. J. Roentgenol. 2013, 200, W369–W375. [Google Scholar] [CrossRef] [PubMed]
- Onur, M.R.; Poyraz, A.K.; Bozgeyik, Z.; Onur, A.R.; Orhan, I. Utility of semiquantitative strain elastography for differentiation between benign and malignant solid renal masses. J. Ultrasound Med. 2015, 34, 639–647. [Google Scholar] [CrossRef]
- Lu, Q.; Wen, J.-X.; Huang, B.-J.; Xue, L.-Y.; Wang, W.-P. Virtual touch quantification using acoustic radiation force impulse (ARFI) technology for the evaluation of focal solid renal lesions: Preliminary findings. Clin. Radiol. 2015, 70, 1376–1381. [Google Scholar] [CrossRef] [PubMed]
- Göya, C.; Daggulli, M.; Hamidi, C.; Yavuz, A.; Hattapoglu, S.; Cetincakmak, M.G.; Teke, M. The role of quantitative measurement by acoustic radiation force impulse imaging in differentiating benign renal lesions from malignant renal tumours. Radiol. Med. 2014, 120, 296–303. [Google Scholar] [CrossRef]
- Cai, Y.; Li, F.; Li, Z.; Du, L.; Wu, R. Diagnostic performance of ultrasound shear wave elastography in solid small (≤4 cm) renal parenchymal masses. Ultrasound Med. Biol. 2019, 45, 2328–2337. [Google Scholar] [CrossRef]
- Goldfarb, D.A. The natural history of chronic allograft nephropathy. J. Urol. 2005, 173, 2106. [Google Scholar] [CrossRef]
- Stock, K.; Klein, B.; Cong, M.V.; Sarkar, O.; Römisch, M.; Regenbogen, C.; Büttner, M.; Schuster, T.; Matevossian, E.; Amann, K.; et al. ARFI-based tissue elasticity quantification in comparison to histology for the diagnosis of renal transplant fibrosis. Clin. Hemorheol. Microcirc. 2010, 46, 139–148. [Google Scholar] [CrossRef]
- Syversveen, T.; Brabrand, K.; Midtvedt, K.; Strøm, E.H.; Hartmann, A.; Jakobsen, J.A.; Berstad, A.E. Assessment of renal allograft fibrosis by acoustic radiation force impulse quantification—A pilot study. Transpl. Int. 2010, 24, 100–105. [Google Scholar] [CrossRef]
- Grenier, N.; Poulain, S.; Lepreux, S.; Gennisson, J.-L.; Dallaudière, B.; Lebras, Y.; Bavu, E.; Servais, A.; Meas-Yedid, V.; Piccoli, M.; et al. Quantitative elastography of renal transplants using supersonic shear imaging: A pilot study. Eur. Radiol. 2012, 22, 2138–2146. [Google Scholar] [CrossRef]
- Grenier, N.; Gennisson, J.-L.; Cornelis, F.; Le Bras, Y.; Couzi, L. Renal ultrasound elastography. Diagn. Interv. Imaging 2013, 94, 545–550. [Google Scholar] [CrossRef] [Green Version]
- Bolboacă, S.D.; Elec, F.I.; Elec, A.D.; Muntean, A.M.; Socaciu, M.A.; Iacob, G.; Zaro, R.; Andrieș, A.-I.; Bădulescu, R.M.; Ignat, R.M.; et al. Shear-wave elastography variability analysis and relation with kidney allograft dysfunction: A single-center study. Diagnostics 2020, 10, 41. [Google Scholar] [CrossRef] [Green Version]
- Kennedy, P.; Bane, O.; Hectors, S.J.; Gordic, S.; Berger, M.; Delaney, V.; Salem, F.; Lewis, S.; Menon, M.; Taouli, B. Magnetic resonance elastography vs. point shear wave ultrasound elastography for the assessment of renal allograft dysfunction. Eur. J. Radiol. 2020, 126, 108949. [Google Scholar] [CrossRef] [PubMed]
- Guo, L.-H.; Xu, H.-X.; Fu, H.-J.; Peng, A.; Zhang, Y.-F.; Liu, L.-N. Acoustic radiation force impulse imaging for noninvasive evaluation of renal parenchyma elasticity: Preliminary findings. PLoS ONE 2013, 8, e68925. [Google Scholar] [CrossRef] [PubMed] [Green Version]
- Lin, H.Y.-H.; Lee, Y.-L.; Lin, K.-D.; Chiu, Y.-W.; Shin, S.-J.; Hwang, S.-J.; Chen, H.-C.; Hung, C.-C. Association of renal elasticity and renal function progression in patients with chronic kidney disease evaluated by real-time ultrasound elastography. Sci. Rep. 2017, 7, 43303. [Google Scholar] [CrossRef] [PubMed]
- Hu, Q.; Wang, X.-Y.; He, H.-G.; Wei, H.-M.; Kang, L.-K.; Qin, G.-C. Acoustic radiation force impulse imaging for non-invasive assessment of renal histopathology in chronic kidney disease. PLoS ONE 2014, 9, e115051. [Google Scholar] [CrossRef] [PubMed] [Green Version]
- Bob, F.; Grosu, I.; Sporea, I.; Bota, S.; Popescu, A.; Sima, A.; Şirli, R.; Petrica, L.; Timar, R.; Schiller, A. Ultrasound-based shear wave elastography in the assessment of patients with diabetic kidney disease. Ultrasound Med. Biol. 2017, 43, 2159–2166. [Google Scholar] [CrossRef] [PubMed]
- Asano, K.; Ogata, A.; Tanaka, K.; Ide, Y.; Sankoda, A.; Kawakita, C.; Nishikawa, M.; Ohmori, K.; Kinomura, M.; Shimada, N.; et al. Acoustic radiation force impulse elastography of the kidneys: Is shear wave velocity affected by tissue fibrosis or renal blood flow? J. Ultrasound Med. 2014, 33, 793–801. [Google Scholar] [CrossRef] [PubMed]
- Hassan, K.; Loberant, N.; Abbas, N.; Fadi, H.; Shadia, H.; Khazim, K. Shear wave elastography imaging for assessing the chronic pathologic changes in advanced diabetic kidney disease. Ther. Clin. Risk Manag. 2016, 12, 1615–1622. [Google Scholar] [CrossRef] [PubMed] [Green Version]
- Makita, A.; Nagao, T.; Miyoshi, K.-I.; Koizumi, Y.; Kurata, M.; Kondo, F.; Shichijo, S.; Hirooka, M.; Yamaguchi, O. The association between renal elasticity evaluated by real-time tissue elastography and renal fibrosis. Clin. Exp. Nephrol. 2021, 25, 981–987. [Google Scholar] [CrossRef] [PubMed]
- Samir, A.E.; Allegretti, A.S.; Zhu, Q.; Dhyani, M.; Anvari, A.; Sullivan, D.A.; Trottier, C.A.; Dougherty, S.; Williams, W.W.; Babitt, J.L.; et al. Shear wave elastography in chronic kidney disease: A pilot experience in native kidneys. BMC Nephrol. 2015, 16, 119. [Google Scholar] [CrossRef] [Green Version]
- Alan, B.; Göya, C.; Aktan, A.; Alan, S. Renal acoustic radiation force impulse elastography in the evaluation of coronary artery disease. Acta Radiol. 2017, 58, 156–163. [Google Scholar] [CrossRef] [PubMed]
- Cui, G.; Yang, Z.; Zhang, W.; Li, B.; Sun, F.; Xu, C.; Wang, K. Evaluation of acoustic radiation force impulse imaging for the clinicopathological typing of renal fibrosis. Exp. Ther. Med. 2014, 7, 233–235. [Google Scholar] [CrossRef] [PubMed] [Green Version]
- Wang, L.; Xia, P.; Lv, K.; Han, J.; Dai, Q.; Li, X.-M.; Chen, L.-M.; Jiang, Y.-X. Assessment of renal tissue elasticity by acoustic radiation force impulse quantification with histopathological correlation: Preliminary experience in chronic kidney disease. Eur. Radiol. 2014, 24, 1694–1699. [Google Scholar] [CrossRef]
- Iyama, T.; Takata, T.; Koda, M.; Fukuda, S.; Hoi, S.; Mae, Y.; Fukui, T.; Munemura, C.; Isomoto, H. Renal shear wave elastography for the assessment of nephron hypertrophy: A cross-sectional study in chronic kidney disease. J. Med. Ultrason. 2018, 45, 571–576. [Google Scholar] [CrossRef] [Green Version]
- Denic, A.; Glassock, R.J.; Rule, A.D. Structural and functional changes with the aging kidney. Adv. Chronic Kidney Dis. 2016, 23, 19–28. [Google Scholar] [CrossRef] [Green Version]
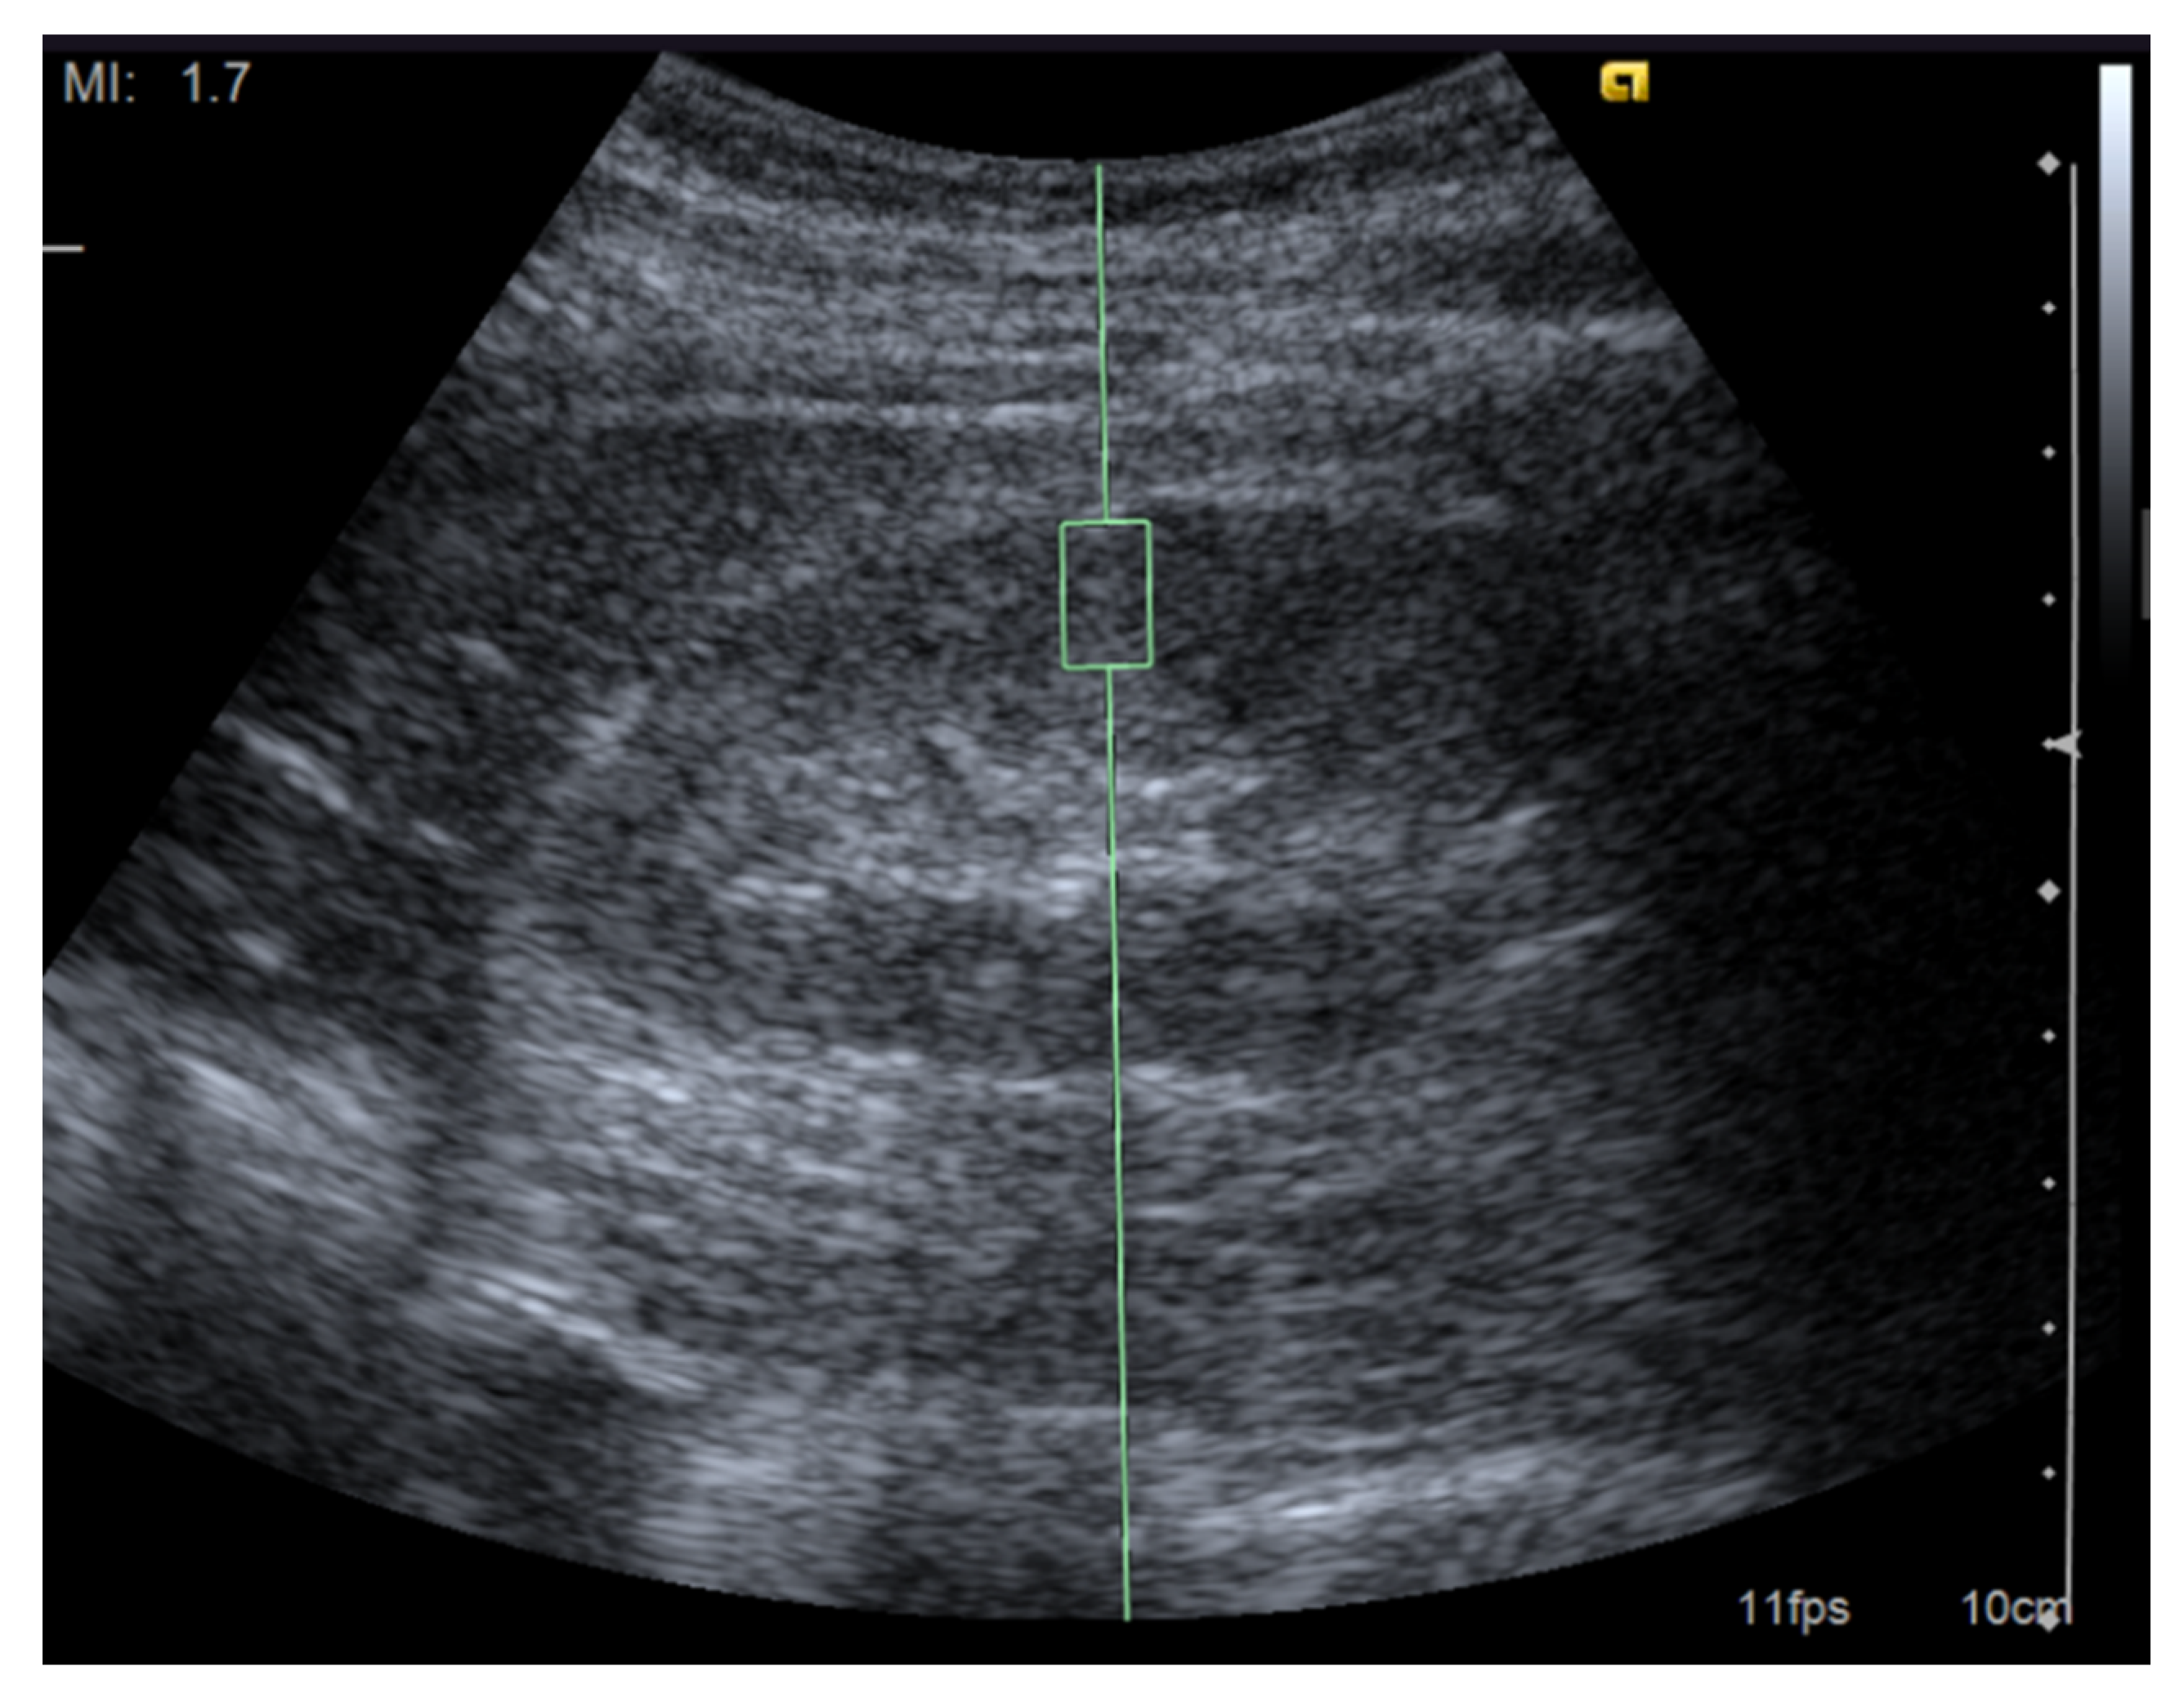
Figure 1.
Image of a shear wave elastography measurement. Representative ultrasound image for the measurement of renal elasticity using a Siemens Acuson S2000 ultrasound system (Siemens, Erlangen, Germany) with convex probes (4C1, frequency range: 1–4 MHz) and a mechanical index of 1.7. The region of interest was set perpendicular to the renal capsule.

Table 1.
Proposal for measuring renal elasticity with the SWE technique.
| 1. | Measure with patients placed in prone or unilateral position |
| 2. | Measurement should be performed during holding the breath |
| 3. | Depth of the target region of interest should be limited to less than 8 cm |
| 4. | Renal cysts or vasculature need to be avoided within the target region of interest |
| 5. | Parenchymal stiffness rather than medullary stiffness is recommended in terms of reliability |
| 6. | Push-pulse should be irradiated perpendicular to the renal capsule |
| 7. | Ten repeated measurements should be obtained |
| 8. | Results can be reported in meters per second or kilopascals |
| 9. | Final result should be expressed as the median together with the interquartile range-to-median ratio |
Publisher’s Note: MDPI stays neutral with regard to jurisdictional claims in published maps and institutional affiliations. |
© 2021 by the authors. Licensee MDPI, Basel, Switzerland. This article is an open access article distributed under the terms and conditions of the Creative Commons Attribution (CC BY) license (https://creativecommons.org/licenses/by/4.0/).
Share and Cite
MDPI and ACS Style
Iyama, T.; Sugihara, T.; Takata, T.; Isomoto, H. Renal Ultrasound Elastography: A Review of the Previous Reports on Chronic Kidney Diseases. Appl. Sci. 2021, 11, 9677. https://0-doi-org.brum.beds.ac.uk/10.3390/app11209677
AMA Style
Iyama T, Sugihara T, Takata T, Isomoto H. Renal Ultrasound Elastography: A Review of the Previous Reports on Chronic Kidney Diseases. Applied Sciences. 2021; 11(20):9677. https://0-doi-org.brum.beds.ac.uk/10.3390/app11209677
Chicago/Turabian StyleIyama, Takuji, Takaaki Sugihara, Tomoaki Takata, and Hajime Isomoto. 2021. "Renal Ultrasound Elastography: A Review of the Previous Reports on Chronic Kidney Diseases" Applied Sciences 11, no. 20: 9677. https://0-doi-org.brum.beds.ac.uk/10.3390/app11209677
Note that from the first issue of 2016, this journal uses article numbers instead of page numbers. See further details here.