1. Introduction
Due to the COVID-19 pandemic, in order to protect citizens and stop the virus spreading, most governments around the world declared a state of emergency and conducted a partial or total lockdown for a certain period. In Serbia, an emergency lockdown was introduced on 16 March 2020 and lasted until 6 May 2020 (i.e., 52 days) [
1]. During that period, some days had tighter emergency measures (complete lockdown) while during other days there was a partial lockdown. Generally, Belgrade is a moderately polluted city, mostly affected by traffic and transport, construction, industrial activities, dust and domestic-heating-related pollution. As a consequence of the lockdown, vehicle traffic volume, manufacturing, construction and industrial activities were reduced. To understand the influence of these factors on pollution, it is of interest to analyze air quality during the emergency lockdown and compare it with the preceding and following periods.
There are many analyses, studies and pieces of research related to the influence of COVID-19 lockdowns on air quality [
2]. In [
3], the authors compare the consecutive intervals that occur immediately pre-COVID, COVID and post-COVID in terms of their influence on air quality in the city of Novi Sad (Serbia) for PM
2.5, PM
10, CO and NO
x. The authors have noticed a significant reduction in NO
2, while CO and PM
10 mostly remained on the same level (depending on the location in Novi Sad). PM
2.5, PM
10, NO
2 and O
3 concentrations are explored and compared for the same periods in 2019 and 2020 (during the COVID lockdown in Florence, Pisa and Lucca in Italy) in [
4]. In this study, a significant reduction in NO
2 was observed, while the pollution level of O
3 remained the same; PM
10, in most of the analyzed cases, remained on the same level. Major urban cities are explored in [
5], and a reduction in NO
2 pollution is highly noticeable (in comparison to 2019) in the cities where there was a strict lockdown (Madrid, Milan and Paris), while in the cities with a partial lockdown this decrease was much lower (Warsaw, Bismarck and Lincoln). The French National Institute (INERIS) has conducted a comprehensive study related to NO
2 and PM
10 around Europe, and a decrease in NO
2 pollution was also noticed, but the PM
10 pollution was shown to depend on the observed region (an increase/decrease was observed) [
6]. The same behavior, regarding NO
2 and PM pollution levels, is also noticed in Canada and presented in [
7]. The impact of the COVID-19 lockdown on traffic-related air pollution (PM
2.5, black carbon (BC), NO, NO
2 and CO) in a northwestern US city is evaluated in [
8]. Based on the multiple studies in this area, it was concluded that road traffic is a major urban pollutant source. The measurements were conducted near a major freeway. During the lockdown period, the median traffic volume decreased by a third. This caused a decrease in the level of pollutants, where the median BC concentration decreased by a fourth, PM
2.5, NO and NO
2 decreased by a third and CO decreased by a sixth in comparison to the pre-COVID-19 state.
The modeling of the influence of weather conditions on low-cost air quality sensors is quite present in modern research. More specifically, artificial neural networks (ANNs), as very promising machine learning algorithms, can be found in several papers related to low-cost sensors. In [
9], the authors use a deep ANN consisting of convolutional, fully connected and long short-term memory layers, and train it on the O
3, PM
2.5 and PM
10 measurements, taking into consideration various weather conditions. They have concluded that by training a network using reference, low-cost measurements, such as wind speed, wind direction, temperature and relative humidity, the error of low-cost sensors can be drastically decreased. The AirNet model was developed in [
10] and uses dual encoder neural networks to calibrate CO and O
3 low-cost sensors. The developed AirNet architecture has been proven to be superior via comparison to several baseline algorithms. A mobile PM
2.5 sensing system was developed and calibrated using fully connected ANNs in [
11]. It considers relative humidity and temperature in addition to PM
2.5 measurements and was shown to greatly increase the accuracy of the developed system. In [
12], the authors explore three different machine learning algorithms for the calibration of low-cost CO and O
3 sensors based on a number of pollutant measurements and weather conditions. Univariate and multivariate linear regression are implemented as well as fully connected ANNs. Several training algorithms for the ANNs are implemented as well, and it was concluded that the ANN outperforms the linear algorithms for both pollutants. The authors have explored the possibility of applying linear models and fully connected ANNs to data collected from a location different than the one used for the acquisition of training data in [
13]. O
3 and CO
2 measurements have been observed. It was shown that the ANN is overall more effective, but that there are some exceptions influenced by the selection of training and test scenarios. An evaluation of linear models and fully connected ANNs is performed in [
14], with an assortment of observed pollutants: O
3, CO, CO
2 and CH
4. It was shown that the ANN has better performance when the modeling of complex nonlinear behavior is concerned, using a wide range of pollutant and weather condition measurements. Regardless of the variety of the papers that have covered air quality sensor calibration, to the best of the authors’ knowledge no paper has attempted to train algorithms on data from a single year and evaluate it on data that is gathered a year later during a different day-to-day regime.
The scope and contributions of our research are twofold. The first part is to explore the impact of the COVID-19 lockdown in Serbia on air pollution levels. The second part includes a device with low-cost sensors which is collocated with a reference public monitoring station. The goal here is to validate the device measurements by comparing them with reference measurements, and to apply corrections due to the influence of temperature and relative humidity on the measurements by using convolutional ANNs. Our results show that by using data from the year preceding the COVID-19 lockdown, a convolutional ANN model can be trained and successfully applied to low-cost sensors’ measurements during the lockdown period. This shows that our model can be applied to low-cost measurements that are acquired a year later than the ones used for training data. This indicates that the sensors can be successfully used for multiple years and that our calibration algorithm can be implemented at least one year after it is trained (showing a decent level of robustness). Furthermore, the pollutant concentrations are different in 2019 and 2020 (COVID-19 lockdown), and the algorithm was trained in 2019 and tested in 2020, showing that it is useful even if the regimes during training and testing are different.
The rest of the paper is organized as follows: in
Section 2 our research methods are presented. The results and subsequent discussion are presented in
Section 3. Finally,
Section 4 concludes the paper.
2. Methods
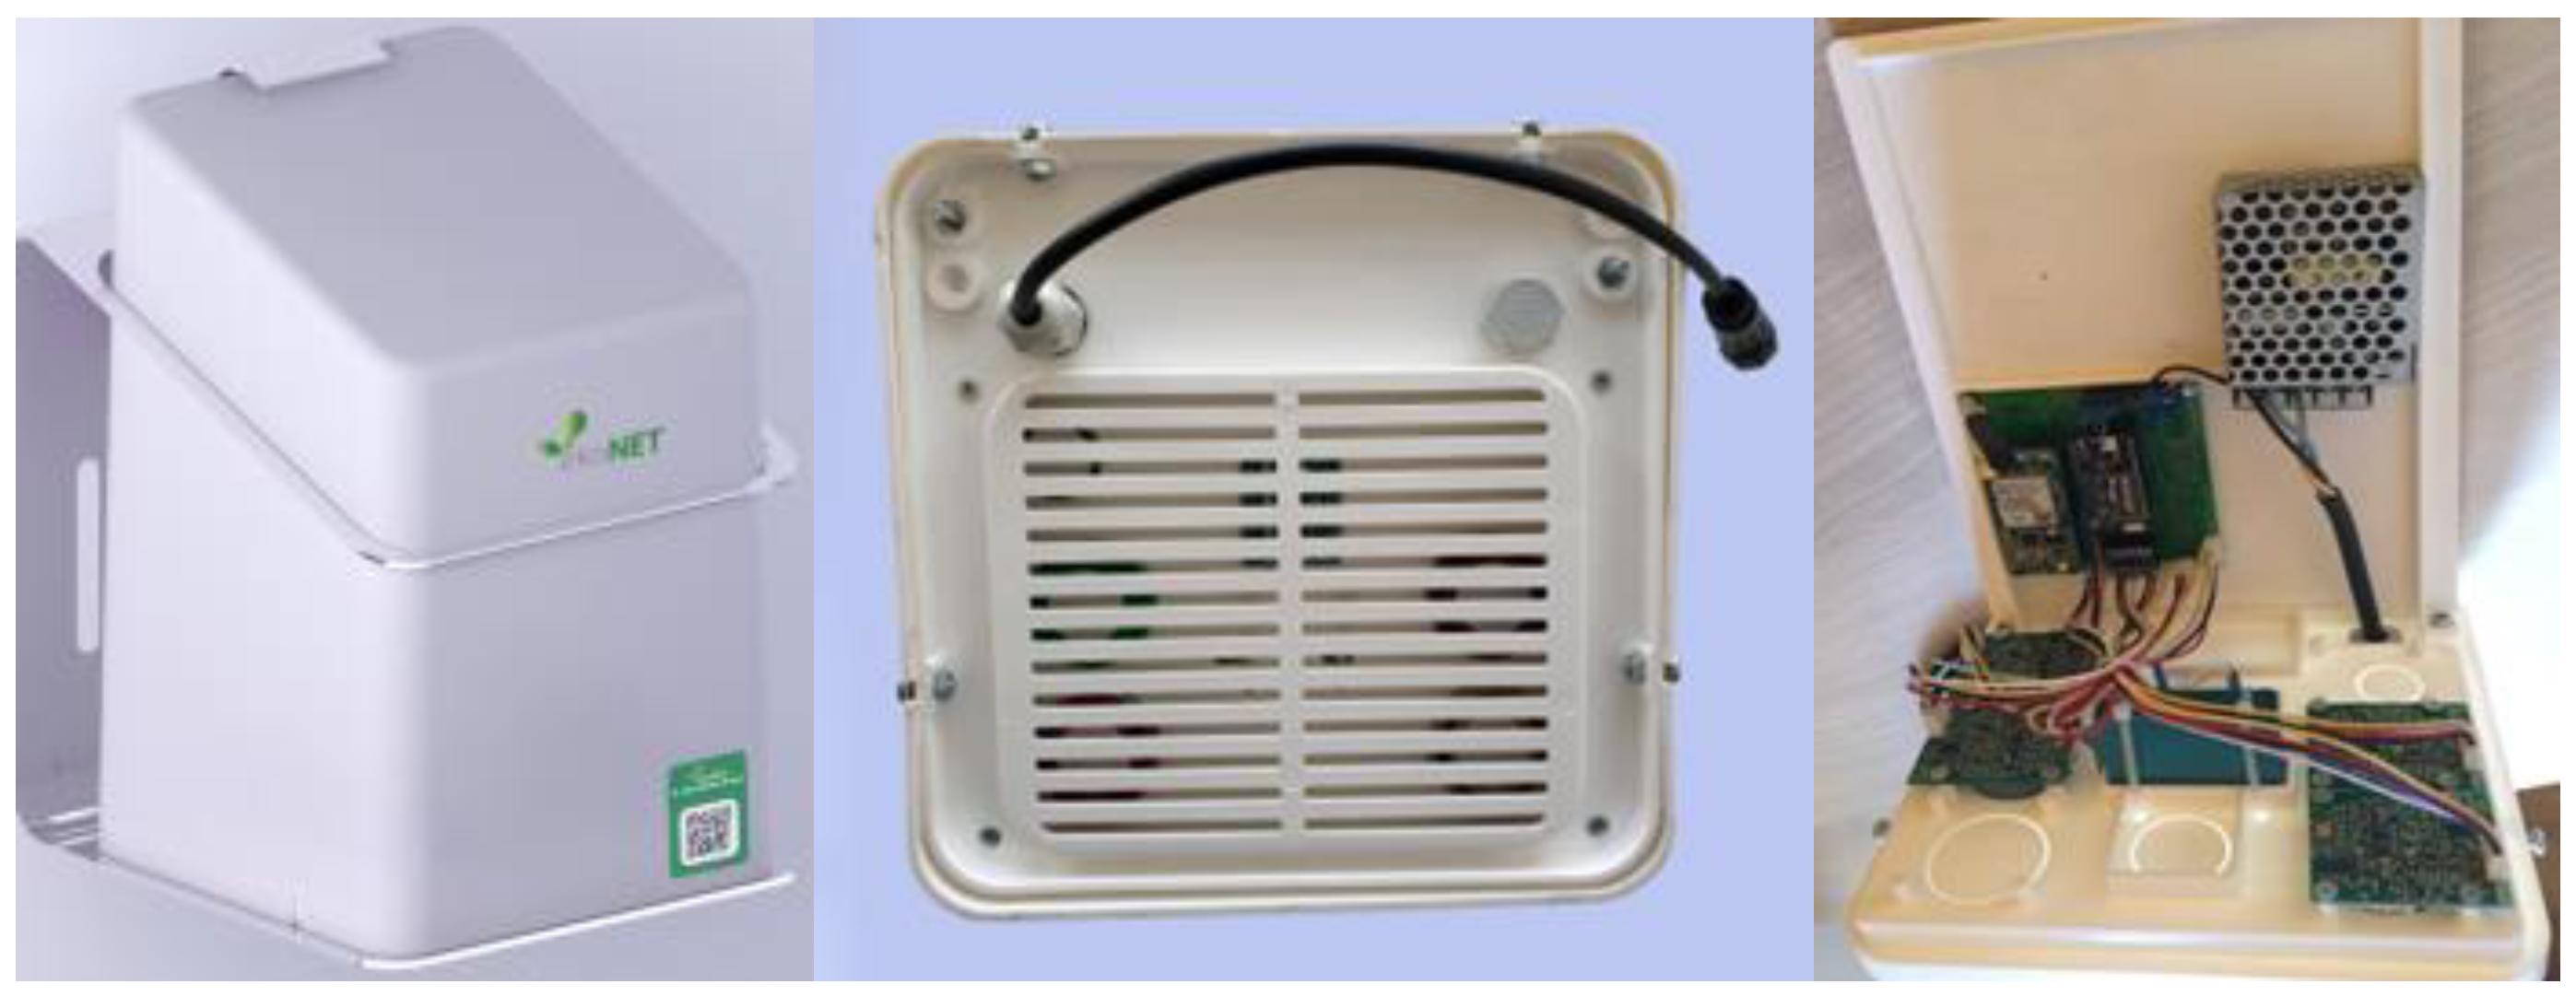
The IoT (Internet of Things)-based air quality monitoring ekoNET device AQ10x (DunavNET, AQ103, Novi Sad, Serbia) with low-cost sensors for outdoor air quality measurements [
15] has been collocated with a reference public monitoring station in Belgrade (Serbia). The system contains the following components: an AQ10x device (
Figure 1), a cloud database for permanent data storage, a data analytics engine (Microsoft Azure), a visualization engine, an administration module and a web application. The AQ10x is a portable device that can be installed both indoors and outdoors, as well as on vehicles to enable larger coverage. The device’s power consumption is 2.5 W, weight is 1.5 kg and dimensions are 180 × 180 × 265 mm
3. AQ10x devices support different transmission technologies (WiFi, BLE (Bluetooth Low Energy), LoRa (Long Range), SigFox, GPRS (General Packet Radio Service), 3G, LTE (Long-Term Evolution) and NB-IoT (Narrowband Internet of Things), and measurements are sent to the back-end server via one of the selected communication modules. The average payload for one data transmission (one measurement period) is 100 B. The transmission period can be set by the user, and for a recommended period of 1 min the total monthly payload is about 4.5 MB. The data are visualized in real time using the web application, which provides a rich set of tools for data processing (averaging, filtering, noise elimination, etc.). In comparison to the public monitoring station, for the same set of observed pollutants, the cost of the low-cost device is about 25 times lower (i.e., for the cost of 1 public reference station, 25 low-cost devices can be purchased). Furthermore, the public reference station additionally requires a significantly higher amount of maintenance.
The device contains the following B4 series Alphasense electrochemical gas sensors, intended to monitor air quality in urban areas [
16]: CO-B4 gas sensor (measurement range: 0–50 ppm, unit ppm or mg/m³, accuracy ± 2% FS), NO
2-B43F gas sensor (measurement range: 0–20 ppm, unit ppb or μg/m
3, accuracy ± 2% FS), air temperature (t) and relative humidity (RH) sensors (Bosch BME 280) in addition to PM
1, PM
2.5 and PM
10 Plantower PMS7003 optical counters (measurement range: 0~1000 μg/m³, unit μg/m³, accuracy ± 2% FS) [
17].
The measurement point is located in the biggest municipality in Belgrade (and in Serbia), i.e., New Belgrade. The station is located a few tens of meters away from one of the main intersections in New Belgrade with a high traffic volume, and a few hundred meters from the Sava River as well as the Ada Lake. The main sources of air pollution in this area are transport (traffic), a heating plant (about 1 km from the measurement point), industrial and construction activities, domestic heating and dust. The device sampling resolution is 1 minute, and data are sent via a GPRS network to the back-end server in the cloud, where data are stored and processed. Obtained values are averaged for each hour and statistically correlated to values captured from the public monitoring station in the same time intervals. Results are collected and analyzed for the periods of 16 March–6 May 2019, 16 March–6 May 2020 (COVID lockdown) and 16 March–6 May 2021. In this study, CO, NO
2 and PM
10 measurements are used, alongside weather data. The data from the period of the Aralkum desert storm are excluded from the 2020 dataset to avoid interference with the results [
3].
The raw measurement data are collected from low-cost sensors. Since low-cost sensors do not provide highly precise measurements, the collected measurements should be corrected. As we stated in the Introduction section, we used convolutional ANNs for this purpose. The goal regarding the ANN calibration performed in this paper is to train the network to correct the raw low-cost sensors’ measurements, using air temperature and relative humidity measurements. To evaluate the model in a realistic scenario, the model is trained on data from 2019 and tested on data from 2020 and 2021. The model is also trained on data from both 2019 and 2020 and tested on the 2021 measurements. In this manner, we test whether the calibration done in one year could be applied in the following year, and if the calibration done during regular activities (2019) could be applied when there was a lockdown (2020).
The gathered raw pollutant measurements from each of the three years are initially corrected using the Environmental Protection Agency (EPA) co-location method, with linear regression (LR) between the raw and reference values obtained in the two-week period preceding the observed one (LR performed on the data gathered from 2 March to 16 March of the respective year) [
18]. After this, each measured variable is grouped into sequences with a length of 24. A window of 24 h (1 day) is moved through the data of length 1248 for a single year (number of hours in the observed main interval), with a stride of 1 hour creating a 1224 × 24 matrix of data. The corrected sensor measurements, RH and t data are concatenated, resulting in a 1224 × 24 × 3 matrix of input data created for each year. The output data for each year are 1224 × 24 matrices containing reference measurements. The data instances (1224 per year), each of shape 24 × 3, are the input to the developed convolutional ANN, and the reference measurements for the respective 24 h are the output of the network.
The architecture of the convolutional ANN used for the correction of the influence of relative humidity and temperature on measurements is given in
Table 1.
This convolutional ANN is trained for each pollutant separately, but the architecture itself remains the same for all pollutants. To evaluate the algorithm, the commonly used metrics R2 and root mean square error (RMSE) are used [
19].
3. Results and Discussion
Table 2 shows the evaluation metrics for the performed measurement corrections for NO
2 and PM
10. The agreement between the raw and reference CO measurements is initially quite high for each year (R2 ranging from 0.833 to 0.894), and no significant improvement is achieved for this pollutant using the correction of the raw measurements described in the previous section. Because of this, results regarding the CO measurements are not shown in
Table 2.
The presented results show that, for NO
2, every train/test scenario for the ANN shows an improvement over the simple LR correction results. The most prominent improvement for NO
2 is achieved when the ANN is trained on data from 2019 and evaluated on data from 2020. It is also notable that the results for the test year 2021 are better when data from both 2019 and 2020 are used as the training set. When it comes to the results for the PM
10, the most prominent improvement is present when the ANN is trained on 2019 data and tested on 2020 data. The R2 factor for PM
10 is also improved for 2021, but only when the ANN is trained on 2020 data, and there seems to be an increase in the RMSE parameter. All of these observations can be explained when taking into consideration the nature of the sensors alongside the values of the measured pollutants and weather parameters. The mean, median and standard deviation values are shown in
Table 3, for each year and each measured variable. In the remainder of this section, we explain in more detail the observations made for the results shown in
Table 2.
The values given in
Table 3 can explain many phenomena regarding the influence of the state of emergency, as well as provide an explanation for the results shown in
Table 2.
Firstly, let us observe the measurements of CO. The values of the mean and median values of the CO reference measurements are the highest in 2020. This can be explained by the larger number of people staying indoors, because of the state of emergency, in comparison to 2019 and 2021. The observed period in each year includes the heating season, which, in addition to the larger number of people staying indoors in 2020, could explain the observable increase in the CO measurements.
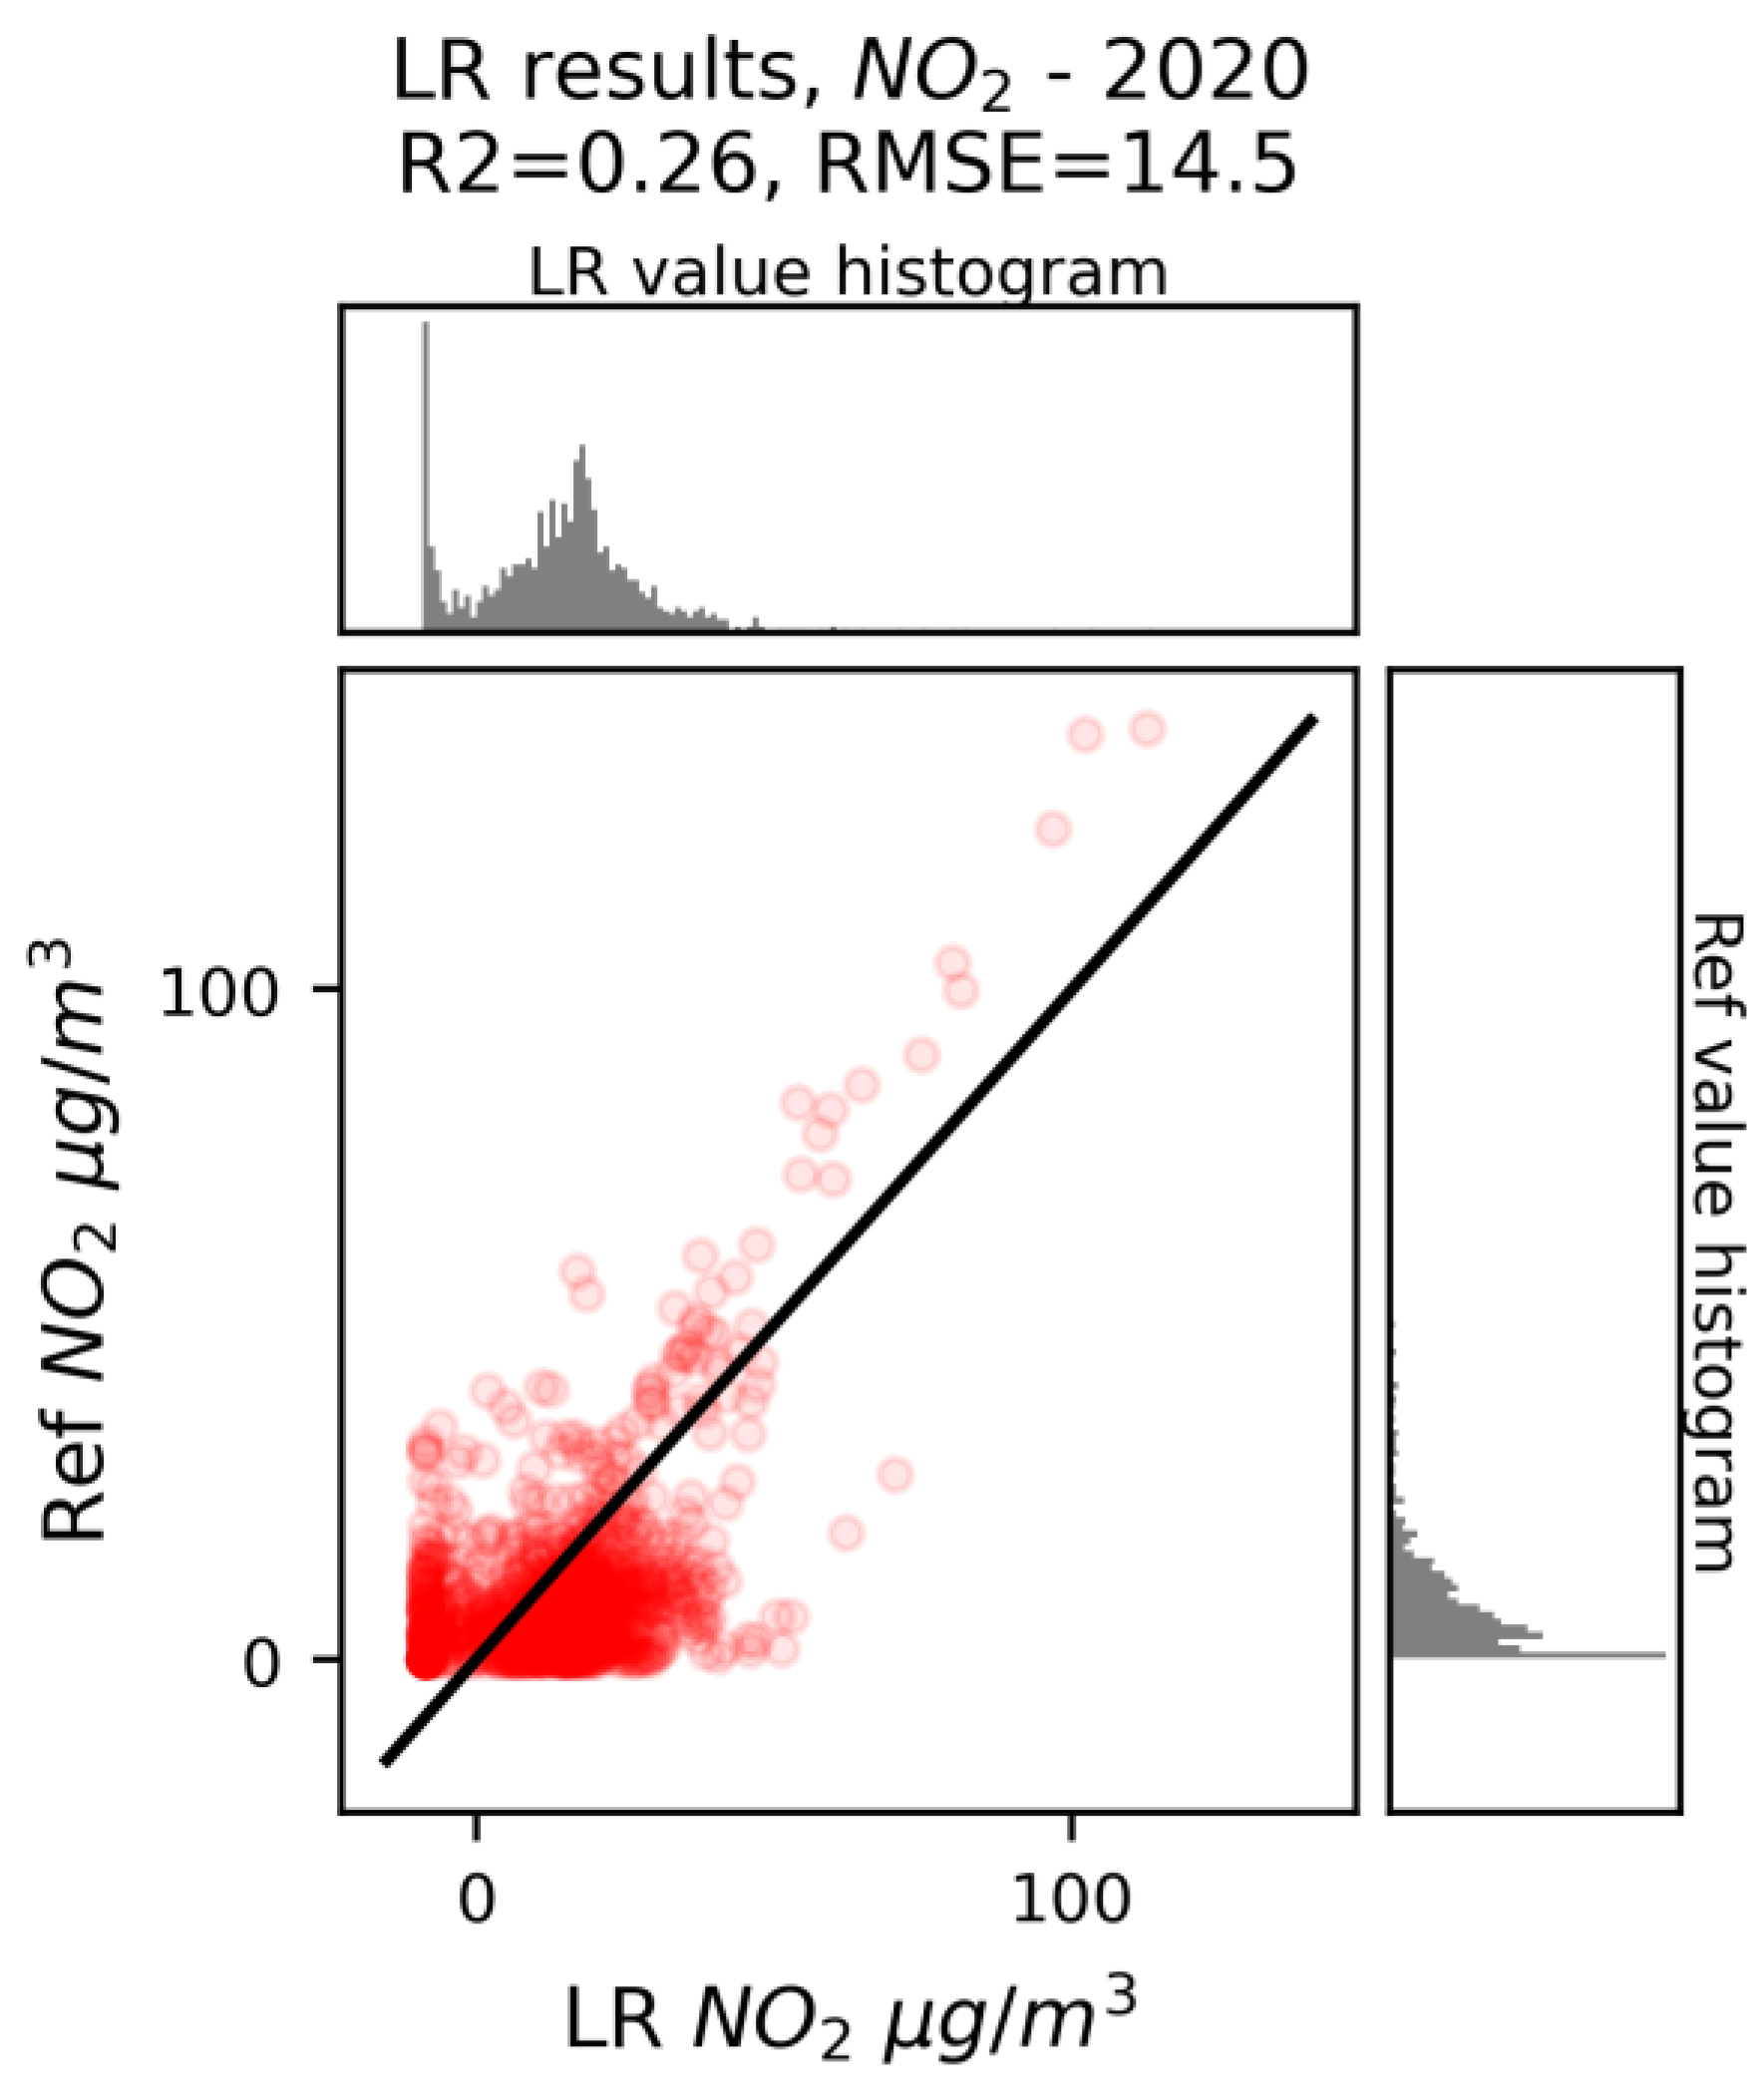
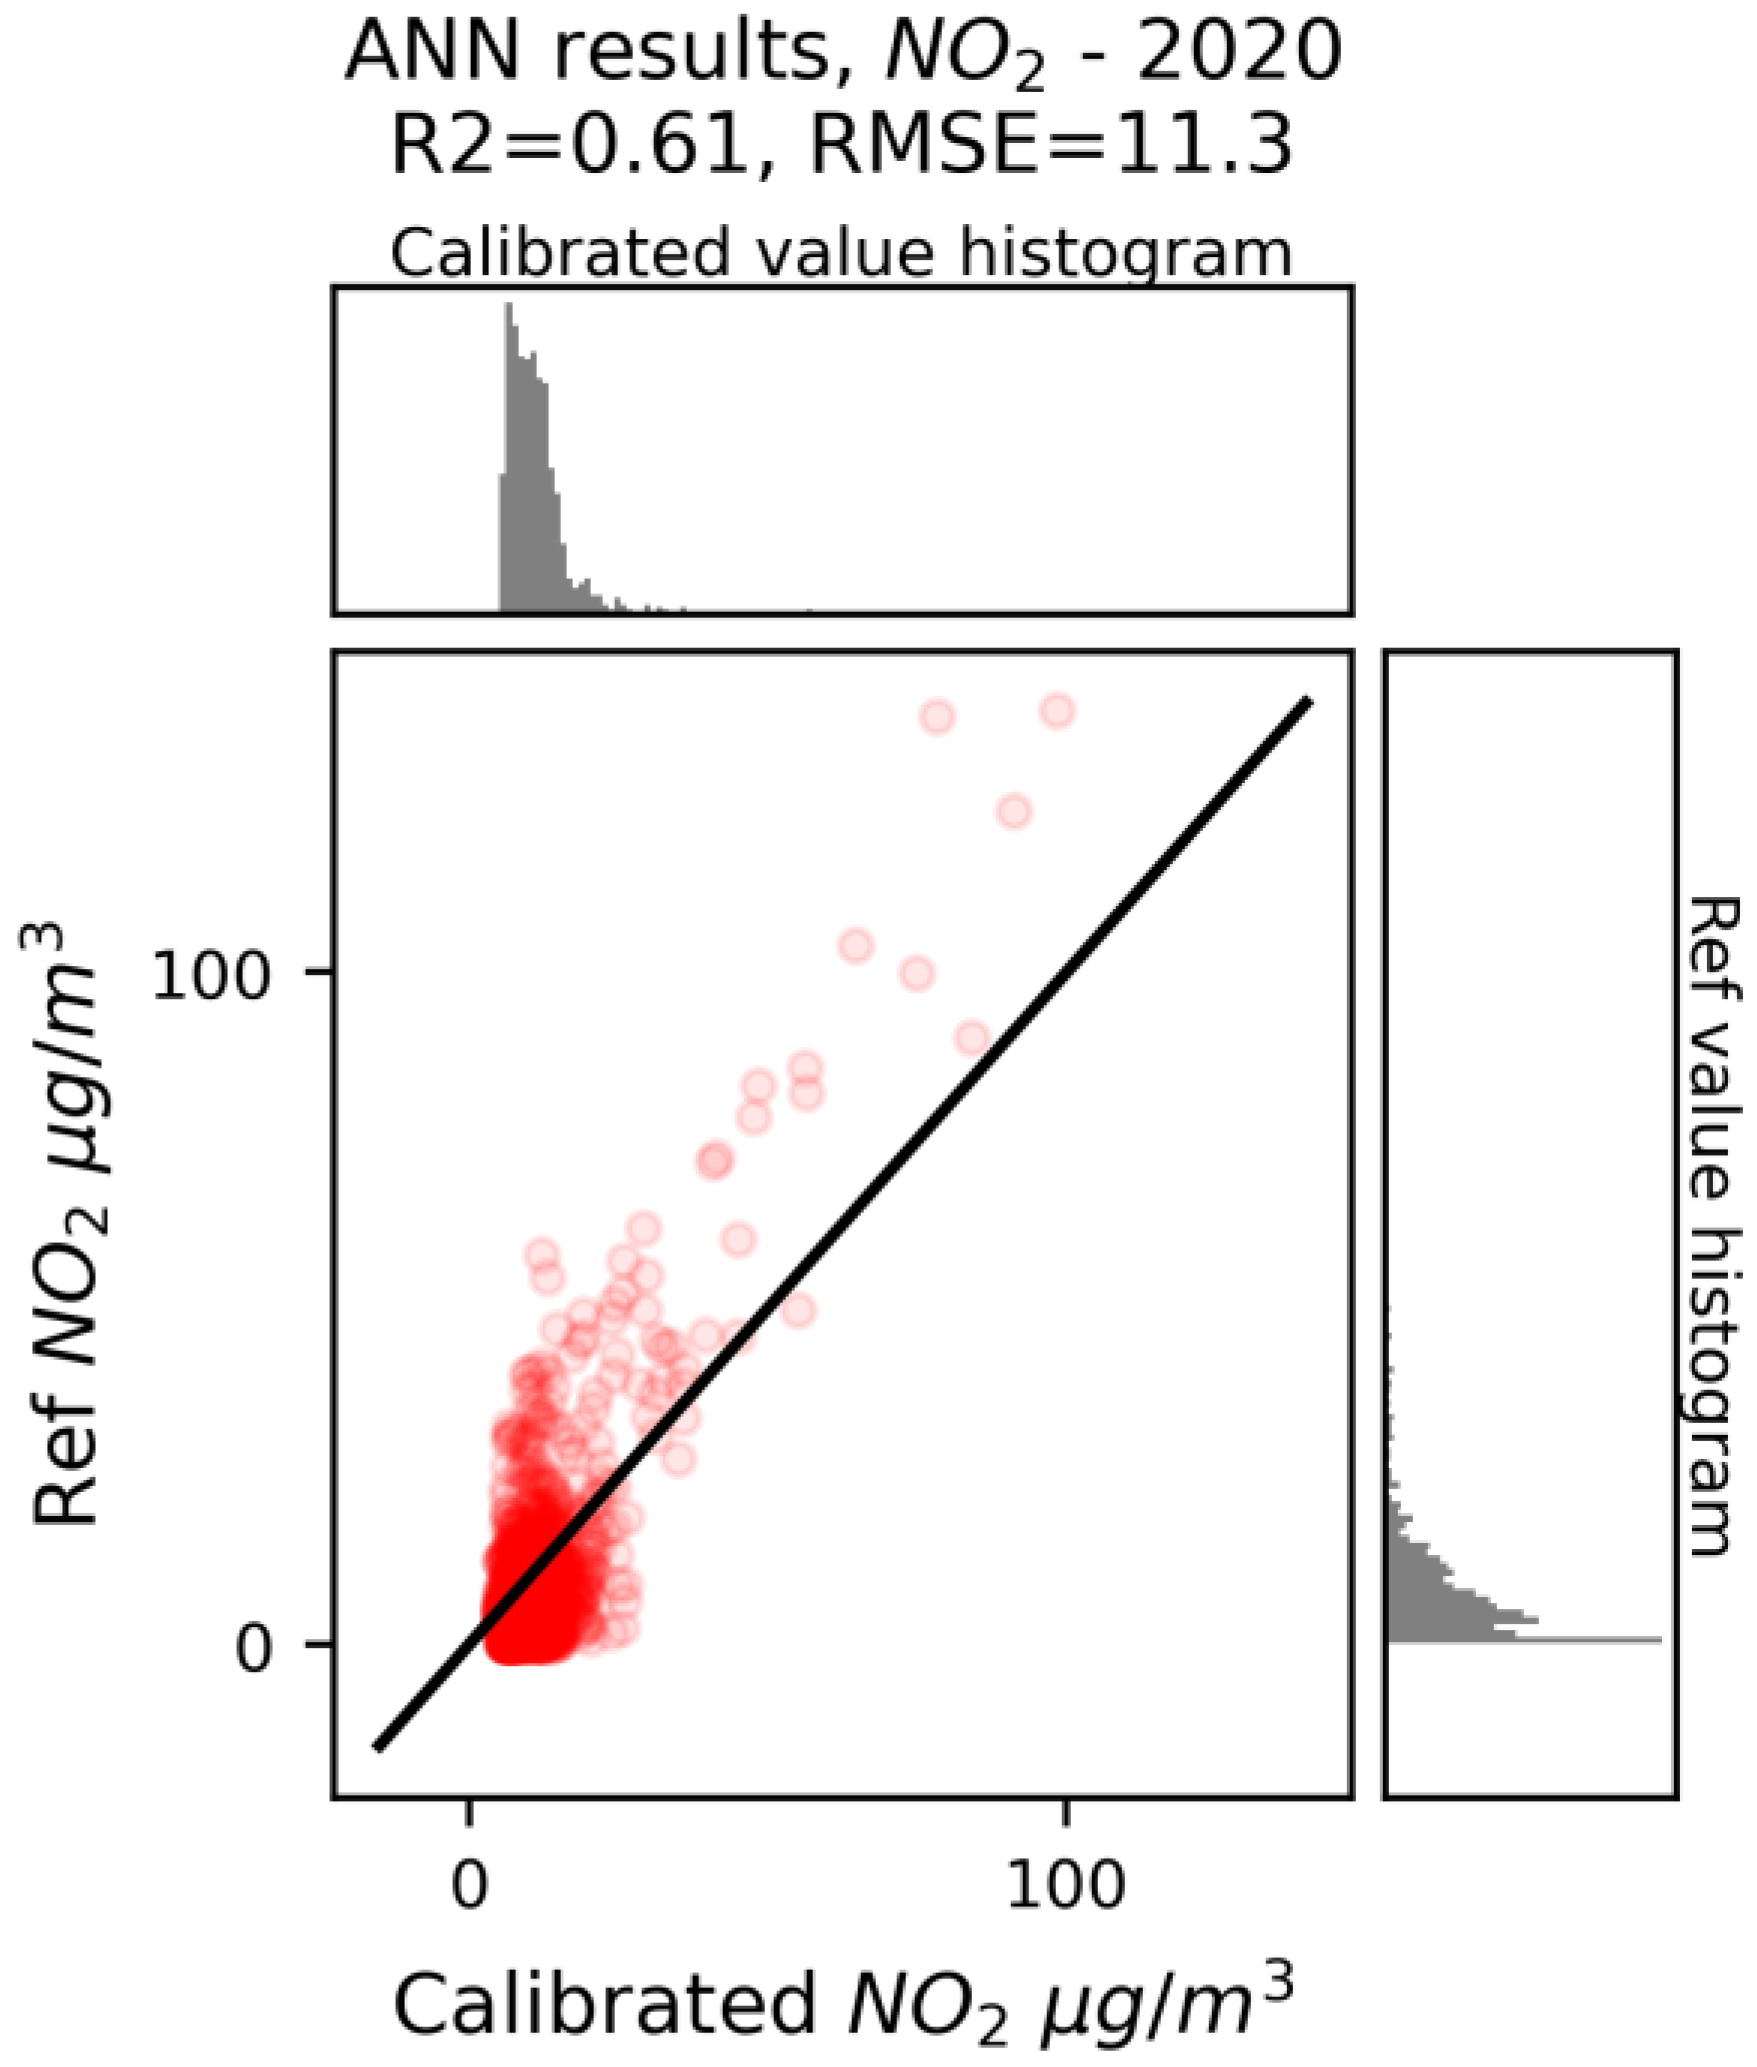
When it comes to the NO
2 measurements, quite a significant decline in the mean, median and standard deviation values can be observed in 2020 for both the reference and low-cost sensors. This is also consequence of the state of emergency, since the main source of NO
2 is traffic, which was significantly reduced during the state of emergency. The low values of NO
2 are also responsible for the poor correlation between the reference and LR data (R2 factor of 0.260). The low-cost NO
2 sensor tends to have trouble with low concentrations of NO
2, but the implemented ANN managed to pick up on these dependencies as well as the influence of RH and t on the measurements. Furthermore, the ANN trained on 2019 data that was applied to 2020 data shows a significant improvement of the raw measurements, implying that the behavior of the NO
2 sensor, although not perfect, is consistent through 2019 and 2020. The achieved improvement can be seen in
Figure 2 and
Figure 3, with
Figure 2 containing the results of the LR performed in 2020 and
Figure 3 containing the results of the ANN trained on 2019 data and applied to 2020 data.
Figure 2 and
Figure 3 show not only a clear improvement in regard to the scattered points being closer to the
y =
x line, but the histogram shape as well. The consistent behavior of the low-cost NO
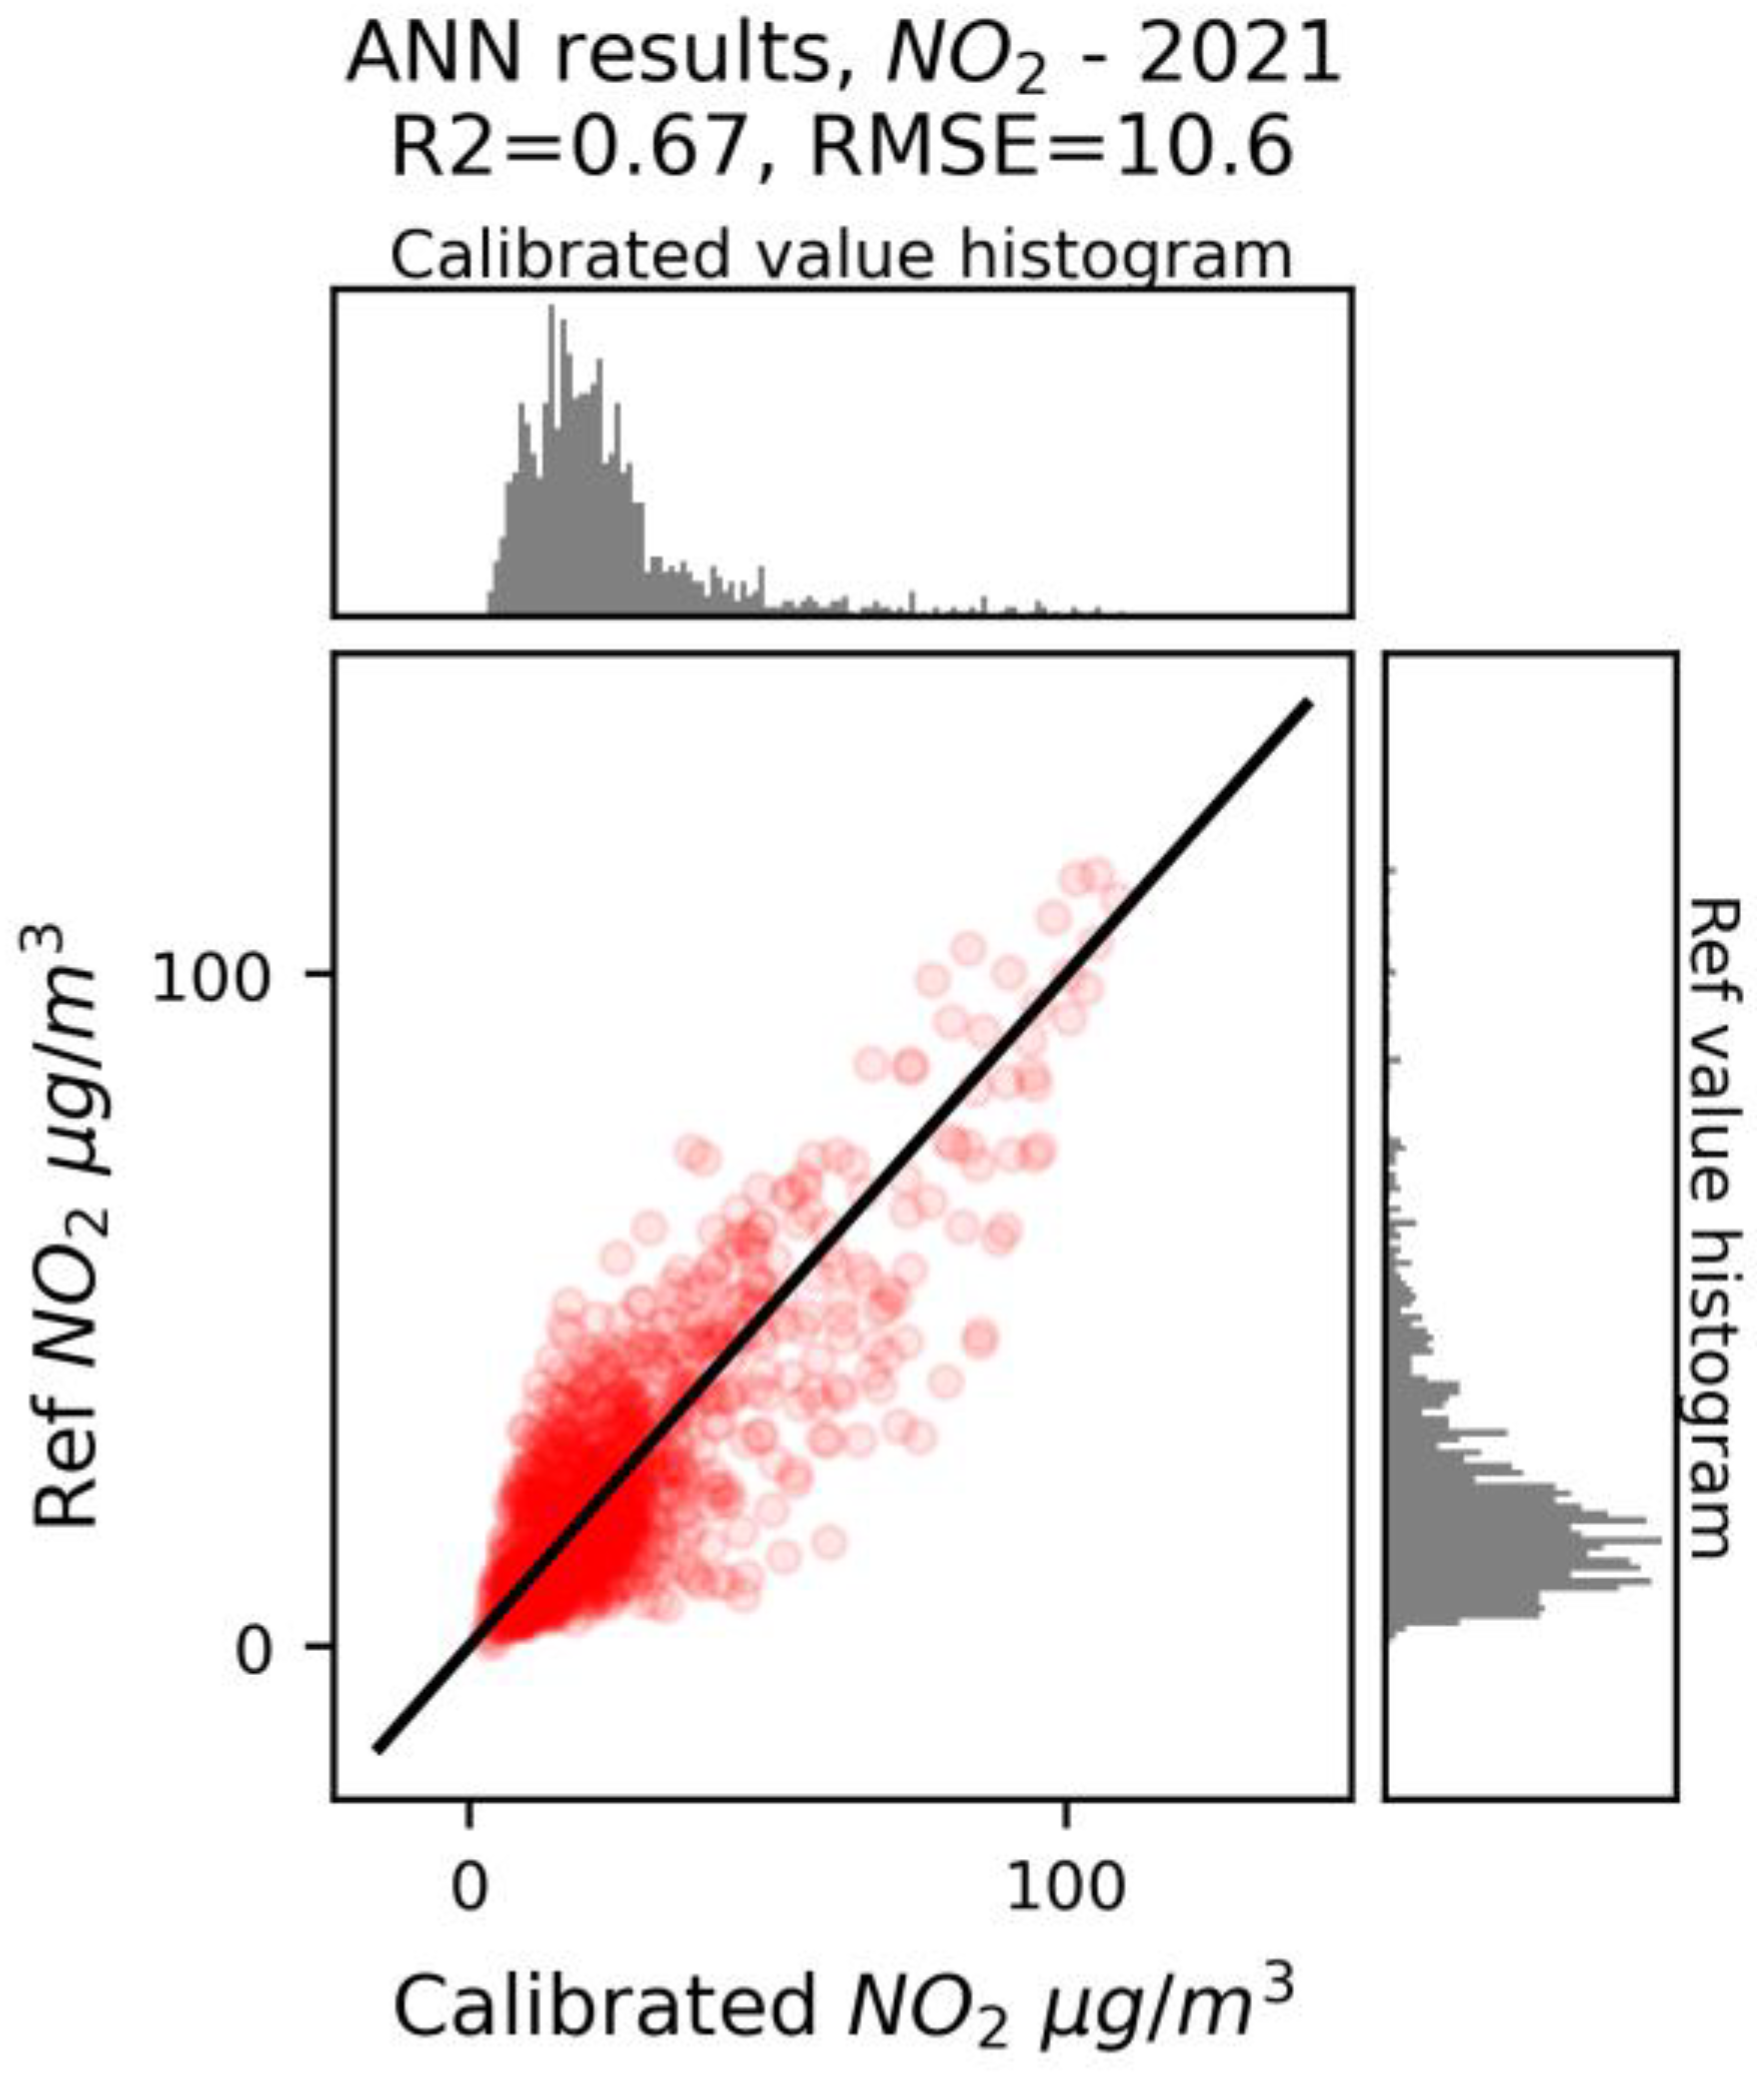
2 sensor can also be observed in 2021. The initial correlation (after only the LR correction) is a lot better than in 2020, since the traffic (and therefore NO
2 concentration) was closer to the regular regime. The improvement achieved using the ANN is still present, but less prominent than in 2020. It is also important to note that a better improvement was achieved when the ANN was trained on the data from both 2019 and 2020, as opposed to the case where the training set contained only 2020 data. This is an expected result because the low-cost NO
2 sensor seems to have consistent behavior throughout the years, and a larger training dataset implies a better correspondence of the algorithm with the underlying dependencies. The achieved results can be seen in the following figures, with
Figure 4 showing the results of the LR performed in 2021 and
Figure 5 showing the results of the ANN that was trained on 2019 and 2020 data.
Higher concentrations of the NO2 measurements can also be seen in the figures in comparison to the year 2020. The improvement achieved is visible, again, both in the position of the scatter points as well as the histogram distribution.
When it comes to the PM10 measurements, no significant change in the concentrations throughout the years can be observed in the reference measurements. The low-cost measurements are successfully corrected for 2020 using the ANN, but for 2021 this is not the case. In contrast to the NO2 measurements, the results for 2021 are better when the ANN is trained solely on data from 2020. This can be expected considering the nature of the low-cost PM10 sensors and their degradation. The low-cost PM10 sensors are optical, and they measure the light that is reflected off the particles that enter the sensor chamber. As time passes, the particles accumulate, blocking the entrance to the sensor chamber, resulting in lower PM10 measurements as the particles cannot properly circulate through the sensor chamber and therefore refract less light. Taking this into account, the low-cost sensors’ behavior in 2019 is vastly different from their behavior in 2021. Because of this, the ANN gains no benefit from 2019 data as they do not represent the same dependency between the variables that can be observed in 2021. Finally, the improvement for 2021 (when the ANN is trained on 2020 data) is present only for the R2 factor, while the RMSE is higher than the one obtained after LR. This is most likely because of the changes in the baseline of the low-cost sensor, caused by sensor degradation, although the overall behavior of the sensor in 2021 is still similar enough to the one in 2020 to provide an increase in R2.
4. Conclusions
The source of NO2 pollution in cities comes from burning fuel (cars, buses, trucks and power plants), so road traffic is the main source of NO2. In accordance with other published work in this area, we have noticed a remarkable decrease in NO2 during the COVID-19 lockdown. On the other hand, pollutants related to domestic heating showed constant or higher levels. CO and PM10 pollutants in cities are mostly related to individual domestic heating sources (gas, fossil fuels and biomass) and heating plants, thus showing almost the same level for PM10, while CO showed a slight increase. It has to be noted that the source of PM pollution might not always be local pollution, but could come from remote areas, brought by the wind. It could be observed that the PM concentrations did not decline remarkably despite a reduction in traffic, which leads to the conclusion that the PM concentration locally varies according to the dominant PM pollution source in the observed area that corresponds to the specific micro-meteorological climate.
A convolutional ANN has been proposed in this paper to explore the possibilities of modeling the influence of relative humidity and air temperature on the low-cost measurements. We have concluded that for the CO measurements, no significant improvement could be achieved, but for those of NO2 and PM10 a clear improvement can be observed. When training the developed convolutional network on 2019 data and testing it on 2020 data (during the COVID-19 lockdown), an improvement of 0.346 is achieved for the NO2 R2 value, and an improvement of 0.126 is achieved for the PM10 R2 value. This shows that the data from a regular period can be used to train a model which can then improve the performance of low-cost sensors even during a different day-to-day regime. It is important to note that our developed model uses sequences of data, and that this choice is made because when the same train/test data splitting methodology was attempted with single measurement points and simpler machine learning models (fully connected ANN and random forest) no improvement could be achieved.
In our future work, we will explore the influence of the lockdown on different pollutants. An exploration of more complex convolutional neural networks will also be performed, including an expansion of the network input parameters (both meteorological and other pollutants) as well as the possibilities of cross-calibration between low-cost sensors.


