Article

Real-Time Quantification of Crude Protein and Neutral Detergent Fibre in Pastures under Montado Ecosystem Using the Portable NIR Spectrometer

1
MED—Mediterranean Institute for Agriculture, Environment and Development, Instituto de Investigação e Formação Avançada, Universidade de Évora, Pólo da Mitra, Ap. 94, 7006-554 Évora, Portugal
2
Food Colour and Quality Laboratory, Área de Nutrición y Bromatologia, Facultad de Farmacia, Universidad de Sevilla, 41012 Sevilla, Spain
3
Department of Animal Production, Campus of Rabanales, University of Cordoba, 14072 Córdoba, Spain
*
Author to whom correspondence should be addressed.
Submission received: 18 September 2021 / Revised: 5 November 2021 / Accepted: 8 November 2021 / Published: 11 November 2021

Abstract

:

Featured Application

The knowledge of pastures’ nutritional value in the Montado ecosystem is critical for farm managers’ decision-making regarding soil fertilization, animal supplementation and grazing management. Laboratory determinations of the parameters related to pastures’ nutritional value (crude protein, fibre and others) are very expensive, destructive and costly, in terms of time and labour. This study shows the potential of a portable near-infrared spectrometer as a fast and non-destructive technique for estimating, in situ, pasture quality parameters.

Abstract

The Montado is a Mediterranean agro–forestry–pastoral ecosystem. Knowledge of pastures’ nutritional value is critical for farm managers’ decision-making. Laboratory determinations are very expensive, destructive and costly, in terms of time and labour. The objective of this experimental work was to calibrate and validate a portable near-infrared spectrometer (micro-NIR) to predict the nutritive value (neutral detergent fibre, NDF and crude protein, CP) of pastures in the peak of spring 2021. Thus, a total of 87 pasture samples were collected at eight experimental fields located in the Alentejo, Southern region of Portugal. The results show good correlations between in-situ micro-NIR measurements and pasture NDF reference values (R2 of 0.73 and 0.69 for calibration and validation models, respectively), and a moderate correlation between micro-NIR measurements and pasture CP reference values (R2 of 0.51 and 0.36 for calibration and validation models, respectively). These results show the potential of this tool for the quick evaluation of pasture quality and constitute a starting point for future work, which should include the monitoring of temporal variability (throughout the entire vegetative cycle of the pasture) and spatial (with geo-referenced information) diversity of pastures characteristic of the Montado ecosystem in the Mediterranean region.

1. Introduction

Montado is a multifunctional agro–forestry–pastoral ecosystem [1] of “High Natural Value” [2], where agricultural, forestry and animal production come together [3]. It usually occupies soils with structural and fertility limitations: shallow, stony, acidic, nutrient-poor, with micronutrient imbalances (namely the magnesium/manganese ratio) [3] and degraded due to erosion and loss of nutrients [4]. Montado is a highly complex system, and this complexity results from the interaction between climate, relief and the various elements that make up this ecosystem: soil, pasture, trees and animals [3,5]. This ecosystem is located in a geographical region called Alentejo, in Southern Portugal, which is affected by the Mediterranean climate. This climate is characterized by hot, dry summers and mild winters, with large rainfall irregularities [6] great seasonality and variability [5]. This variability in rainfall in each year and between years, means that pasture production (quantity and quality) is also irregular. According to Miao et al. [7] the inter-annual variability of precipitation may explain the differences in the quantity and quality of pasture, with biomass production and its nutritional value increasing with the annual increase in precipitation. On the other hand, the fertility of the soils, the diversity in the floristic composition, the trees and grazing animals, also contribute to great variability in productivity and quality of the pasture [8]. In this sense, also, Biewer et al. [9] report that the nutritional value of pasture can be very variable within the same field, during the growing period, due to nutritional deficiencies, frost, and drought or grazing.
Knowledge of the nutritional value of pasture and its availability over time can lead to improvements in production systems and grazing management of ruminants [9,10,11]. According to Serrano et al. [12] grazing management decisions are made as a function of pasture quality and availability. Therefore, monitoring pasture quality leads to increased farm efficiency [13]. Real-time information about the nutritional value of the pasture will allow the farmer to make more informed decisions regarding animal supplementation [11]. The survey of the spatial and temporal variability of biomass, based on the cutting and collection of pasture samples, is a destructive, time-consuming, expensive [13,14], and labour-demanding method, impracticable from a practical perspective [15], which has led to a growing interest in expeditious methods [16]. The time required to sample processing [11] and to obtain the results of the determinations of the nutritional value of the pasture [10], carried out in the laboratory, is also another indirect cost, often preventing the use of these determinations by the farmer for decision-making [12,13,17]. Indirect pasture sampling methods minimize the physical removal of vegetation and were mainly developed with the aim of obtaining rapid methods that can be used over large areas [18]. In this sense, new non-destructive technologies are increasingly used, in order to better understand the variability of production in large areas and implement new production strategies [19]. Recent developments in the technological field, in terms of electronic sensors, are already an effective response today, allowing fast, reliable and large-scale measurements [20]. As an alternative to traditional methods, a method emerged that uses near-infrared (NIR) equipment, which through reflected infrared radiation estimate the chemical constituents of pastures [10].
NIR spectroscopy (NIRS) is based on the absorptions of C–H, N–H, O–H, C–N and C–C groups present in organic constituents [13], as well as S–H groups [21]. This technique measures the spectrum of infrared energy reflected from a sample illuminated by white light [11]. NIR radiation has an amplitude from about 780 to 2500 nm in the electromagnetic spectrum [17,21,22,23]. According to Murphy et al. [24] this radiation amplitude varies between 700 and 2500 nm. Givens and Deaville [25] refer that this spectral region varies between 730 and 2500 nm. NIR measurements can occur by transmittance, reflectance or transflection; transmittance allows information to be obtained from the entire volume of the sample that is traversed by light, while reflectance only allows information to be obtained from the surface of the sample [17]. With NIRS it is possible to determine the chemical composition of animal feed quickly, non-destructively [10,17], with less sample pre-processing and with high precision [14,25]. According to these authors, this technique contrasts with traditional chemical analyses, as it does not require reagents and does not produce residues. In addition, this method allows for faster and cheaper determinations [10,26,27,28]. Alomar et al. [29] report that NIRS has been widely used because it is a fast, reliable and capable method of evaluating the quality of pastures. The technique is rapid, non-destructive [21,25,26,30,31], precise, and cost-effective, compared with other laboratory techniques [32]. However, for it to be used in different conditions and different pastures, it requires calibration, using reference data [10]. The variability associated with natural pastures compromises the use of NIRS somewhat, since calibration and validation are more challenging when environmental variation is high [33]. On the other hand, Danieli et al. [27] report that this technique allows a reliable evaluation of pasture quality, especially in terms of CP (crude protein) and NDF (neutral detergent fibre). The use of near-infrared spectroscopy (NIRS) for green pasture analysis has been available for several years in many European laboratories, which determine the components of animal feed [12]. However, the use of this laboratory equipment requires the cutting of pasture samples, which, as already mentioned, is a costly method in terms of time, money and labour, as well as being inaccurate, as it is not possible to sample the entire field. According to Serrano et al. [12] it also requires pre-processing the sample to be homogeneous, before performing the spectroscopic analysis. This pre-processing involves the dehydration of pasture samples and their grinding. When the pre-processing of the samples is not carried out, the precision decreases, due to the heterogeneity of the samples, especially with regard to the size of the particles [33]. The use of the NIRS technique for the evaluation of fresh samples has several obstacles, including irregular particle size and sample heterogeneity [34]. With the advancement of technology, smaller and lighter equipment emerged, which gave rise to portable equipment [17]. These sensors have several advantages over laboratory models, especially in terms of size, weight and manufacturing process, as well as less initial investment [35]. According to Lanza et al. [23], in recent times, more attention has been paid to portable NIR than to laboratory models, due to reduced weight and ease of use, allowing direct, non-destructive and in-situ sample measurement. Portable sensors have the advantage that the sensor itself is taken to samples and not the other way around, which allows for a win-time in the process of obtaining results and reducing costs and labour in collection, transport, processing and laboratory analysis [31]. Pullanagari et al. [28] refer that real-time analysis with the micro NIR overcomes the spatial and temporal variability of the pasture. According to Alomar et al. [29], in samples with large amounts of water, strong absorption signals are generated, which overlap and darken other spectral characteristics, which can lead to non-linear responses, which has led to this technique being used mainly with dry samples. Also, according to Kademi et al. [36], spectra are often disturbed by different interferences in the signal acquisition, which is a practical problem of this technique. Another problem associated with these portable sensors is their narrow wave-length range [35]. According to Bell et al. [11] the main advantage of portable NIRS is that it allows a more frequent analysis of the pasture, reducing the time interval between sequential nutritive value readings, thus contributing to more timely decision making. Parrini et al. [33] report that in field pasture analysis allows a reduction in costs and time, compared to laboratory analyses. Portable NIRS makes it possible to analyse and provide the farmer with real-time data relating to pasture and soil nutrients in a soil–pasture–animal system [11].
The aim of this study was to calibrate and validate the use of a portable near-infrared spectrometer to predict pasture quality (crude protein and neutral detergent fibre) in the Montado ecosystem during spring peak.

2. Materials and Methods
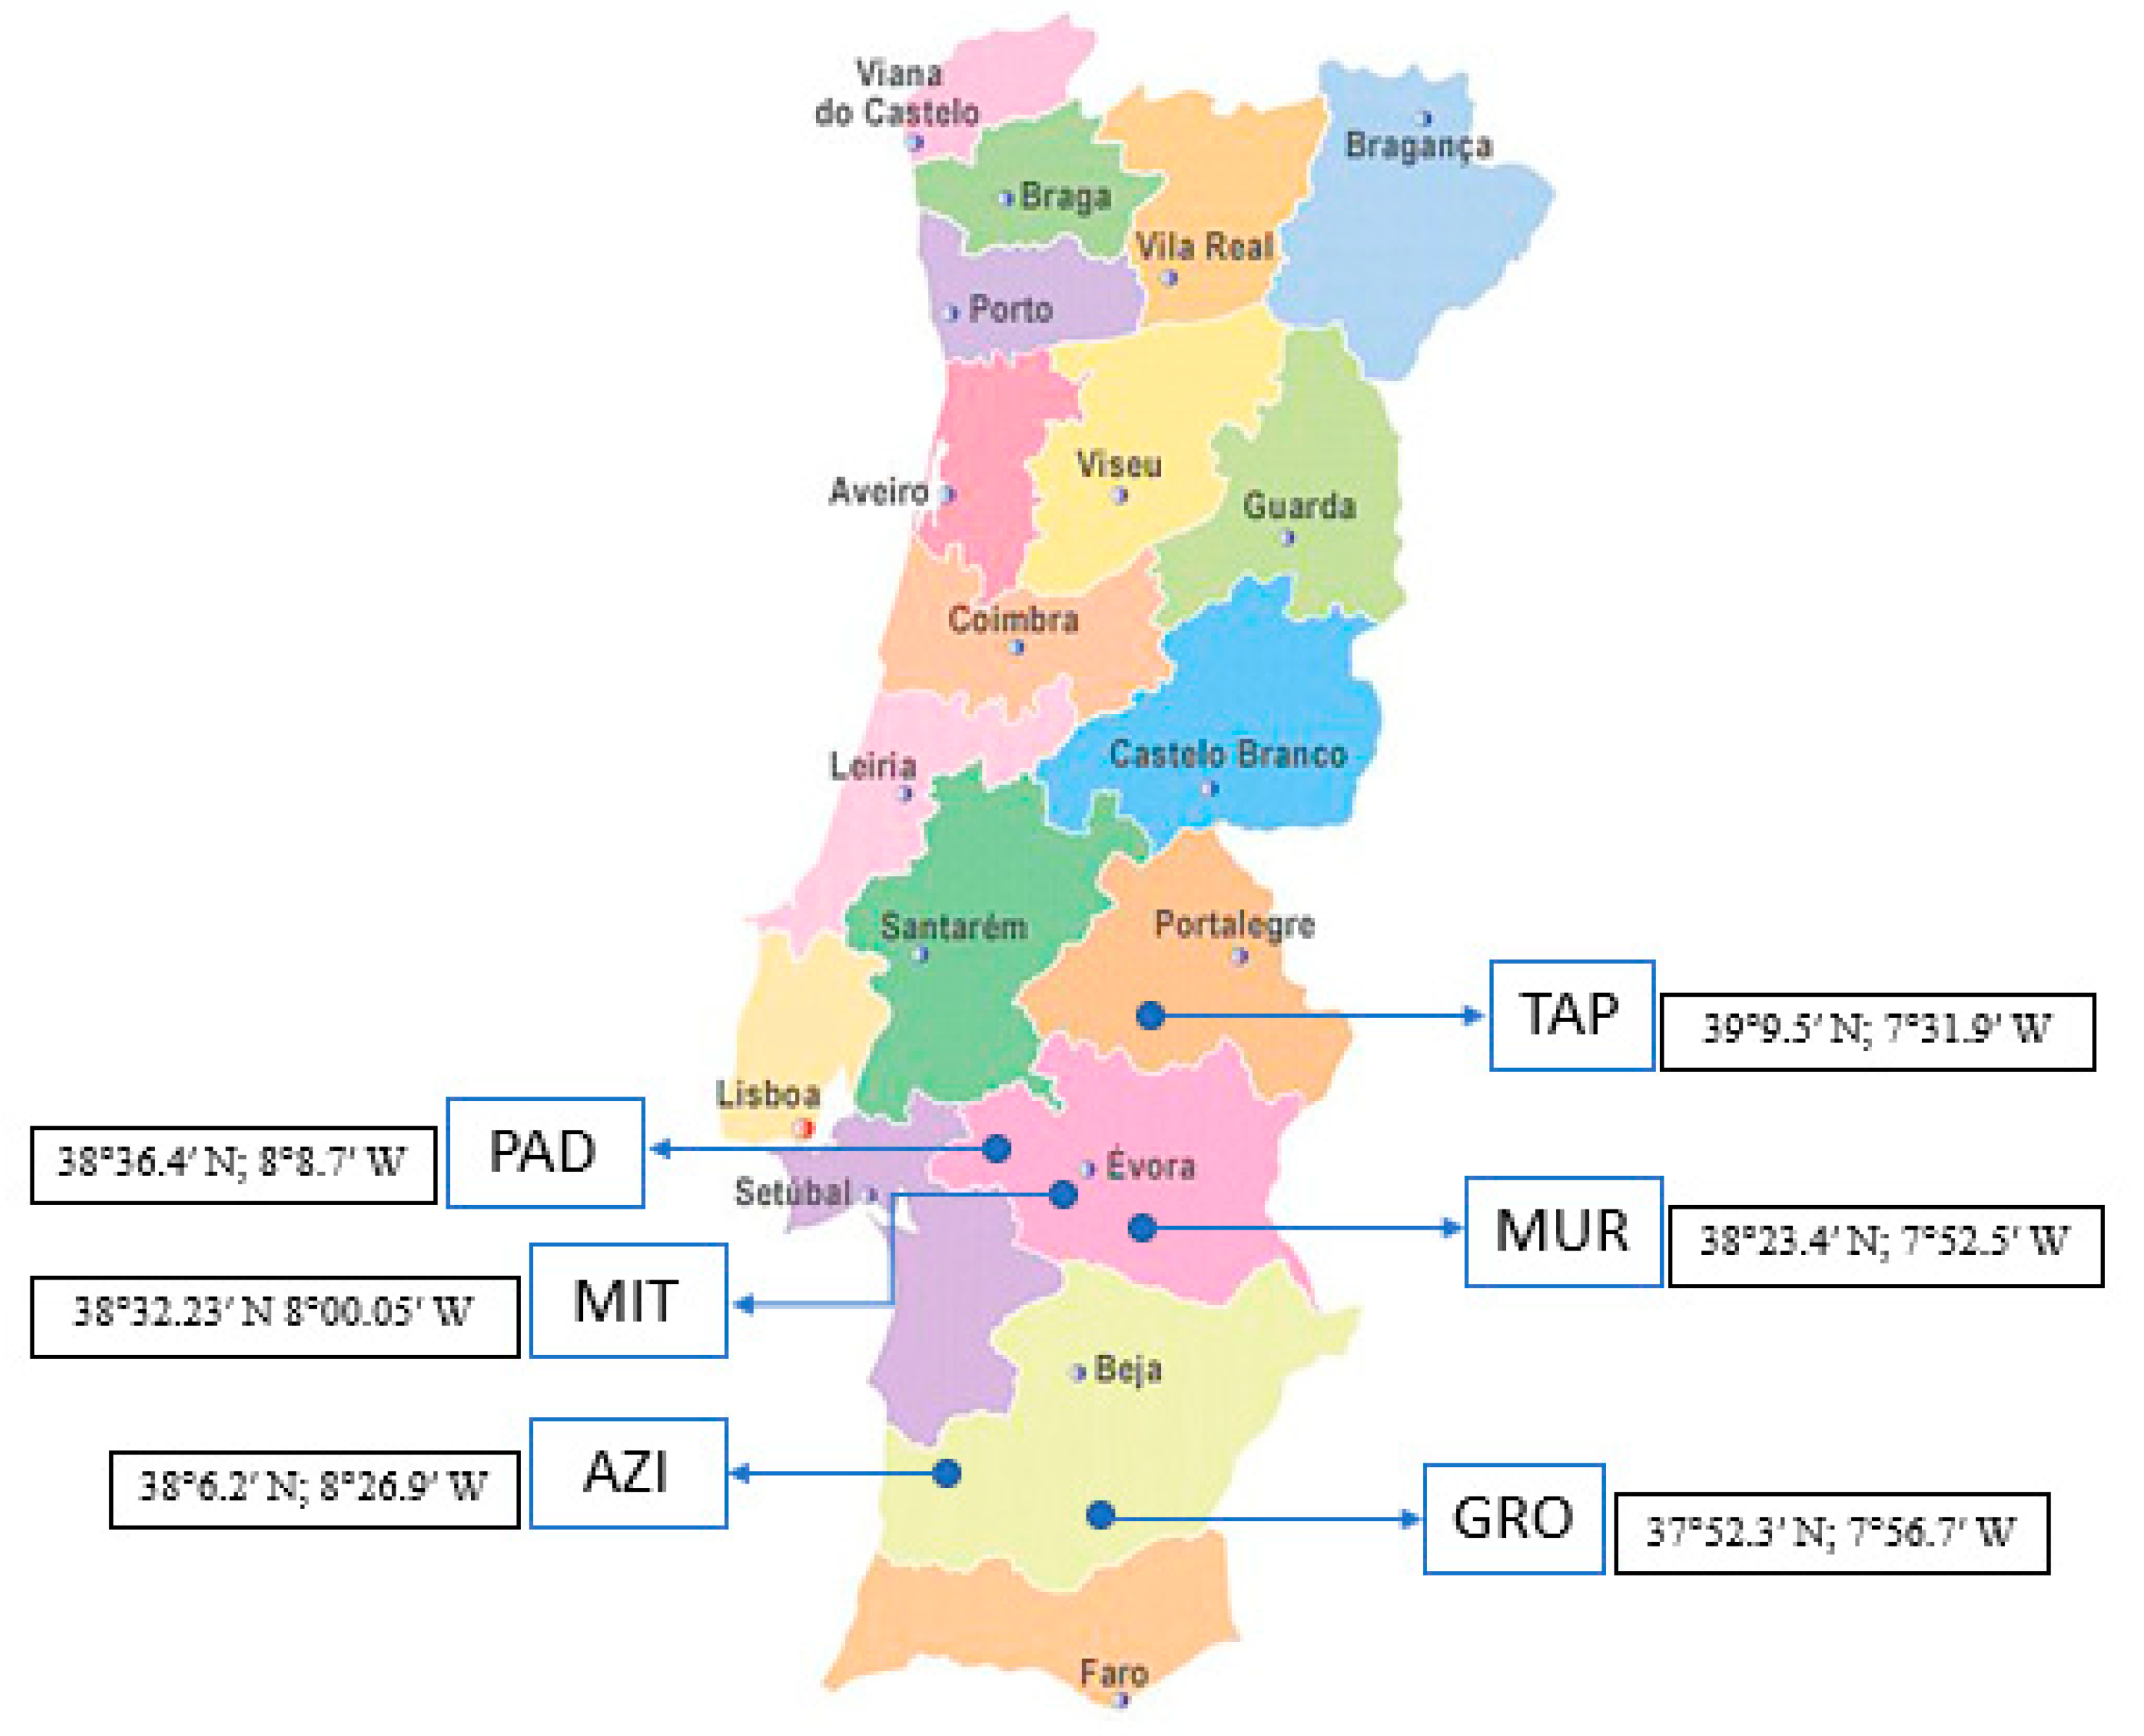
2.1. Study Area

This work was carried out between 30 March and 13 April 2021, at six farms located in the Alentejo region of Portugal. Figure 1 shows the geographical location of these farms, “Grous” (Gro) and “Azinhal” (AZI) farms are located in the district of Beja (Lower Alentejo region); “Padres” (PAD), “Murteiras” (MUR) and “Mitra” (MIT) farms are located in the district of Évora (Central Alentejo region); and “Tapada dos Números” (TAP) farm is located in the district de Portalegre (Upper Alentejo region). Dryland pastures under scattered Holm oak and Cork oak are grazing by sheep or cows in continuous or rotational systems. The characteristics of each farm were described by [37,38].

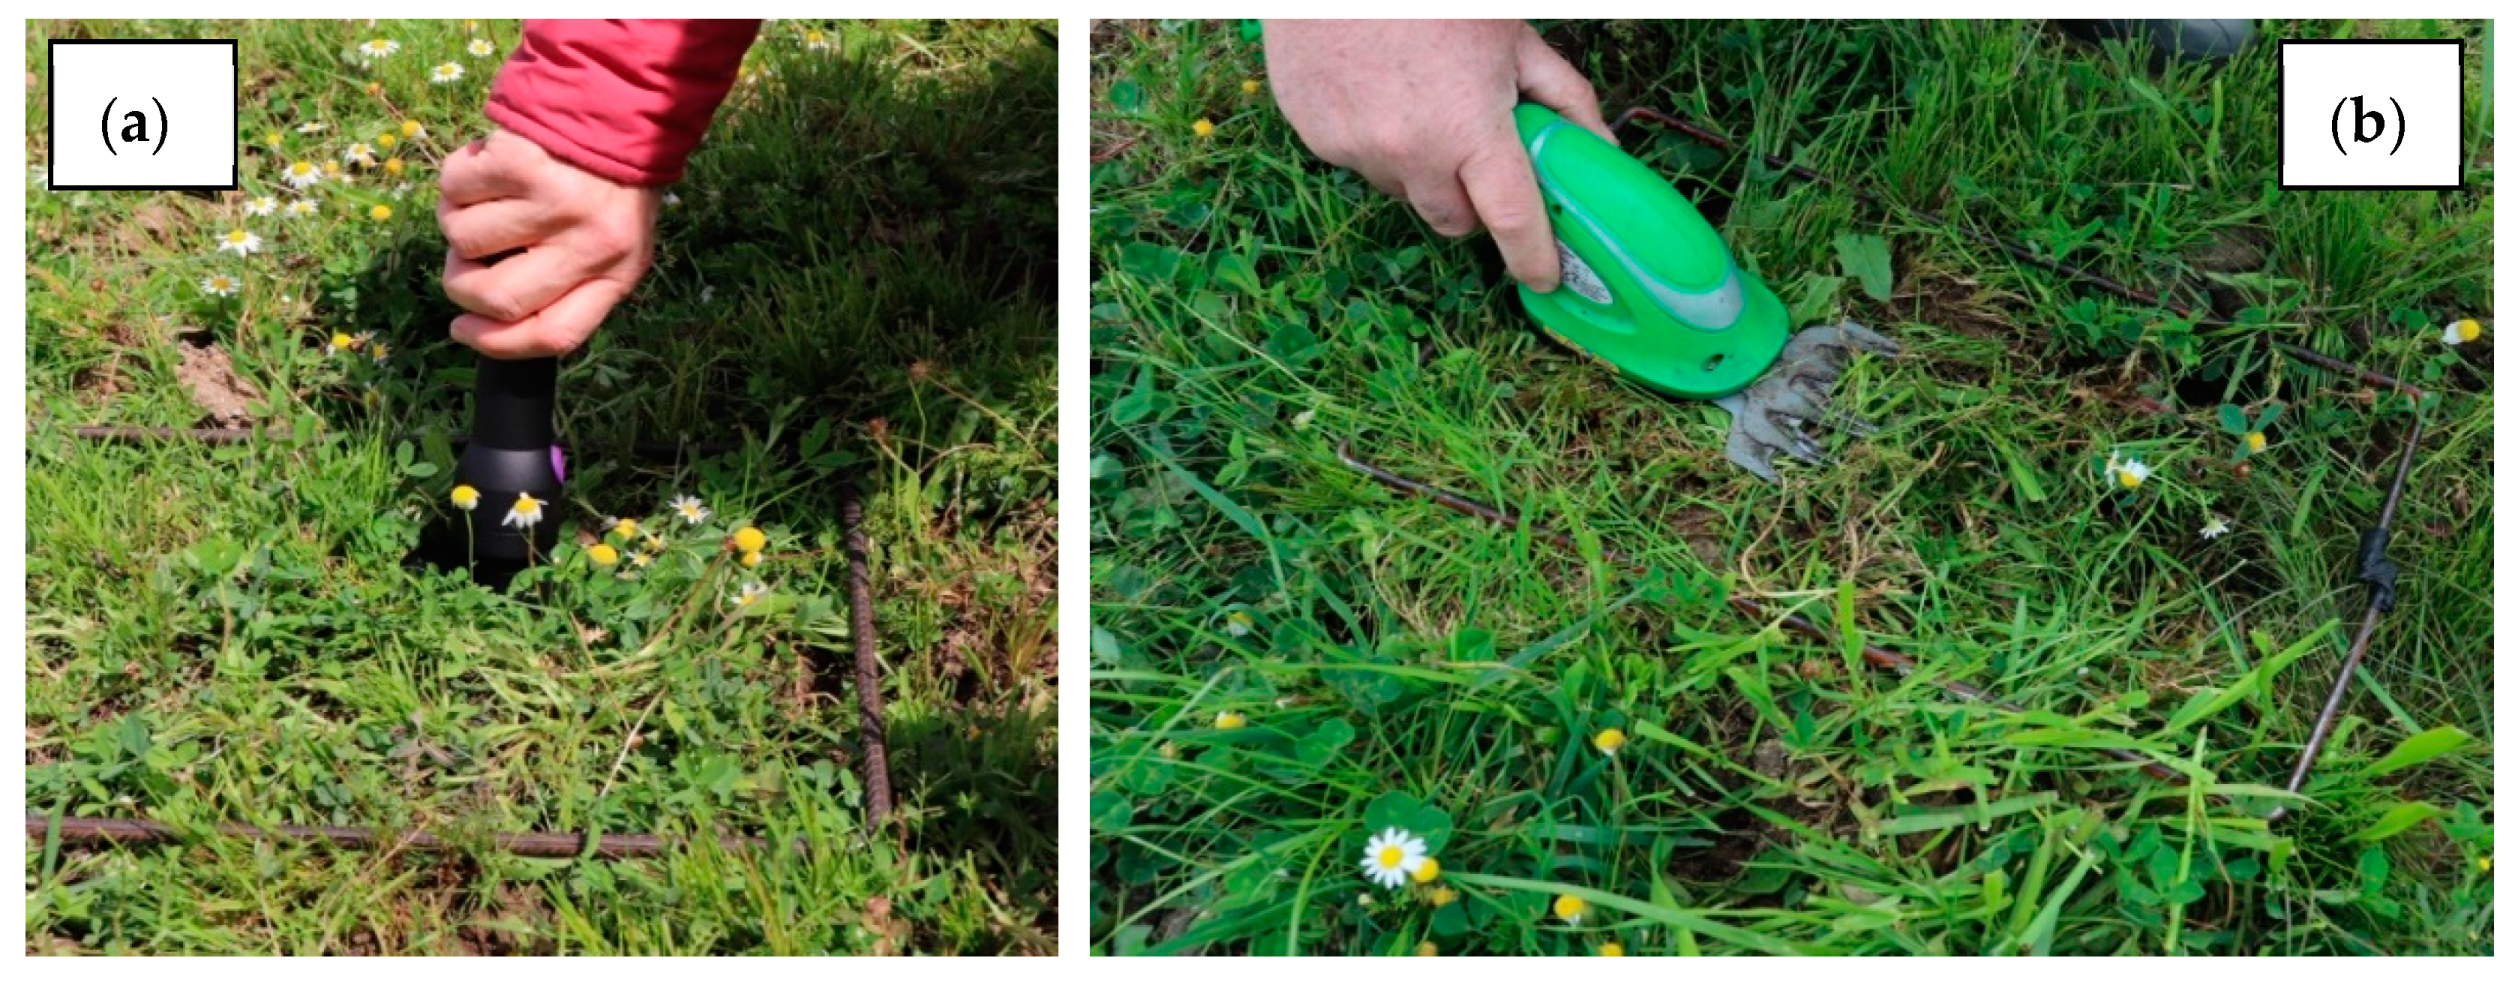
2.2. Samples Mensurements and Colletion

For this study, 87 pasture samples were used, each consisting of a composite of three random locations, for each monitored and georeferenced sampling point. At each of these locations, measurements were taken with an infrared spectrometer, then the pasture was cut (Figure 2) and placed in a plastic bag, properly identified with the sample code. At each location, a metal quadrat with 0.1 m2 of area was placed to define the area for the above-mentioned procedures. Note that on the Mitra farm, there were three different plots (Mitra A, Mitra B and Mitra C).

Reference Chemical Processing

The samples were then transported to the Animal Nutrition and Metabolism Laboratory—MED Mediterranean Institute for Agriculture, Environment and Development, weighed on arrival and their fresh weight recorded. Later, they were placed in an oven at 65 °C, for 72 h, to be dehydrated, having been weighed at the end and their dry weight recorded. Drying temperatures between 65 °C and 70 °C are acceptable for the dehydration of pasture samples [34]. With fresh weight and dry weight, the pasture dry matter (DM, in kg·ha−1) and pasture moisture content (PMC, in % of DM) were calculated. According to Alomar et al. [34] the dehydration of pasture samples is carried out with the main objective of preserving the pasture that cannot be immediately analysed in the laboratory, in addition to facilitating grinding, reducing water variations between samples and homogenizing each sample, and thus reducing sampling errors. Next, the dehydrated samples were ground in a Perten instrument mill equipped with a 1-mm sieve, for subsequent determination of reference values of CP and NDF, expressed in percentage on a dry weight basis, using conventional wet chemistry methods according to the Association of Official Analytical Chemists [39]: (i) the nitrogen content was determined according to the Kjeldhal method, i.e., a colorimetric determination on an automatic analyser (Bran + Luebbe) with a conversion factor for CP of 6.25 (method no. G-188-97 Rev 2, Bran + Luebbe, Analyzer Division, Norderstedt, Germany); (ii) NDF content was determined according to the Goering and Van Soest method (1970) in a Fiberted digester (Foss Tecator AB, Hoganas, Sweden).

2.3. Sprectra Collection

Spectra were obtained in situ with a Micro-NIR OnSiteW (VIAVI, Santa Rosa, CA, USA), a portable device which collects diffuse reflectance spectra in the spectral range between 950–1650 nm, with a spectral resolution of 6.2 nm and equipped with an InGas photodiode array detector, equipped with a sapphire window of 18 mm with an aluminium enclosure for use in the field. Spectra were collected with 10 ms as the integration time and 100 as the scan count. Prior to spectra acquisition and to verify the spectrometer performance, a series of tests were undertaken. A white reference was built using Spectralon to register the total reflectance value and a dark reference (total absorbance) was recorded leaving the tungsten lamps on, with the empty support, also known as dark current scan.
From each area of 0.1 m2 five spectra were collected. Using the instrument software (MicroNIRTM Pro software, Version 3.1), the mean spectrum was calculated and exported as Log (1/R). During the development of the CP and NDF models, the important spectral regions were selected according to the weighted regression coefficients plot and the spectral range was limited to these wavelengths.

2.4. Statistical Analysis

To evaluate the accuracy of the models we preformed a multivariate data analysis using the Unscrambler software (version 10.4, CAMO, ASA, Oslo, Norway), and, for the descriptive analysis, the means and standard deviations (SD) of CP and NDF reference values were calculated.
A PLSR algorithm was used to obtain the calibration model to predict pasture CP and NDF. PLSR is a calibration technique widely used in studies involving absorbance, as it avoids the problem of very high intercorrelation between different absorbance bands [40]. The entire spectra were used, ranging from 1093 nm to 1670 nm. First derivative and SNV pre-processing transformations were used prior to calibration modelling but they did not improve the model performance in comparison to raw spectra. So, the raw spectra data was used to build the calibration models. For the model development, an internal calibration (cross-validation) was preformed using Kernel algorithm with 20 segments. Outliers were excluded by PLSR. Warning limits were predefined for the detection of potential outliers. The criteria used to detect outliers was based on the F-Residuals and Hotelling’s T2 statistics, calculated with an error of 0.05 and with 95% of confidence, respectively. Model performance was evaluated through coefficient of determination (R2), the root–mean–square error (RMSE), residual predictive deviation (RPD) and average difference between predicted and actual values (Bias). The R2 is an excellent indicator of robustness and model accuracy [37]. Although R2 is often the main statistical indicator used to assess the accuracy of the calibration model, according to Davies and Fearn [41] it is not the best indicator for this purpose, as it depends on the range. The RPD value is directly related to the quality of the calibration model, and the higher its value, the better the model [42]. This index corresponds to the ratio between the standard deviation (SD) of the reference values of laboratory determinations and the RMSE [28,37]. Finally, the bias indicator is related to the difference between the calibration and validation predicted and measured values [28,31]. The smaller the bias, the more accurate the model.
The RMSE (Equation (1)), as the designation indicates, is an error, which should have its absolute value as low as possible. The RPD (Equation (2)) is an index of model quality, which should be as high as possible.
R M S E = i = 1 n ( E i M i ) 2 n
R P D = S D R M S E
where n is the number of observations, Ei are the estimated values and Mi are the observed values.
The software for multivariate data analysis was “UnscramblerX” (version 10.5.1), with a confidence level of 95% (p < 0.05).

3. Results

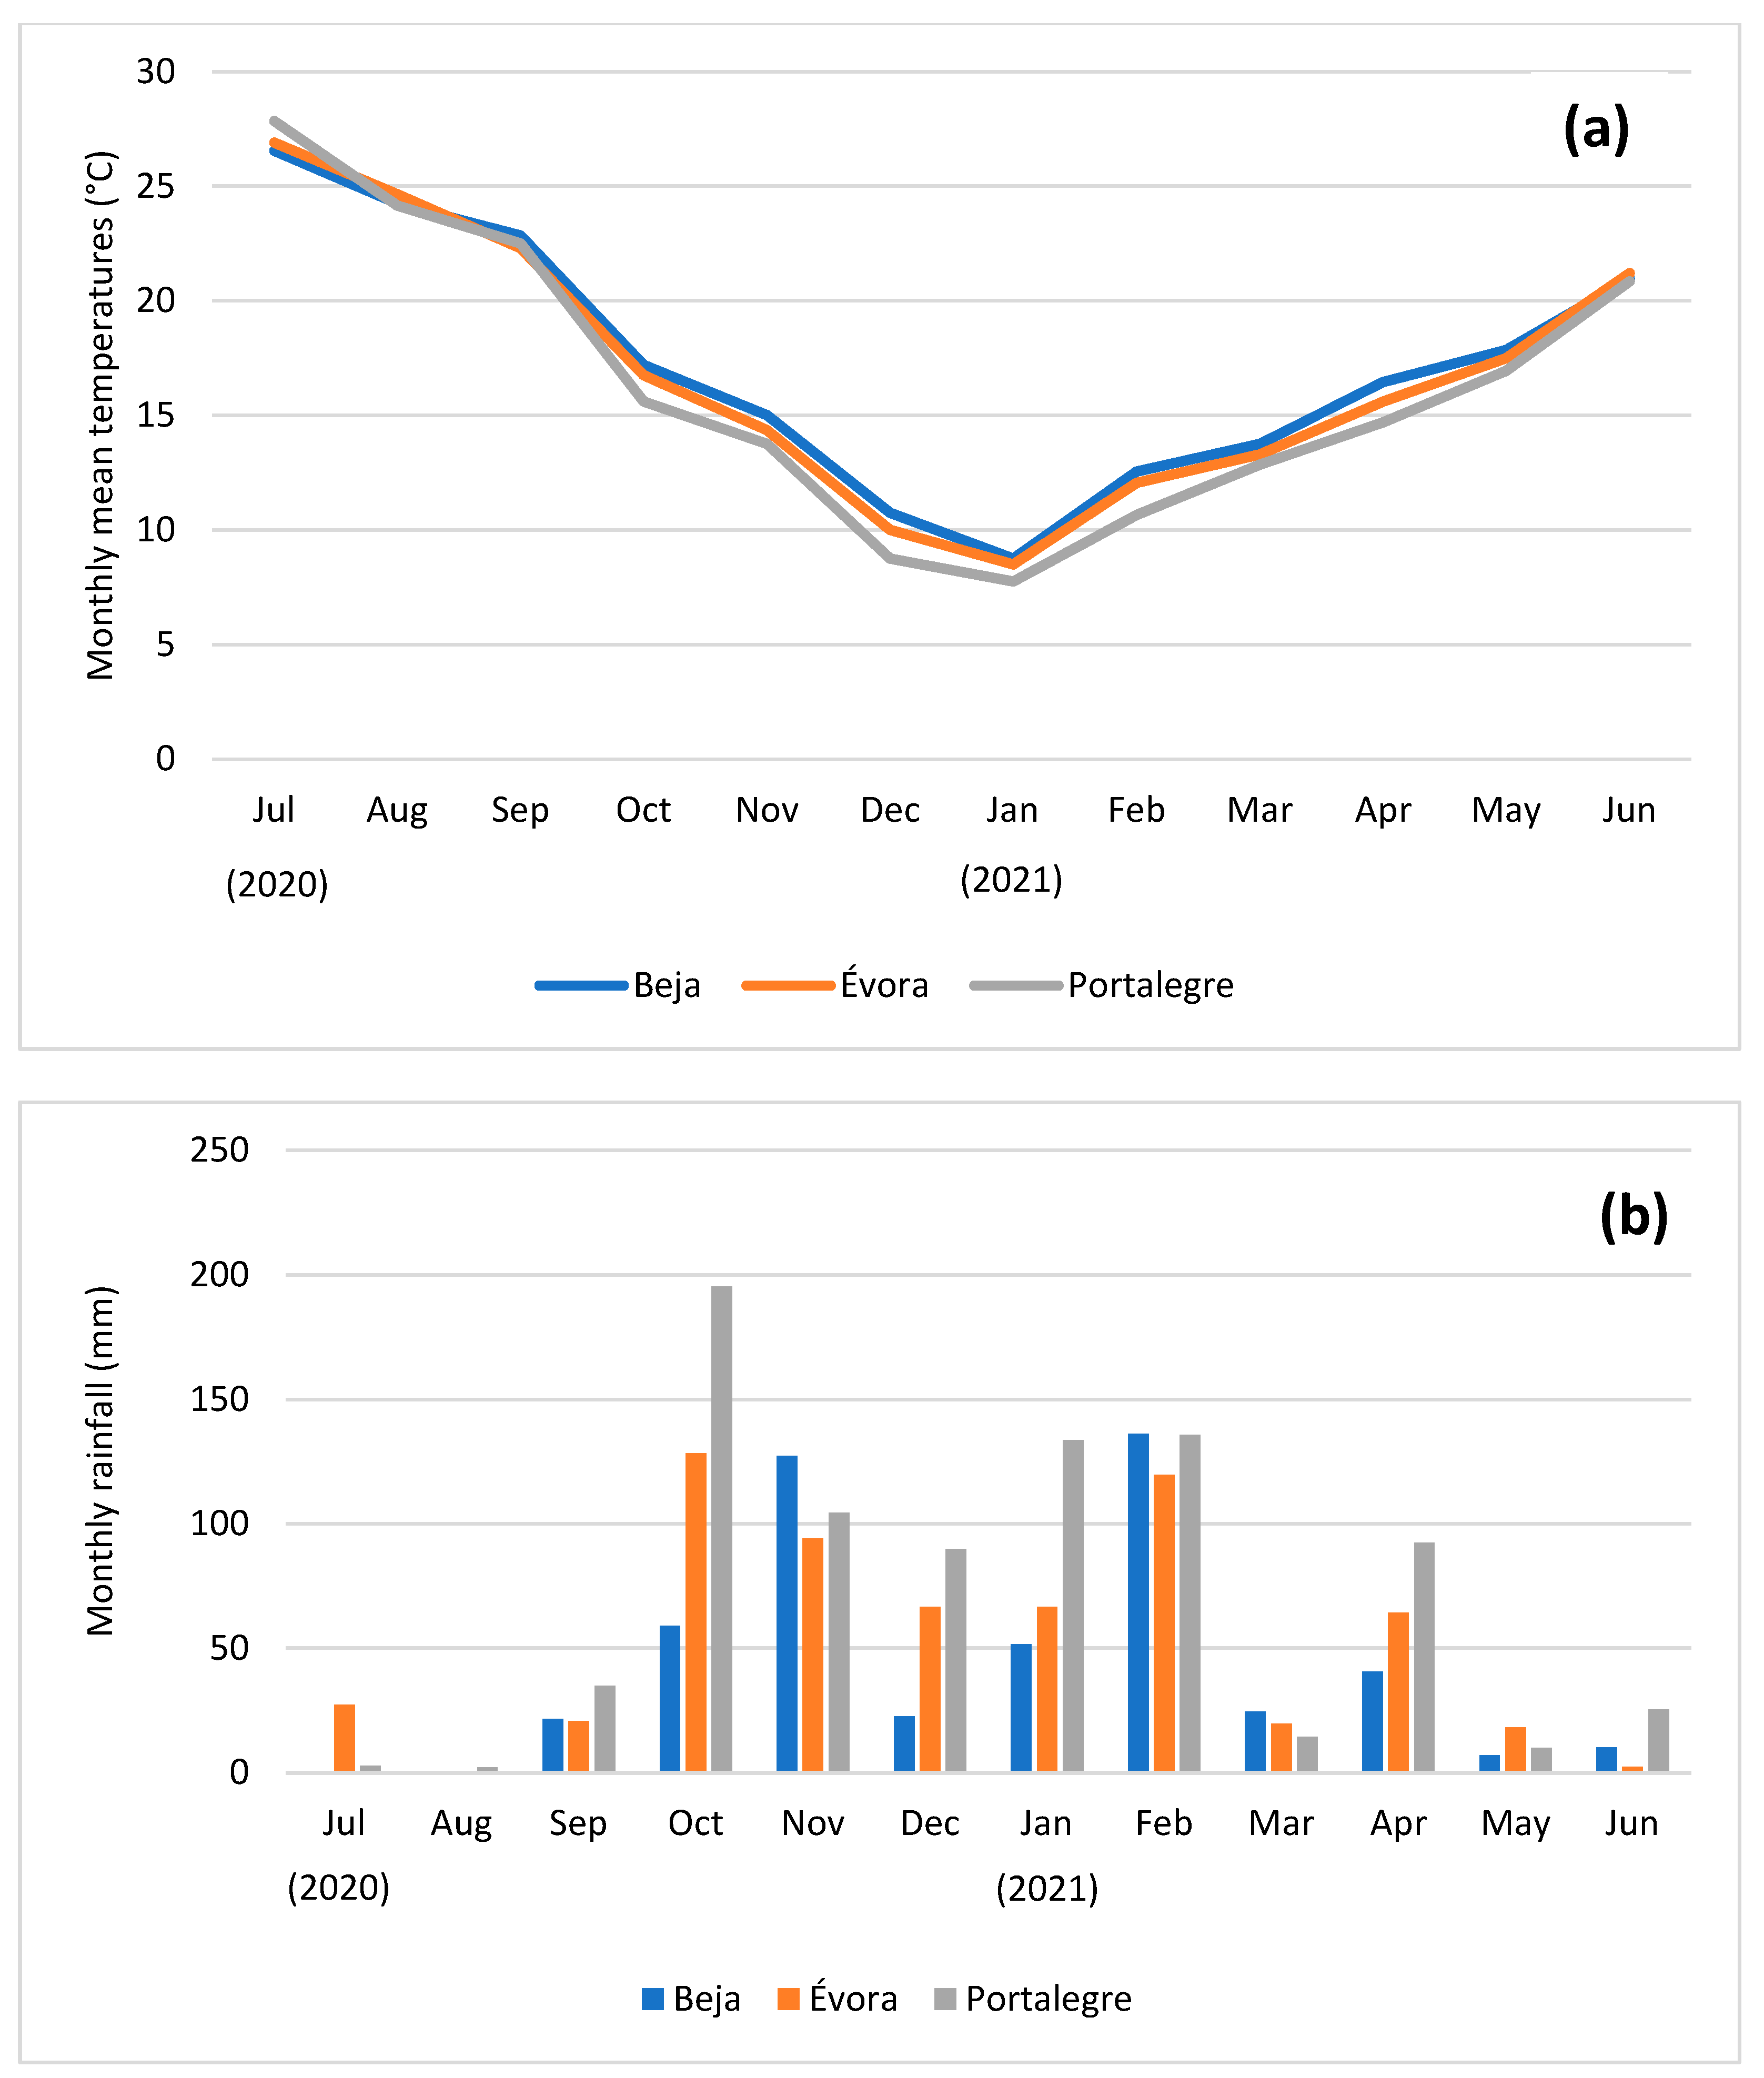
3.1. Meteorological Conditions

Figure 3 illustrates the thermopluviometric graph for the districts of Beja, Évora and Portalegre. The total precipitation (b) in this cycle of pasture production (July 2020 to June 2021) was 500 mm for the district of Beja, 628 mm for the district of Évora and 840 mm for the district of Portalegre. Just based on this climatic data, the climatic variability between districts where the farms of this study are located, is already evident. The differences in the amount of total rainfall were 128 mm, between Beja and Évora, and 240 mm, between Évora and Portalegre, which influences pasture production and quality. The average temperature (a) between July 2020 and June 2021 was 17.2 °C for the district of Beja, 16.9 °C for the district of Évora and 16.4 °C for Portalegre. These data also show that average temperature during the vegetative cycle of the pasture is higher at the farms located further south. As can be seen in Figure 3a,b, the distribution of both precipitation and temperature are irregular throughout the year: some months show large amounts of precipitation and others only residual values. The spring of 2021 was particularly dry, which may have influenced pasture quality and production. In March 2021 the precipitation values were 24.4 mm, 19.6 mm and 14.3 mm for the districts of Beja, Évora and Portalegre, respectively, and in April they were 40.6 mm, 64.2 mm and 92.5 mm for Beja, Évora and Portalegre, respectively. However, we should note the high values of precipitation in February, when temperatures are already beginning to increase.
The Alentejo region, where the study fields are located, is affected by the Mediterranean climate, with characteristic hot and dry summers and mild and humid winters, although there is a very pronounced irregularity of precipitation. Peak production and pasture quality occurs in spring, when the soil moisture content (SMC) is above 10% [8] and temperatures rise, but not excessively. In the Alentejo region, in dryland pastures, as temperatures increase throughout the spring and, consequently, the available SMC decreases, the pasture begins to dry out and its nutritional value gradually decreases. Therefore, this study took place only in late March and early April, as the pasture was at its peak production.

3.2. Evaluation of CP and NDF Reference Data

Table 1 shows the dates of micro NIR sensor measurements and pasture sample collection, number of samples, the mean and SD of pasture quality parameters (NDF and CP, in % of dry matter, DM). Mean reference value of NDF was 45.7% (range between 33.0 and 58.6%), which indicates the great variability between fields in the Mediterranean region, although all the pasture fields are in the phase of peak production (between the end of March and beginning of April). In regards to CP, the mean was 12.9% DM (range between 8.2% and 20.9% DM), which clearly highlights the great spatial variability of the pasture quality in the Montado ecosystem.

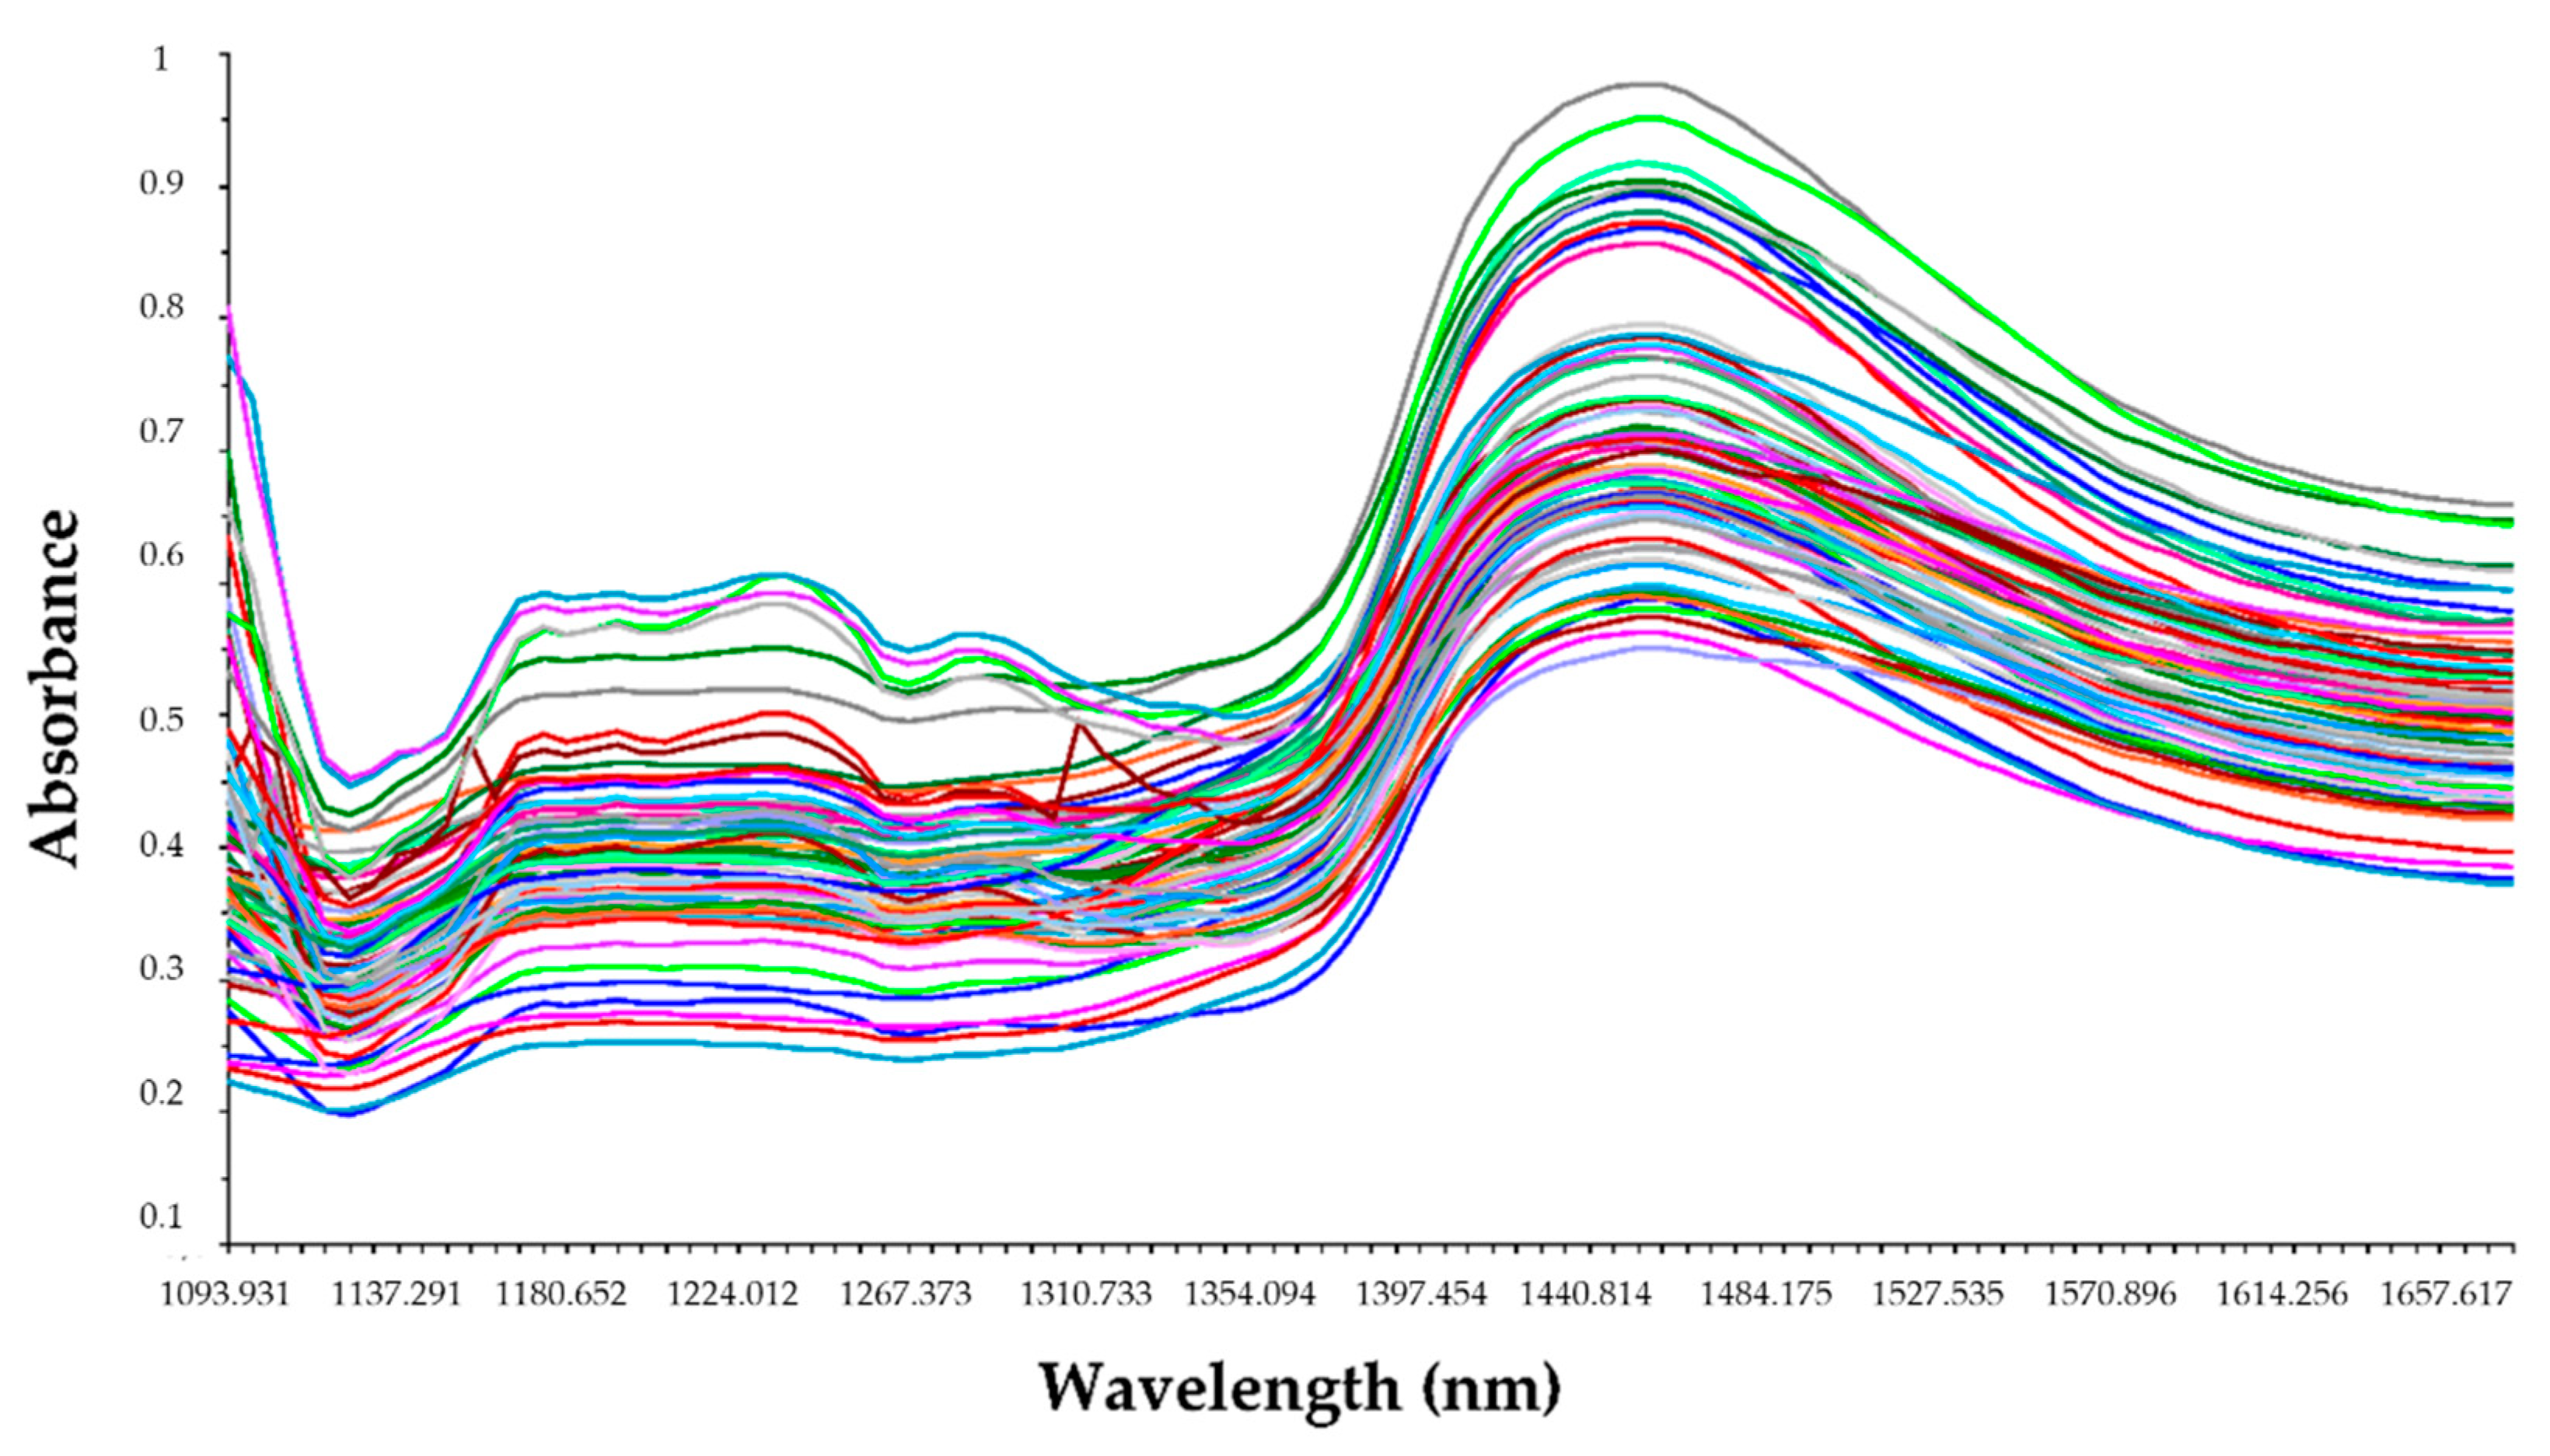
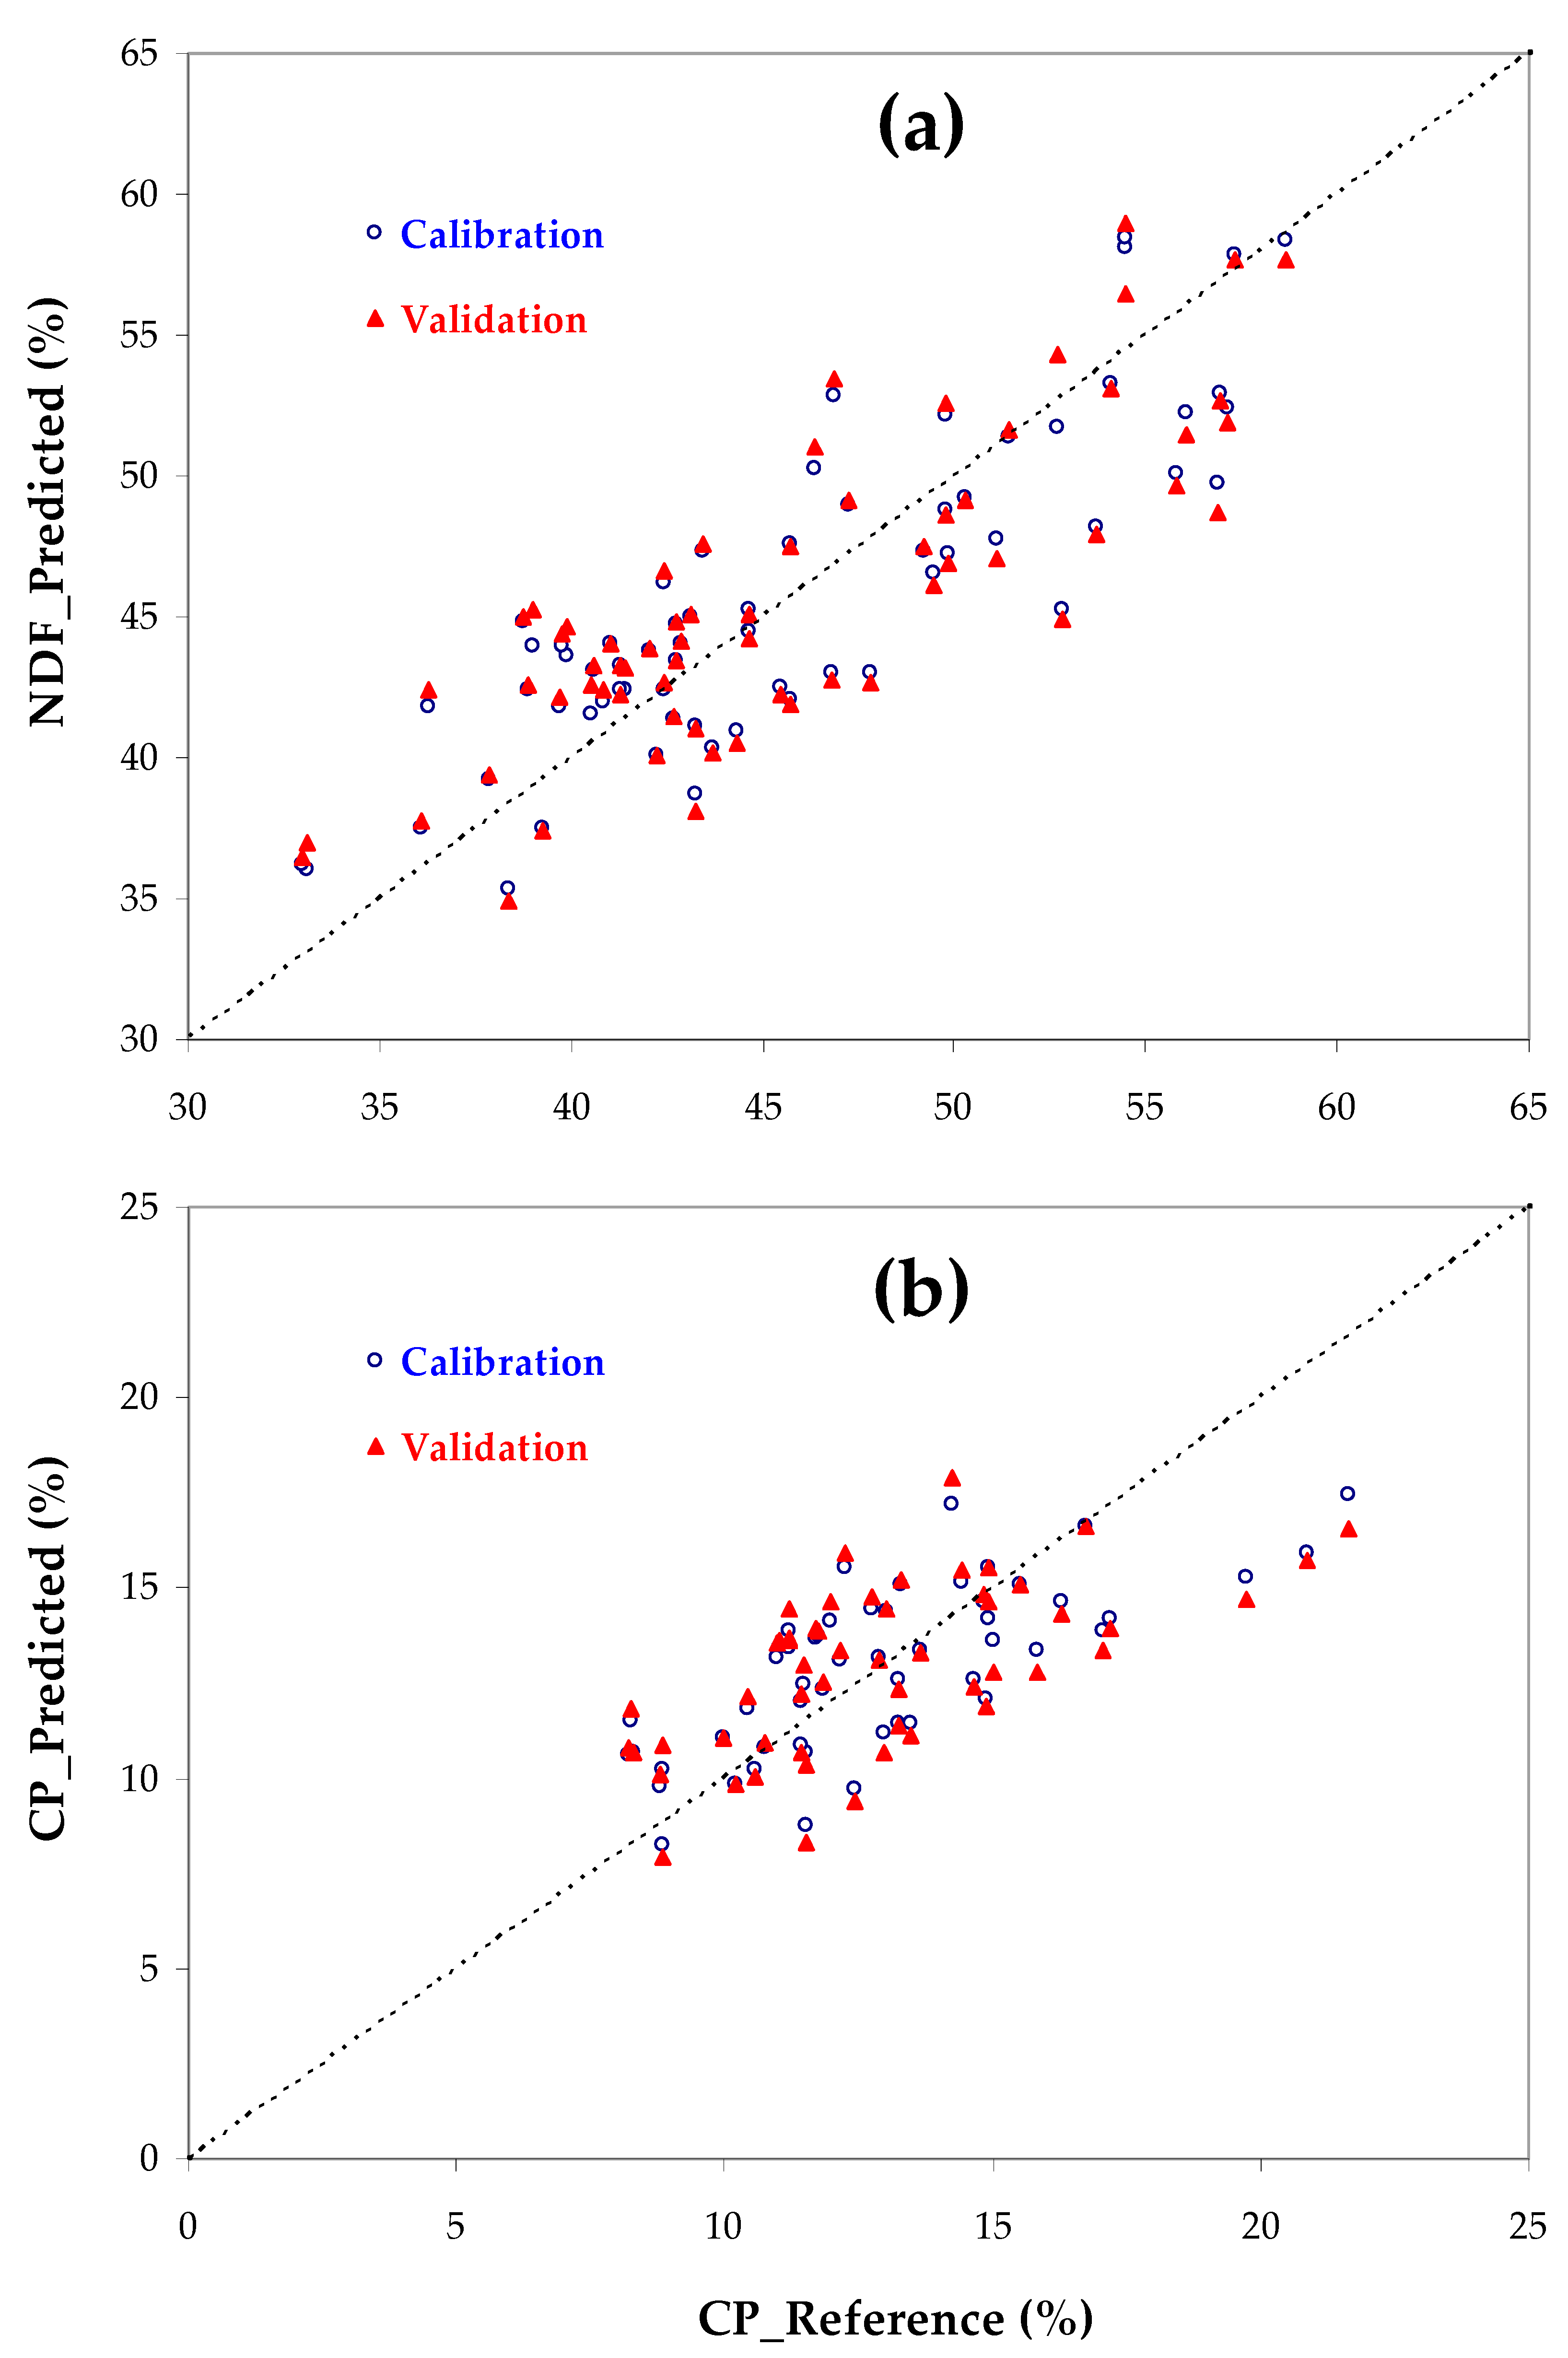
3.3. Evaluation of Near-Infrared Spetroscopy (NIRS) Data

Table 2 shows the statistical indicators for the various calibration and validation models used. Four regression models were developed: raw spectra, SNV, 1st derivative and SNV + 1st derivative. After observing the statistical indicators, it was decided to choose the raw spectra for presenting the best indicators: NDF (R2 of 0.73; RMSE of 3.302 for calibration model and R2 of 0.69; RMSE of 3.628; Bias of 0.056 and RPD of 1.75 for internal validation model) and CP parameters (R2 of 0.51; RMSE of 2.073 for calibration model and R2 of 0.36; RMSE of 2.368; Bias of 0 and RPD of 1.26 for internal validation model).
Figure 4 represents an example of pasture spectra measured directly with the micro-NIR sensor. These spectra are the starting point for the prediction of pasture NDF and CP content. As can be seen in Figure 4, the wavelength varies between 1093 nm and 1657 nm.
Figure 5 shows the reference and predicted values of NDF (a) and CP (b) resulting from the calibration and validation models. The calibration and validation points for the NDF are relatively close to each other, which means that the models can be considered good (R2 of 0.71 for calibration and 0.69 for validation). As for the CP, the calibration and validation points do not fit so well, which is a reflection of the R2 values of the calibration and validation models (0.51 and 0.36, respectively).

4. Discussion

4.1. Variability of Crude Protein and Fibre (NDF) Reference Data

In this study CP and NDF variability fit within the ranges of variation of these parameters published in other works. This variability is a function of the diversity of plant species that constitute pastures in the Mediterranean region and the different growth rates, which in turn are dependent on temperature and precipitation in each field, as well as on the spatial variability of soil fertility [12]. Also, Pullanagari et al. [28] state that pasture spatial and temporal diversity is related to the diversity of species, the interactions with grazing animals, natural environmental conditions and management production systems. Serrano et al. [37], carried out a study throughout the pasture vegetative cycle (autumn, winter and spring) and obtained CP values between 10.4% and 24.3% and NDF between 29.4% and 60.2%. Safari et al. [43], in permanent pastures in Germany, obtained CP values between 5% and 22.6%, from May to October. Similar values (CP between 6.1% and 25.6%) were obtained by Pullanagari et al. [44] in a study carried out during the vegetative cycle in mixed pastures. Also, Lobos et al. [45] in a study carried out on permanent pastures with heterogeneous floristic composition in Chile, obtained CP values between 17.8% and 29.0% and NDF values between 37.9% and 50.3%. This variability, which in this study is magnified by the inclusion of samples from various experimental fields, with different climatic, soil and management conditions, is important and necessary to validate and increase the robustness of calibration models [24]. Also, Parrini et al. [33] state that sample variability is essential, both to develop NIRS calibration models and to assess their applicability in future predictions of the nutritive value of a pasture. In this sense, Bell et al. [11] report that there is considerable spatial and temporal variation in pasture production and quality, which is still not well understood, especially in terms of nutrient concentration of different types of pasture.

4.2. NIRS Models Accuracy: Calibration and Validation

The most accurate models are those that have a high R2 and RPD, a low RMSE and Bias [12,28,37,46]. The coefficients of determination obtained in this study can be considered good for NDF (0.73 for the calibration model and 0.69 for the validation model, with RPD of 1.75) and moderate for CP (0.51 for calibration and 0.36 for internal validation, with RPD of 1.26). The values obtained from RPD are considered low [47]; however, these are expected and acceptable in experimental work involving field measurements [9]. In this discussion we have focused our attention particularly on the coefficient of determination (R2).
The NIRS technique can be used in two ways: (i) with laboratory bench NIR equipment (LBNE); (ii) in field with portable spectrometer (micro-NIR). The first requires pasture sample pre-preparation (consisting of dehydration followed by crushing and grinding, or at least crushing/homogenization), the second is non-invasive, carried out in the field without any disturbance to the pasture.
There are many works published with results of the use of LBNE to estimate the quality of plant material, whether pasture or other plant types. For example, Fontaneli et al. [10] in a study to calibrate and validate a LBNE to estimate the quality of grasses with pre-processing samples, obtained R2 values of 0.97–0.98 for both calibration and validation models of CP and NDF. Also, Swart et al. [14], in a study in which they intended to calibrate a LBNE to predict the chemical composition of feed for ostrich, found very high calibration correlations with pre-processing samples (R2 = 0.96 and 0.94, respectively for CP and NDF). In relation to biodiverse pastures, the study of Serrano et al. [37] showed significant correlation between calibration models obtained with LBNE and reference methods for quantifying pasture quality parameters, with greater accuracy from dry and pre-processing samples (R2 = 0.936 for CP and R2 = 0.914 for NDF) than fresh samples (without sample pre-preparation; R2 = 0.702 for CP and R2 = 0.720 for NDF). Also, with LBNE, Parrini et al. [33] obtained very strong correlations in analysis of green pasture (fresh samples) for both, CP and NDF (R2 values of 0.96 and 0.84, respectively). Lobos et al. [45], in a study carried out in heterogeneous pastures in Chile, used a LBNE to predict various parameters of the fresh pasture, including CP (R2 = 0.84) and NDF (R2 = 0.78).
With regard to the use of portable spectrometers (micro NIR), no published works were found referencing pastures in the Montado ecosystem, which makes it difficult to compare the results obtained in this study. However, there are works with other plants, such as in durum wheat grain CP content (R2 of 0.98 to calibration and validation with samples previously homogenized; [31]). In field measurements in pastures, without pre-processing, accuracy is normally low. For example, to estimate pasture CP, Mendarte et al. [48] obtained calibration R2 of 0.63, while Safari et al. [43] obtained R2 values of 0.58 and 0.56, for calibration and for cross validation, respectively. The best results were published by Pullanagari et al. [28], twho estimated various parameters of pasture quality in New Zealand, including CP (R2 of 0.82 and 0.78 for calibration and validation models, respectively), and NDF (R2 of 0.77 and 0.75 for calibration and validation models, respectively).
One factor that can help explain these values obtained with the micro-NIR spectrometer is that the readings can be influenced by the water that exists on the surface of the pasture/soil [29]. NIR is more accurate with pre-dried samples than with fresh samples [27]. The obscuration effect, caused by the moisture’s absorption of NIR light, is a factor that negatively influences the quality of the calibration and validation models with samples not previously dehydrated [24,49]. According to Corson et al. [26] the peak absorbance for water occurs at 1450 nm, precisely where the micro-NIR used in this study shows a high peak (Figure 4). As the measurements took place directly in the pasture and, at the peak of its productivity, it is possible that the water present on the plants influenced this absorbance peak in this spectral region.
Another aspect that may be relevant is related to the spectral range of the micro-NIR sensor, further developed in the below section.

4.3. NIRS Models Accuracy: Spectral Range

Biodiverse pastures usually present a greater spectral range due to variations in the species of plants that make up the pasture and the soil background [28]. Lignin, protein, starch, cellulose and hemicellulose, pasture constituents, have fundamental molecular bonds between O–H and C–H. Absorptions above 1960 nm are responsible for the molecular bonds O–H, N–H, O=H and O–H, C–H, C–H and O–H [50], which are precisely the main bonds of pasture quality parameters [28]. Pullanagari et al. [28] consider that bands of visible region (500 to 750 nm) are those where the highest correlations with CP and NDF occur. Similarly, Biewer et al. [9] report that in the spectral region between 620 and 1000 nm, CP can be predicted with good results. Also, Safari et al. [43] report that visible region (below 700 nm) represents the bands that correlate best with pasture CP. Furthermore, Pullanagari et al. [28] also refer to the correspondence of near-infrared (800 to 1000 nm) and infrared (1900 to 2400 nm) spectral regions with pasture quality parameters. Pullanagari et al. [44] report that the sensitive spectral bands for CP are located between 505 nm and 1000 nm, and between 2013 nm and 2420 nm, with absorption peaks at 1500 nm and 1935 nm. Corson et al. [26] and Givens & Deaville [25] also highlight the importance of 2100 to 220 nm bands for estimating pasture CP. These data can help to explain the low R2 values for CP obtained in this study, since the spectral range of useful micro = NIR is restricted to wavelengths between 1093 nm and 1670 nm.
Despite this limitation in the range of portable spectrometer, Malegori et al. [51] concluded that this equipment is sufficiently robust for directly application in the field. In this study the good correlations obtained for NDF (R2 of 0.73 and 0.69 for calibration and validation, respectively) open up good perspectives for practical application, given the importance of fibre in animal feed, particularly for ruminants. These better results obtained with fibre, relative to CP, may be due to the fact that the most important spectral region for the prediction of NDF varies between the 1370 nm and 1418 nm [37] spectral bands provided by the micro-NIR. Also, according to Corson et al. [26] and Givens and Deaville [25] the spectral regions between 1650–1670 nm and 2260–2280 nm are correlated with C–H molecular bonds for lignin and cellulose, which may help to explain the better correlations with NDF in this study, since lignin and cellulose are two of the main constituents of this parameter. The micro NIR sensor used in this study covers the first of these wavelengths’ ranges.

4.4. Perspectives for NIRS Approach

Actually, the use of proximal sensors is already a reality and should increase, with the reduction of sensor costs and complexity [52]. Due to the low cost, speed and reliability attributed to the NIR technique to estimate the quality of pastures, it is predictable that its adoption in the future will be great, providing more timely information to assist the farmers in their decision making [11,28]. The adoption of NIR technologies to estimate the quality parameters of pastures, especially using portable sensors, will help to improve the management of pastures and their nutrients, reducing production costs and losses [11]. It is expected that this adoption will mainly involve the use of a portable spectrometer, since it implies less processing time, less labour and real-time results. For the use of these technologies by farmers to be a reality, it is necessary to carry out research in the context of a real farm, in order to identify the advantages and barriers to adoption by agricultural managers [52]. As was the case in the Pullanagari et al. [28] study, the present study also focused on the evaluation of a micro-NIR sensor—a sensor never before used in pastures in the Montado ecosystem—in the prediction of CP and NDF in real farms. Yet, as already mentioned in the materials and methods section, this study was limited to the peak of production and pasture quality under Mediterranean conditions, thus, there is one measurement and harvest date for each plot. The internal calibration and validation models of the current study may not be as robust as desirable, due, as mentioned by Cecchini et al. [31], to the fact that the dataset is not particularly large. Therefore, we suggest that a similar study be carried out, under the same conditions, with a larger number of samples and throughout the entire production cycle of the pasture in Mediterranean region (autumn, winter and spring).

5. Conclusions

Dryland pastures productivity and quality is influenced by the interaction between the amount and the distribution of precipitation and the air temperature, which, in the Mediterranean climate, vary greatly throughout the year and from year to year. For agricultural managers to be able to make decisions about grazing management, animal supplementation, application of fertilizers, etc., it is essential to know a pasture’s nutritional value. Visual assessments, based on management field experience and not having the real values of pasture quality parameters (such as CP and NDF), can hinder the manager’s decision-making. The CP and NDF laboratory determinations require the cutting, transporting and pre-processing of pasture samples, with a considerable delay to obtain the results, in addition to the many human and monetary resources needed for this work. Therefore, the calibration and validation of new technologies to predict parameters of pastures’ nutritive values in real-time is fundamental and of great importance. The results of this study show the potential of micro-NIR to predict pasture fibre content (NDF) in the Montado ecosystem (internal validation model with R2, RMSE, RPD and Bias of 0.69, 3.628, 1.753 and 0.56, respectively). For pasture protein content (CP), micro-NIR showed less precision (internal validation model with R2, RMSE and RPD of 0.36, 2.368 and 1.26, respectively), which points to the need to extend this study to a larger pasture sample, one more representative of the temporal and spatial variability of pastures characteristic of the Montado ecosystem in the Mediterranean region. Micro-NIR appears to be a promising tool, since it is light, small and easily transportable, giving values in real-time, thus contributing to a more informed decision-making by the agricultural manager.

Author Contributions

Experimental work: E.C., J.S. and A.E.R.; conceptualization: J.S., E.C. and A.E.R.; data processing and statistical analysis: E.C., J.S., J.N.-B. and A.E.R.; writing—original draft preparation: E.C.; review of the text: J.S., S.S. and A.E.R.; writing—review and editing: S.S.; supervision: J.S., A.E.R. and S.S.; project administration: J.S.; funding acquisition: J.S. All authors have read and agreed to the published version of the manuscript.

Funding

This work was funded by National Funds through FCT (Foundation for Science and Technology) under the Project UIDB/05183/2020 and by the projects PDR2020−101-030693 and PDR2020−101-031244 (“Programa 1.0.1-Grupos Operacionais”).

Institutional Review Board Statement

Not applicable.

Informed Consent Statement

Not applicable.

Data Availability Statement

Not applicable.

Acknowledgments

Authors acknowledge the financial support provided by FEDER and National Funds through the Programa Operacional Regional ALENTEJO 2020 (ALT20-03-0246- FEDER-000064)—QualFastNut—Utilização da espectroscopia NIR para a análise rápida da qualidade em frutos secos.

Conflicts of Interest

The authors declare no conflict of interest.

References

  1. Batista, T.; Mascarenhas, J.M.; Mendes, P. Montado’s ecosystem functions and services: The case study of Alentejo Central—Portugal. Landsc. Ecol. Eng. 2017, 44, 15–27. [Google Scholar]
  2. Pinto-Correia, T.; Ribeiro, N.; Potes, J. Livro Verde dos Montados. Edição: ICAAM-Instituto de Ciências Agrárias e Ambientais Mediterrânicas; Universidade de Évora: Évora, Portugal, 2013. [Google Scholar]
  3. Serrano, J. Utilização eficiente dos recursos no Montado: Sensores próximos e detecção remota no apoio à tomada de decisão. Bol. CCDR Alentejo Perspect. 2020 2019, 32, 18–25. [Google Scholar]
  4. Serrano, J.; Peça, J.; Silva, J.M.; Shahidian, S.; Carvalho, M. Phosphorus dynamics in permanente pastures: Differential fertilizing and the animal effect. Nutr. Cycl. Agroecosys. 2011, 90, 63–74. [Google Scholar] [CrossRef]
  5. David, T.S.; Pinto, C.A.; Nadezhdina, N.; Kurz-Besson, C.; Henriques, M.O.; Quilhó, T.; Cermak, J.; Chaves, M.M.; Pereira, J.S.; David, J.S. Root functioning, tree water use and hydraulic redistribution in Quercus suber trees: A modeling approach based on root sap flow. For. Ecol. Manag. 2013, 307, 136–146. [Google Scholar] [CrossRef] [Green Version]
  6. Serrano, J.; Shahidian, S.; Da Silva, J.M. Monitoring Seasonal Pasture Quality Degradation in the Mediterranean Montado Ecosystem: Proximal versus Remote Sensing. Water 2018, 10, 1422. [Google Scholar] [CrossRef] [Green Version]
  7. Miao, F.; Guo, Z.; Xue, R.; Wang, X.; Shen, Y. Effects of Grazing and Precipitation on Herbage Biomass, Herbage Nutritive Value, and Yak Performance in an Alpine Meadow on the Qinghai–Tibetan Plateau. PLoS ONE 2015, 10, e0127275. [Google Scholar] [CrossRef] [PubMed]
  8. Efe Serrano, J. Pastures in Alentejo: Technical Basis for Characterization, Grazing and Improvement; Universidade de Évora—ICAM, Ed.; Gráfica Eborense: Évora, Portugal, 2006; pp. 165–178. [Google Scholar]
  9. Biewer, S.; Fricke, T.; Wachendorf, M. Development of Canopy Reflectance Models to Predict Forage Quality of Legume-Grass Mixtures. Crop Sci. 2009, 49, 1917–1926. [Google Scholar] [CrossRef]
  10. Fontaneli, R.S.; Scheffer-Basso, S.M.; Dürr, J.W.; Appelt, J.V.; Bortolini, F.; Haubert, F.A. Predição da composição química de bermudas (Cynodon spp.) pela espectroscopia de reflectância no infravermelho proximal. Rev. Bras. Zootec. 2004, 33, 838–842. [Google Scholar] [CrossRef] [Green Version]
  11. Bell, M.J.; Mereu, L.; Davis, J. The Use of Mobile Near-Infrared Spectroscopy for Real-Time Pasture Management. Front. Sustain. Food Syst. 2018, 2, 1–10. [Google Scholar] [CrossRef] [Green Version]
  12. Serrano, J.; Shahidian, S.; Carapau, Â.; Rato, A. Near-Infrared Spectroscopy (NIRS) and Optical Sensors for Estimating Protein and Fiber in Dryland Mediterranean Pastures. AgriEngineering 2021, 3, 73–91. [Google Scholar] [CrossRef]
  13. Pullanagari, R.; Yule, I.; King, W.; Dalley, D.; Dynes, R. The use of optical sensors to estimate pasture quality. Int. J. Smart Sens. Intell. Syst. 2011, 4, 125–137. [Google Scholar] [CrossRef] [Green Version]
  14. Swart, E.; Brand, T.; Engelbrecht, J. The use of near infrared spectroscopy (NIRS) to predict the chemical composition of feed samples used in ostrich total mixed rations. South Afr. J. Anim. Sci. 2012, 42. [Google Scholar] [CrossRef] [Green Version]
  15. Decruyenaere, V.; Lecomte, P.; Demarquilly, C.; Aufrere, J.; Dardenne, P.; Stilmant, D.; Buldgen, A. Evaluation of green forage intake and digestibility in ruminants using near infrared reflectance spectroscopy (NIRS): Developing a global calibration. Anim. Feed. Sci. Technol. 2009, 148, 138–156. [Google Scholar] [CrossRef]
  16. Pullanagari, R.R.; Yule, I.J.; Tuohy, M.P.; Hedley, M.J.; Dynes, R.A.; King, W.M. Proximal sensing of the seasonal variability of pasture nutritive value using multiespectral radiometry. Grass. Forage Sci. 2013, 68, 110–119. [Google Scholar] [CrossRef]
  17. Evangelista, C.; Basiricò, L.; Bernabucci, U. An Overview on the Use of Near Infrared Spectroscopy (NIRS) on Farms for the Management of Dairy Cows. Agriculture 2021, 11, 296. [Google Scholar] [CrossRef]
  18. Zanine, A.M.; Santos, E.M.; Ferreira, D.J. Principales métodos de evaluación de pasturas—Methods main of evaluation of pastures—Principais métodos de avaliação de pastagens. Rev. Electron. Vet. 2006, 7, 1–13, REDVET ISSN 1695-7504. [Google Scholar]
  19. Serrano, J.M.; Shahidian, S.; Da Silva, J.R.M. Monitoring pasture variability: Optical OptRx® crop sensor versus Grassmaster II capacitance probe. Environ. Monit. Assess. 2016, 188, 117. [Google Scholar] [CrossRef]
  20. Gebremedhin, A.; Badenhorst, P.; Wang, J.; Spangenberg, G.C.; Smith, K.F. Prospects for Measurement of Dry Matter Yield in Forage Breeding Programs Using Sensor Technologies. Agronomy 2019, 9, 65. [Google Scholar] [CrossRef] [Green Version]
  21. Liu, N.; Parra, H.A.; Pustjens, A.; Hettinga, K.; Mongondry, P.; van Ruth, S.M. Evaluation of portable near-infrared spectroscopy for organic milk authentication. Talanta 2018, 184, 128–135. [Google Scholar] [CrossRef]
  22. Bagchi, T.B.; Sharma, S.; Chattopadhyay, K. Development of NIRS models to predict protein and amylose content of brown rice and proximate compositions of rice bran. Food Chem. 2016, 191, 21–27. [Google Scholar] [CrossRef]
  23. Lanza, I.; Conficoni, D.; Balzan, S.; Cullere, M.; Fasolato, L.; Serva, L.; Contiero, B.; Trocino, A.; Marchesini, G.; Xiccato, G.; et al. Assessment of chicken breast shelf life based on bench-top and portable near-infrared spectroscopy tools coupled with chemometrics. Food Qual. Saf. 2021, 5, 1–11. [Google Scholar] [CrossRef]
  24. Murphy, D.J.; Brien, B.O.; Donovan, M.O.; Condon, T.; Murphy, M.D. A near infrared spectroscopy calibration for the prediction of fresh grass quality on Irish pastures. Inf. Process. Agric. 2021. Available online: https://0-doi-org.brum.beds.ac.uk/10.1016/j.inpa.2021.04.012 (accessed on 10 November 2021). [CrossRef]
  25. Givens, D.I.; Deaville, E.R. The current and future role of near infrared reflectance spectroscopy in animal nutrition: A review. Aust. J. Agric. Res. 1999, 50, 1131–1145. [Google Scholar] [CrossRef]
  26. Corson, D.C.; Waghorn, G.C.; Ulyatt, M.J.; Lee, J. NIRS: Forage analysis and livestock feeding. Proc. New Zealand Grassl. Assoc. 1999, 61, 127–132. Available online: http://www.grassland.org.nz/publications/nzgrassland_publication_507.pdf (accessed on 10 November 2021). [CrossRef]
  27. Danieli, P.P.; Carlini, P.; Bernabucci, U.; Ronchi, B. Quality evaluation of regional forage resources by means of near infrared reflectance spectroscopy. Ital. J. Anim. Sci. 2004, 3, 363–376. [Google Scholar] [CrossRef]
  28. Pullanagari, R.R.; Yule, I.J.; Tuohy, M.P.; Hedley, M.J.; Dynes, R.A.; King, W. In-field hyperspectral proximal sensing for estimating quality parameters of mixed pasture. Precis. Agric. 2012, 13, 351–369. [Google Scholar] [CrossRef]
  29. AlOmar, D.; Fuchslocher, R.; Cuevas, J.; Mardones, R.; Cuevas, E. Prediction of the composition of fresh pastures by near infrared reflectance or interactance-reflectance spectroscopy. Chil. J. Agric. Res. 2009, 69, 198–206. [Google Scholar] [CrossRef] [Green Version]
  30. Beć, K.B.; Grabska, J.; Huck, C.W. Principles and Applications of Miniaturized Near-Infrared (NIR) Spectrometers. Chem. Eur. J. 2021, 27, 1514–1532. [Google Scholar] [CrossRef] [PubMed]
  31. Cecchini, C.; Antonucci, F.; Costa, C.; Marti, A.; Menesatti, P. Application of near-infrared handheld spectrometers to predict semolina quality. J. Sci. Food Agric. 2021, 101, 151–157. [Google Scholar] [CrossRef] [PubMed]
  32. Yakubu, H.G.; Kovacs, Z.; Toth, T.; Bazar, G. The recent advances of near-infrared spectroscopy in dairy production—A review. Crit. Rev. Food Sci. Nutr. 2020, 1–22. [Google Scholar] [CrossRef]
  33. Parrini, S.; Acciaioli, A.; Franci, O.; Pugliese, C.; Bozzi, R. Near Infrared Spectroscopy technology for prediction of chemical composition of natural fresh pastures. J. Appl. Anim. Res. 2019, 47, 514–520. [Google Scholar] [CrossRef]
  34. Alomar, D.; Fuchslocher, R.; de Pablo, M. Effect of preparation method on composition and NIR spectra of forage samples. Anim. Feed. Sci. Technol. 2003, 107, 191–200. [Google Scholar] [CrossRef]
  35. Suárez, P.L.; Soldado, A.; González-Arrojo, A.; Vicente, F.; de la Roza-Delgado, B. Rapid on-site monitoring of fatty acid profile in raw milk using a handheld near infrared sensor. J. Food Compos. Anal. 2018, 70, 1–8. [Google Scholar] [CrossRef]
  36. Kademi, H.I.; Ulusoy, B.H.; Hecer, C. Applications of miniaturized and portable near infrared spectroscopy (NIRS) for inspection and control of meat and meat products. Food Rev. Int. 2019, 35, 201–220. [Google Scholar] [CrossRef]
  37. Serrano, J.; Shahidian, S.; Da Silva, J.M.; Paixão, L.; Carreira, E.; Carmona-Cabezas, R.; Nogales-Bueno, J.; Rato, A.E. Evaluation of Near Infrared Spectroscopy (NIRS) and Remote Sensing (RS) for Estimating Pasture Quality in Mediterranean Montado Ecosystem. Appl. Sci. 2020, 10, 4463. [Google Scholar] [CrossRef]
  38. Serrano, J.; Shahidian, S.; da Silva, J.M.; Paixão, L.; de Carvalho, M.; Moral, F.; Nogales-Bueno, J.; Teixeira, R.; Jongen, M.; Domingos, T.; et al. Evaluation of Near Infrared Spectroscopy (NIRS) for Estimating soil organic matter and phosphorus in Mediterranean Montado Ecosystem. Sustainability 2021, 13, 2734. [Google Scholar] [CrossRef]
  39. AOAC. Official Method of Analysis of AOAC International, 18th ed.; AOAC International: Arlington, AT, USA, 2005. [Google Scholar]
  40. Goedhart, P.W. Comparison of multivariate calibration methods for prediction of feeding value by near infrared reflectance spectroscopy. Neth. J. Agric. Sci. 1990, 38, 449–460. [Google Scholar] [CrossRef]
  41. Davies, A.; Fearn, T. Back to basics: Calibration statistics. Spectrosc. Eur. 2006, 18, 31–32. Available online: http://www.eurolabdanmark.dk/documents/Netvaerk/Kemi/SpecEurope_BackToBasics_CalibrationStats_TD.pdf (accessed on 10 November 2021).
  42. Almeida, F.M.N. Espectroscopia de Infravermelho Próximo com Transformada de Fourier (FT-NIR) na Caracterização de Farinhas para Alimentação Pueril. Dissertação para obtenção do grau mestre em Engenharia Biológica, Instituto Superior Téc-nico—Universidade Técnica de Lisboa, Lisboa, Portugal, 2009. [Google Scholar]
  43. Safari, H.; Fricke, T.; Wachendorf, M. Determination of fibre and protein content in heterogeneous pastures using field spectroscopy and ultrasonic sward height measurements. Comput. Electron. Agric. 2016, 123, 256–263. [Google Scholar] [CrossRef]
  44. Pullanagari, R.R.; Kereszturi, G.; Yule, I. Integrating Airborne Hyperspectral, Topographic, and Soil Data for Estimating Pasture Quality Using Recursive Feature Elimination with Random Forest Regression. Remote Sens. 2018, 10, 1117. [Google Scholar] [CrossRef] [Green Version]
  45. Lobos, I.; Inia, I.D.I.A.; Moscoso, C.J.; Pavez, P. Calibration models for the nutritional quality of fresh pastures by nearinfrared reflectance spectroscopy. Cienc. Investig. Agrar. 2019, 46, 234–242. [Google Scholar] [CrossRef]
  46. Hermansen, C.; Norgaard, T.; de Jonge, L.W.; Moldrup, P.; Müller, K.; Knadel, M. Predicting glyphosate sorption across New Zealand pastoral soils using basic soil properties or Vis–NIR spectroscopy. Geoderma 2020, 360, 114009. [Google Scholar] [CrossRef]
  47. Versari, A.; Laurie, F.; Ricci, A.; Laghi, L.; Parpinello, G.P. Progress in authentication, typification and traceability of grapes and wines by chemometric approaches. Food Res. Int. 2014, 60, 2–18. [Google Scholar] [CrossRef]
  48. Mendarte, S.; Ibarra, A.; Garbisu, C.; Besga, G. Use of portable NIRS equipment in field conditions to determine the nutritional value of mountain pastures. In Proceedings of the 23th General Meeting of the European Grassland Federation, Kiel, Germany, 29 August–2 September 2010; Schnyder, H., Isselstein, J., Taube, F., Auerswald, K., Schellberg, J., Wachendorf, M., Herrmann, A., Gierus, M., Wrage, N., Hopkins, A., Eds.; pp. 244–246. [Google Scholar]
  49. Reeves, J.B., III. Use of near infrared reflectance spectroscopy. In Farm Animal Metabolism and Nutrition; D’Mello, J.P.F., Ed.; CABI Publishing: Wallingford, UK, 2000; pp. 185–207. [Google Scholar]
  50. Curran, P.J. Remote sensing of foliar chemistry. Remote Sens. Environ. 1989, 30, 271–278. [Google Scholar] [CrossRef]
  51. Malegori, C.; Marques, E.J.N.; de Freitas, S.T.; Pimentel, M.F.; Pasquini, C.; Casiraghi, E. Comparing the analytical performances of Micro-NIR and FT-NIR spectrometers in the evaluation of acerola fruit quality, using PLS and SVM regression algorithms. Talanta 2017, 165, 112–116. [Google Scholar] [CrossRef] [PubMed]
  52. Ghajar, S.; Tracy, B. Proximal Sensing in Grasslands and Pastures. Agriculture 2021, 11, 740. [Google Scholar] [CrossRef]
Figure 1. Map of Portugal with the location of each farm.
Applsci 11 10638 g001
Figure 2. Portable near-infrared (NIR) sensor measurement (a) and pasture sample cut (b).
Applsci 11 10638 g002
Figure 3. Thermopluviometric graphic for the districts of Beja, Évora and Portalegre between July 2020 and June 2021 (source: Portuguese Institute of Sea and Atmosphere). (a) Monthly mean temperatures (b) monthly rainfall.
Applsci 11 10638 g003
Figure 4. Example of pasture spectra measured with the micro-NIR sensor to predict pasture neutral detergent fibre (NDF) and crude protein (CP).
Applsci 11 10638 g004
Figure 5. Plot of the calibration and internal validation phases between reference and predict values of fibre (NDF, a) and crude protein (CP, b).
Applsci 11 10638 g005
Table 1. Date collection, field code, mean, standard deviation (SD) and range of the pasture NDF and CP reference values.
DateField CodeNFDN %CP %
Mean ± SDRangeMean ± SDRange
30/03/2021Mitra A1240.7 ± 2.038.8–45.516.9 ± 2.614.2–20.9
30/03/2021Mitra B1241.0 ± 2.737.6–46.811.6 ± 1.611.0–15.1
01/04/2021Mitra C2443.2 ± 4.833.0–51.511.9 ± 2.18.2–17.2
08/04/2021Azinhal856.5 ± 1.453.7–57.18.5 ± 0.38.2–8.9
08/04/2021Grous846.8 ± 2.942.4–49.811.4 ± 0.810.6–12.9
09/04/2021Murteiras849.4 ± 2.746.4–54.513.3 ± 1.610.4–15.0
09/04/2021Padres852.8 ± 2.946.9–54.513.7 ± 1.212.4–14.9
13/04/2021Tapada dos Números856.9 ± 2.052.7–58.612.1 ± 2.211.2–16.3
NDF—neutral detergent fibre; CP—crude protein; N—number of samples.
Table 2. Statistical indicators of the internal calibration and validation models for the NDF and the CP through the use of the micro NIR sensor in the pasture and partial least squares regression (PLSR).
Pre_ProcessingCalibration ModelInternal Validation Model
NDFLVR2RMSELVR2RMSEBiasRPD
raw spectra50.7303.30250.6903.6280.0561.75
SNV50.6393.99650.4734.962−0.2791.35
1st derivative50.7453.14250.6493.834−0.0241.64
SNV + 1st derivative60.6933.37160.4964.260.0981.44
CP
raw spectra50.5102.07350.3602.3680.0001.26
SNV40.4052.45040.2992.6900.0081.36
1st derivative30.3092.37830.2002.5840.0011.36
SNV + 1st derivative20.3252.50620.2632.7220.0791.13
LV—latent variables; R2—coefficient of determination; RMSE—root–mean–square error; Bias—average difference between predicted and actual values; RPD—residual predictive deviation.
Publisher’s Note: MDPI stays neutral with regard to jurisdictional claims in published maps and institutional affiliations.

