Article

A Speech Preprocessing Method Based on Perceptually Optimized Envelope Processing to Increase Intelligibility in Reverberant Environments

Acoustics Group, Cluster of Excellence—Hearing4all, Carl von Ossietzky University of Oldenburg, 26129 Oldenburg, Germany
*
Author to whom correspondence should be addressed.
Submission received: 30 September 2021 / Revised: 1 November 2021 / Accepted: 12 November 2021 / Published: 15 November 2021
(This article belongs to the Section Acoustics and Vibrations)

Abstract

:
Speech intelligibility in public places can be degraded by the environmental noise and reverberation. In this study, a new near-end listening enhancement (NELE) approach is proposed in which using a time varying filter jointly enhances the onsets and reduces the overlap masking. For optimization, some look-ahead in clean speech and prior knowledge of room impulse response (RIR) are required. In this method, by optimizing a defined cost function, the Spectro-Temporal Envelope of reverb speech is optimized to be as close as possible to that of clean speech. In this cost function, onsets of speech are optimized with increased weight. This approach is different from overlap-masking ratio (OMR) and speech enhancement (OE) approaches (Grosse, van de Par, 2017, J. Audio Eng. Soc., Vol. 65 (1/2), pp. 31–41) that only consider previous frames in each time slot for determining the time variant filtering. The SRT measurements show that the new optimization framework enhances the speech intelligibility up to 2 dB more that OE.

1. Introduction

In conventional speech enhancement methods, the speech signal is recovered from a mixture of reverberation and noise. This type of processing can be used at the receiver side, for example in hearing aids. For degradation of speech intelligibility in public places such as airports and train stations due to reverberation and noise, because of using one or multiple independent loudspeakers and lack of further processing in the listener side, speech modification is only possible at the source side and only on the clean speech before playback. In the literature, this type of clean speech modification is called near-end listening enhancement (NELE) [1] and is typically evaluated under an equal-level constraint. The modified signal must be more intelligible in the presence of reverberation and noise and also must be robust to different listener positions in a wide area.
NELE algorithms can be divided into three categories: rule-based, noise-dependent, and reverberation-dependent. In the rule-based approaches, knowledge about psychoacoustics and speech perception is used to produce more intelligible speech preferably with low audible processing artifacts. However, this method does not optimize a specific criteria and for this reason, the modification would only be sub-optimal in terms of speech intelligibility [2]. Generally, in NELE algorithms, the preprocessing of clean speech is performed on a time-frequency signal representation. A very well-known rule-based approach is the Spectral-Shaping Dynamic Range Compression (SSDRC) method [2,3] for which the acoustic cues that are perceptually important are enhanced. In the time domain, a non-linear Dynamic Range Compression (DRC) amplifies lower-energy parts of speech, like consonants, which are known to be more susceptible to reverberation and noise [4]. In addition, in the frequency domain, by spectral-tilt flattening and formant shifting, the intelligibility is improved. Based on SSDRC, another successful method named Automatic Sound Engineer (ASE) is proposed in which using equalization and broadband compression maximizes speech intelligibility while keeping a good sound quality [5].
In the second type of NELE methods, only the presence of noise is taken into account in the development of an enhancement algorithm. Speech modifications in these methods are usually based on an objective speech intelligibility measure, e.g., the speech intelligibility index (SII) [5] or the glimpse proportion (GP) [6] which is used as an optimization target. Similar to the SSDRC, most of the successful noise-dependent algorithms use DRC in the time domain to enhance the consonants intelligibility. In adaptDRC [6,7], spectral modification and dynamic time compressing are performed to improve the SII in the presence of additive noise. In this method, although the impact of reverberation is not explicitly considered in the enhancement procedure, nevertheless considerable enhancement is reported in the intelligibility in the presence of reverberation [8]. Another noise-dependent NELE approach is based on improving the STOI score [9]. In some of the noise-dependent methods, deep neural networks (DNNs) are used to modify speech energy. In a method called iMetricGAN [10], the enhancement is performed by repeated predictions of the intelligibility score of modified speech and producing scale factors that multiplied on the unmodified spectrogram. The intelligibility-improving signal processing approach (IISPA) [11] is another DNN-based method that uses an automatic-speech recognition-based model of speech perception to optimize different parameters such as band-pass edge frequencies, spectral slope and curvature, and spectral modulation compression or expansion. Note that in these noise-dependent methods, the quality of speech can degrade strongly, specifically in the presence of non-stationary noise. In the third category of NELE methods named reverberation-dependent, room impulse response (RIR) data are explicitly considered in the modification procedure ([12,13,14,15]). Grosse and van de Par (2017) [16] proposed two methods namely, OE (Onset Enhancement) and Overlap Masking Ratio (OMR)—which were inspired by previous studies in [17,18]. In these two approaches, having access to a RIR, time varying gains are calculated for each frame, based on the energy of current frame and that of the previous frames of speech.
In the current study, a reverberation-dependent approach is developed to optimize the Spectro-Temporal Envelope of a reverberated speech by onset enhancement and also by reducing the amount of overlap-masking. In contrast to the OMR and OE methods proposed in [16], in this approach future frames are also considered in determination of the weight of current frame. Considering the extension of the current frame and its overlapping with the upcoming frames, now an explicit cost function is defined and optimized in a way that the Spectro-Temporal Envelope of the reverberated speech is as close as possible to that of the clean speech signal.
The paper is organized as follows. Section 2 provides the structure of the proposed NELE algorithm. In this section, the cost function definition and the optimization procedure are described. Section 3 presents the results of simulations and measurements. Finally, Section 4 concludes the article with the discussion.

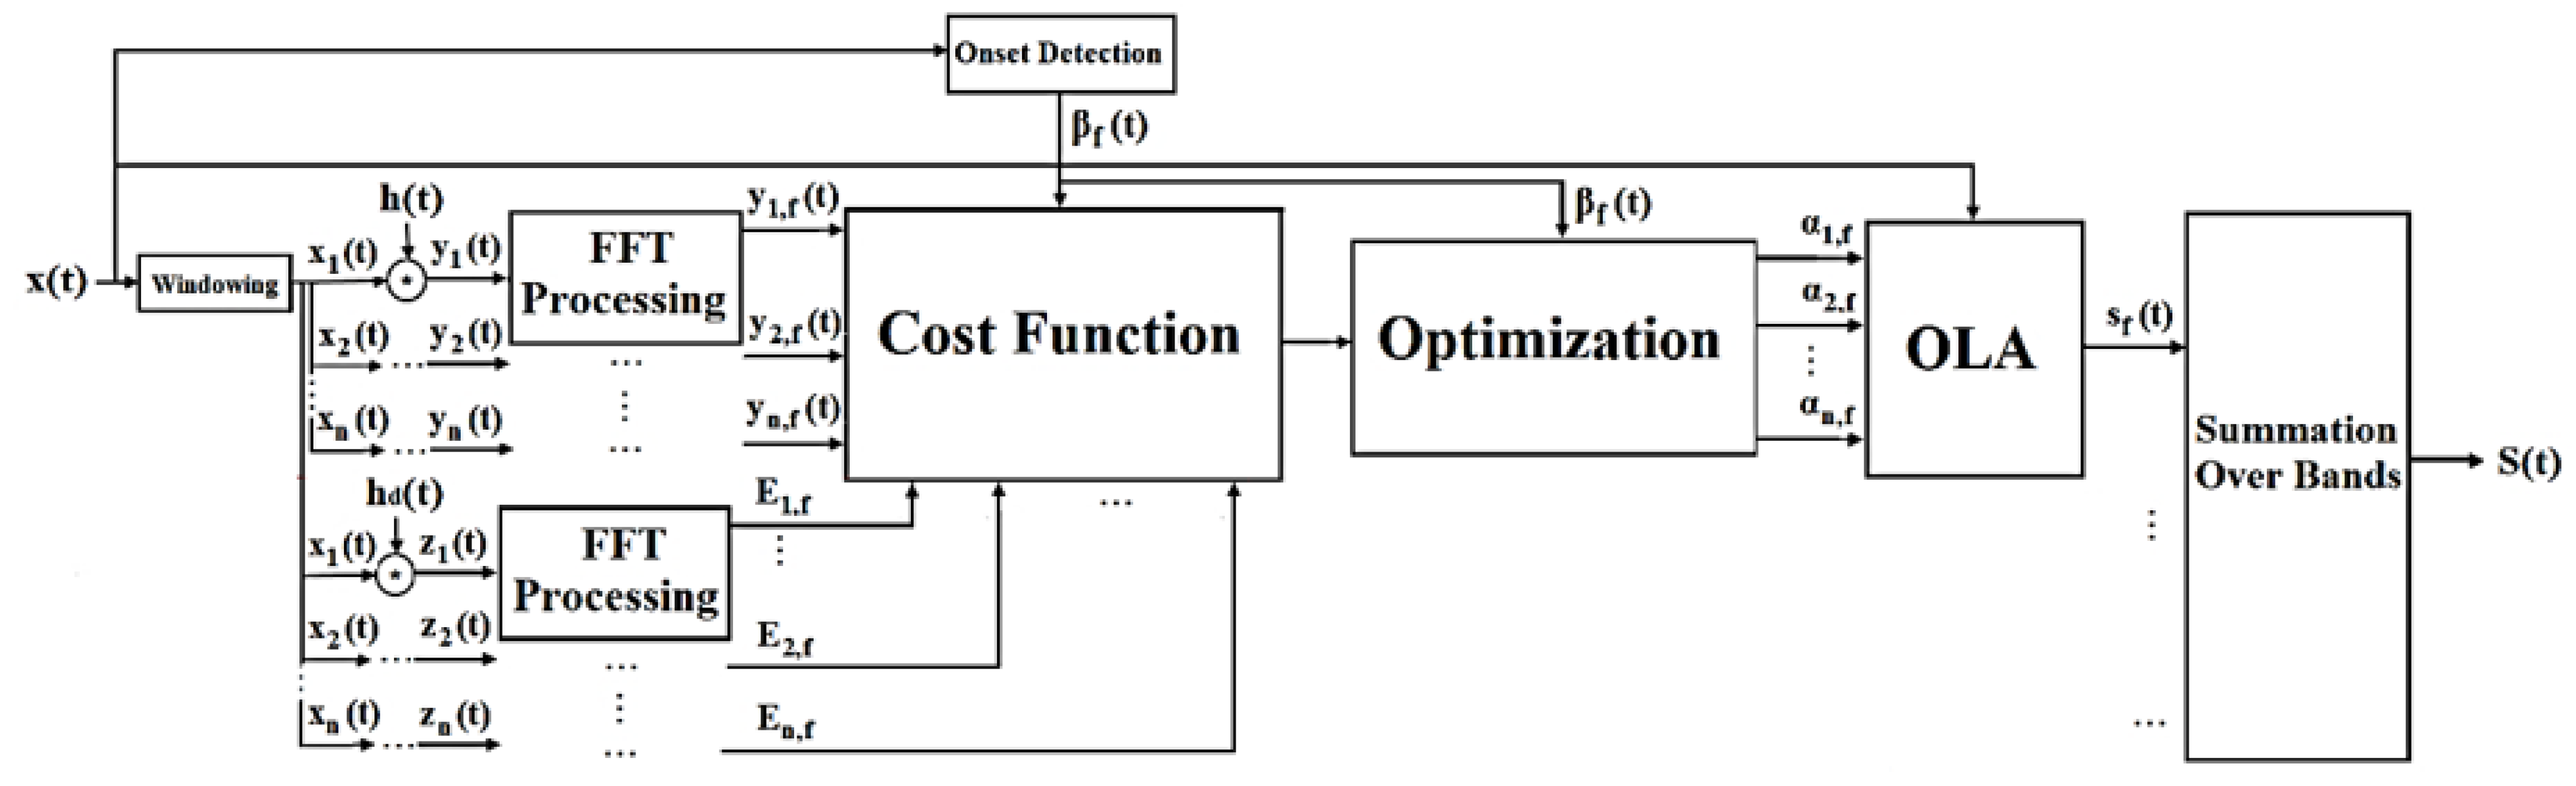
2. Proposed NELE Method

The main objective of the proposed algorithm is to apply a time-varying filtering on a clean speech signal in such a way that after reproduction in a reverberant environment, the temporal envelope in each frequency band is as similar to that of the clean speech signal as possible. For this purpose, a cost function is defined that is optimized. In the cost function, onsets are weighted stronger to ensure accurate reproduction. The time-variant filtering is updated on a frame-by-frame basis. For this reason, the signal analysis, the modelling of the effect of reverberation, and the cost function optimization is done on a frame-by-frame basis. The block diagram of the proposed approach is depicted in Figure 1. It consists of signal windowing and convolving with RIR, preprocessing using the FFT, onset detection, cost function definition, optimization unit, and finally the signal modification unit that is including Overlap–Add (OLA) and summation over frequency bands. After windowing and convolution with RIR, the speech signal is separated into one-third octave bands in the FFT processing unit. To enhance the signal, a frame-based time-varying filter is designed to improve an intelligibility criterion. For a one-third octave band, a cost function is defined and then is optimized to obtain the weights of filter. These time-varying weights are used to synthesize a new speech signal. The parts of this block diagram are explained in detail as follows.

2.1. Preprocessing

As a first step, the time-domain signal is transformed to the frequency domain on a frame-by-frame basis. The main goal of this preprocessing unit is the separation of speech signal into one-third octave bands. This frame wise frequency analysis is needed for optimization and also for onset detection. First, the clean speech x ( t ) is framed using τ = 30   ms Hann windows with 50% overlapping to construct N overlapping frames x n ( t ) :
x ( t ) = n = 1 N w ( t n τ 2 ) x ( t ) = n = 1 N x n ( t ) ,
in which N is determined according to the length of signal. Then, each frame is convolved with the RIR:
x ( t ) h ( t ) = n = 1 N x n ( t ) h ( t ) = n = 1 N y n ( t ) .
Here, y n ( t ) is called “extended frame” number n. An extended frame can mask the upcoming frames dependent on the reverberation time T 60 . Each extended frame is analyzed using a Fast Fourier Transform (FFT) and subsequently the frequency bins are separated according to the one-third octave bands and finally are synthesized using the inverse FFT (IFFT):
y n ( t ) FFT Y n ( F ) one - third   octave   band   bin   separation Y n , f ( F ) IFFT y n , f ( t ) ,
where y n , f ( t ) is the synthesized signal in one-third octave band number f . The y n , f ( t ) can be considered as the convolution of a short frame x n , f ( t ) with the RIR that is filtered by the one-third octave band number f . The x n , f ( t ) is named a “short frame”. The y n , f ( t ) can also be described by smaller frames called “sub-frames”, such that the length of each sub-frame is equal and temporally aligned to that of a short frame. The length of an extended frame is M times the length of a short frame:
y n , f ( t ) = m = 1 M y n , m , f ( t ) , M = l w + l h l w ,
where l w and l h are the length of a short frame and the RIR respectively. A sub-frame y n , m , f ( t ) is defined as the frame number m of an extended frame y n , f ( t ) :
y n , m , f ( t ) = { y n , f ( t ) , ( m 1 )   τ t m τ 0 , otherwise .
The extended frame that is transformed into its corresponding sub-frames allows one to calculate the total signal power that can be observed within the reverberant environment within a particular time frame and frequency band. Since in this approach, a time variant filtering is applied on a frame-by-frame basis to the input signal x, the effect of the filtering can be evaluated in weighted summations of y n , m , f ( t ) that are affected by all extended frames in a short frame interval. This resulting summation will be considered in a cost function. The weight of short frame x n , f ( t ) and subsequently an extended frame y n , f ( t ) within a one-third octave band is denoted by α n , f . The short frames and their respected weights, an extended frame, and a sub-frame are schematically illustrated in Figure 2.

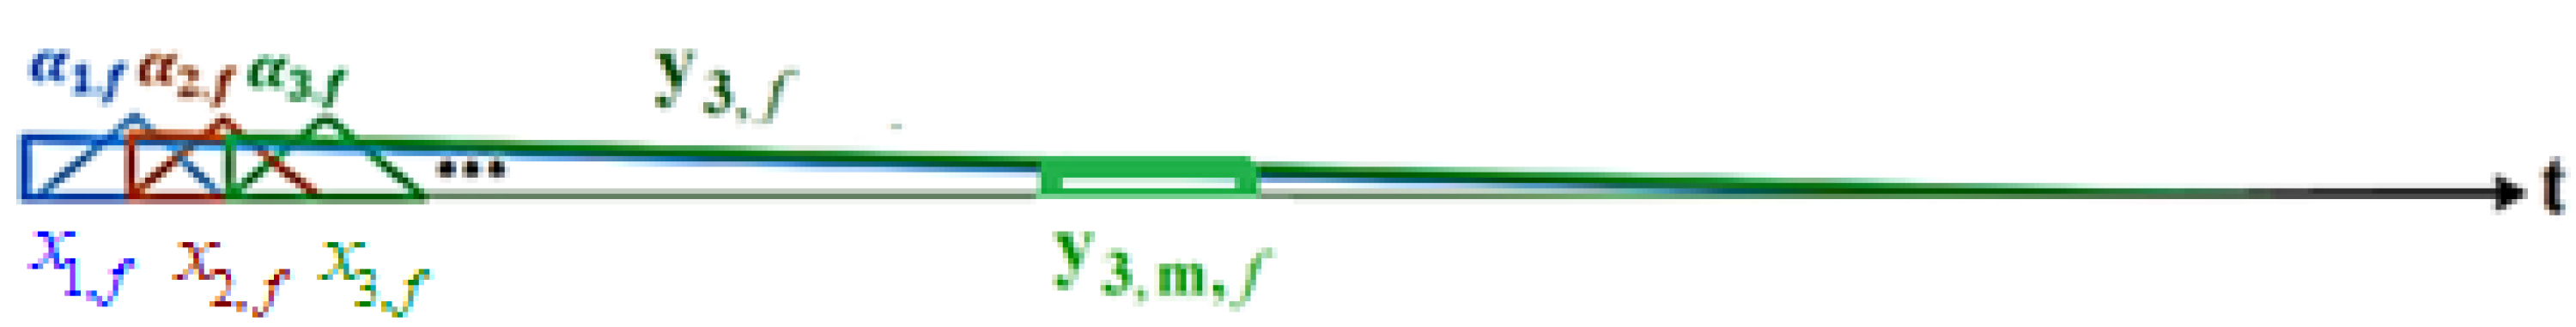
2.2. Construction of a Cost Function for a Frame

According to Figure 2 and Equation (4), the sub-frame number one of y k , f ( t ) denoted by y k , 1 , f has overlaps with the previous M extended frames. All of these M extended frames have sub-frames that are overlapping with y k , 1 , f . A “summed-reverbed-short frame” number k that includes all of sub-frames within the short window number k can be constructed using the summation of current short frame y k , 1 , f ( t ) and the sub-frames of previous extended frames overlapping in frame k:
s k , f ( t ) = m = 0 M 1 y k m , m + 1 , f ( t ) .
For the speech enhancement, a time-varying weight α n , f according to Figure 2 is multiplied to each short frame and subsequently its convolution with the RIR that constructs the extended frame y n , f . This weight will be consequently multiplied to all y n , m , f ( t ) that construct y n , f ( t ) . By multiplication to these weights, a summed-reverbed-short frame number k is changed to a “weighted-summed-reverbed-short frame”:
w s k , f ( t ) = m = 0 M 1 α k m , f   y k m , m + 1 , f ( t ) .
In Equation (7), the weights are used to reduce the amount of the overlap-masking in a reverb condition. According to the STOI [19], the temporal envelope of this weighted signal is considered for defining a cost function. A time-frequency unit norm (TF-unit) of a weighted-summed-reverbed-short frame in Equation (7) is calculated by non-coherent summation of the power spectral density values of its discrete Fourier transform (DFT) within a one-third octave band:
W S k , f = m = 0 M 1 α k m , f . a l l   b i n s | D F T { y k m , m + 1 , f ( t ) } | 2 .
The target signal is obtained by processing of the clean speech similar to calculation that is done for the extended frames in Equation (8). However, now only the direct part of RIR ( h d ( t ) ) is used for the computation of the target signal:
z n ( t ) = x n ( t ) h d ( t ) .
The TF-unit of this signal in a one-third octave band for frame k is calculated similar to W S k , f :
E k , f = a l l   b i n s | D F T { z k , f ( t ) } | 2 .
The cost function for frame k is now defined as the squared error between the TF-unit of target ( E k , f ) and the TF-unit of weighted frames ( W S k , f ) :
C F k ( f ) = ( W S k , f E k , f ) 2
This definition of cost function is comparable with the criteria used in the STOI that uses the correlation between temporal envelopes of the clean and degraded speech as an intelligibility score. The temporal envelope in STOI is a vector of TF-units covering a 384 ms time interval. Because increasing the correlation is equivalent to minimizing the squared error, minimizing C F k ( f ) for consecutive frames increases the correlation and subsequently the STOI score. In addition, by defining the cost function in the form of Equation (11), the optimization is easier to handle.
An additional factor that is being considered in the cost function is the importance of a frame denoted by β k . The importance of a frame is determined by an onset detector. If a frame is detected to be an onset, a higher β k is multiplied by C F k ( f ) . The role of this additional weight is clarified in the following section in which the optimization procedure is explained.

2.3. Optimization Unit

The summed-cost-function (SCF) for frame number k ( S C F k ( f ) ) is defined by weighted summation of cost functions of that frame ( C F k ( f ) ) and upcoming frames ( C F i ( f ) ) :
S C F k ( f ) = i = k P + k 1 β i . C F i ( f ) ,
Each one-third octave band denoted by f is optimized independently. To optimize a SCF, the number of frames influenced by the gain of a frame instead of M is denoted by P in Equation (12). According to Equation (4) and considering the T 60 , M short frames are overlapped by an extended frame. However, to reduce the computational load, lower number of frames may be considered, because it is reasonable to neglect the effect of the reverberation after P M frames that are naturally shorter than T 60 . Therefore, this implementation does not require having a full-length signal available when optimizing a given frame and only a limited look ahead into the future is needed. This P value is imperially set using the energy decay curve (EDC) of RIR when its value is dropping by 25 dB.
For the onset detection, an energy-based method described in [20,21] is used. Here, a parameter, namely the high frequency content (HFC), is constructed from a weighted sum of spectral powers for each frame. A detection function (DF), which is the ratio of the HFC over two consecutive frames, is calculated. After obtaining the DF for the full signal, its values are normalized to its maximum across frames. These normalized values 0 β i 1 that are the outputs of the onset detection unit are used for weighting the cost function in Equation (12). If the frame number k is detected to be an onset, a higher β i is assigned to its cost function.
To prevent high fluctuations of weights in the optimization, lower and upper bounds for a weight α i , k are set. The lower bound that is the minimum gain is set to −40 dB. The output of the onset detection unit is also used here in the optimization routine. A frame is recognized as an onset if its β i is above a threshold. This threshold is computed adaptively according to the average value of all β i across all frames. If a frame is detected to be an onset, the maximum possible gain (upper bound) is set to 20 dB, otherwise maximally 0 dB is allowed. In the optimization procedure, only positive weights are accepted because the parameter that is going to be controlled is the leaked energy of each frame on the upcoming frames. Since the optimization is targeting energy, the application of negative weights would be meaningless. The constrained optimization problem is summarized as follows:
   min   S C F k ( f ) { α i , f , k P i k + P 1 } 0 lower   bound α i , k upper   bound lower   bound = 40   dB upper   bound = { 20   dB , frame   i   is   an   onset 0   dB , otherwise
To find the minimum of constrained non-linear multivariable function of Equation (13), a state-of-the-art method called the Sequential Quadratic Programming (SQP) [22,23] is used. In this numerical optimization method, the Hessian of the Lagrangian function using a quasi-Newton updating method is estimated. The algorithm starts independently for each frequency band by calculating the coefficient of first frame α 1 , f . The effect of the first frame is considered up to P frames after. Therefore, S C F 1 ( f ) is a function of α 1 , f , α 2 , f , α p , f . All of these P weights are determined in the first optimization routine. However, only α 1 , f is accepted as the final value, because other weights, except α 1 , f , have an effect on the upcoming SCFs. In the next optimization α 2 , f is determined and being fixed and so on. Although in every optimization cycle many weights related to the current and future frames are computed, only a weight obtained for the current frame will be fixed and other weights will be updated on the next optimization cycle. After determination of a weight in each optimization, its value in all CFs is replaced. The routine for the determination of weights and updating the CFs is explained in Algorithm 1.
Algorithm 1. Example text of a theorem. Determination of weights α 1 , f , α 2 , f , ..., α k , f , …, α N , f in a one-third octave (f).
Step 1: k = 1
Step 2: The weight of frame number k is determined. All the upcoming CFs that are influ-enced by α k , f construct the S C K k ( f ) according to Equation (12). For construction of S C K k ( f ) , previous determined weights in CFs are used and the new weight α k , f is determined:
   S C F k ( f ) = f u n   ( α 1 , f _ , α 2 , f _ , ... , α k 1 , f _ , α k , f , α k + 1 , f , ... , α P + k 1 , f ) f u n   ( α k P + 1 , f _ , ... , α k 1 , f _ , α k , f , α k + 1 , f , ... , α P + k 1 , f ) optimization α k , f _ , ... , , α k + 1 , f , ... , α P + k 1 , f
For example, the S C K 1 ( f ) is a function of α 1 , f , α 2 , f , ..., α P , f . All of these weights are determined in the first optimization. However, only α 1 , f is accepted as the final value:
   S C F 1 = f u n ( α 1 , f , α 2 , f , ... , α P , f ) optimization α 1 , f _ , α 2 , f , ... , α P , f
Step 3: All CFs that are influenced by α k , f are replaced by their numerical value.
   C F k ( f ) = f u n   ( α k + p 1 , f , ... , α k 1 , f , α k , f _ ) C F k + 1 ( f ) = f u n   ( α k + p , f , ... , α k , f _ , α k + 1 , f ) C F k + p 1 ( f ) = f u n   ( α k , f _ , α k + 1 , f , ... , , α k + P 1 , f )
  For example, for α 1 , f :
   C F 1 ( f ) = f u n   ( α 1 , f _ ) C F 2 ( f ) = f u n   ( α 1 , f _ . α 2 , f ) C F p ( f ) = f u n   ( α 1 , f _ , α 2 , f , ... , α P , f )
Step 4: k = k + 1
  If k < N : go to Step 2
else finish
In the Onset Enhancement (OE) method [16], a time-varying weight of a frame is determined according to the power spectrums of that frame and that of the previous frames, which are of influence because of the reverberation tail that has overlap with the current frame. In the proposed approach, in order to determine the weight of current frame, a cost function is optimized based on the power spectrum of current frame and that of the future frames. Considering the future frames in the cost function optimization implies that the effect of the filtering of the current frame on future frames will also be considered; this is not the case in the OE method. Note that the weights of the previous frames were fixed before, but their effect is still considered in Equation (12).

3. Simulations and Measurements

3.1. Stimuli

The Oldenburg Sentence Test (OLSA) [24] corpus with the male speaker is used as the speech material to evaluate the proposed algorithm. The OLSA corpus consists of 120 German sentences for each speaker. A sentence includes name, verb, number, adjective, and noun and there are 10 alternatives for each word. The corpus is downsampled to 16 kHz. Speech shaped noise (SSN) and pink noise (PN) are used as the interferers which are convolved with binaural room impulse response (BRIR) and presented at an average level of 65 dB-SPL for left and right ears. The SSN was generated by a summation of all 120 OLSA sentences followed by phase randomization, creating noise with a similar long-term spectrum as the speech corpus. In addition to SNN, also pink noise is used which has an energy distribution similar to environmental noise. It covers the frequency range between 100 Hz to 8 kHz, approximately corresponding to the spectral range of the speech material.

3.2. Binaural Room Impulse Responses

In this section the BRIRs used in this paper are described. For the optimization and subjective evaluation, four rooms were used and from each of these rooms, three recorded BRIRs with the same receiver position are selected. These rooms are described in Table 1 and differ in terms of geometrical dimensions and reverberation time T 60 . The main BRIR in Table 1 is convolved with a speech source and the resulting left ear signal is used for the optimization to find the weights but is also used for rendering and evaluating the preprocessed speech signal. The second BRIR in this table is used to evaluate the robustness of the algorithm for a different position of the listener compared to the weights obtained for the main BRIR. Thus, the algorithm uses a different IR for the preprocessing than the IR that was originally obtained in the optimization. Finally, the third BRIR is used for convolving with a noise signal to create a binaural noise for both main and robustness evaluation scenarios. The first room (R1) with a relatively short T 60 of 0.6 s is selected from a set of BRIR measurements made at our university in Oldenburg. The second room (R2) is a music hall that is selected from the BRAS database [25] with a T 60 equal to 1.1 s. The recorded BRIRs in R2 have a relatively long distance between the source and receiver and therefore the direct-to-diffuse ratio is low. The third room (R3) selected again from the BRAS database is a seminar room with a T 60 equal to 1.5 s. This room is critical in terms of T 60 and speech intelligibility because it has a long reverberant tail that creates a considerable amount of time smearing the source speech signal. Room (4) represents a church selected from Air database [24].
The T 60 is very long (about 5 s) because of the large dimensions of the room and low degree of damping. Because of relatively small source-receiver distances (3 m), however, the selected BRIRs in the church have a high direct-to-reverb diffuse ratio. The distance from speech and noise sources to the listener positions of the main and robustness evaluation scenarios is almost held constant within a room to avoid differences in the direct-to-diffuse ratio. A collection of all used room-acoustical scenarios, reverberation times, selected BRIRs, and the length of P frames are shown in Table 1. P is a number of future frames that is used to construct the summed-cost-function (SCF) in Equation (12) for the optimization purpose. As previously explained, the length of P frames is determined according to 25 dB drop of EDC. For a larger T 60 , more future frames are needed for the optimization.

3.3. Signal Processing Details

The corpus and noises are downsampled to 16 kHz. The length of the analysis and synthesis frame is 30 ms with 50% overlap. A square-root Hann window is used in the signal framing in both the analysis and synthesis to avoid audible artifacts because of the cyclic convolution. To synthesis the signal, the overlap-add (OLA) method is used. The frequency resolution used in separation of an extended frame in Equation (3) to the one-third octave bands is limited by the length of P frames according to Table 1. According to length of P frames and the sampling rate of 16 kHz, it could be at least 4096 for the shortest room impulse response ( T 60 = 0.6 s) and 16,384 for the longest room impulse response ( T 60 = 5 s). The bins are grouped into 17 one-third octave band. Similar to the STOI [19], the lowest center frequency is set to 150 Hz and the highest one-third octave band has a center-frequency approximately equal to 6 kHz. A frequency resolution used in Equation (8) for analysis of weighted sub-frames in Equation (5) is determined by the window length and sampling rate equal to 512 bins. The RMS values of the processed signal are adjusted to that of the unprocessed signal to keep levels equal between the output of the NELE algorithms and the unprocessed signal.

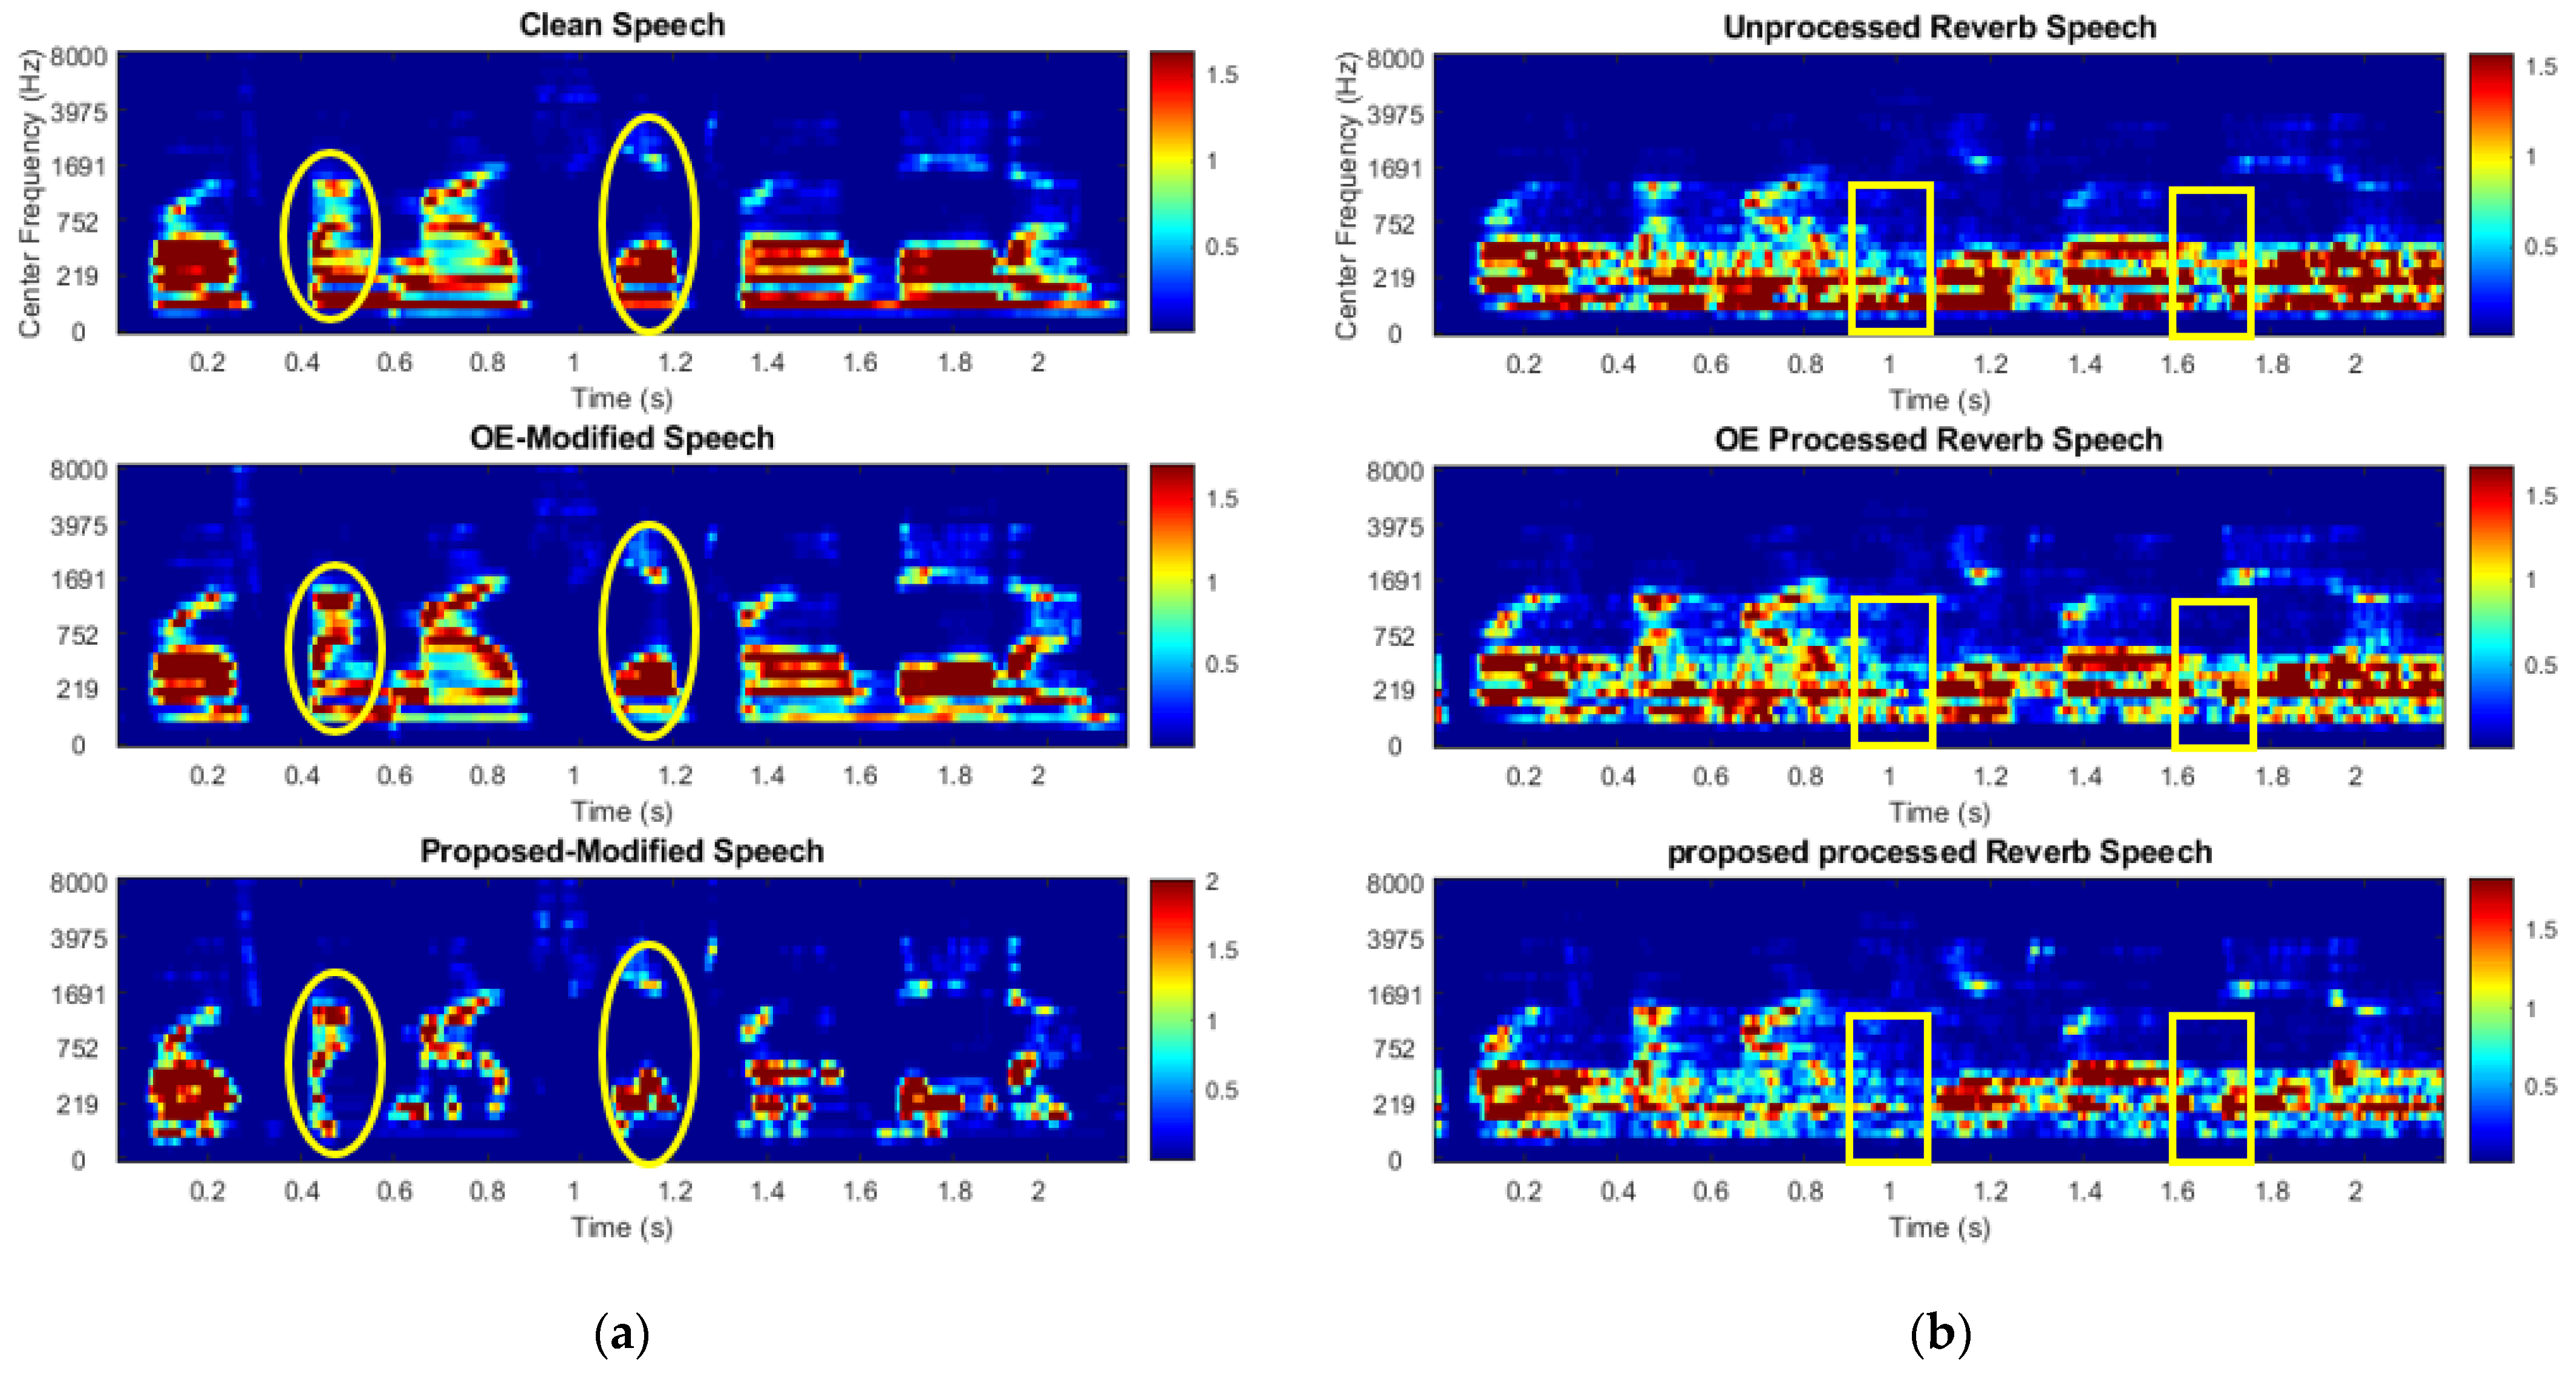
3.4. Effect of the Algorithm on Signal

The cochleagram of a clean speech from the OLSA corpus (first raw) and two preprocessed speech signals, one of them preprocessed with the OE algorithm [16] (second raw) and another one preprocessed by the proposed algorithm (third raw), are depicted in Figure 3a.The weights are calculated for room R4. It can be seen that the preprocessing of OE and the proposed algorithm causes a high-pass filter effect on the speech, which is caused by the fact that both enhancement algorithms reduced the amplitude of speech portions with a high and constant energy over time or those which were exposed to a longer T 60 (yellow ovals in the left panels). It can be seen that this attenuation is stronger for the proposed method in comparison to the OE. Because of the importance of onsets for intelligibility, and in accordance with Equation (12), onsets are more strongly weighted in the proposed method. The other steady portions, on the other hand, are allowed to be attenuated more in order to minimize the defined cost function.
The signals of Figure 3a are now convolved with the left ear of BRIR in room R4 and their cochleagrams are plotted in. The cochleagram of reverbed unprocessed, reverbed preprocessed by OE, and reverbed preprocessed by the proposed algorithm are shown in the first, second, and third panels of Figure 3b, respectively. Besides the onset enhancement and high-pass filtering effect of the proposed approach, the effect of the frame attenuations can be compared with the two other reverbed signals. The effect can be seen in the longer silent gap of the clean speech around second 1 (yellow rectangles in the left panels). It can be seen that in the third panel belonging to the proposed method, there is a low amount of energy leakage from previous frames into the silent gap in comparison to the unprocessed and OE-preprocessed reverbed signals. A similar effect can be seen in second 1.6. This effect can potentially contribute to higher speech intelligibility due to the reduced overlap masking of preceding speech segments.

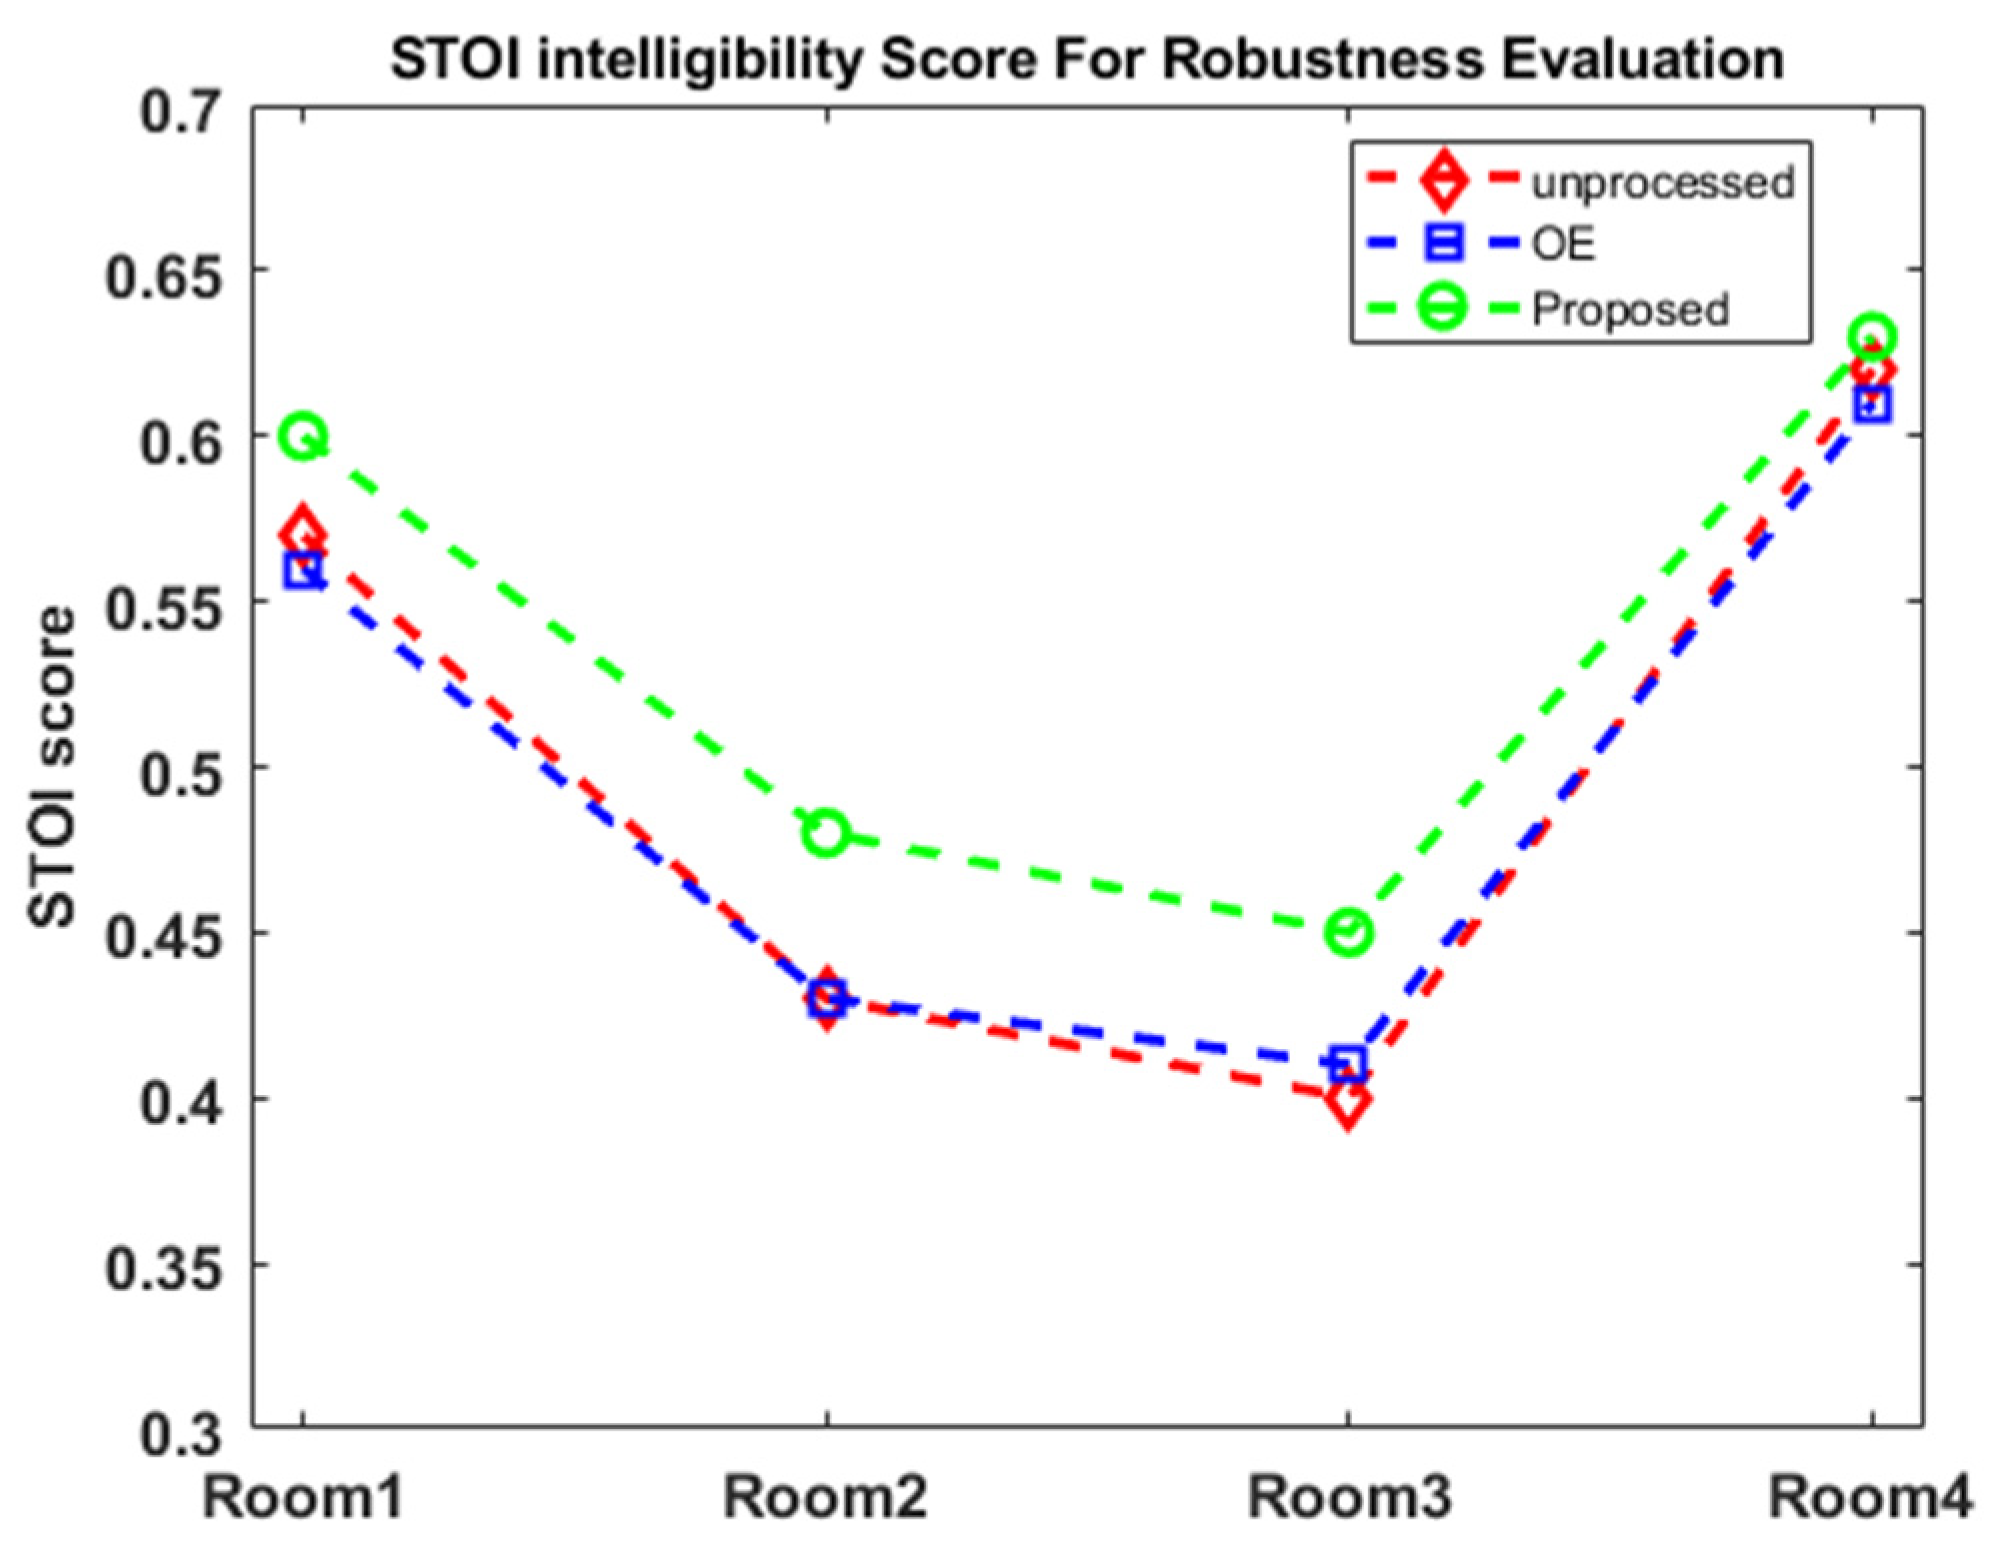
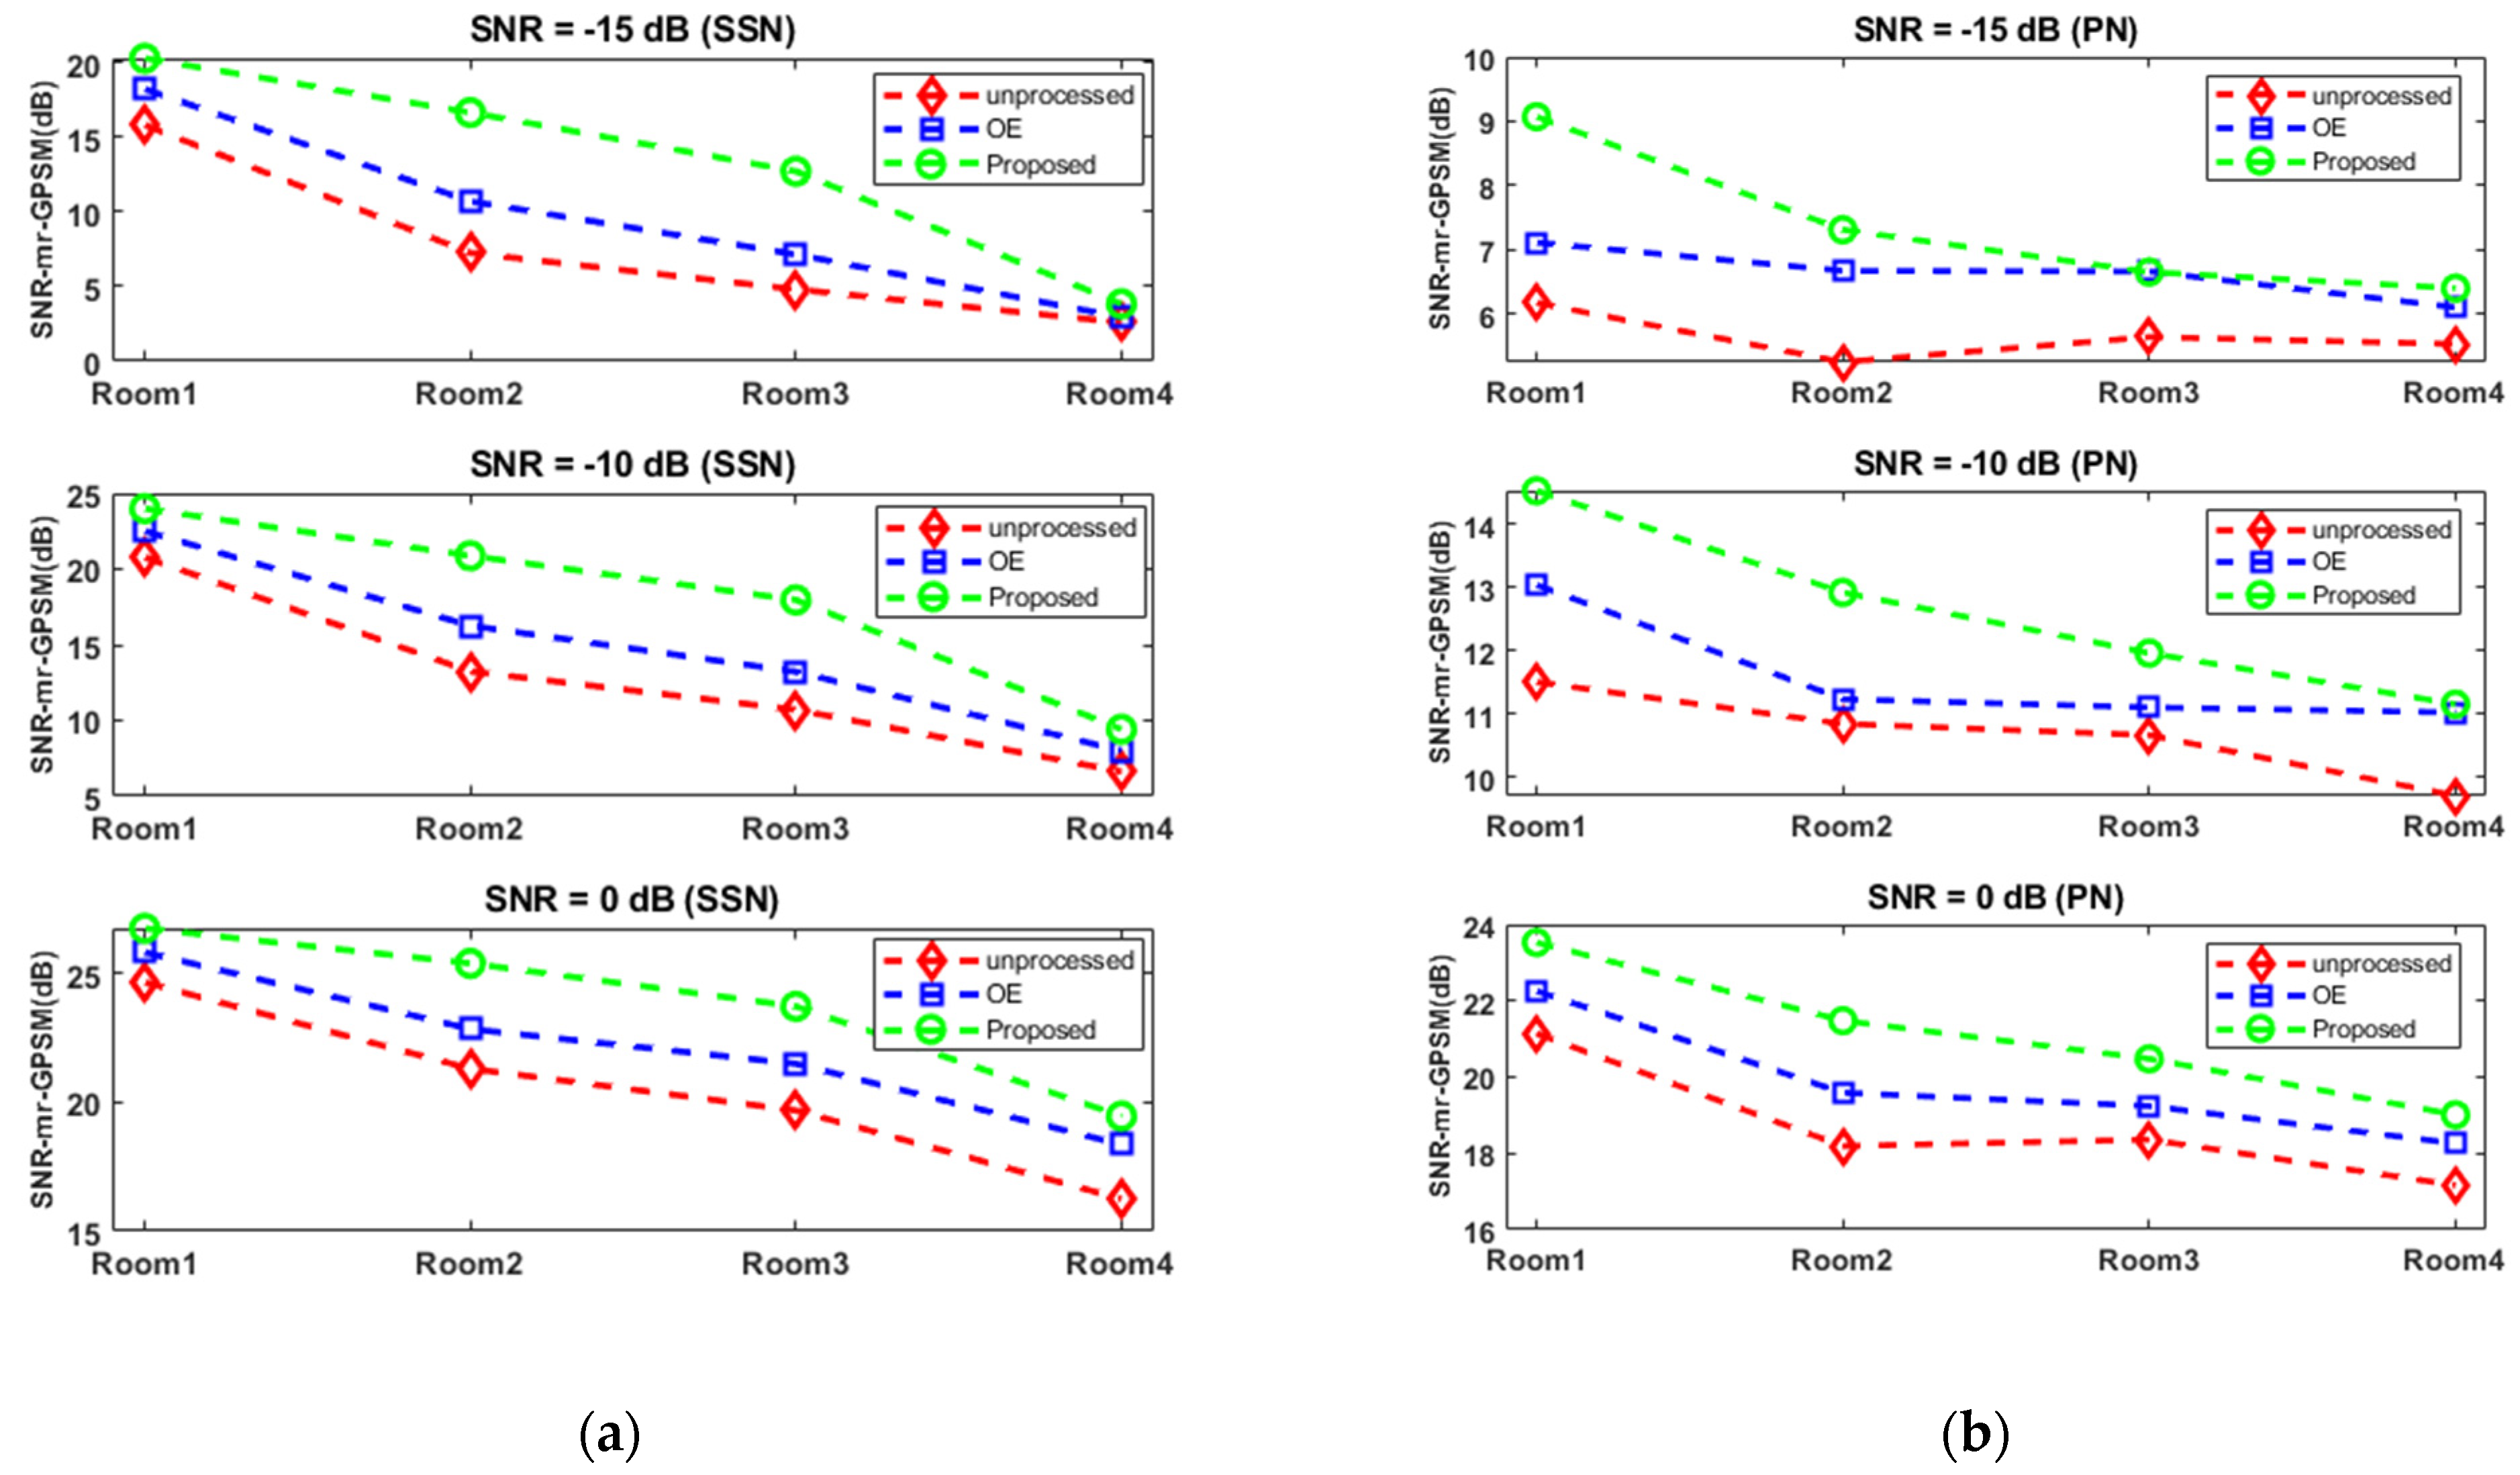
3.5. Objective Evaluation of the Algorithm Using Two Intelligibility Models

For the objective evaluation of the proposed algorithm, the left ear of the above-mentioned BRIRs were used for the weight computations of the OE and proposed algorithm. The BRIRs were then convolved with OLSA speech material that was either unprocessed, OE-preprocessed, or preprocessed with the proposed method. Two intelligibility models, the STOI [19] and the multi-resolution generalized power-spectrum model (mr-GPSM) [26], were used. In the STOI [19], the clipped temporal envelope of noisy and manipulated speech is compared with that of clean speech using a correlation in 384 ms time intervals as an intermediate intelligibility measure in each one-third octave band. The average of the intermediate intelligibility scores across all time intervals and bands is the STOI intelligibility score which can be a number between zero and one. In the mr-GPSM method [26], using “speech+noise” and “noise” signals, the Hilbert envelope in each auditory channel is calculated and then low-pass filtered. The signal for each auditory channel is then separated into two independent pathways where the outputs of envelope power SNRs model (EPSM) and power SNRs model (PSM) are calculated. The envelope power SNRs across auditory and modulation channels and power SNRs across auditory channels are first combined and then each of them is multiplied to its empirical correction factor. The final mr-GPSM score is the maximum value of weighted combined envelope power SNRs and weighted combined power SNRs. For both intelligibility models, the intelligibility scores were averaged across 120 sentences. For the STOI, the unprocessed and preprocessed reverbed signals without additive noise are compared with clean speech. The reason for the selection of STOI is the fact that its metric is very similar to our defined cost function using the optimization method. It is expected that by minimizing the cost function in Equation (11) based on the square error, the STOI score based on correlation is also improved. For evaluation with mr-GPSM, the SSN and PN without convolving with BRIRs are added to the reverbed speech materials in three SNR values of −15, −10, and 0 dB. This is done to keep the influence of background noise identical across conditions. For each reverbed sentence, different samples of the full noise token are added. To have a good averaging across noise samples, five additional runs for each set of reverbed speech materials are performed.
Figure 4 shows the STOI score of the main scenario in each room for reverbed unprocessed, reverbed OE-enhanced, and the reverbed enhanced signal with the proposed algorithm. The OE does not show much difference compared to the unprocessed case, but the improvement for the proposed approach is considerable. The STOI improvement for rooms R1, R2, and R3 is about 0.05. but lower improvement is seen for room R4 with very high reverberation time.
Figure 5a shows the predictions of mr-GPSM for SSN. The SNR-mr-GPSM is the intelligibility score of this intelligibility model which is a summation of envelope-SNR and DC-SNR [26]. The speech reception threshold (SRT) is an increasing monotonic function of SNR-mr-GPSM. A comparison between three signals for each panel shows that both OE and the proposed approach enhance the speech intelligibility. However, the improvement for the proposed algorithm is considerable in comparison to the OE method.
Specifically for low SNR = −15 dB, this improvement is about 7 SNR-mr-GPSM for rooms R2 and R3. Generally, the model shows less improvement for rooms R1 and R4. The intelligibility score of R1, because of lower T 60 , is higher than others and therefore this score may reach near to its maximum possible value such that more improvement is not possible specifically for high SNRs near 0 dB (third-row panel in Figure 5a). For room R4 with a long reverberation tail, the model, because of high amount of time smearing, does not show much improved scores, specifically for more noisy conditions with SNR = −10 and −15 dB. The same evaluation using mr-GPSM is shown in Figure 5b, now using PN. The model shows lower scores for the PN in comparison to SSN and also lower improvements caused by the preprocessing algorithm. Generally, the model predictions show less than 1 dB improvement for OE and about 2 dB improvement using the proposed method. In spite of lower values of improvements, the curves of Figure 5b show a consistent increase of speech intelligibility using the OE and the proposed approaches.
The intelligibility prediction models are also applied to the robustness evaluation scenarios. In Figure 6, the STOI scores similar to Figure 4 show an improvement of intelligibility for the proposed method in comparison to the unprocessed and OE-enhanced signals.
In Figure 7, the SNR-mr-GPSM scores for evaluation of robustness of the proposed algorithm are compared with the unprocessed and OE-enhanced signals. The improvements are in the range obtained for the main scenarios in Figure 5.
In Figure 7a, the maximum improvement predicted by the mr-GPSM in the presence of SSN for the OE-preprocessed signal is 3 dB and for the proposed approach it is about 9 dB. For the PN, a similar tendency can be seen in the three panels of Figure 7b. The data show an overall improvement of 3 to 4 dB for the proposed method depending on the scenario. This improvement is sometimes better than the main scenario for SSN and PN. This underlines that the proposed algorithm is very robust against changes in listener position and that detailed knowledge of the IRs is not essential. The intelligibility score is more dependent on the listening scenario and was sometimes better than the main scenario for which the weights were calculated because of more binaural advantage caused by more azimuthal separation of the target and noise sources.

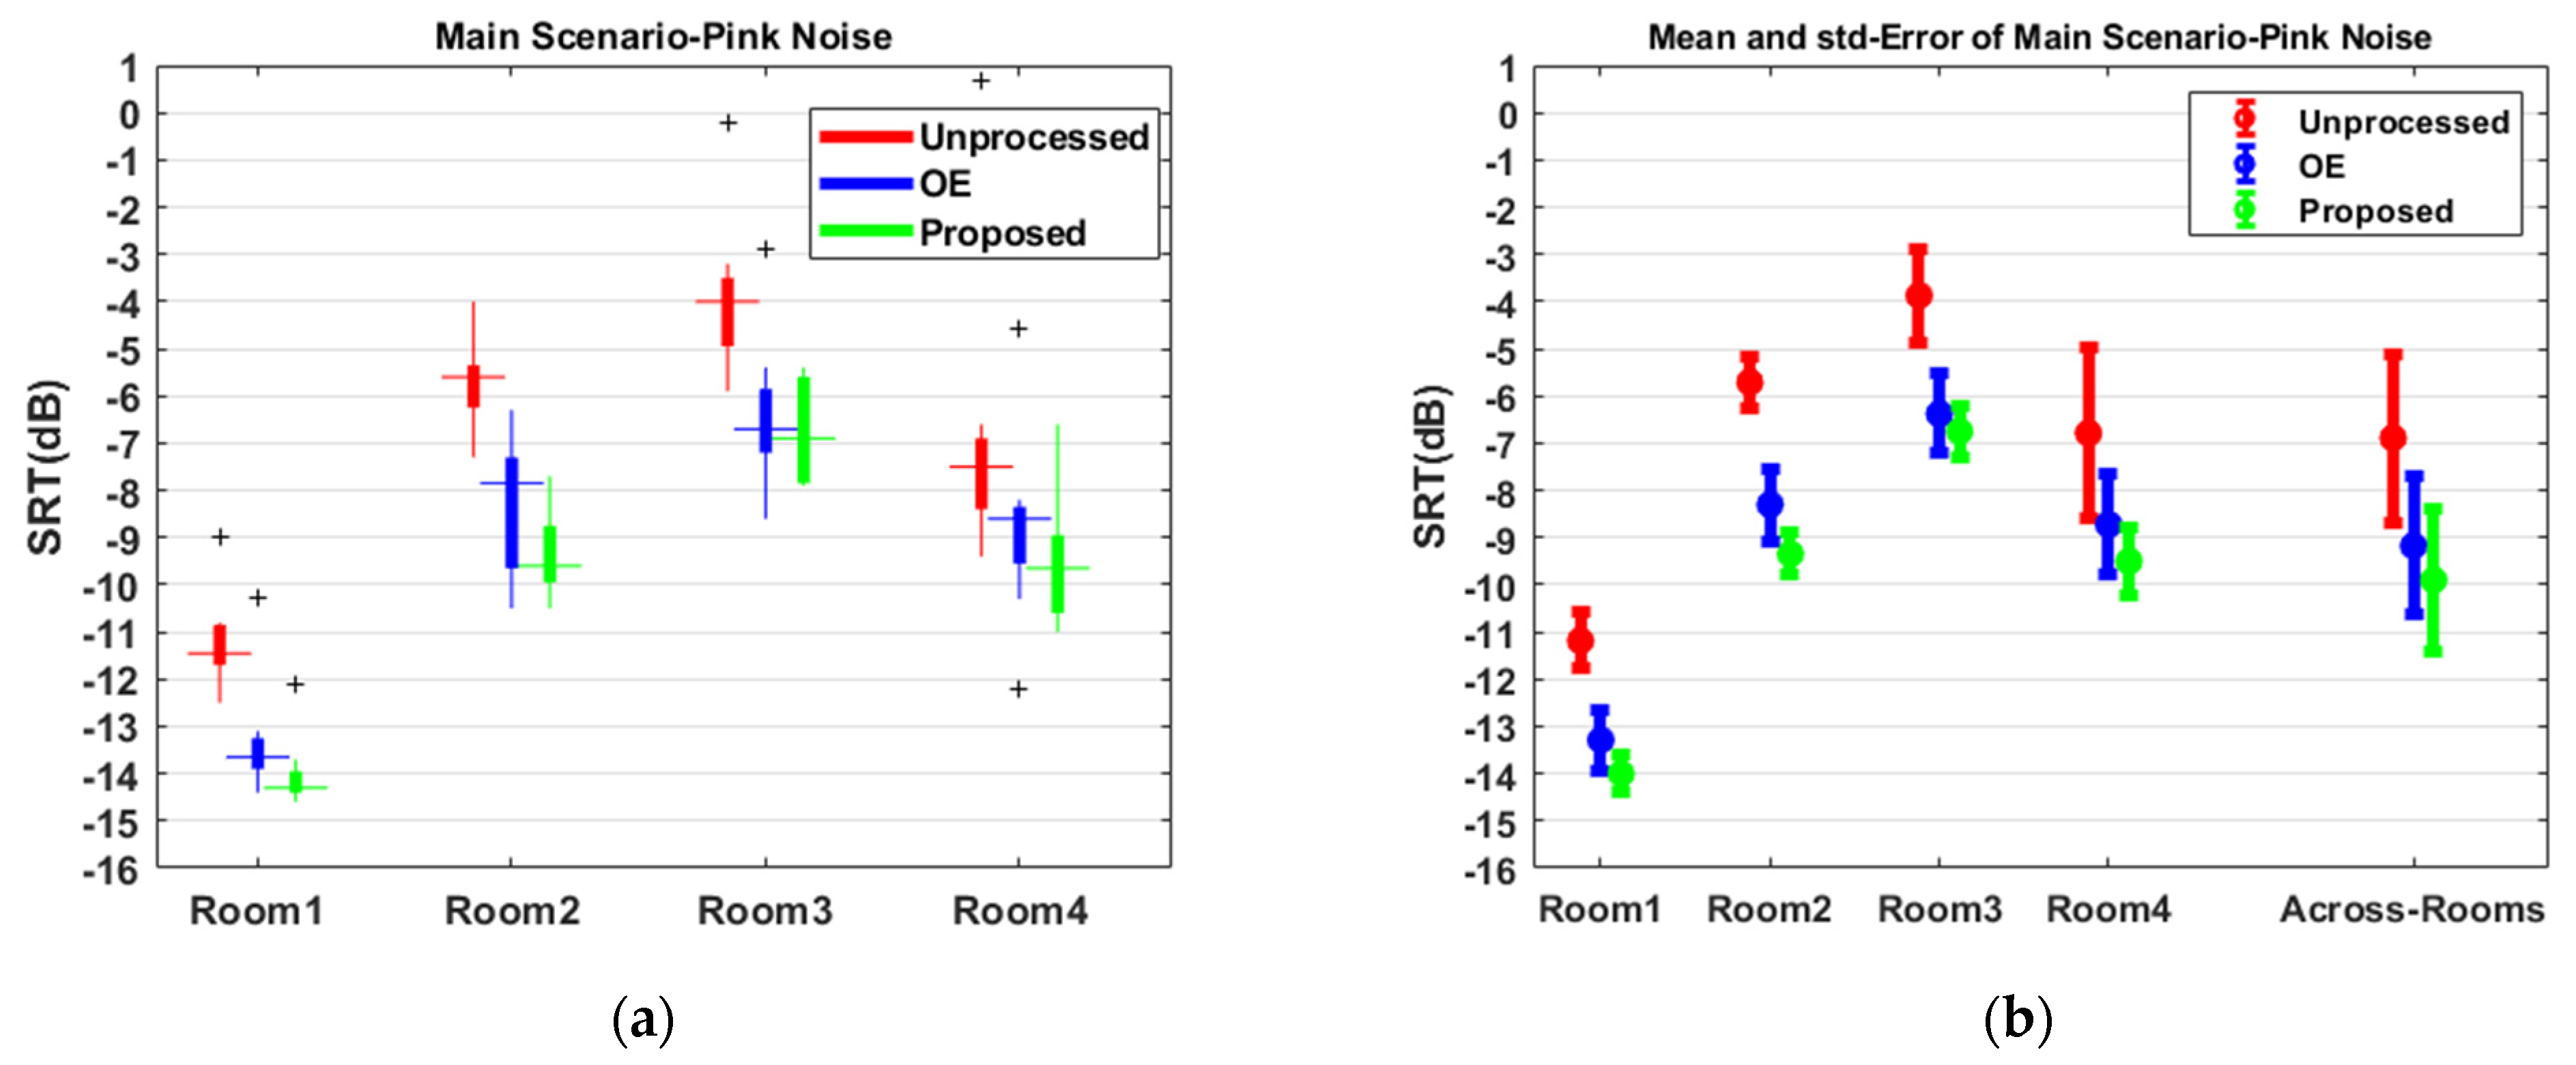
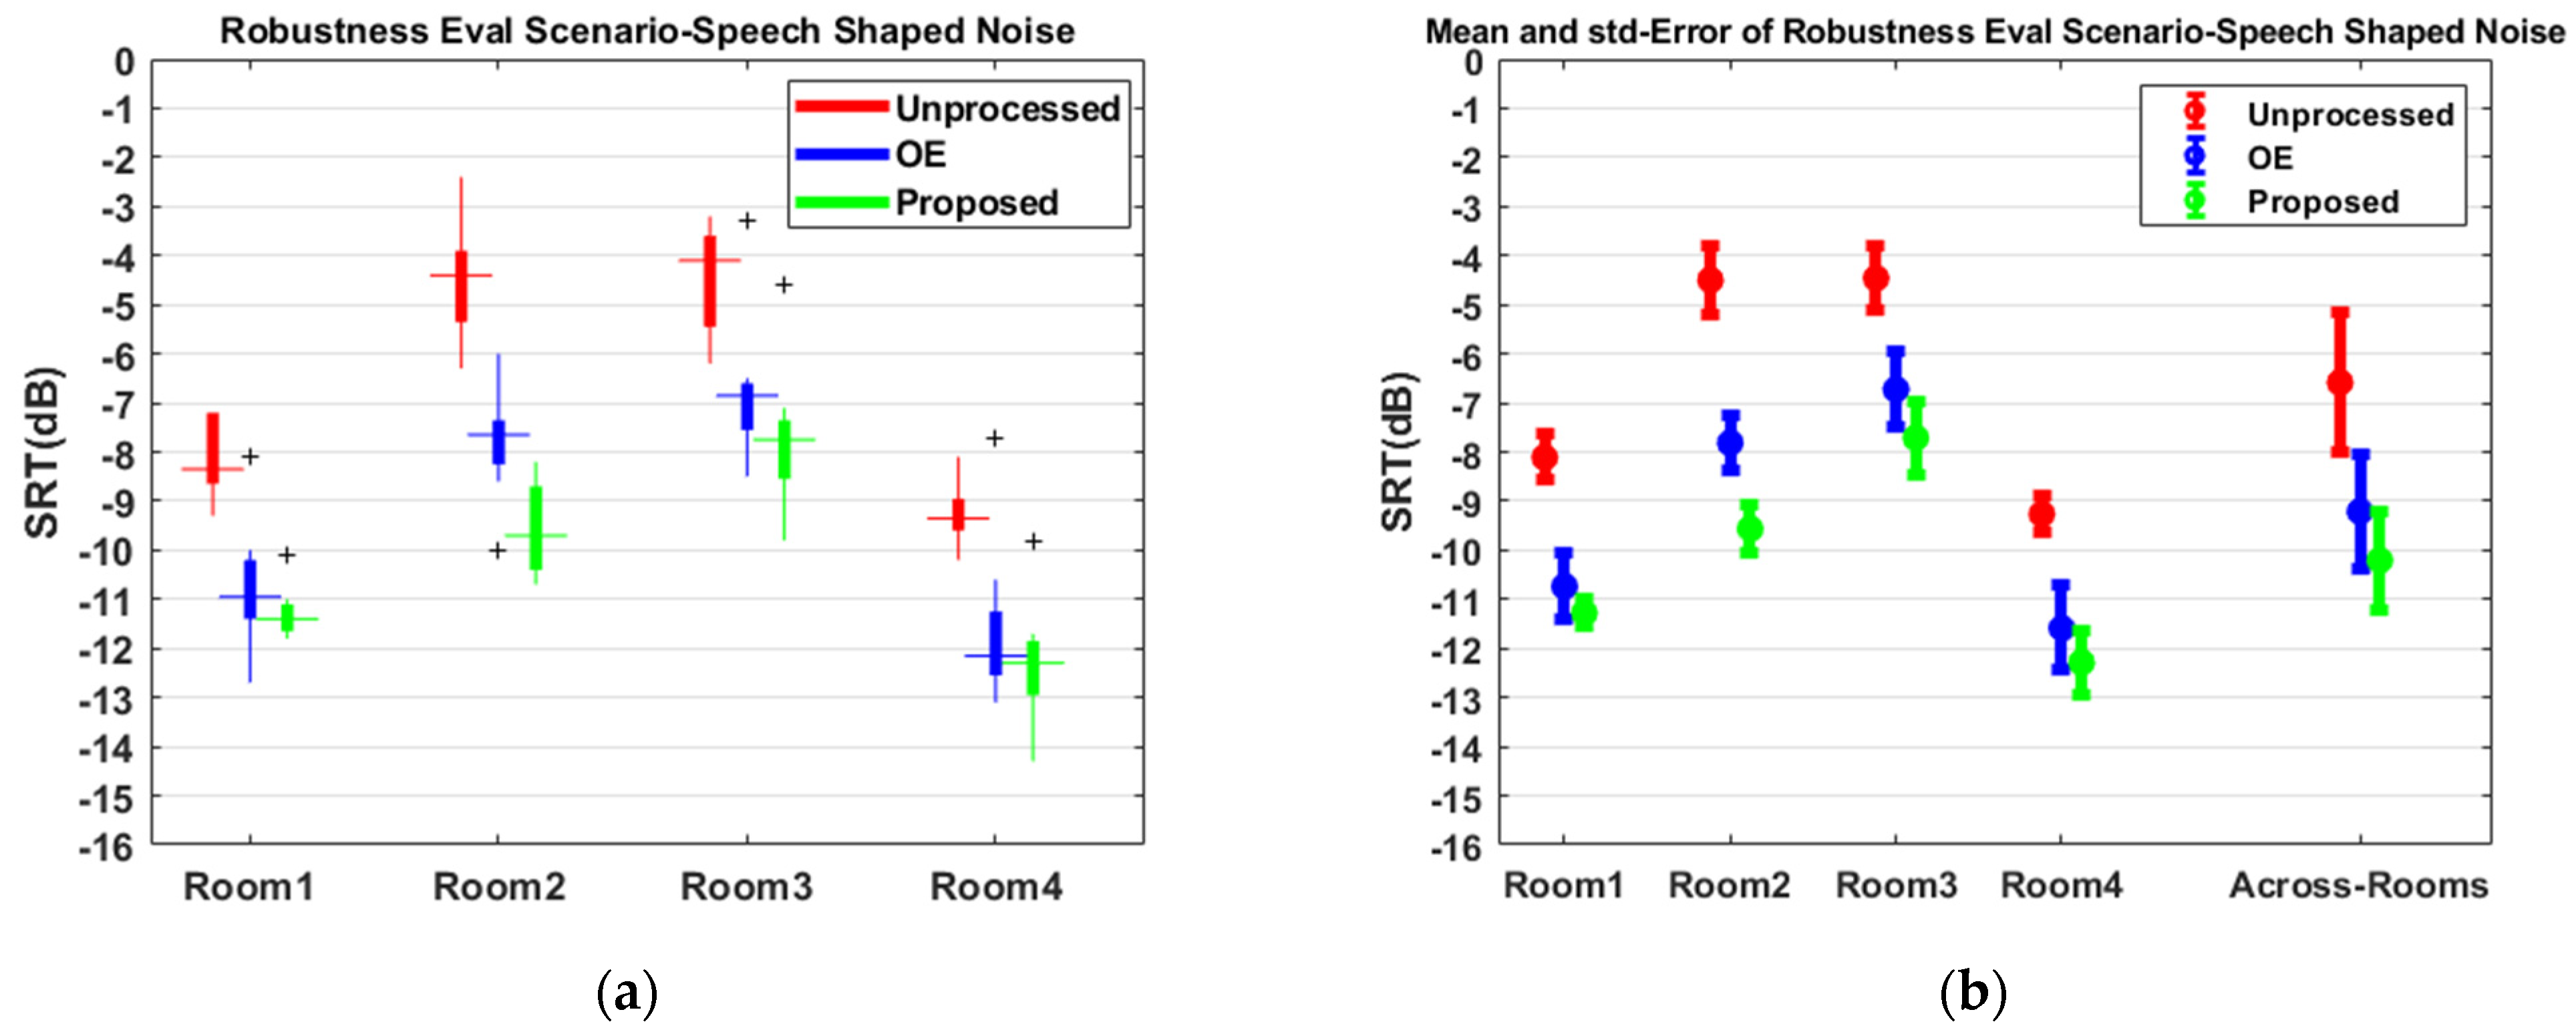
3.6. Subjective Evaluation

The 50% speech reception thresholds (SRT50) were carried out using the AFC toolbox in MATLAB [27]. For each scenario, a different list of 20 sentences is played for a listener. For each played sentence in the list, there are ten alternatives. The listener was asked to select a word from the alternatives after playing an audio file. The speech level of next sentence is adaptively adjusted to measure SRT50. The step size of each level is dependent on the number of correctly selected words of the previous sentence.
Figure 8 shows the SRT50 for eight subjects obtained with the OLSA matrix test for all four room-acoustical scenarios and SSN for the unprocessed, OE, and the proposed approach. In the left panel, median values are shown together with the 25% and 75% quantiles and outliers across eight subjects. The right panel shows the mean values and the standard error across the subject’s mean values and the standard error at the most right-hand side is calculated across all subjects and rooms. Considering all rooms, it can be seen in Figure 8b that the intelligibility is enhanced up to 3.5 dB for OE and 5 dB for the proposed approach compared to the unprocessed speech. In the rooms R2 and R3, the proposed approach has a slightly larger effect on intelligibility which may be caused by the midrange values of T 60 . Data obtained in rooms R2 and R3 for SSN show an improvement of about 1.5 dB and 1 dB for the proposed method in comparison to the OE. The proposed approach shows only a small improvement in Rooms R1 and R4, which is due to the low and very high reverberation times that make more improvements difficult. Room 4, which is a church with a reverberation time of T 60 = 5 s, shows no large difference between the proposed and OE approach. For this room, in spite of the higher reverberation time, the SRTs are lower in comparison to that of rooms R2 and R3. This is mainly because of high direct-to-reverberant ratio in the BRIRs of the church and also the larger azimuth angle difference between source and the noise for BRIRs in the church.
In Figure 9, the same plots are depicted but this time for the PN interferer. Both the OE and proposed approach shows fairly good improvement in comparison to the unprocessed signal. However, altogether a low improvement of about 1 dB is seen for the proposed approach in comparison to the OE. Only for room 2, there is more than 1 dB improvement.
The results of SRT50 measurements for the robustness evaluation scenarios are shown in Figure 10 and Figure 11 for SSN and PN, respectively. These figures show the SRTs optimized on the main scenario and applied to the robustness evaluation positions. For the SSN in Figure 10, a comparison between the three signals shows that for SSN there is an improvement up to 3.5 dB for the OE and 5.5 dB for the proposed method relative to the unprocessed signal. A similar tendency can be seen in Figure 11 for PN. The data in Figure 11 show an overall improvement of 1.5 to 3 dB for OE and 2 to 3.5 dB for the proposed approach depending on the room. In general, comparing the thresholds of the robustness evaluation scenario with that of main scenarios, it can be seen that, similar to the predictions of the intelligibility models, both the OE and proposed methods are very robust against changes in position and a detailed knowledge of the IR is not necessary.

4. Discussion

In this study a new reverb-based NELE approach based on the optimization of a cost function was proposed that reduces the time-smearing effect of reverberation on speech and similar to the OE amplifies the onsets and has high-pass filter characteristics. Its main advantage to the OE is considering future frames in finding filtering weights and for this reason, more reduction of the overlap masking of reverberation tail is seen. The amount of overlap masking is considered in the defined cost function and is used to control the weights applied on the original speech signal speech segments that would make the upcoming frames inaudible. Higher importance for the onset segments in the cost function is assigned to avoid attenuation of onsets which would decrease intelligibility. Both the model predictions and listening-test results showed improvement in SRTs. It has been demonstrated by the model prediction that the proposed algorithm is better able to compensate for the detrimental effects of reverberation than the OE method. The subjective evaluation showed that depending on the scenario there is an improvement of 0.5 dB up to 2 dB in comparison to the OE. The mr-GPSM model predicts a larger improvement for the proposed method over the OE method than what is actually observed in the listening tests. One reason could be the stronger artifacts created by the proposed algorithm compared to the OE method. A possible modification of the method could be using a quality-assessment criteria in the optimization procedure. The algorithm evaluation using both the intelligibility models and the listening test showed that improvements in speech intelligibility did not depend on having an exact match between the positions of the source and the listener used for obtaining the optimal weights. Similar to the OE approach, this underlines the robustness of this algorithm for errors in the estimation of room impulse responses. For the proposed algorithm, only a course spectro-temporal representation of the room impulse response is used and the exact magnitudes and phases of the transfer function are not needed. Therefore, the robustness problem that exists in the inverse-filtering approaches is avoided in the proposed method.
Another important point about the proposed approach is the fixed parameters being used in construction of the cost function and optimization. The fixed set of parameters is used for all of the scenarios. The performance of the algorithm is dependent on the parameters that are set. The first parameter is the number of the future frames (P) that are considered in the summed-cost-function (SCF) of Equation (12) which is based on the reverberation time. To reduce the computational load, it could set much less than the number of frames covered by the T 60 . Informal listening tests showed that beyond a specific number of future frames, the signal is not much more improved. Imperially, P was determined according to the EDC of the RIR, until the point it drops 25 dB. Other parameters that are fixed empirically are the weights ( β i ) assigned to onsets in the defined SCF again in Equation (12) and the lower and upper bound for the gains in Equation (13). For the future work these parameters could be selected according to an intelligibility model.
For the computational load, there is not much difference between preprocessing for the proposed approach and that of the OE. In both methods, the signal is separated into frequency bands (Gammatone-based in OE and one-third octave band bin separation in the proposed approach) and power spectral of signals are obtained using FFT processing. However, in the proposed approach, there is a significant computational load in the optimization part. The optimization is performed using Sequential Quadratic Programming (SQP) algorithm implemented in MATLAB by running the “fmincon” function. Because of using a symbolic function in MATLAB and the complicated optimization algorithm, the running time is high. It is dependent on the T60 and the length of signal. The time needed to calculate the weights of 17 independent bands for a 3 s speech audio file and T60 = 1 s is about 40 min. The running time of OE algorithm for the same file and similar room condition is very low and below 10 s. Therefore, the proposed algorithm with the current optimization approach is not possible to be used in a real-time scenario. Note that this study was focused on the design of algorithm and the reduction of the complexity and computational load will be considered in the future study. We intend to replace the symbolic optimization in MATLAB with a faster algorithm such as a modified version of [28].
The proposed method is in the category of reverbed-base NELE algorithms. According to the literature, algorithms that use priori knowledge of the maskers and RIRs do not perform better than noise-independent algorithms. The ASE and SSDRC approaches that are not using the characteristics of the playback environment outperformed other methods in the NELE challenge [29]. It is surprising that until now enhancement algorithms with the goal of enhancing the noise and reverberation effect on the speech have not performed well. A promising approach could be a combination of three categories of NELE algorithms including rule-based, noise-dependent, and reverberation-dependent to benefit from the advantages of separate methods. For example, in Adaptive Compressive Onset-Enhancement (ACO) method [30], sequential and independent combination of a modified version of the AdaptDRC [6] and the OE [16] is used to enhance the speech in a reverb and noisy room with the knowledge of statistics of additive noise and RIR respectively.

Author Contributions

Conceptualization, A.F. and S.v.d.P.; methodology, A.F. and S.v.d.P.; software, A.F.; validation, A.F. and S.v.d.P.; formal analysis, A.F.; investigation, A.F.; resources, A.F. and S.v.d.P.; data curation, A.F.; writing—original draft preparation, A.F.; writing—review and editing, S.v.d.P.; visualization, A.F. and S.v.d.P.; supervision, S.v.d.P.; project administration, S.v.d.P.; funding acquisition, S.v.d.P. All authors have read and agreed to the published version of the manuscript.

Funding

This research was funded by the Deutsche Forschungsgemeinschaft (DFG, German Research Foundation)–Project-ID: 352015383–SFB 1330 C2.

Institutional Review Board Statement

The study was conducted according to the guidelines of the Declaration of Helsinki and approved by the Institutional Review Board (or Ethics Committee) of Carl von Ossietzky University of Oldenburg.

Informed Consent Statement

Informed consent was obtained from all subjects involved in the study.

Data Availability Statement

Not applicable.

Acknowledgments

The authors would like to thank Christoph Kirsch, Siegfried Gündert, and Thomas Biberger for providing recorded BRIRs and the mr-GPSM speech intelligibility model. The authors also thank the three anonymous reviewers for their helpful comments that helped to improve the paper.

Conflicts of Interest

The authors declare no conflict of interest.

References

  1. Sauert, B.; Vary, P. Near end listening enhancement: Speech intelligibility improvement in noisy environments. In Proceedings of the 2006 IEEE International Conference on Acoustics Speech and Signal Processing Proceedings, Toulouse, France, 14–19 May 2006. [Google Scholar]
  2. Zorilă, T.-C.; Stylianou, Y.; Ishihara, T.; Akamine, M. Near and far field speech-in-noise intelligibility improvements based on a time–frequency energy reallocation approach. IEEE/ACM Trans. Audio Speech Lang. Process. 2016, 24, 1808–1818. [Google Scholar] [CrossRef]
  3. Zorila, T.-C.; Kandia, V.; Stylianou, Y. Speech-in-noise intelligibility improvement based on spectral shaping and dynamic range compression. In Proceedings of the Thirteenth Annual Conference of the International Speech Communication Association, Portland, OR, USA, 9–13 September 2012. [Google Scholar]
  4. Gordon-Salant, S. Recognition of natural and time/intensity altered CVs by young and elderly subjects with normal hearing. J. Acoust. Soc. Am. 1986, 80, 1599–1607. [Google Scholar] [CrossRef] [PubMed] [Green Version]
  5. Chermaz, C.; King, S. A sound engineering approach to near end listening enhancement. In Proceedings of the Interspeech, Shanghai, China, 25–29 October 2020. [Google Scholar]
  6. Schepker, H.; Rennies, J.; Doclo, S. Speech-in-noise enhancement using amplification and dynamic range compression controlled by the speech intelligibility index. J. Acoust. Soc. Am. 2015, 138, 2692–2706. [Google Scholar] [CrossRef] [PubMed]
  7. Schepker, H.; Hülsmeier, D.; Rennies, J.; Doclo, S. Model-based integration of reverberation for noise-adaptive near-end listening enhancement. In Proceedings of the Sixteenth Annual Conference of the International Speech Communication Association, Resden, Germany, 6–10 September 2015. [Google Scholar]
  8. Chermaz, C.; Valentini-Botinhao, C.; Schepker, H.F.; King, S. Evaluating Near End Listening Enhancement Algorithms in Realistic Environments. In Proceedings of the INTERSPEECH, Graz, Austria, 15–19 September 2019; pp. 1373–1377. [Google Scholar]
  9. Taal, C.H.; Hendriks, R.C.; Heusdens, R. Speech energy redistribution for intelligibility improvement in noise based on a perceptual distortion measure. Comput. Speech Lang. 2014, 28, 858–872. [Google Scholar] [CrossRef]
  10. Li, H.; Fu, S.-W.; Tsao, Y.; Yamagishi, J. iMetricGAN: Intelligibility Enhancement for Speech-in-Noise using Generative Adversarial Network-based Metric Learning. arXiv 2020, arXiv:2004.00932. [Google Scholar]
  11. Schädler, M. Optimization and evaluation of an intelligibilityimproving signal processing approach (IISPA) for the Hurricane Challenge 2.0 with FADE. In Proceedings of the Interspeech, Shanghai, China, 25–29 October 2020; pp. 1331–1335. [Google Scholar]
  12. Mertins, A.; Mei, T.; Kallinger, M. Room impulse response shortening/reshaping with infinity-and $ p $-norm optimization. IEEE Trans. Audio Speech Lang. Process. 2009, 18, 249–259. [Google Scholar] [CrossRef]
  13. Kusumoto, A.; Arai, T.; Kinoshita, K.; Hodoshima, N.; Vaughan, N. Modulation enhancement of speech by a pre-processing algorithm for improving intelligibility in reverberant environments. Speech Commun. 2005, 45, 101–113. [Google Scholar] [CrossRef]
  14. Arai, T.; Hodoshima, N.; Yasu, K. Using steady-state suppression to improve speech intelligibility in reverberant environments for elderly listeners. IEEE Trans. Audio Speech Lang. Process. 2010, 18, 1775–1780. [Google Scholar] [CrossRef] [Green Version]
  15. Petkov, P.N.; Stylianou, Y. Adaptive gain control for enhanced speech intelligibility under reverberation. IEEE Signal Process. Lett. 2016, 23, 1434–1438. [Google Scholar] [CrossRef]
  16. Grosse, J.; van de Par, S. A speech preprocessing method based on overlap-masking reduction to increase intelligibility in reverberant environments. J. Audio Eng. Soc. 2017, 65, 31–41. [Google Scholar] [CrossRef]
  17. Arai, T.; Kinoshita, K.; Hodoshima, N.; Kusumoto, A.; Kitamura, T. Effects of suppressing steady-state portions of speech on intelligibility in reverberant environments. Acoust. Sci. Technol. 2002, 23, 229–232. [Google Scholar] [CrossRef] [Green Version]
  18. Hodoshima, N.; Arai, T.; Kusumoto, A.; Kinoshita, K. Improving syllable identification by a preprocessing method reducing overlap-masking in reverberant environments. J. Acoust. Soc. Am. 2006, 119, 4055–4064. [Google Scholar] [CrossRef]
  19. Taal, C.H.; Hendriks, R.C.; Heusdens, R.; Jensen, J. An algorithm for intelligibility prediction of time–frequency weighted noisy speech. IEEE Trans. Audio Speech Lang. Process. 2011, 19, 2125–2136. [Google Scholar] [CrossRef]
  20. Masri, P.; Bateman, A. Imroved Modelling of Attack Transients in Music Analysis-Resynthesis. In Proceedings of the ICMC, Hong Kong, 19–24 August 1996. [Google Scholar]
  21. Collins, N. A comparison of sound onset detection algorithms with emphasis on psychoacoustically motivated detection functions. In Proceedings of the Audio Engineering Society Convention 118, Barcelona, Spain, 28–31 May 2005. [Google Scholar]
  22. Nocedal, J.; Wright, S. Numerical Optimization; Springer Science & Business Media: Berlin/Heidelberg, Germany, 2006. [Google Scholar]
  23. Fletcher, R. Practical Methods of Optimization; John Wiley & Sons: Hoboken, NJ, USA, 2013. [Google Scholar]
  24. Wagener, K.; Brand, T.; Kollmeier, B. Development and evaluation of a German sentence test part III: Evaluation of the Oldenburg sentence test. Z. Fur Audiol. 1999, 38, 86–95. [Google Scholar]
  25. Aspöck, L.; Vorländer, M.; Brinkmann, F.; Ackermann, D.; Weinzierl, S. Benchmark for Room Acoustical Simulation (BRAS). DOI 2020, 10, 14279. [Google Scholar]
  26. Biberger, T.; Ewert, S.D. The role of short-time intensity and envelope power for speech intelligibility and psychoacoustic masking. J. Acoust. Soc. Am. 2017, 142, 1098–1111. [Google Scholar] [CrossRef] [PubMed]
  27. Ewert, S.D. AFC—A modular framework for running psychoacoustic experiments and computational perception models. In Proceedings of the international conference on acoustics AIA-DAGA, Merano, Italy, 18–21 March 2013; pp. 1326–1329. [Google Scholar]
  28. Van De Par, S.; Kot, V.; Van Schijndel, N. Scalable noise coder for parametric sound coding. In Audio Engineering Society 118; Audio Engineering Society: Barcelona, Spain, 2005; p. 699. [Google Scholar]
  29. Rennies, J.; Schepker, H.; Valentini-Botinhao, C.; Cooke, M. Intelligibility-enhancing speech modifications–the hurricane challenge 2.0. In Proceedings of the 2020 Interspeech, Shanghai, China, 25–29 October 2020; pp. 3552–3556. [Google Scholar]
  30. Bederna, F.; Schepker, H.; Rollwage, C.; Doclo, S.; Pusch, A.; Bitzer, J.; Rennies, J. Adaptive compressive onset-enhancement for improved speech intelligibility in noise and reverberation. In Proceedings of the Interspeech, Shanghai, China, 25–29 October 2020. [Google Scholar]
Figure 1. Block diagram of the proposed NELE approach. The preprocessing includes signal windowing, convolving short frames with the RIR to construct extended frames, FFT processing and bin separation to divide a speech into one-third octave bands and onset detection. In the cost function block, the extended frames and data of the onset detection unit are used to construct a cost function for each short frame. The constructed cost functions are iteratively optimized using the data of onset detection unit to compute the gains of short frames. Finally, the enhanced signal is reconstructed using the obtained weights by OLA and summation over one-third octave bands.
Applsci 11 10788 g001
Figure 2. The schematic of three consecutive and overlapped short frames x 1 , f , x 2 , f , x 3 , f . The short frame and subsequently their extended frames y 1 , f , y 2 , f , y 3 , f are multiplied by the weights α 1 , f , α 2 , f , α 3 , f , respectively. The extended frame y 3 , f and one of its sub-frames y 3 , m , f are also shown.
Applsci 11 10788 g002
Figure 3. (a) The cochleagram of clean speech and two preprocessed speech signals are shown. The first-row panel shows the unprocessed speech sentence. Second-row panel shows a preprocessed speech sentence using OE algorithm and the third-row panel shows the preprocessed speech using the proposed algorithm obtained for room R4. The yellow ovals show the difference between the unprocessed signal and two enhanced signals. The preprocessing of OE and the proposed algorithm has a high-pass filter effect on the speech.; (b) The cochleagram of three reverbed signals in room R4 are shown. The first-row panel shows the unprocessed clean sentence. In the first-raw panel, a reverbed unprocessed speech sentence is depicted. The second-row and third-row panels show a reverbed preprocessed speech sentence using OE algorithm and the proposed algorithm respectively. Yellow rectangles show the effect of the frame attenuations in the OE and proposed approaches. In the third panel belonging to the proposed method, there is a low amount of energy leakage from previous frames into the silent gap in comparison to the unprocessed and OE-preprocessed reverbed signals.
Applsci 11 10788 g003
Figure 4. The STOI scores for the main scenario in each room for reverbed unprocessed, reverbed OE-enhanced, and the reverbed enhanced signal with the proposed algorithm. The proposed algorithm shows improvement for the STOI score in comparison to the reverbed unprocessed and OE-enhanced signals.
Applsci 11 10788 g004
Figure 5. (a) The predictions of mr-GPSM in the presence of SSN for three SNR values. The intelligibility scores (SNR-mr-GPSM) show up to 5 dB for OE and up to 15 dB improvement in comparison to the unprocessed signal in low SNR = −15 dB (first-raw panel). The improvement is seen for other SNRs, specifically in rooms R2 and R3. The model shows lower improvement for preprocessed signals in rooms R1 and R4.; (b) The predictions of mr-GPSM in the presence of pink noise (PN) for three SNR values. The intelligibility scores (SNR-mr-GPSM) show less than 1 dB improvement for OE and about 2 dB improvement using the proposed approach.
Applsci 11 10788 g005
Figure 6. The STOI scores for robustness evaluation scenarios in each room for reverbed unprocessed, reverbed OE-enhanced, and the reverbed enhanced signal with the proposed algorithm. The proposed algorithm similar to the main scenarios in Figure 4 shows improvement for the STOI score in comparison to the reverbed unprocessed and OE-enhanced signals.
Applsci 11 10788 g006
Figure 7. (a) The predictions of mr-GPSM for robustness evaluation scenarios in the presence of SSN. The SNR- mr-GPSM show up to 3 dB enhancement for OE and up to 10 dB improvement in comparison to the unprocessed signal in low SNR = −15 dB; (b) The predictions of mr-GPSM in the presence of pink noise (PN) for three SNR values. The intelligibility scores (SNR-mr-GPSM) show about 2 dB improvement for OE and about 4 dB improvement using the proposed approach.
Applsci 11 10788 g007
Figure 8. (a) Boxplots of speech reception thresholds at 50% speech intelligibility (SRT50) for 8 subjects, measured in the presence of SSN are illustrated. The unprocessed and the preprocessed signals for the main scenarios using the OE and proposed method are compared; (b) The mean-SRT50 and the standard errors for the same data in (a) are plotted.
Applsci 11 10788 g008
Figure 9. (a) Boxplots of speech reception thresholds at SRT50 for 8 subjects in the presence of pink noise (PN) are illustrated. The unprocessed and the preprocessed signals for the main scenarios using the OE and proposed method are compared; (b) The mean-SRT50 and the standard errors for the same data are plotted.
Applsci 11 10788 g009
Figure 10. (a) Boxplots of speech reception thresholds at SRT50 for 8 subjects to evaluate the robustness of preprocessing methods, measured in the presence of SSN are illustrated. The unprocessed and the preprocessed signals for the robustness evaluation scenarios using the OE and proposed method are compared; (b) The mean-SRT50 and the standard errors for the same data are plotted.
Applsci 11 10788 g010
Figure 11. (a) Boxplots of speech reception thresholds at SRT50 for 8 subjects to evaluate the robustness of preprocessing methods in the presence of pink noise (PN) are illustrated. The unprocessed and the preprocessed signals for the main scenarios using the OE and proposed method are compared; (b) The mean-SRT50 and the standard errors for the same data in (a) are plotted.
Applsci 11 10788 g011
Table 1. The BRIRs used for the optimization and subjective evaluation. The room names in the database, reverberation times, the length of P frames, and selected BRIRs are mentioned.
RoomName in Database T 60   ( s ) Length of P Frames (s)Main BRIRBRIR for Robustness EvaluationBRIR of Noise
R1VarEcoic0.600.25kas_none_r00_az000kas_none_r00_az060kas_none_r00_az030
R2Music Hall1.10.45CR3_BRIR_LS7_MP6_HATO0CR3_BRIR_LS5_MP6_HATO0CR3_BRIR_LS3_MP6_HATO0
R3Seminar Room1.50.6CR2_BRIR_LS7_MP6_HATO0CR2_BRIR_LS4_MP6_HATO0CR2_BRIR_LS3_MP6_HATO0
R4Church5.01air_binaural_aula_carolina_1_1_3_90air_binaural_aula_carolina_1_1_2_90_3air_binaural_aula_carolina_1_1_3_135_3
Publisher’s Note: MDPI stays neutral with regard to jurisdictional claims in published maps and institutional affiliations.

