
The Fusion of MRI and CT Medical Images Using Variational Mode Decomposition

 ,
,
Abstract
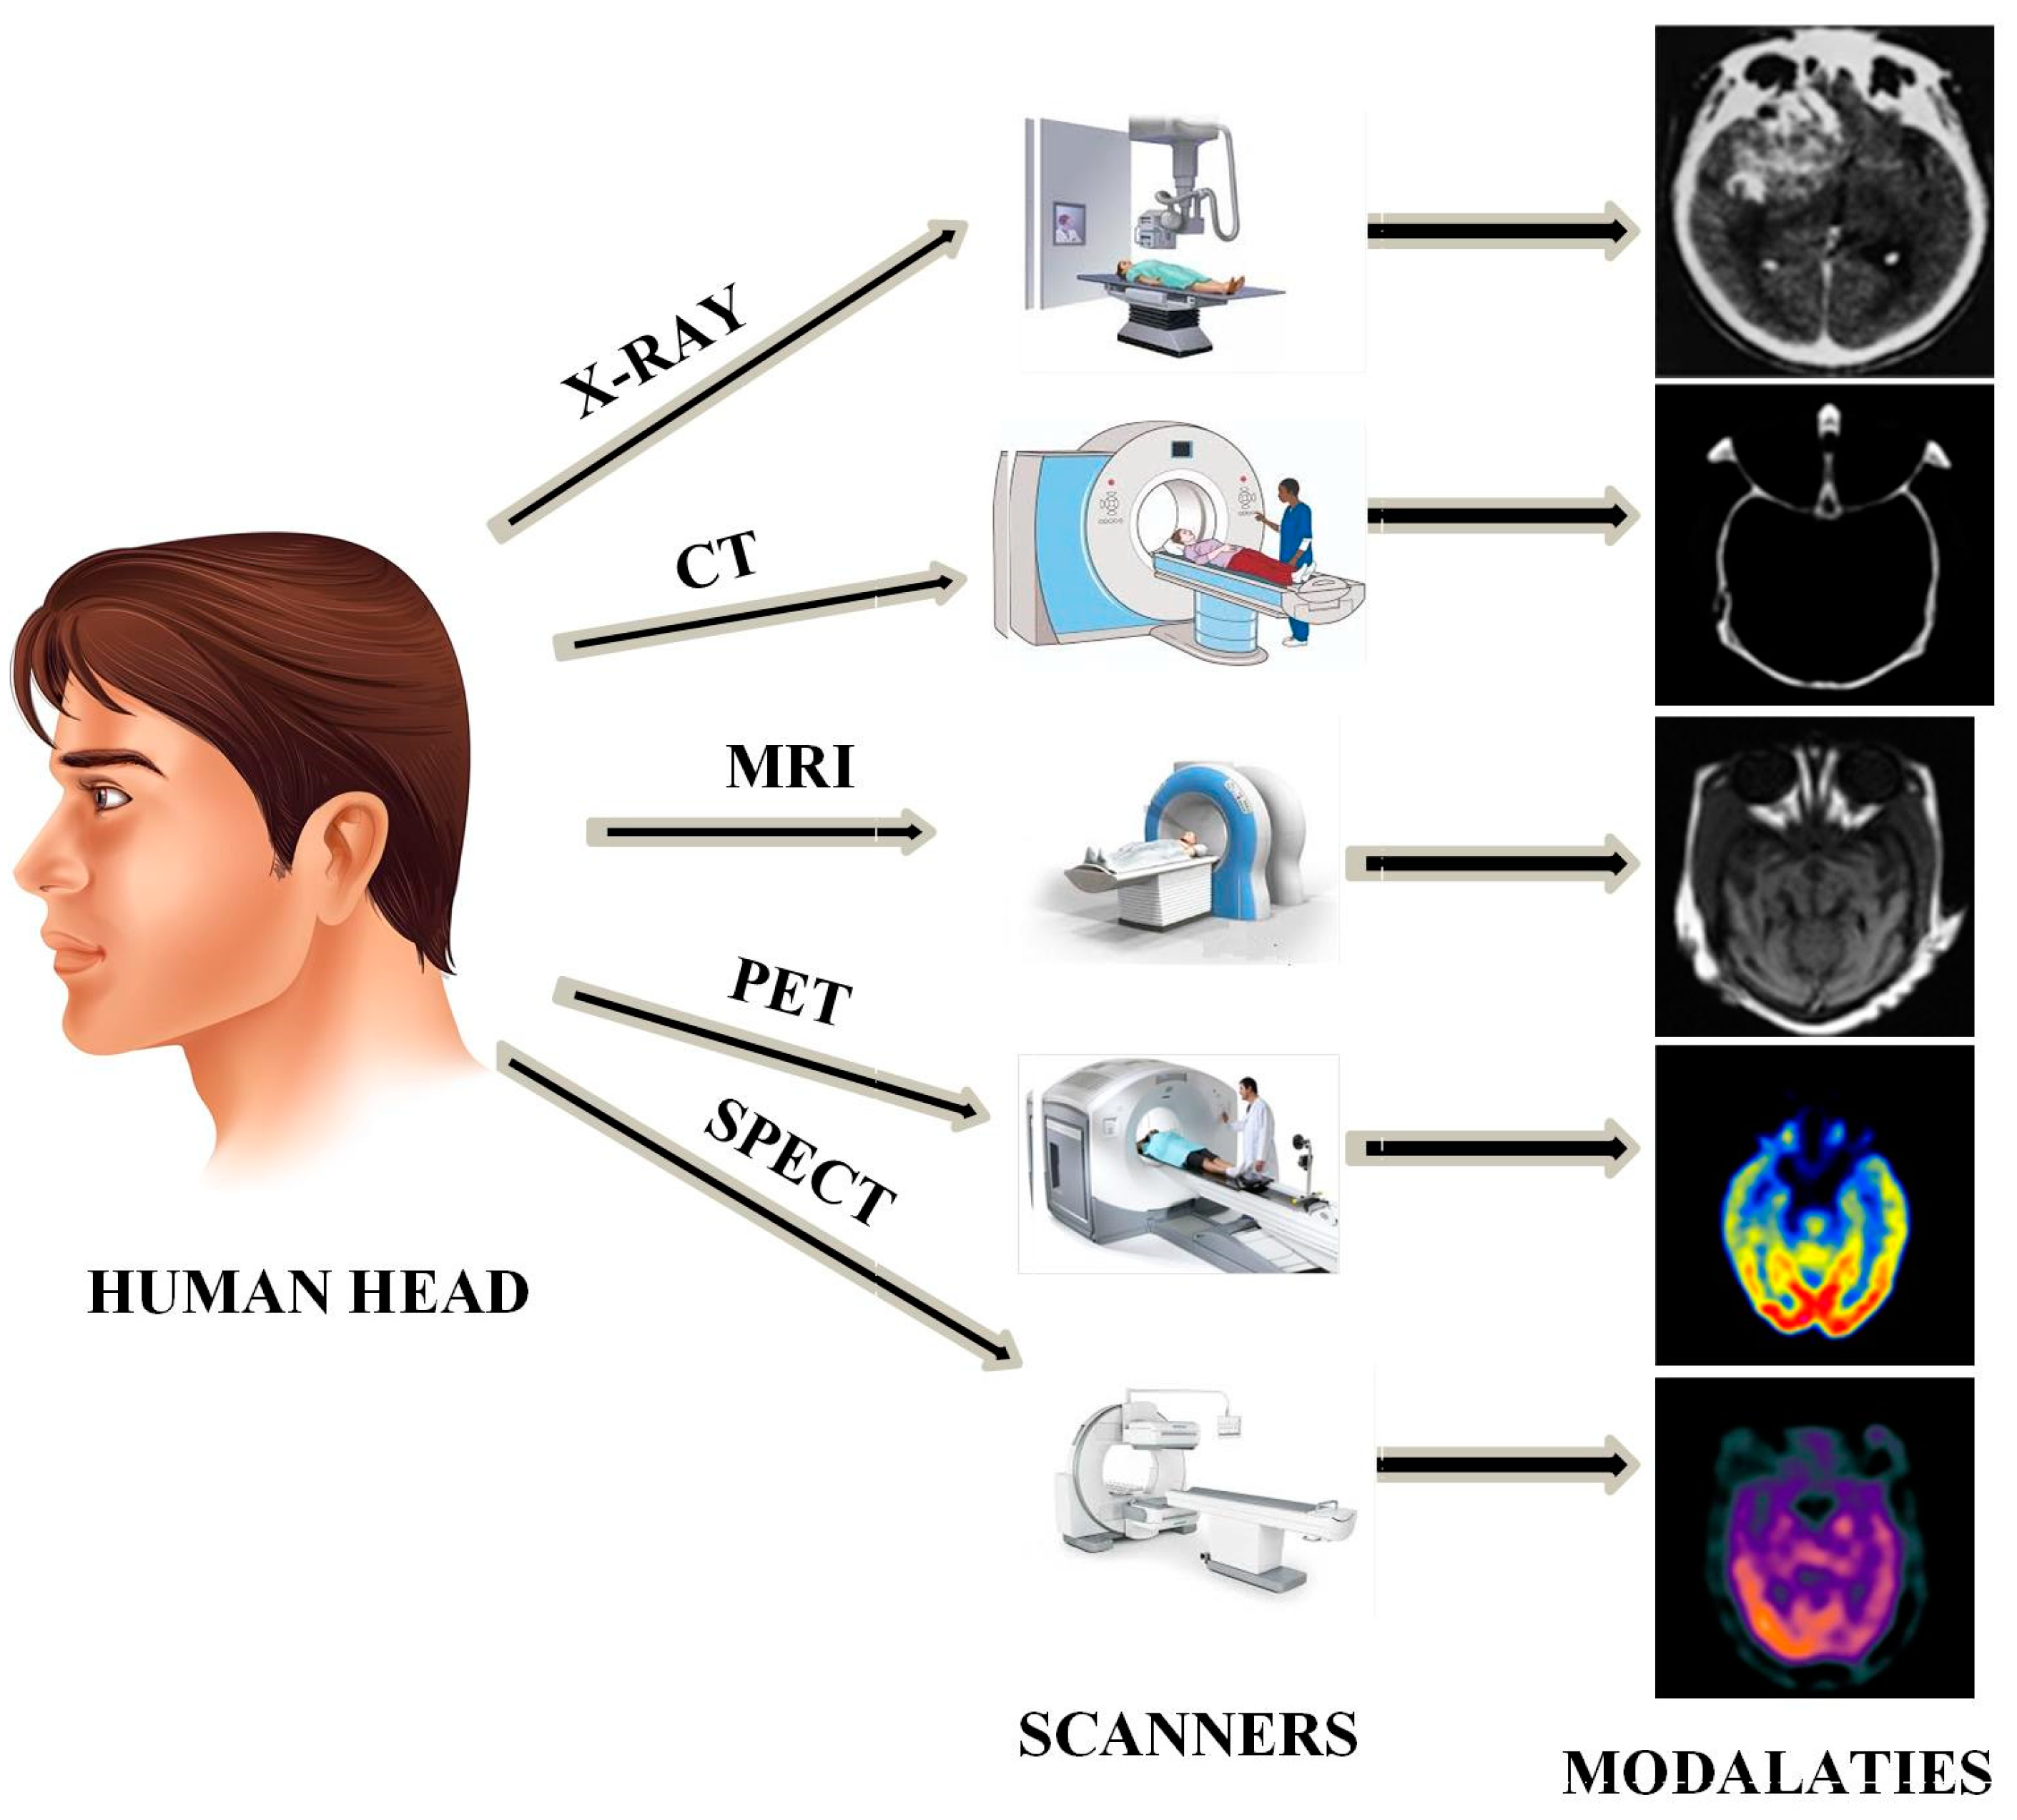
:1. Introduction
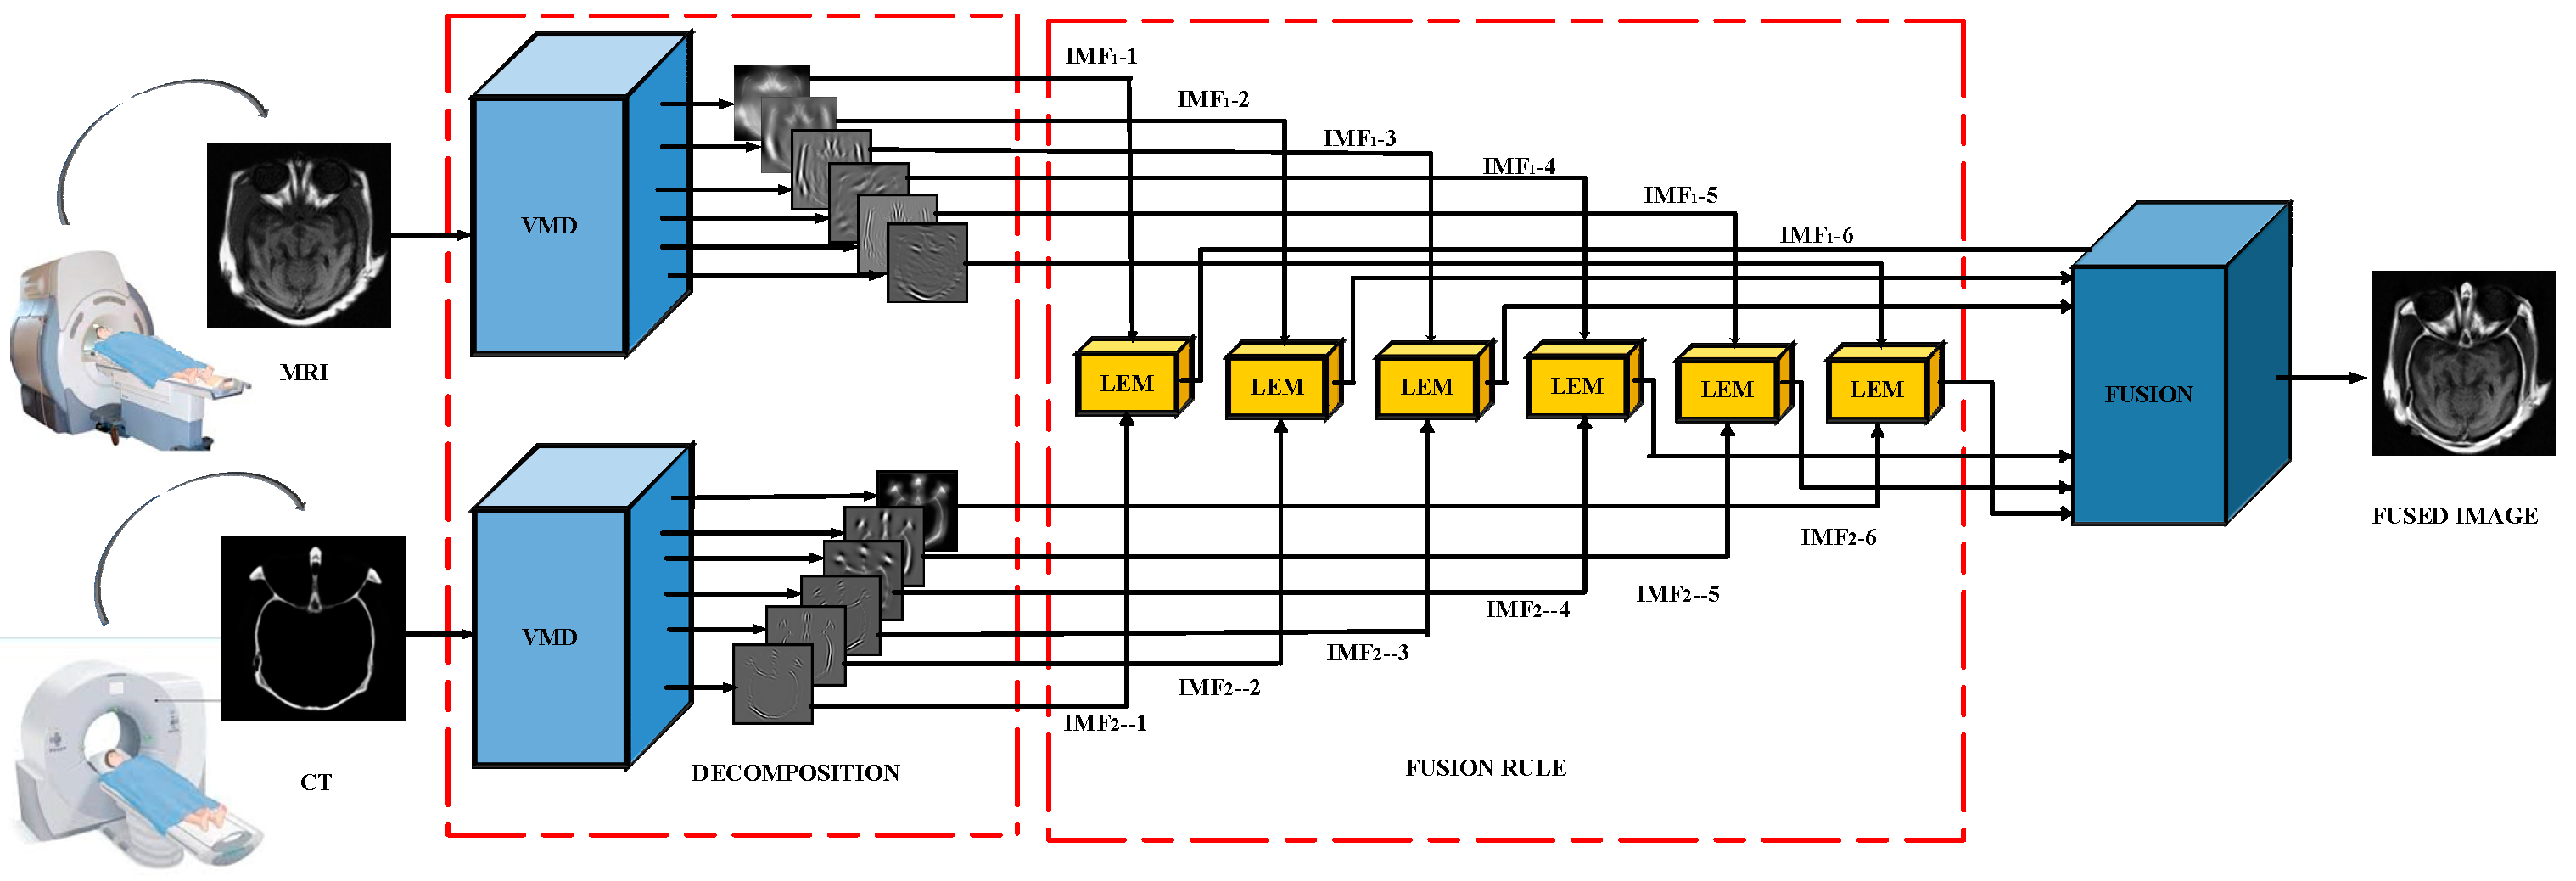
2. Proposed Methodology
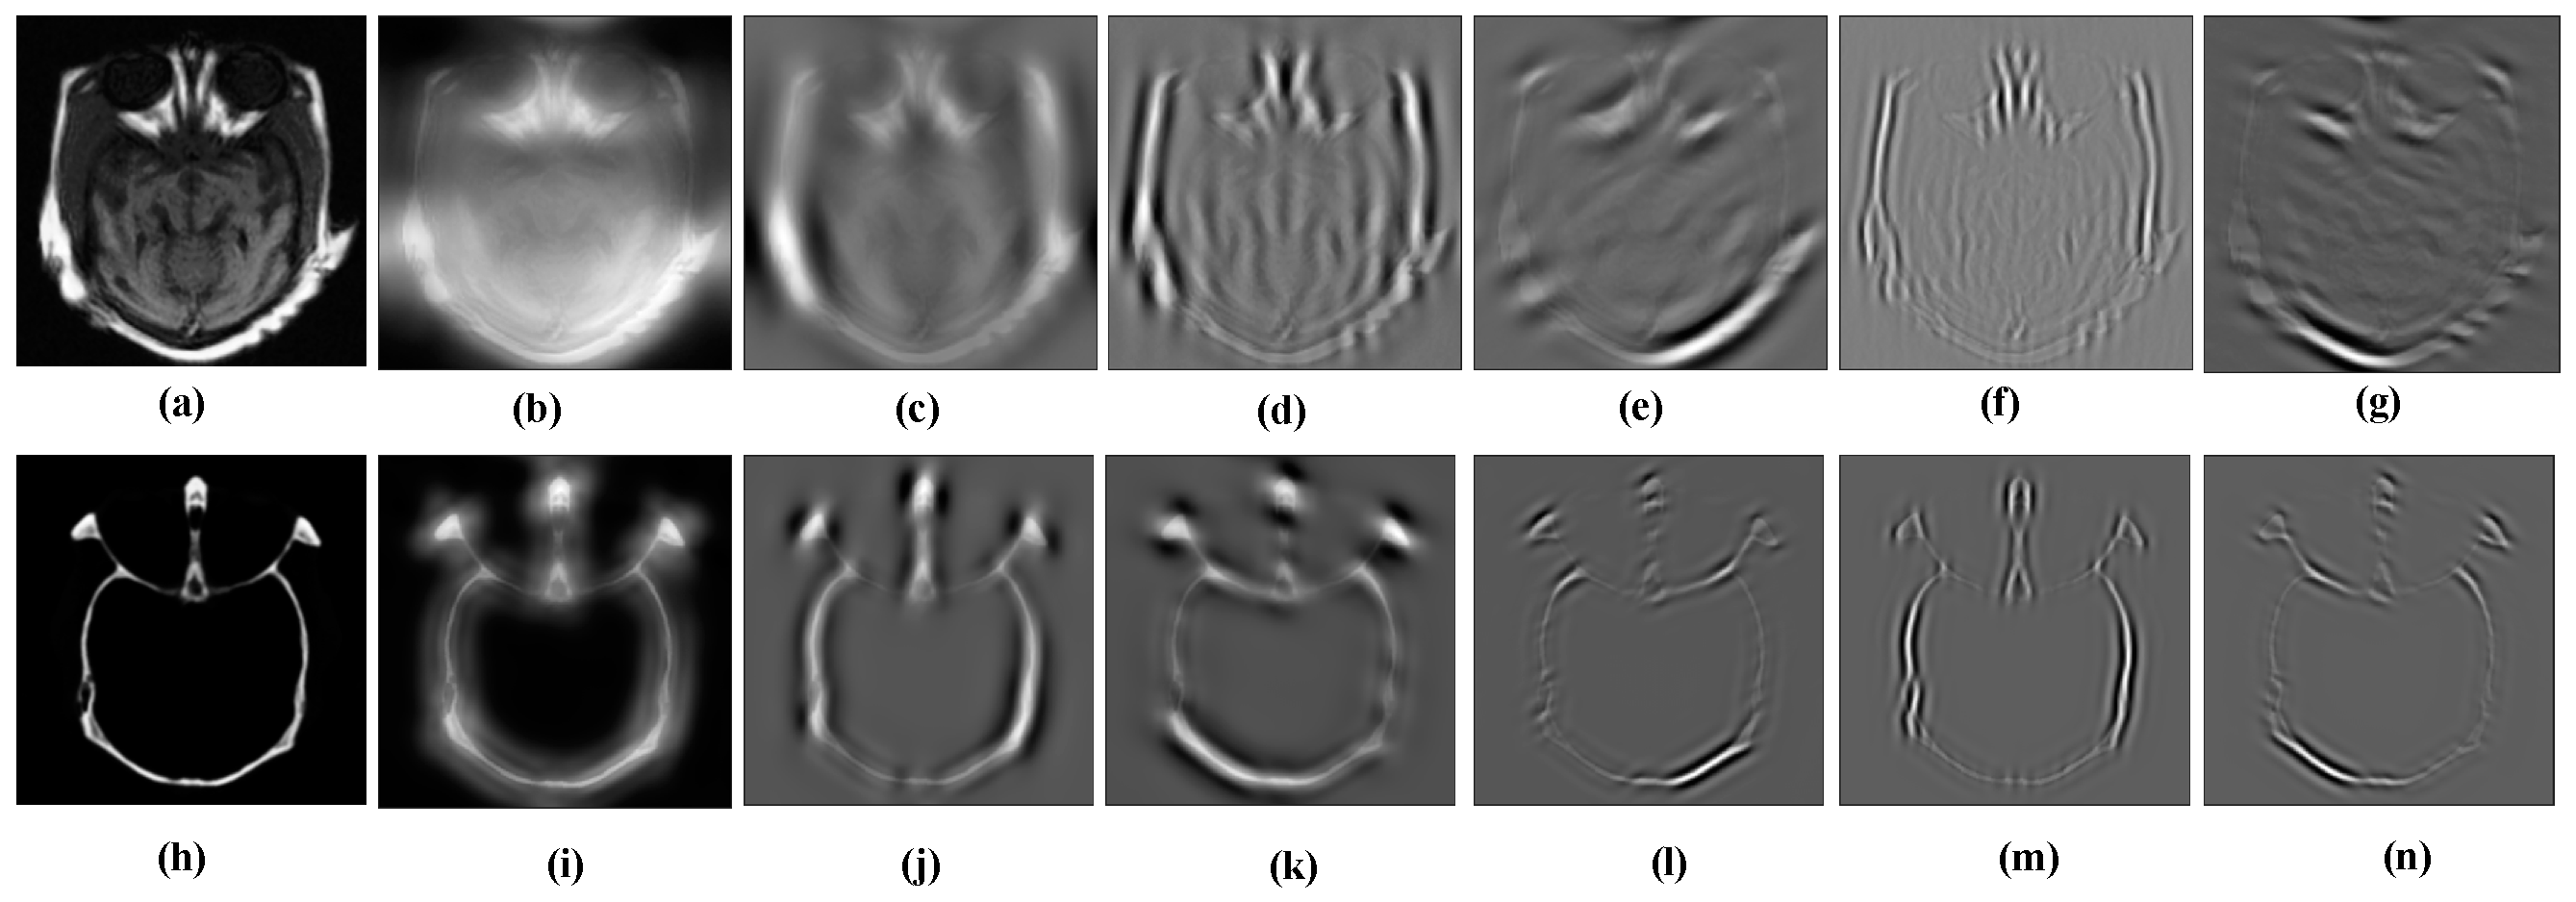
- VMD-based image decomposition;
- A fusion strategy depending on the LEM;
- Synthesizing the fused image.
| Algorithm 1 |
is evaluated using the following steps. . . |
| Algorithm 2 |
| Input: Image A (MRI), Image B (CT). Output: The fused image F. Step 1: Image decomposition using VMD: which are represented as using Equation (5). by Equation (6). with Equations (7) and (8). using Equation (9). Step 3: Reconstruct the fused image by summing all the fused sub-bands obtained from Step 2. |
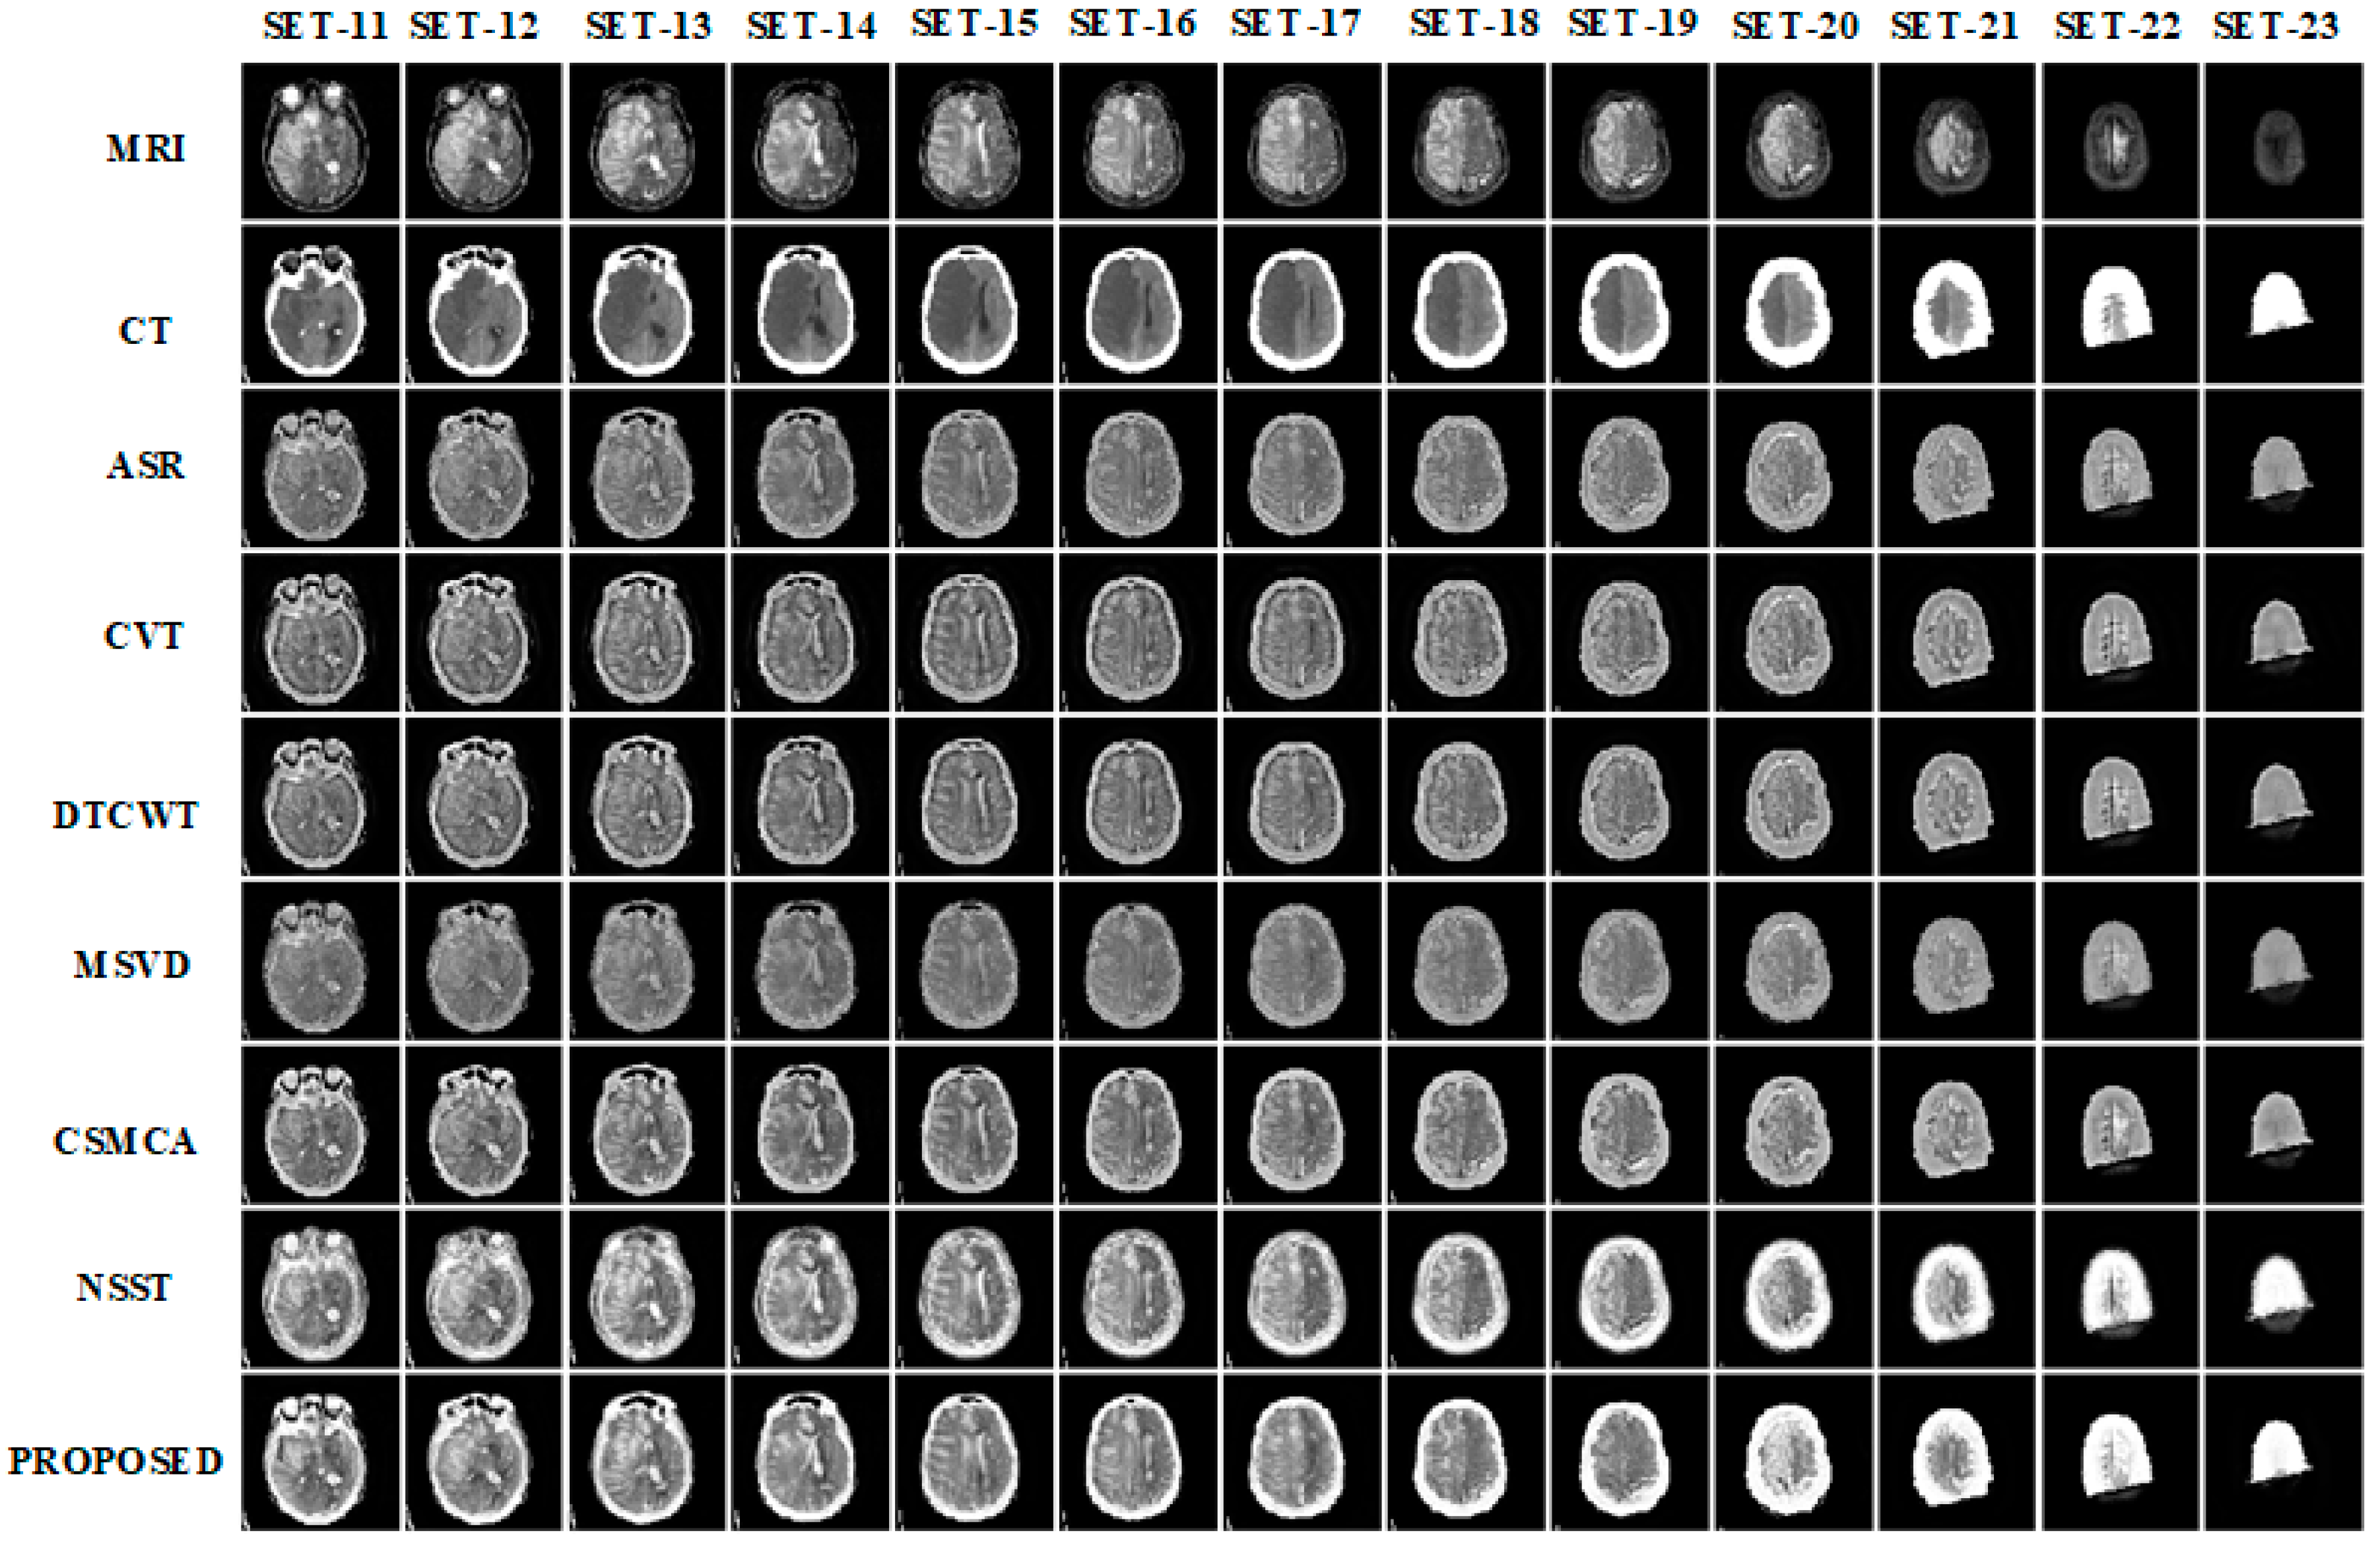
3. Results and Discussion
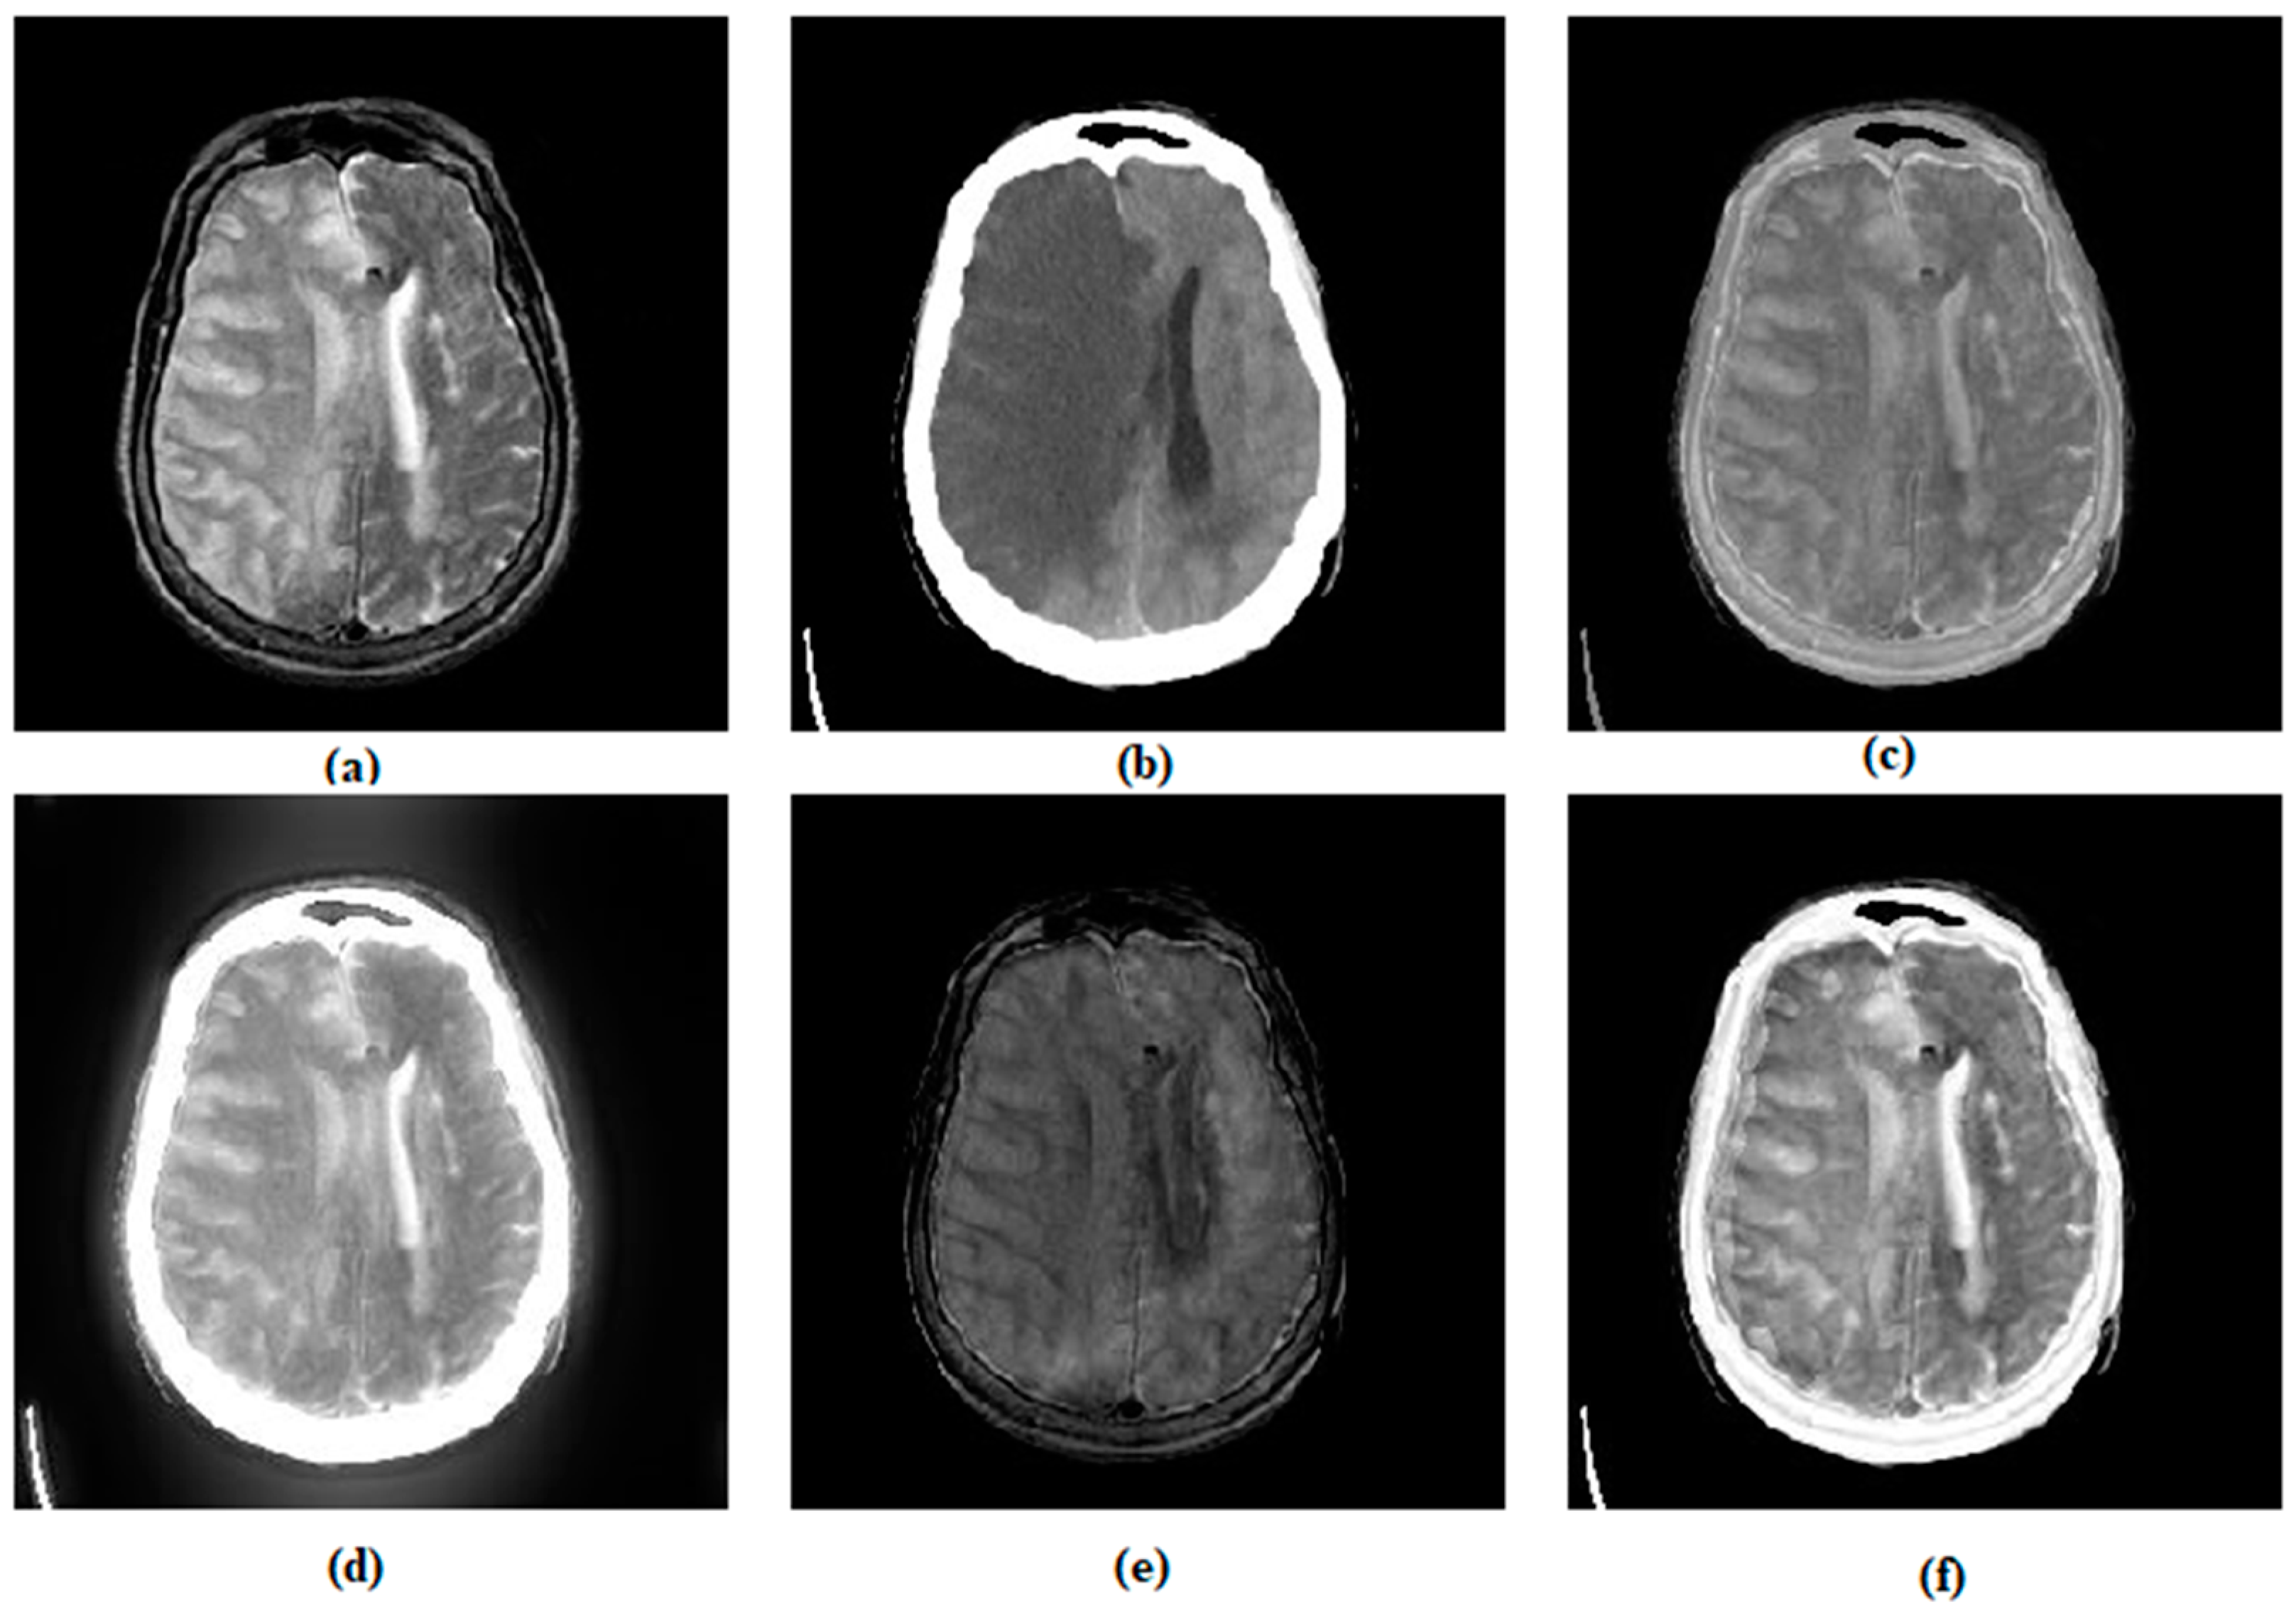
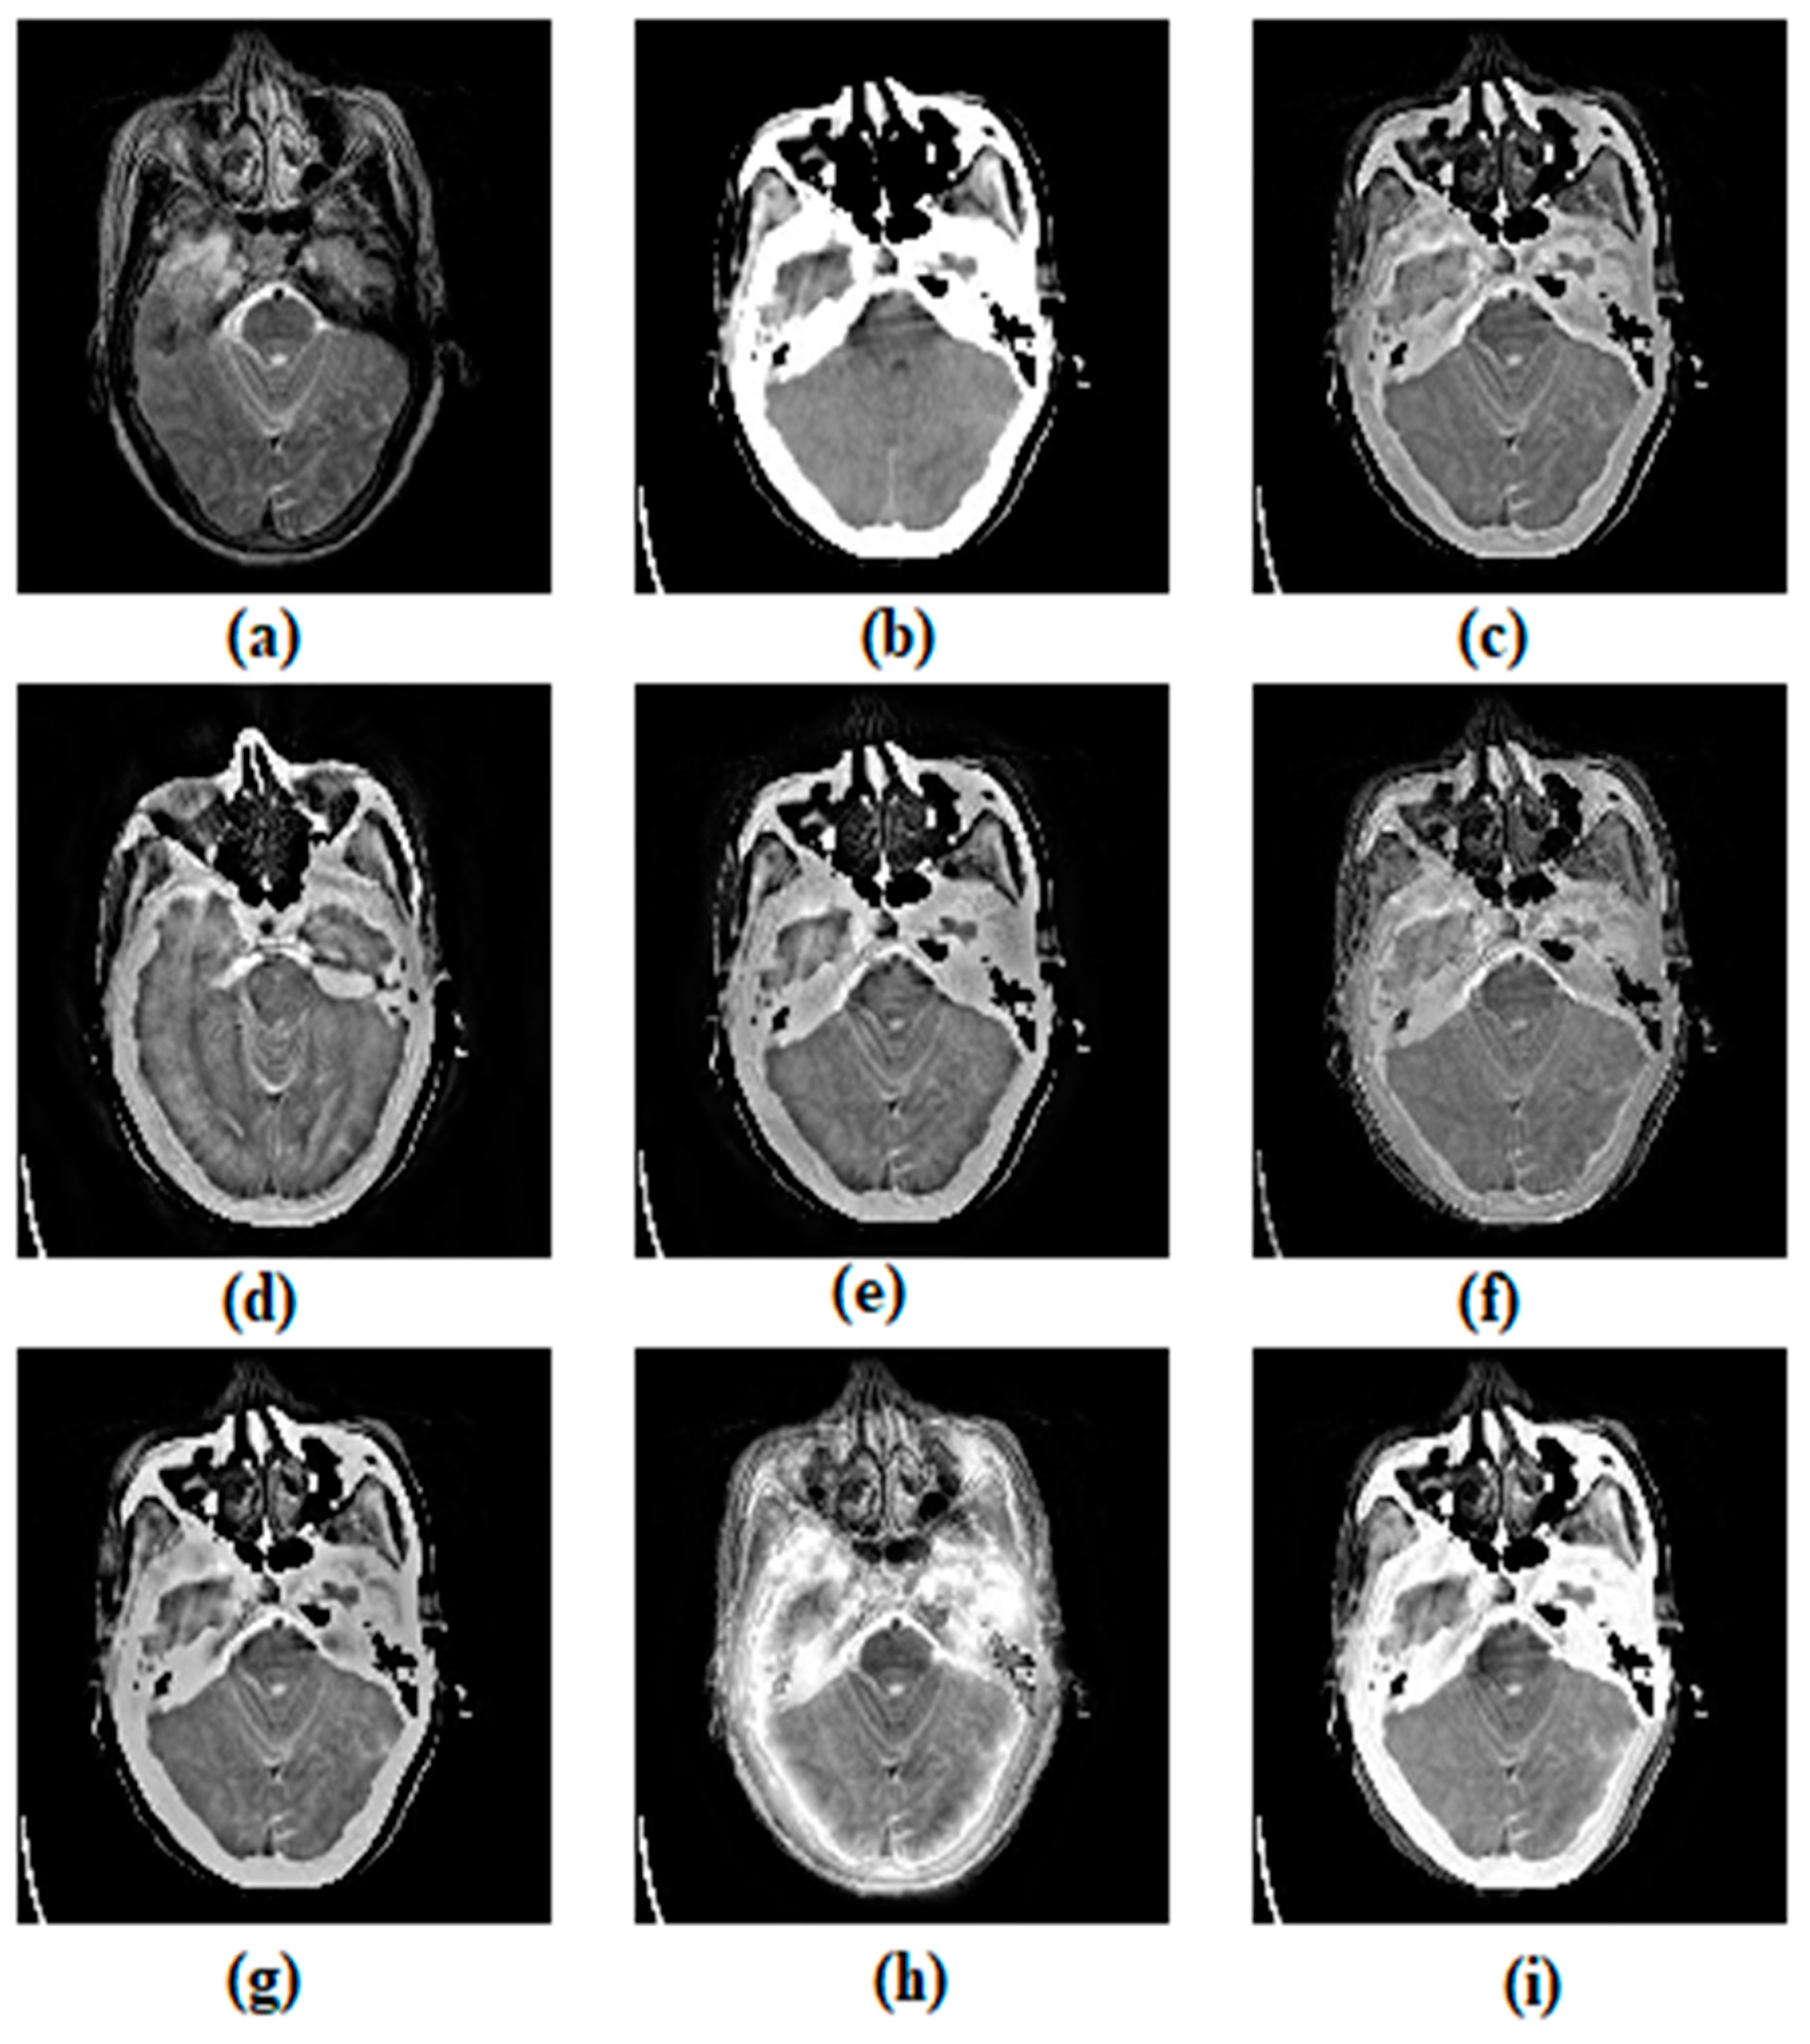
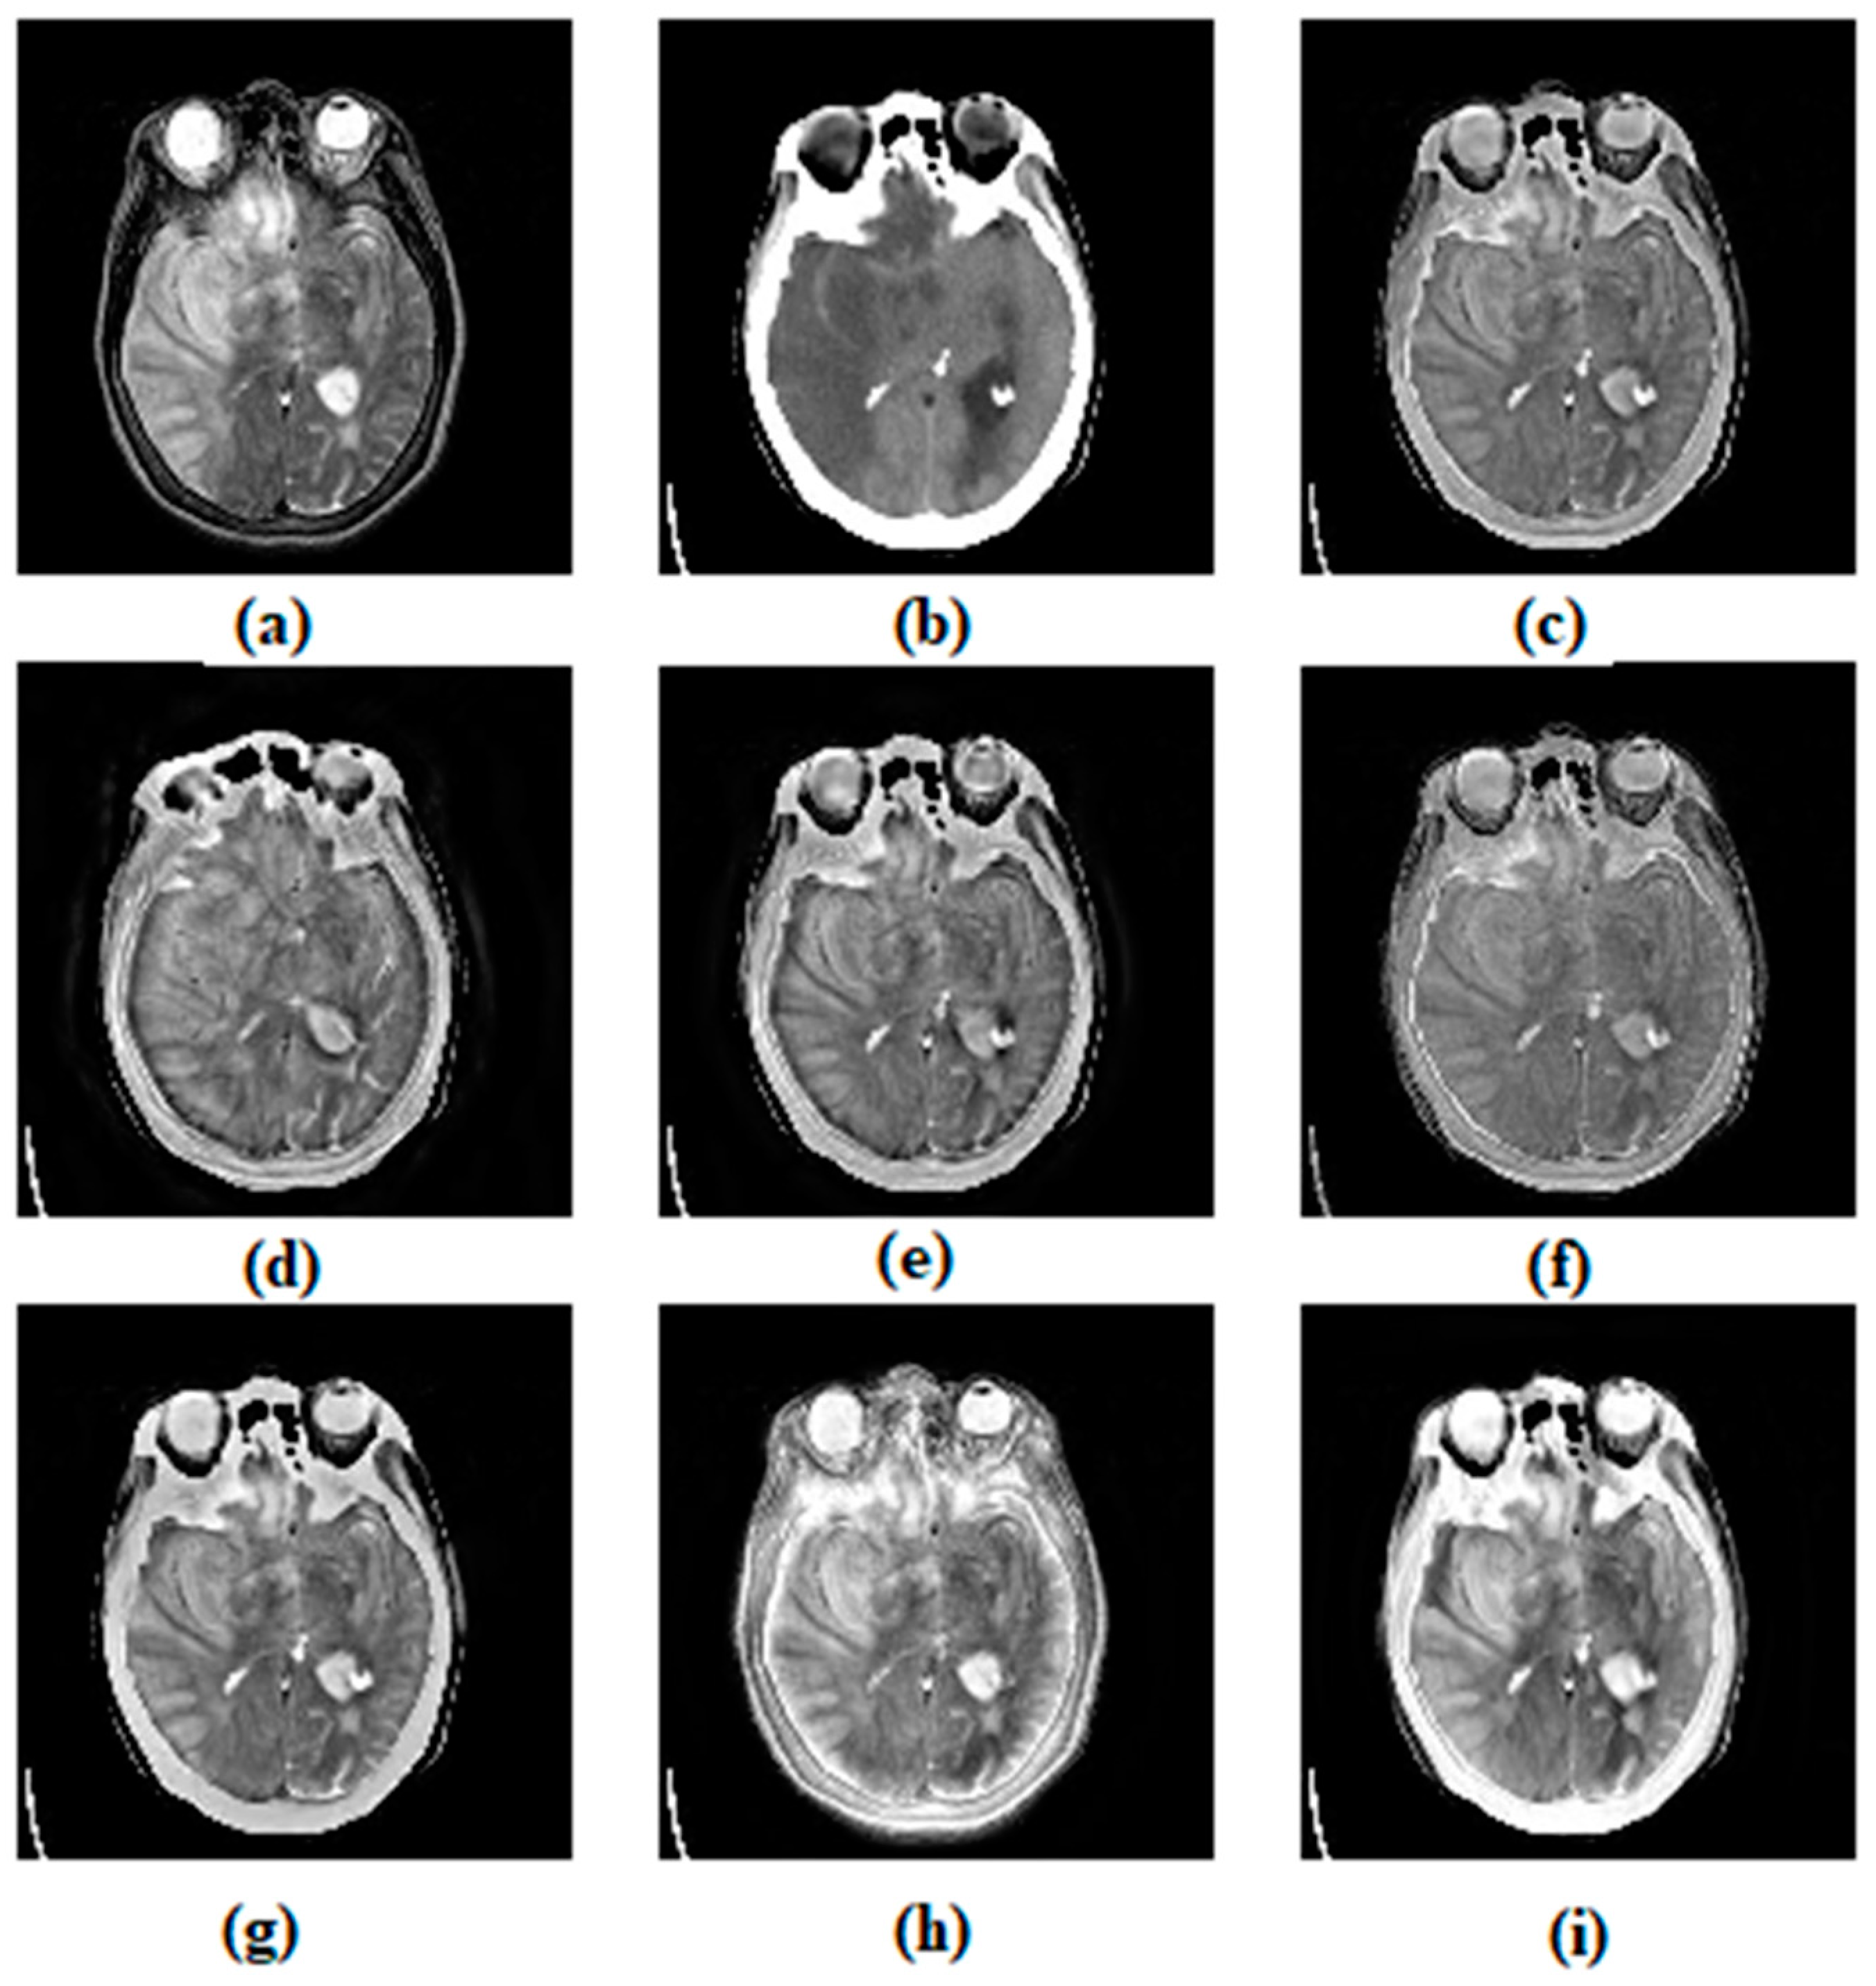
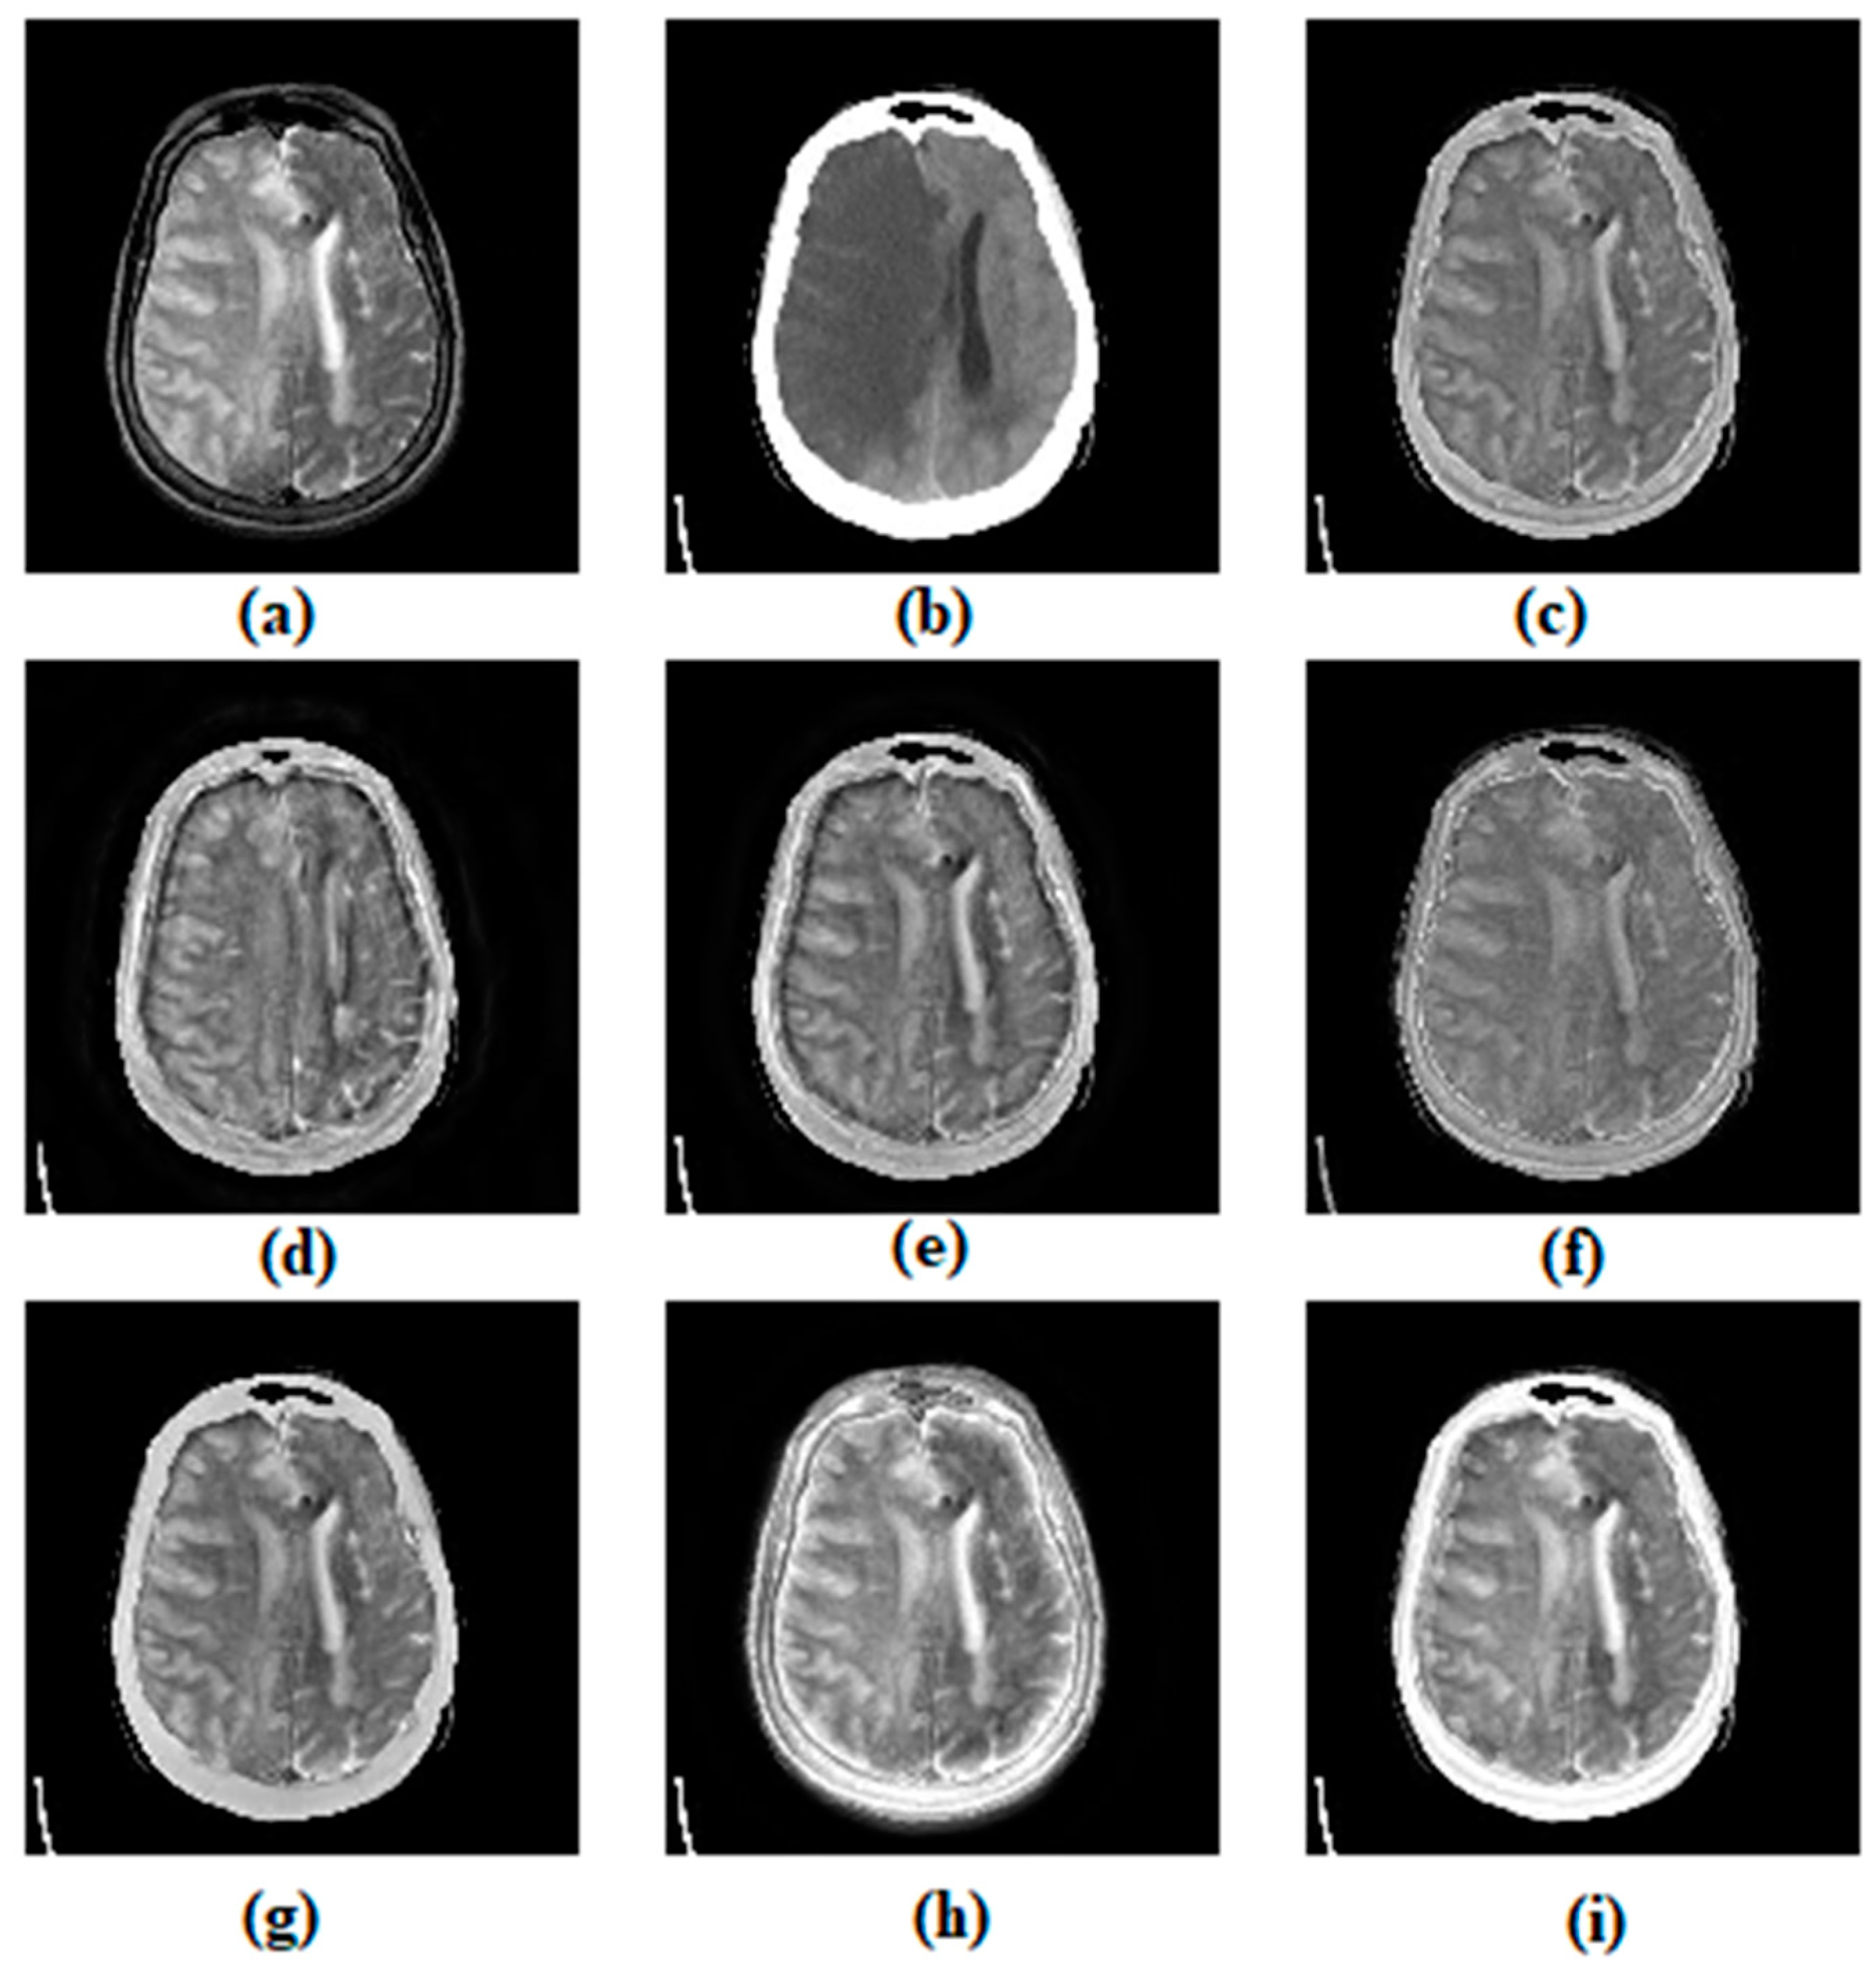
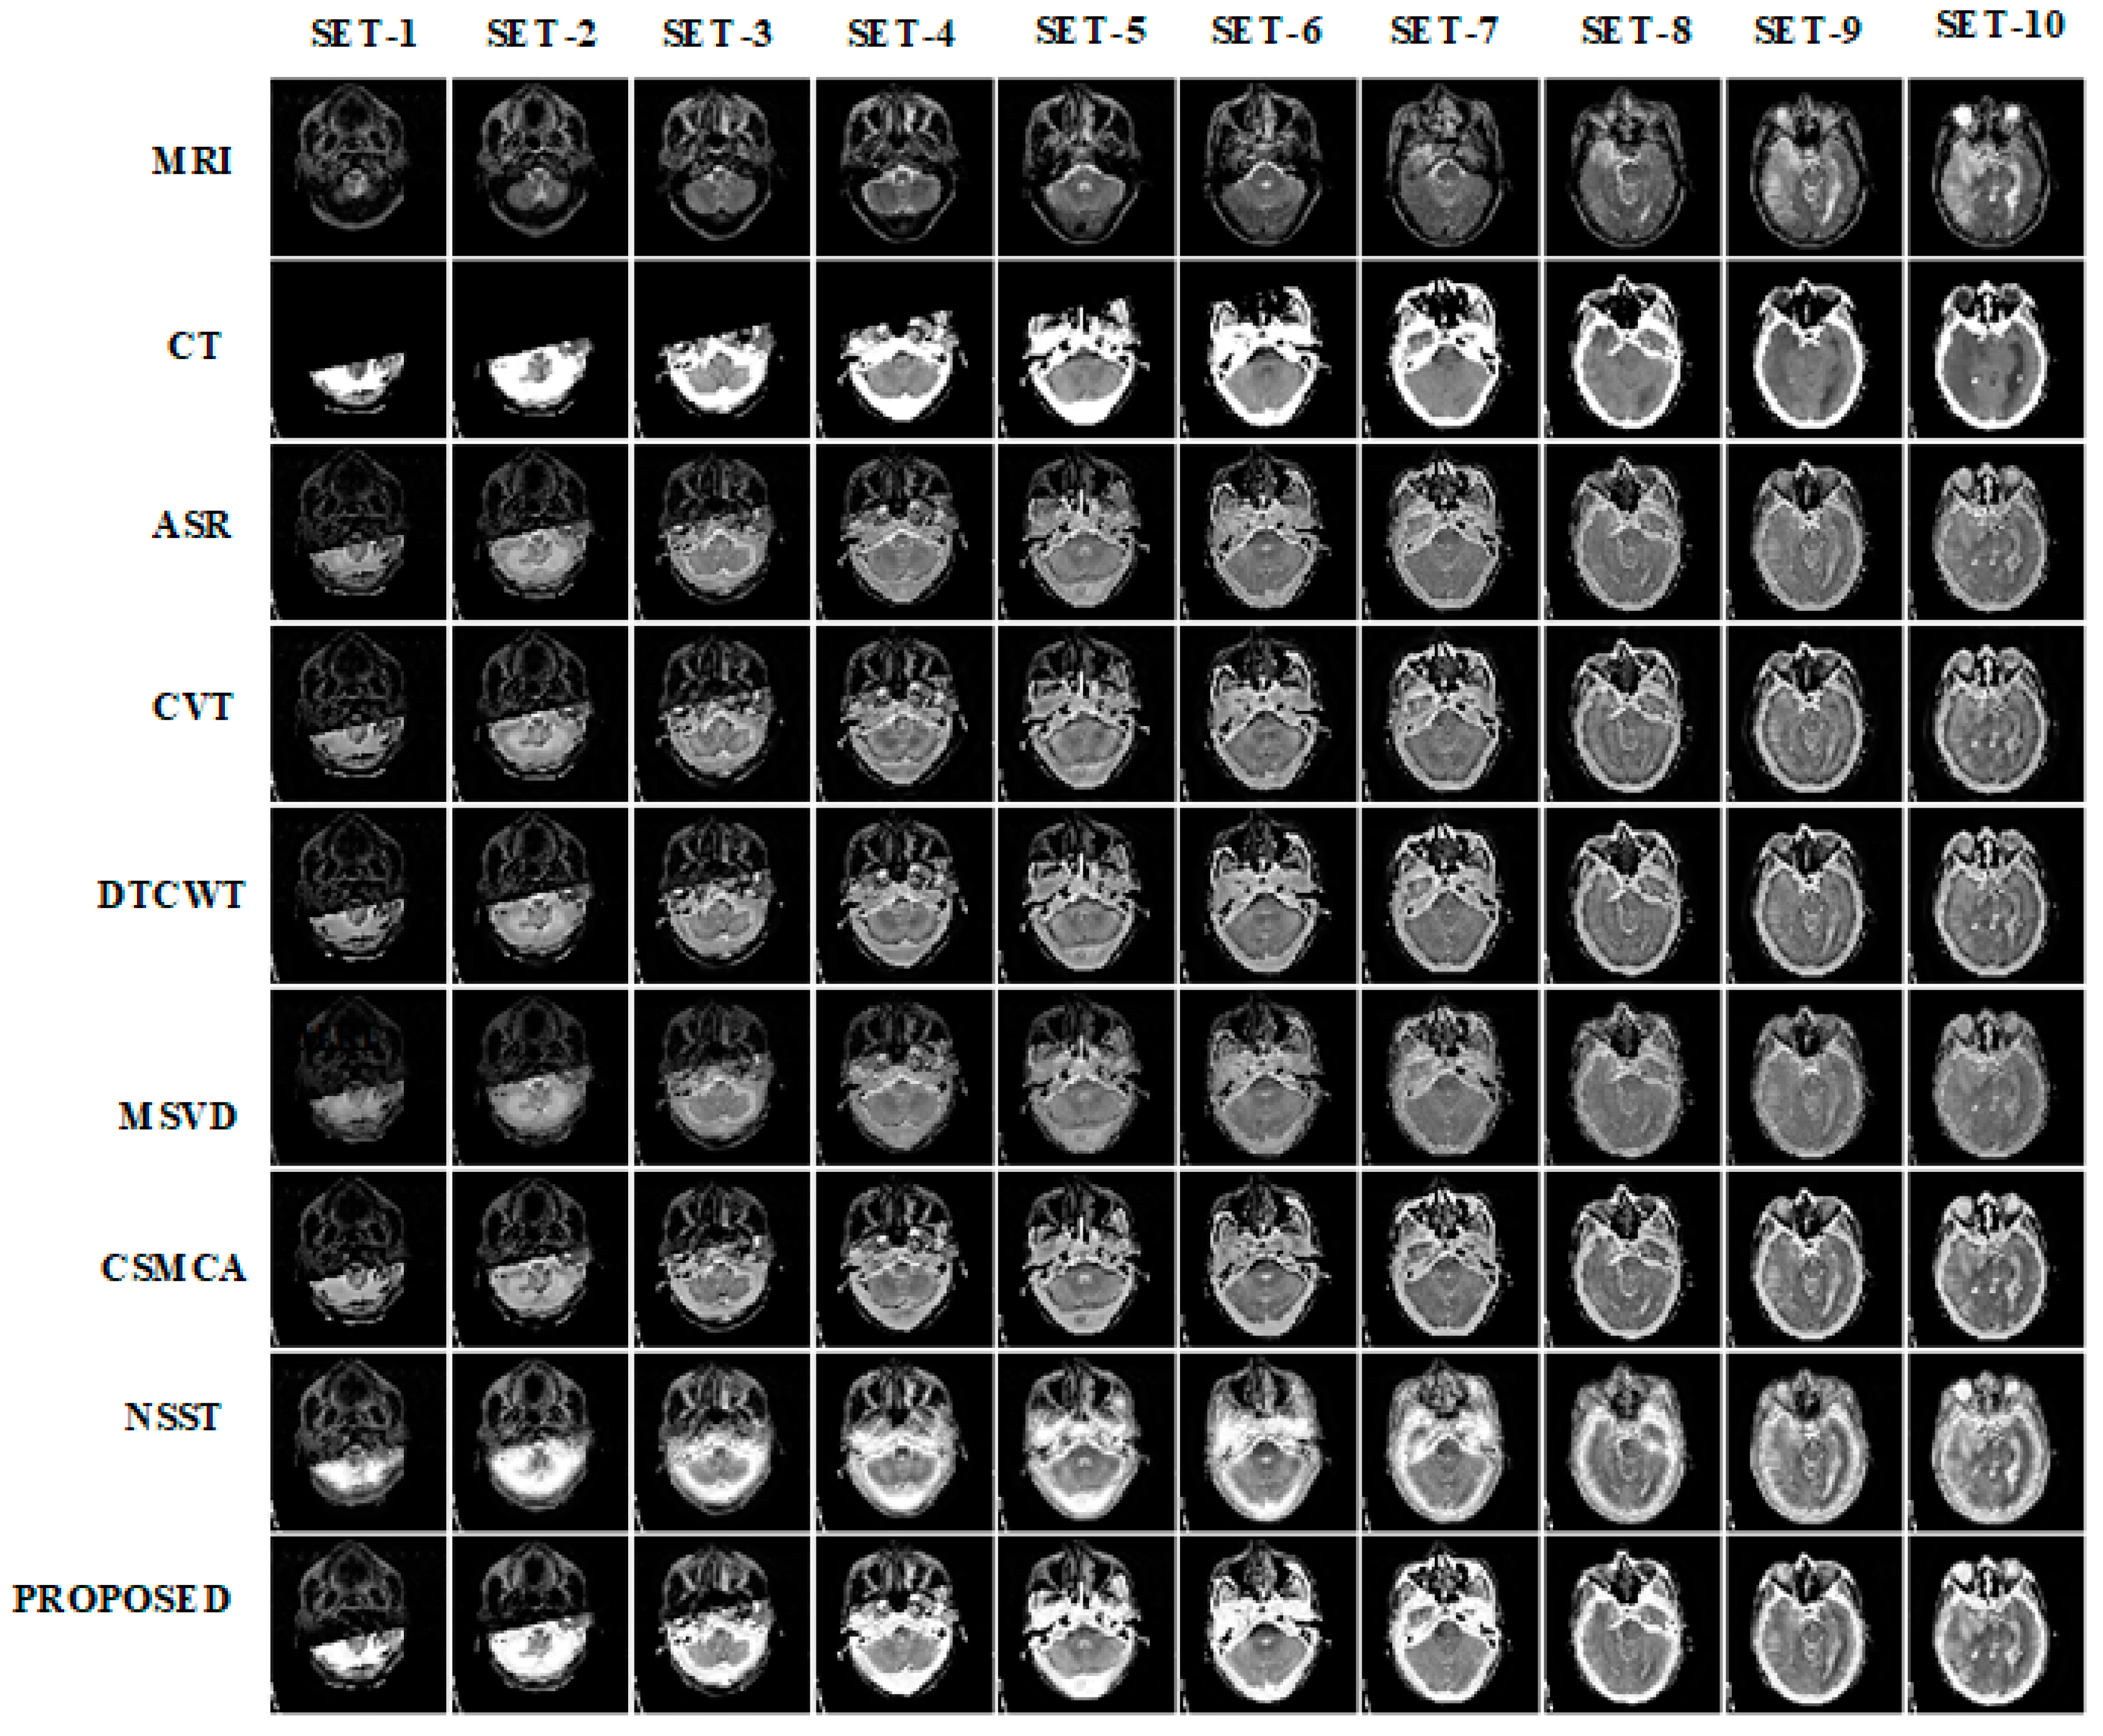
3.1. Subjective Assessment
3.2. Objective Assessment
4. Conclusions and Future Scope
Supplementary Materials
Author Contributions
Funding
Institutional Review Board Statement
Informed Consent Statement
Data Availability Statement
Conflicts of Interest
References
- Vishwakarma, A.; Bhuyan, M.K. Image Fusion Using Adjustable Non-subsampled Shearlet Transform. IEEE Trans. Instrum. Meas. 2018, 68, 3367–3378. [Google Scholar] [CrossRef]
- Ouahabi, A. A review of wavelet denoising in medical imaging. In Proceedings of the 2013 8th International Workshop on Systems, Signal Processing and their Applications (WoSSPA), Algiers, Algeria, 12–15 May 2013; IEEE: New York, NY, USA, 2013; pp. 19–26. [Google Scholar]
- Ahmed, S.; Messali, Z.; Ouahabi, A.; Trepout, S.; Messaoudi, C.; Marco, S. Nonparametric Denoising Methods Based on Contourlet Transform with Sharp Frequency Localization: Application to Low Exposure Time Electron Microscopy Images. Entropy 2015, 17, 3461–3478. [Google Scholar] [CrossRef] [Green Version]
- Unser, M. Texture classification and segmentation using wavelet frames. IEEE Trans. Image Process. 1995, 4, 1549–1560. [Google Scholar] [CrossRef] [Green Version]
- Meriem, D.; Abdeldjalil, O.; Hadj, B.; Adrian, B.; Denis, K. Discrete wavelet for multifractal texture classification: Application to medical ultrasound imaging. In Proceedings of the 2010 IEEE International Conference on Image Processing, Hong Kong, China, 26–29 September 2010; IEEE: New York, NY, USA, 2010; pp. 637–640. [Google Scholar]
- Hatt, C.R.; Jain, A.K.; Parthasarathy, V.; Lang, A.; Raval, A.N. MRI—3D ultrasound—X-ray image fusion with electromagnetic tracking for transendocardial therapeutic injections: In-vitro validation and in-vivo feasibility. Comput. Med. Imaging Graph. 2013, 37, 162–173. [Google Scholar] [CrossRef] [Green Version]
- Labat, V.; Remenieras, J.P.; BouMatar, O.; Ouahabi, A.; Patat, F. Harmonic propagation of finite amplitude sound beams: Experimental determination of the nonlinearity parameter B/A. Ultrasonics 2000, 38, 292–296. [Google Scholar] [CrossRef]
- Dasarathy, B.V. Medical image fusion: A survey of the state of the art. Inf. Fusion 2014, 19, 4–19. [Google Scholar] [CrossRef] [Green Version]
- Zhao, W.; Lu, H. Medical Image Fusion and Denoising with Alternating Sequential Filter and Adaptive Fractional Order Total Variation. IEEE Trans. Instrum. Meas. 2017, 66, 2283–2294. [Google Scholar] [CrossRef]
- El-Gamal, F.E.-Z.A.; Elmogy, M.; Atwan, A. Current trends in medical image registration and fusion. Egypt. Inf. J. 2016, 17, 99–124. [Google Scholar] [CrossRef] [Green Version]
- Li, S.; Kang, X.; Fang, L.; Hu, J.; Yin, H. Pixel-level image fusion: A survey of the state of the art. Inf. Fusion 2017, 33, 100–112. [Google Scholar] [CrossRef]
- Li, S.; Kwok, J.T.; Wang, Y. Multifocus image fusion using artificial neural networks. Pattern Recognit. Lett. 2002, 23, 985–997. [Google Scholar] [CrossRef]
- Li, S.; Kwok, J.-Y.; Tsang, I.-H.; Wang, Y. Fusing Images with Different Focuses Using Support Vector Machines. IEEE Trans. Neural Netw. 2004, 15, 1555–1561. [Google Scholar] [CrossRef]
- Vijayarajan, R.; Muttan, S. Iterative block level principal component averaging medical image fusion. Optik 2014, 125, 4751–4757. [Google Scholar] [CrossRef]
- Naidu, V.; Raol, J. Pixel-level Image Fusion using Wavelets and Principal Component Analysis. Def. Sci. J. 2008, 58, 338–352. [Google Scholar] [CrossRef]
- Singh, S.; Anand, R.S. Multimodal Medical Image Fusion Using Hybrid Layer Decomposition with CNN-Based Feature Mapping and Structural Clustering. IEEE Trans. Instrum. Meas. 2020, 69, 3855–3865. [Google Scholar] [CrossRef]
- Du, J.; Li, W.; Lu, K.; Xiao, B. An overview of multi-modal medical image fusion. Neurocomputing 2016, 215, 3–20. [Google Scholar] [CrossRef]
- Kappala, V.K.; Pradhan, J.; Turuk, A.K.; Silva, V.N.H.; Majhi, S.; Das, S.K. A Point-to-Multi-Point Tracking System for FSO Communication. IEEE Trans. Instrum. Meas. 2021, 70, 1–10. [Google Scholar] [CrossRef]
- Mitianoudis, N.; Stathaki, T. Pixel-based and region-based image fusion schemes using ICA bases. Inf. Fusion 2007, 8, 131–142. [Google Scholar] [CrossRef] [Green Version]
- Toet, A.; van Ruyven, L.J.; Valeton, J.M. Merging Thermal And Visual Images By A Contrast Pyramid. Opt. Eng. 1989, 28, 287789. [Google Scholar] [CrossRef]
- Toet, A. Image fusion by a ratio of low-pass pyramid. Pattern Recognit. Lett. 1989, 9, 245–253. [Google Scholar] [CrossRef]
- Li, X.; Guo, X.; Han, P.; Wang, X.; Li, H.; Luo, T. Laplacian Redecomposition for Multimodal Medical Image Fusion. IEEE Trans. Instrum. Meas. 2020, 69, 6880–6890. [Google Scholar] [CrossRef]
- Li, H.; Manjunath, B.S.; Mitra, S.K. Multisensor Image Fusion Using the Wavelet Transform. Graph. Model. Image Process. 1995, 57, 235–245. [Google Scholar] [CrossRef]
- Lewis, J.J.; O’Callaghan, R.J.; Nikolov, S.G.; Bull, D.R.; Canagarajah, N. Pixel- and region-based image fusion with complex wavelets. Inf. Fusion 2007, 8, 119–130. [Google Scholar] [CrossRef]
- Nencini, F.; Garzelli, A.; Baronti, S.; Alparone, L. Remote sensing image fusion using the curvelet transform. Inf. Fusion 2007, 8, 143–156. [Google Scholar] [CrossRef]
- Yang, L.; Guo, B.L.; Ni, W. Multimodality medical image fusion based on multiscale geometric analysis of contourlet transform. Neurocomputing 2008, 72, 203–211. [Google Scholar] [CrossRef]
- Miao, Q.; Shi, C.; Xu, P.; Yang, M.; Shi, Y. A novel algorithm of image fusion using shearlets. Opt. Commun. 2011, 284, 1540–1547. [Google Scholar] [CrossRef]
- Yin, M.; Liu, X.; Liu, Y.; Chen, X. Medical Image Fusion With Parameter-Adaptive Pulse Coupled-Neural Network in Nonsubsampled Shearlet Transform Domain. IEEE Trans. Instrum. Meas. 2018, 68, 49–64. [Google Scholar] [CrossRef]
- Kirankumar, Y.; Shenbaga Devi, S. Transform-based medical image fusion. Int. J. Biomed. Eng. Technol. 2007, 1, 101–110. [Google Scholar] [CrossRef]
- Naidu, V.P.S. Image Fusion Technique using Multi-resolution Singular Value Decomposition. Def. Sci. J. 2011, 61, 479. [Google Scholar] [CrossRef] [Green Version]
- Hermessi, H.; Mourali, O.; Zagrouba, E. Multimodal medical image fusion review: Theoretical background and recent advances. Signal Process. 2021, 183, 108036. [Google Scholar] [CrossRef]
- Wan, H.; Tang, X.; Zhu, Z.; Xiao, B.; Li, W. Multi-Focus Color Image Fusion Based on Quaternion Multi-Scale Singular Value Decomposition. Front. Neurorobot. 2021, 15, 76. [Google Scholar] [CrossRef]
- Singh, S.; Anand, R.S. Multimodal Medical Image Sensor Fusion Model Using Sparse K-SVD Dictionary Learning in Nonsubsampled Shearlet Domain. IEEE Trans. Instrum. Meas. 2020, 69, 593–607. [Google Scholar] [CrossRef]
- Liu, Y.; Chen, X.; Ward, R.K.; Wang, Z.J. Medical Image Fusion via Convolutional Sparsity Based Morphological Component Analysis. IEEE Signal Process. Lett. 2019, 26, 485–489. [Google Scholar] [CrossRef]
- Maqsood, S.; Javed, U. Multi-modal Medical Image Fusion based on Two-scale Image Decomposition and Sparse Representation. Biomed. Signal Process. Control 2020, 57, 101810. [Google Scholar] [CrossRef]
- Pankaj, D.; Sachin Kumar, S.; Mohan, N.; Soman, K.P. Image Fusion using Variational Mode Decomposition. Indian J. Sci. Technol. 2016, 9, 1–8. [Google Scholar] [CrossRef]
- Vishnu Pradeep, V.; Sowmya, V.; Soman, K. Variational mode decomposition based multispectral and panchromatic image fusion. IJCTA 2016, 9, 8051–8059. [Google Scholar]
- Pajares, G.; de la Cruz, J.M. A wavelet-based image fusion tutorial. Pattern Recognit. 2004, 37, 1855–1872. [Google Scholar] [CrossRef]
- Ouahabi, A. Signal and Image Multiresolution Analysis; John Wiley & Sons: Hoboken, NJ, USA, 2012; ISBN 1118568664. [Google Scholar]
- Nunes, J.; Bouaoune, Y.; Delechelle, E.; Niang, O.; Bunel, P. Image analysis by bidimensional empirical mode decomposition. Image Vis. Comput. 2003, 21, 1019–1026. [Google Scholar] [CrossRef]
- Gilles, J. Empirical Wavelet Transform. IEEE Trans. Signal Process. 2013, 61, 3999–4010. [Google Scholar] [CrossRef]
- Dragomiretskiy, K.; Zosso, D. Variational Mode Decomposition. IEEE Trans. Signal Process. 2013, 62, 531–544. [Google Scholar] [CrossRef]
- Lahmiri, S.; Boukadoum, M. Biomedical image denoising using variational mode decomposition. In Proceedings of the 2014 IEEE Biomedical Circuits and Systems Conference (BioCAS), Lausanne, Switzerland, 22–24 October 2014; pp. 340–343. [Google Scholar] [CrossRef]
- Lahmiri, S. Denoising techniques in adaptive multi-resolution domains with applications to biomedical images. Health Technol. Lett. 2017, 4, 25–29. [Google Scholar] [CrossRef]
- Maheshwari, S.; Pachori, R.B.; Kanhangad, V.; Bhandary, S.V.; Acharya, U.R. Iterative variational mode decomposition based automated detection of glaucoma using fundus images. Comput. Biol. Med. 2017, 88, 142–149. [Google Scholar] [CrossRef]
- Konstantin, D.; Zosso, D. Two-dimensional variational mode decomposition. In Proceedings of the International Workshop on Energy Minimization Methods in Computer Vision and Pattern Recognition, Hong Kong, China, 13–16 January 2015; Springer: Berlin/Heidelberg, Germany, 2015; pp. 197–208. [Google Scholar]
- Polinati, S.; Dhuli, R. A review on multi-model medical image fusion. In Proceedings of the International Conference on Signal Processing, Communications and Computing (ICSPCC 2019), Liaoning, China, 20–22 September 2019; ICCSP: Tamilnadu, India, 2019. [Google Scholar]
- Du, J.; Li, W.; Xiao, B. Anatomical-Functional Image Fusion by Information of Interest in Local Laplacian Filtering Domain. IEEE Trans. Image Process. 2017, 26, 5855–5866. [Google Scholar] [CrossRef]
- Wang, Y.; Du, H.; Xu, J.; Liu, Y. A no-reference perceptual blur metric based on complex edge analysis. In Proceedings of the 2012 3rd IEEE International Conference on Network Infrastructure and Digital Content, Beijing, China, 21–23 September 2012; IEEE: New York, NY, USA, 2012; pp. 487–491. [Google Scholar]
- Hossny, M.; Nahavandi, S.; Creighton, D. Comments on ‘Information measure for performance of image fusion’. Electron. Lett. 2008, 44, 2–4. [Google Scholar] [CrossRef] [Green Version]
- Sheikh, H.R.; Bovik, A.C. Image information and visual quality. IEEE Trans. Image Process. 2006, 15, 430–444. [Google Scholar] [CrossRef] [PubMed]
- Ferroukhi, M.; Ouahabi, A.; Attari, M.; Habchi, Y.; Taleb-Ahmed, A. Medical Video Coding Based on 2nd-Generation Wavelets: Performance Evaluation. Electronics 2019, 8, 88. [Google Scholar] [CrossRef] [Green Version]
- Xydeas, C.S.; Petrović, V. Objective image fusion performance measure. Electron. Lett. 2000, 36, 308. [Google Scholar] [CrossRef] [Green Version]
- Wang, Z.; Bovik, A.C.; Sheikh, H.R.; Simoncelli, E.P. Image quality assessment: From error visibility to structural similarity. IEEE Trans. Image Process. 2004, 13, 600–612. [Google Scholar] [CrossRef] [Green Version]
- Singh, R.; Khare, A. Multiscale medical image fusion in wavelet domain. Sci. World J. 2013. [Google Scholar] [CrossRef]
- Oliveira, F.P.M.; Tavares, J.M.R.S. Medical image registration: A review. Comput. Methods Biomech. Biomed. Engin. 2014, 17, 73–93. [Google Scholar] [CrossRef] [PubMed]


| Image Fusion Types | Fusion Methods | Advantages | Drawbacks | |
|---|---|---|---|---|
| Spatial domain | Average, minimum, maximum, morphological operators [11], Principal Component Analysis (PCA) [14], Independent Component Analysis (ICA) [29] | Easy to implement. Computationally efficient | Reduces the contrast, produces brightness or color distortions. May give desirable results for a few fusion datasets. | |
| Transform domain | Pyramidal methods | Contrast Pyramid [30], Ratio of the low-pass pyramid [31], Laplacian [19] | Provides spectral information | May produce artifacts around edges. Suffer from blocking artifacts |
| Wavelet transform | Discrete wavelet transform (DWT) [15], Shift invariant discrete wavelet transform (SIDWT) [32], Dual-tree complex wavelet transform (DcxDWT) [20] | Provides directional information | May produce artifacts around edges because of shift variant nature. Computationally expensive and demands large memory. | |
| Multiscale geometric analysis (MGA) | Curvelet [24], Contourlet [33], Shearlet [34], Nonsubsampled Shearlet transform (NSST) [28] | Provides the edges and texture region | Loss in texture parts, high memory requirement, demands high run time. | |
| Metrics | Methods | |||
|---|---|---|---|---|
| VMD-AVG | VMD-MAX | VMD-MIN | VMD-LEM | |
| EI | 48.439 | 58.322 | 36.487 | 71.751 |
| MI | 4.384 | 4.376 | 3.486 | 4.391 |
| VIFF | 0.335 | 0.397 | 0.063 | 0.428 |
| 0.307 | 0.356 | 0.198 | 0.443 | |
| SSIM | 0.599 | 0.232 | 0.563 | 0.621 |
| AG | 4.845 | 5.714 | 3.735 | 6.973 |
| RMSE | 0.0296 | 0.005 | 0.036 | 0.020 |
| PSNR | 15.926 | 14.553 | 15.869 | 18.580 |
| Metrics | Methods | ||||||
|---|---|---|---|---|---|---|---|
| ASR | CVT | DTCWT | MSVD | CSMCA | NSST | Proposed Method | |
| EI | 85.184 | 91.417 (1) | 88.853 | 77.183 | 87.219 | 81.907 | 90.390 (2) |
| MI | 3.948 (2) | 3.548 | 3.656 | 3.490 | 3.811 | 3.703 | 4.079 (1) |
| VIFF | 0.321 | 0.290 | 0.280 | 0.344 (2) | 0.319 | 0.267 | 0.406 (1) |
| 0.535 | 0.478 | 0.500 | 0.427 | 0.536 (2) | 0.373 | 0.538 (1) | |
| SSIM | 0.563 | 0.376 | 0.499 | 0.548 | 0.629 (2) | 0.520 | 0.697 (1) |
| AG | 8.561 | 9.140 (1) | 8.933 | 8.332 | 8.674 | 8.368 | 9.008 (2) |
| RMSE | 0.034 | 0.034 | 0.034 | 0.034 | 0.035 | 0.027 (2) | 0.020 |
| PSNR | 16.328 | 16.749 | 17.166 | 13.28 | 17.393 (2) | 13.976 | 21.342 (1) |
| Metrics | Methods | ||||||
|---|---|---|---|---|---|---|---|
| ASR | CVT | DTCWT | MSVD | CSMCA | NSST | Proposed Method | |
| EI | 67.026 | 79.944 (2) | 75.086 | 64.169 | 70.435 | 75.318 | 80.087 (1) |
| MI | 4.279 | 3.904 | 4.030 | 4.227 | 4.346 (1) | 4.116 | 4.339 (2) |
| VIFF | 0.272 | 0.254 | 0.249 | 0.286 | 0.297 (2) | 0.241 | 0.356 (1) |
| 0.472 | 0.421 | 0.435 | 0.392 | 0.481 (1) | 0.421 | 0.480 (2) | |
| SSIM | 0.593 | 0.276 | 0.413 | 0.301 | 0.537 | 0.600 (1) | 0.599 (2) |
| AG | 6.662 | 7.887 (2) | 7.421 | 6.812 | 6.877 | 7.471 | 7.980 (1) |
| RMSE | 0.029 | 0.029 | 0.029 | 0.028 | 0.029 | 0.024 (2) | 0.021 (1) |
| PSNR | 16.857 | 17.171 | 17.720 | 15.804 | 17.892 (1) | 13.981 | 17.794 (2) |
| Metrics | Methods | ||||||
|---|---|---|---|---|---|---|---|
| ASR | CVT | DTCWT | MSVD | CSMCA | NSST | Proposed Method | |
| EI | 51.347 | 63.877 | 58.355 | 49.732 | 51.899 | 65.474 (2) | 65.802 (1) |
| MI | 4.186 | 3.878 | 3.995 | 4.090 | 4.284 (2) | 4.214 | 4.549 (1) |
| VIFF | 0.356 | 0.362 | 0.365 | 0.348 | 0.412 (2) | 0.340 | 0.484 (1) |
| 0.465 (2) | 0.418 | 0.431 | 0.380 | 0.461 | 0.446 | 0.478 (1) | |
| SSIM | 0.674 (2) | 0.338 | 0.507 | 0.417 | 0.663 | 0.590 | 0.694 (1) |
| AG | 5.065 | 6.231 | 5.719 | 5.197 | 5.045 | 6.349 (1) | 6.326 (2) |
| RMSE | 0.028 | 0.029 | 0.029 | 0.026 | 0.028 | 0.022 (2) | 0.018 (1) |
| PSNR | 17.396 | 17.268 | 17.649 | 16.392 | 18.644 (1) | 14.096 | 18.024 (2) |
| Metrics | Methods | ||||||
|---|---|---|---|---|---|---|---|
| ASR | CVT | DTCWT | MSVD | CSMCA | NSST | Proposed Method | |
| EI | 57.800 | 64.531 | 61.820 | 50.850 | 58.592 | 62.404 | 64.582 |
| MI | 3.666 | 3.360 | 3.446 | 3.694 | 3.657 | 3.740 | 3.830 |
| VIFF | 0.376 | 0.362 | 0.358 | 0.365 | 0.401 | 0.364 | 0.498 |
| 0.541 | 0.483 | 0.500 | 0.399 | 0.531 | 0.439 | 0.542 | |
| SSIM | 0.651 | 0.350 | 0.503 | 0.614 | 0.634 | 0.586 | 0.657 |
| RMSE | 0.029 | 0.029 | 0.029 | 0.029 | 0.029 | 0.022 | 0.020 |
| AG | 5.772 | 6.390 | 6.148 | 5.427 | 5.771 | 6.217 | 6.412 |
| PSNR | 16.803 | 16.972 | 17.242 | 16.000 | 17.757 | 16.021 | 20.291 |
Publisher’s Note: MDPI stays neutral with regard to jurisdictional claims in published maps and institutional affiliations. |
© 2021 by the authors. Licensee MDPI, Basel, Switzerland. This article is an open access article distributed under the terms and conditions of the Creative Commons Attribution (CC BY) license (https://creativecommons.org/licenses/by/4.0/).
Share and Cite
Polinati, S.; Bavirisetti, D.P.; Rajesh, K.N.V.P.S.; Naik, G.R.; Dhuli, R. The Fusion of MRI and CT Medical Images Using Variational Mode Decomposition. Appl. Sci. 2021, 11, 10975. https://0-doi-org.brum.beds.ac.uk/10.3390/app112210975
Polinati S, Bavirisetti DP, Rajesh KNVPS, Naik GR, Dhuli R. The Fusion of MRI and CT Medical Images Using Variational Mode Decomposition. Applied Sciences. 2021; 11(22):10975. https://0-doi-org.brum.beds.ac.uk/10.3390/app112210975
Chicago/Turabian StylePolinati, Srinivasu, Durga Prasad Bavirisetti, Kandala N V P S Rajesh, Ganesh R Naik, and Ravindra Dhuli. 2021. "The Fusion of MRI and CT Medical Images Using Variational Mode Decomposition" Applied Sciences 11, no. 22: 10975. https://0-doi-org.brum.beds.ac.uk/10.3390/app112210975