Article

Assessment of Antioxidant Capacity and Phytochemical Composition of Brown and Red Seaweeds Sampled off Red Sea Coast

by
Abla A. M. Farghl
1,
Zaki M. Al-Hasawi
2 and
Mostafa M. El-Sheekh
3,*
1
Botany and Microbiology Department, Faculty of Science, South Valley University, Qena 83523, Egypt
2
Biological Sciences Department, Faculty of Science, King Abdulaziz University, P.O. Box 80203, Jeddah 21589, Saudi Arabia
3
Botany Department, Faculty of Science, Tanta University, Tanta 31527, Egypt
*
Author to whom correspondence should be addressed.
Submission received: 26 September 2021 / Revised: 10 November 2021 / Accepted: 16 November 2021 / Published: 23 November 2021
(This article belongs to the Section Food Science and Technology)

Abstract

:
Seaweeds are becoming a viable source of biologically active composites with a hopeful application as nutraceuticals, functional food components, and medicinal agents. In the present study, the antioxidant capacity and biochemical compositions of four seaweeds; Polycladia indica and Turbinaria ornata (Phaeophyceae) and Laurencia obtusa and Sarconema scinaioides (Rhodophyceae), were estimated. The results indicated that T. ornata showed the maximum value of total phenolic compound (TPC), flavonoid content, β-carotene, carbohydrate and has maximum percentage of DPPH radical scavenging capacity, total antioxidant capacity (TAC), and total reducing capacity (TRC) (72.48%, 15.02%, and 53.24% inhibition, respectively), while the highest contents of ascorbic acid, lipid, calcium, and zinc were observed in L. obtusa. P. indica showed the highest protein contents, dietary fibers, sodium, potassium, magnesium, and total amino acids. Glutamic, aspartic, proline, and methionine were the most frequent amino acids in the four selected seaweeds. Brown seaweeds (T. ornata and P. indica) attained the highest percent of the total polyunsaturated (ω6 and ω3) essential fatty acids. The biochemical content of these seaweed species, as well as their antioxidant properties, make them interesting candidates for nutritional, pharmacological, and therapeutic applications.

1. Introduction

Seaweeds are multicellular macroscopic algae that grow in the sea and are a renewable resource. They are non-vascular plants that serve as primary producers in the ocean. Depending on their chemical composition and thallus pigmentation, they are classified into three major groups: brown (Phaeophyceae), red (Rhodophyceae), or green algae (Chlorophyceae) [1]. The biochemical makeup of seaweeds, which includes proteins, carbohydrates, lipids, and ash content, determines their nutritional characteristics in general [2]. These seaweeds are nutritious because they are low in calories but high in vitamins, minerals, and dietary fibers. The seaweed proteins are highly variable (10–47% DW), with high proportions of essential amino acids, around 50% carbohydrates, and 1–3% lipids [3]. Valentina et al. [4] proposed that about 5% of green algae, 33% red algae, and 66.5% of brown algae were nutritionally consumed in daily diets in many countries, such as Japan, China, and Korea.
The composition of nutrients in seaweed varies based on species, habitats, age, and environmental conditions that stimulate or prevent the creation of several nutrients [5].
The lipid composition of seaweeds has aroused the interest of researchers due to the high concentration of polyunsaturated fatty acids (PUFA), particularly C18:3n-3, C18:4n-3, C20:4n-6, C20:5n-3, and C22:6n-3 acids. The antibacterial, antiviral, anti-inflammatory, and anticancer properties of seaweed fatty acids have been discovered to play a significant role in the prevention of cardiovascular disease, osteoarthritis, and diabetes [6]. Furthermore, macroalgae contain most macroelements and trace elements required for human nutrition and development [7]. These elements are necessary for biological processes such as growth, reproduction, hormone metabolism, and antioxidant defense.
Vitamins found in seaweed are important not only for their biochemical functions and antioxidant activity but also for other health benefits such as lowering blood pressure (vitamin C), preventing cardiovascular disease (β-carotene), and lowering cancer risk (vitamins E, C, and carotenoids) [8].
Antioxidant activity refers to the ability of a molecule compound to suppress or avoid the oxidation of a substrate at low doses [9]. The oxidation process in materials for animal and human use and cosmetic preparations can destroy the product. The use of antioxidants aims to prevent oxidation so that these foods and cosmetics do not cause poisoning or disease [10].
Seaweeds have antioxidant substances that act as an endogenous defense mechanism against oxidative stress caused by extreme environmental conditions [11]. Polyphenols have recently been classified as antioxidant compounds (phenolic acid, flavonoid, and tannins). These compounds have been shown to have strong antioxidant properties as anticancer, antibacterial, antiallergic, antidiabetes, antiaging, anti-inflammatory, and anti-HIV activities [12]. Phenolic and flavonoid compounds were detected in abundance in seaweeds under extreme climatic conditions, suggesting their critical role in chelating metal ions, decreasing radical generation, and strengthening the internal antioxidant system. These functions contribute to the prevention of diseases caused by reactive oxygen species (ROS) [13].
This study aimed to investigate the biochemical compositions of some brown algae (Polycladia indica and Turbinaria ornata) and red seaweed (Sarconema scinaioides and Laurencia obtusa). It was also aimed to study the antioxidant activity of these seaweeds to elucidate their nutritional, pharmaceutical, and possible medical applications. This work also reported the potential of seaweeds as food nutrients and compared the nutritional values of these seaweeds with some other seaweeds and some locally consumed vegetables.

2. Materials and Methods

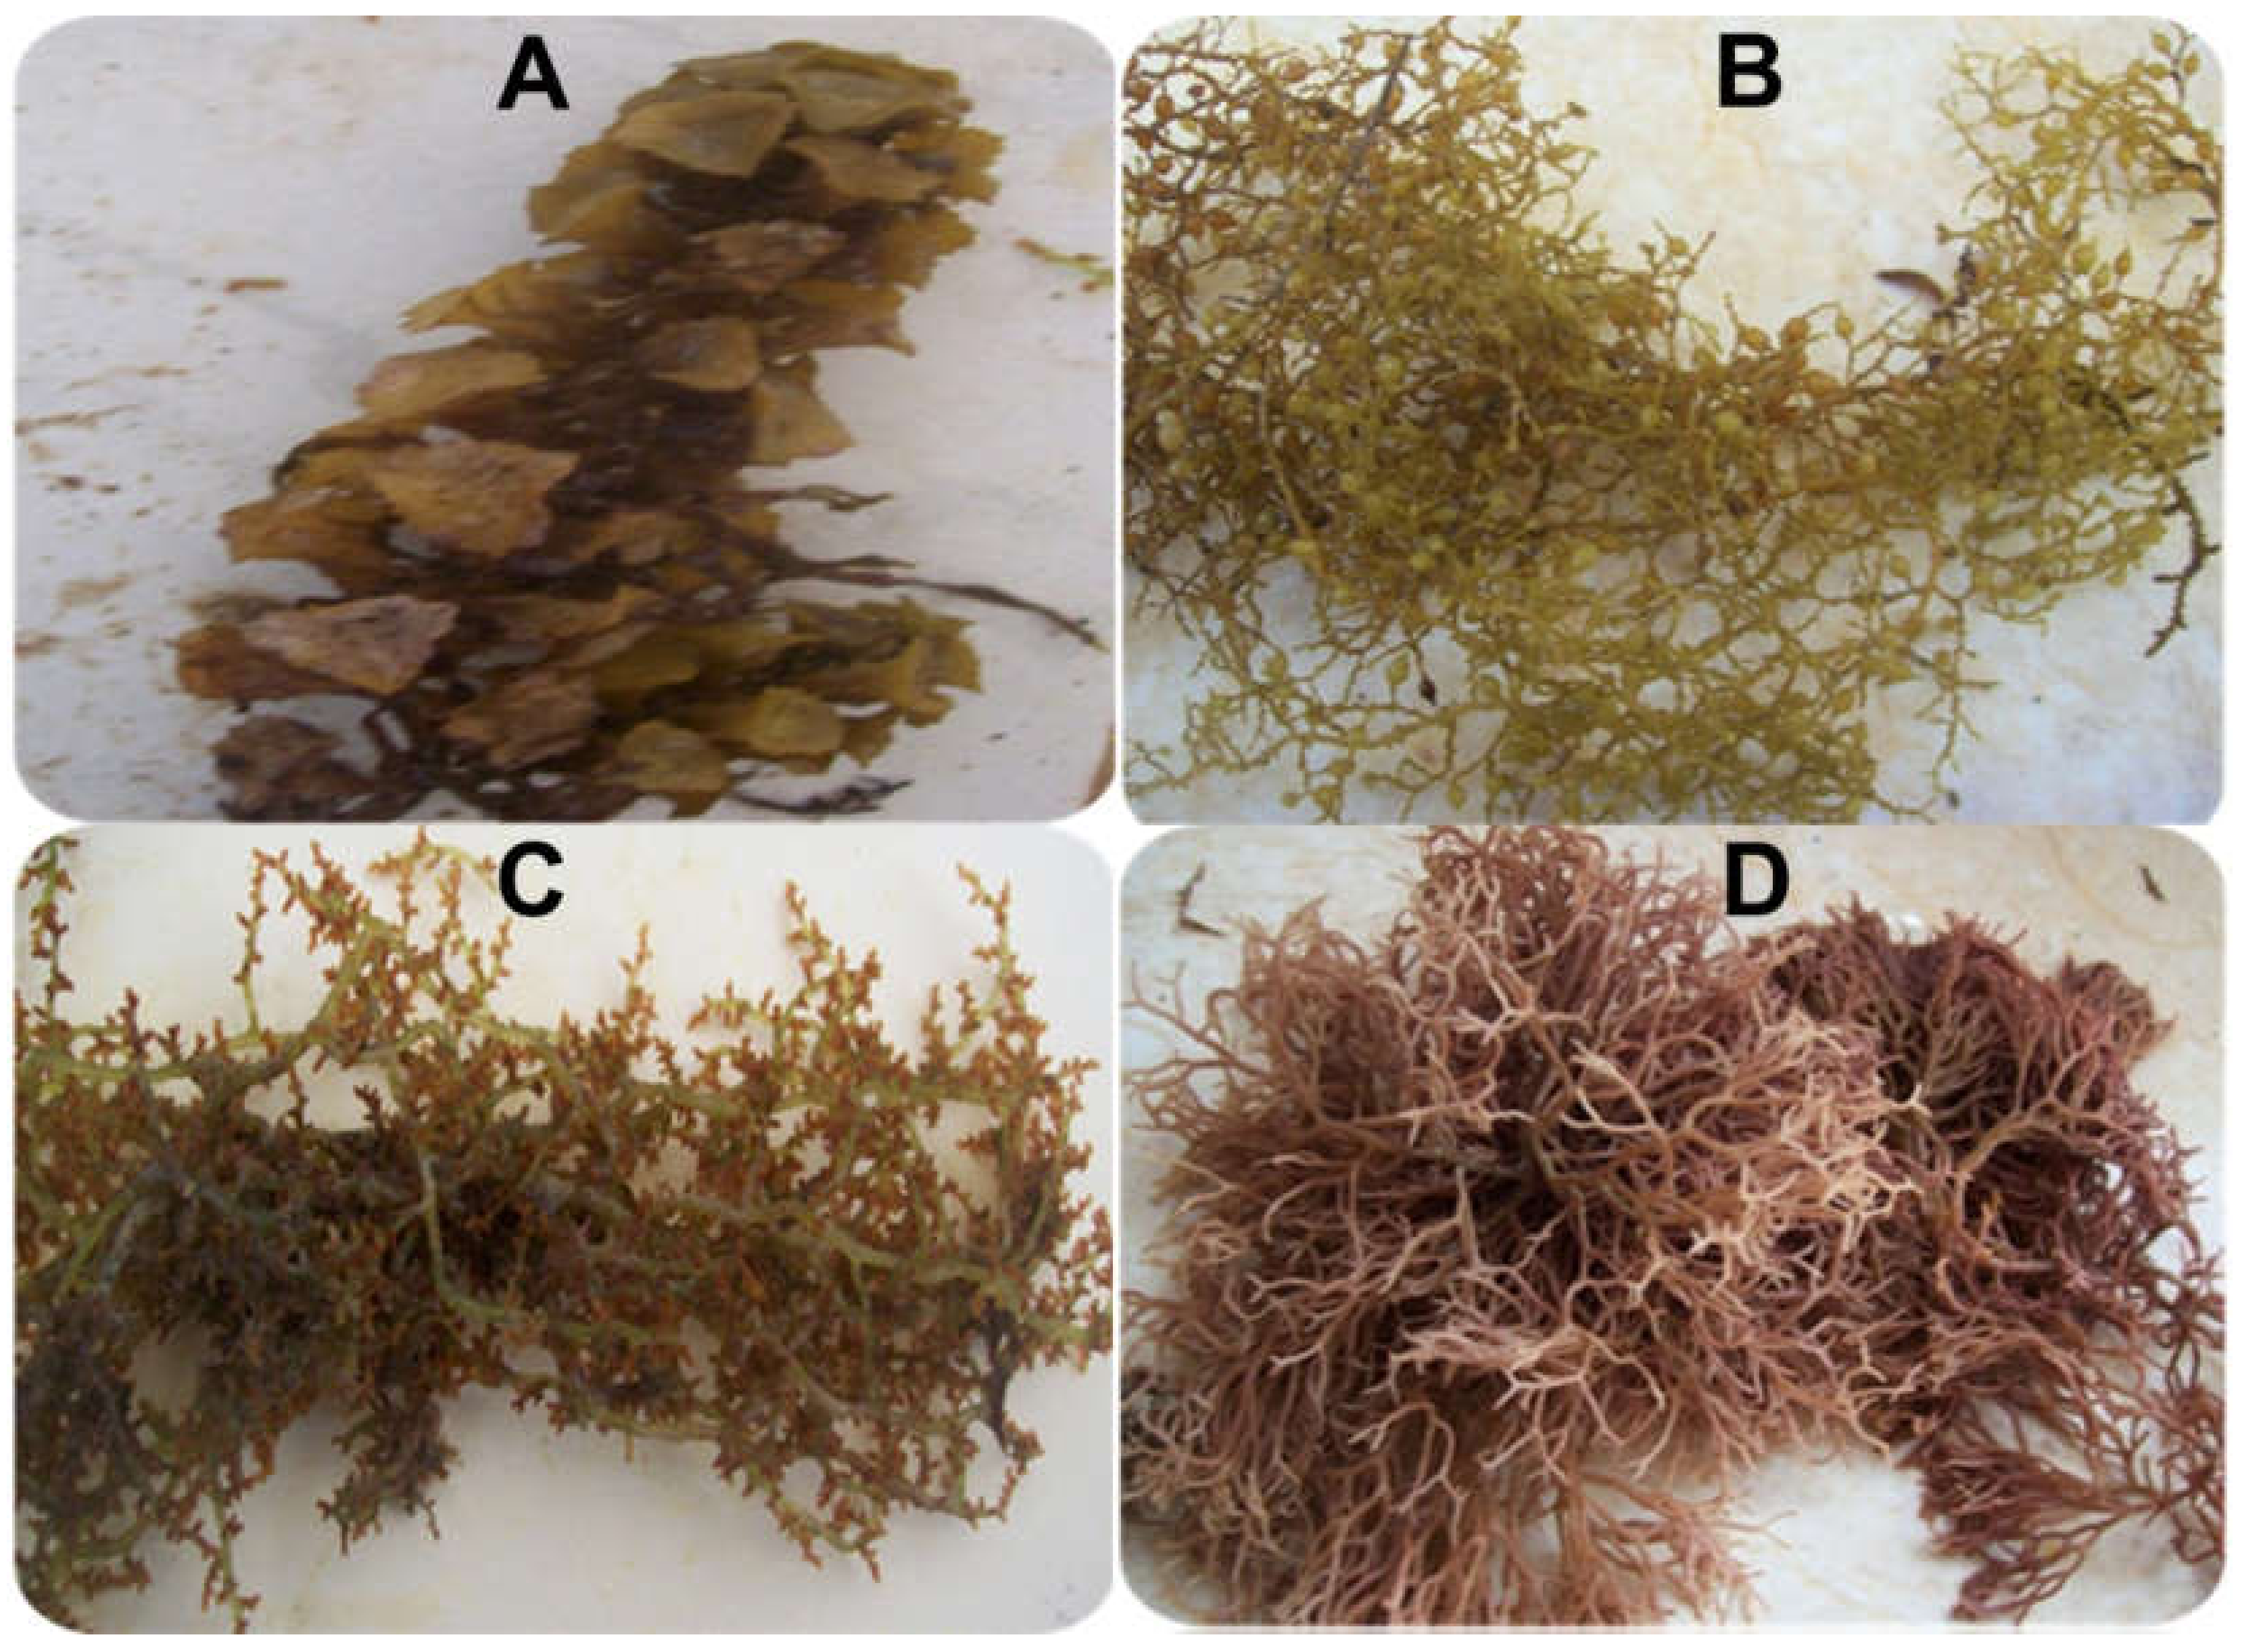
2.1. Seaweeds Collection

During August 2019, appropriate volumes of the four marine macroalgae were harvested from Egypt’s Red Sea shore (27°17′03″ N, 33°46′21″ E). To eliminate contaminants, the samples were carefully rinsed in seawater. The seaweed species were rinsed with tap water to eliminate undesired foreign particles and epiphytes. After that, the collected sample was shade dried until constant weight and ground. The algal samples belonged to two algal classes (Figure 1): Phaeophyceae: Polycladia indica (Thivy and Doshi) (formerly Cystoseira indica) according to Draisma et al. [14] and Turbinaria ornata (Turner) J.Agardh and Rhodophyceae: Laurencia obtusa (Hudson) J.V.Lamouroux and Sarconema scinaioides (Børgesen) according to Guiry and Guiry [15].

2.2. Biochemical Composition Analysis

2.2.1. Estimation of Total Carbohydrates, Protein, and Dietary Fiber of Seaweeds

Seaweed’s total carbohydrates were estimated by the phenol-sulphuric acid method [16]. The total protein was assessed spectrophotometrically at 750 nm [17]. The total dietary fiber was calculated using the AOAC method, slightly modified by Pak and Araya [18]. The results were expressed as a percentage of DW seaweeds.

2.2.2. Estimation of the Elements Content of Algae

Na, K, Ca, and Mg analyses of the algal samples were determined by atomic absorption spectroscopy (AAS). Dry seaweeds (0.5 g) were digested in 5 mL HCl and HNO3 (3:1), the digested sample was filtered into a graduating cylinder, and the filtrate was made up to 25 mL using distilled water, and heavy metal contents were determined using a flame atomic absorption spectrophotometer [19]. Mineral content was determined in triplicate for each sample and expressed as mg/100 g of DW seaweeds.

2.2.3. Estimation of Lipid

Total Lipid Contents

The chloroform-methanol method was used to extract the lipid content of seaweeds [20].

Composition of Fatty Acids

Fatty acid methyl esters preparation.
Aliquots of total lipids were kept at 4 °C in the dark for transmethylation and extraction of fatty acid methyl esters (FAMEs) before GC-MS analysis, as described by Radwan [21].
Gas-liquid chromatography of fatty acid methyl esters (FAMEs).
The fatty acid methyl esters were analyzed using GC-MS spectrophotometry. This method was accomplished at the National Center Research, Cairo, Egypt.

2.2.4. Determination of Amino Acids

A seaweed sample of 3 g was prepared for hydrolysis, according to Walker [22], before the determination of amino acids. Amino acid analyses were carried out using amino acid analyzer LC 3000 Eppendorf/Biotronik (Berlin, Germany) using column type H 125 x in the National Center Research, Cairo, Egypt.

2.2.5. Estimation of Total Phenols

The Folin–Ciocalteu reagent was used to determine the total phenolic content (TPC) of seaweed extracts, as described by Singleton and Rossi [23]. A gallic acid stock solution (10 mg/10 mL) was used as a reference for measuring the color produced at 750 nm. The results were represented as milligram gallic acid equivalent (GAE) per gram dry weight of the sample (mg GA/g DW of algae).

2.2.6. Estimation of Total Flavonoid Content

Flavonoids were measured using a colorimetric approach employing aluminum chloride [24]. The reaction mixture’s absorbance was measured at 415 nm. Catechin solution (20–100 g) in methanol was used to produce a calibration curve. The findings were represented in milligrams (+) Catechin equivalents per gram of seaweed dry weight (mg CE/g seaweed dry weight).

2.2.7. Estimation of Ascorbic Acid (Vitamin C) Content

Ascorbic acid was extracted and quantified using a modified method of Abushita et al. [25]. The extract’s ascorbic acid content was determined using a reverse-phase HPLC method, and the retention duration was compared to that of an L-ascorbic acid standard.

2.2.8. Estimation of Beta Carotene

Tee et al. [26], the method was used to extract β-carotene from the algal sample, with minor modifications agreed upon by Ismail and Fun [27]. In a blender, the algal sample (10 g) was mixed for 3 min with 40 mL absolute ethanol and 10 mL potassium hydroxide. After 30 min of saponification in a refluxing system, the mixture was cooled to room temperature. β-carotene was detected using reversed-phase HPLC technology (Hewlett Packard HPLC Series 1100, Palo Alto, CA, USA). A spike test based on its retention time and standard trans β-carotene detected the final peak of β-carotene.

2.3. Antioxidant Activity Assay

2.3.1. DPPH Radical Scavenging Capacity

The ability of seaweed extracts to scavenge the DPPH (1, 1-diphenyl-2-picrylhydrazyl) radical was investigated using the technique developed by Yen and Chen [28]. Two mL of the test sample were mixed with 2 mL of a 0.16 mM DPPH methanol solution. The absorbance was measured at 517 nm after the liquid was vortexed and kept in the dark for 30 min. The antioxidant activity was expressed as an inhibition percentage of DPPH radical (% inhibition). The following equation was used to calculate the percentage of DPPH radical scavenging activity.
DPPH scavenging activity (% inhibition) = [(Ac − As)/Ac] × 100
where Ac is the absorbance of the control (100 μL of methanol solvent with 100 μL of the DPPH solution). As is the absorbance of the sample.

2.3.2. Total Antioxidant Capacity (TAC)

According to Prieto et al. [29], the total antioxidant capacity of seaweed extracts was assessed by the phosphomolybdate assay method (PMA). In this method, 0.3 mL of the seaweed extract was added to 3 mL of TAC reagent (28 mM sodium phosphate, 0.6 M sulphuric acid, and 4 mM ammonium molybdate) and incubated at 95 °C for 90 min in capped tubes, and the absorbance was measured at 695 nm against a blank. The total antioxidant capacity was expressed as a percentage, with ascorbic acids as a standard by using the formula.
Total antioxidant capacity (TAC) % inhibition = [(Ac − As)/Ac] × 100
where Ac is the absorbance of the control reaction (reagent without sample and standard); As is the absorbance of the sample.

2.3.3. Estimation of Total Reducing Capacity (TRC)

Dyaizu’s [30] method was used to assess the reducing capabilities of seaweed extract. A total of 2.5 mL phosphate buffer (0.2 M, pH 6.6) and 2.5 mL % potassium ferricyanide were added to 1 mL extract seaweed. For 20 min., the mixture was incubated at 50 °C. Trichloroacetic acid (2.5 mL, 10%) was added and centrifuged for 10 min at 3000 rpm. The supernatant (2.5 mL) was combined with 2.5 mL distilled water and 0.5 mL ferric chloride (0.1%). After 10 min. of incubation, the absorbance was measured at 700 nm. The reaction mixture’s enhanced absorbance indicated increased reducing power.

2.4. Statistical Analysis

The Kruskal–Wallis test was used to analyze the data, followed by post-hoc Dunn’s multiple comparisons. Differences were considered significant at p values of <0.05. Graph Pad Prism version 5 was used for all statistical analyses.

3. Results and Discussion

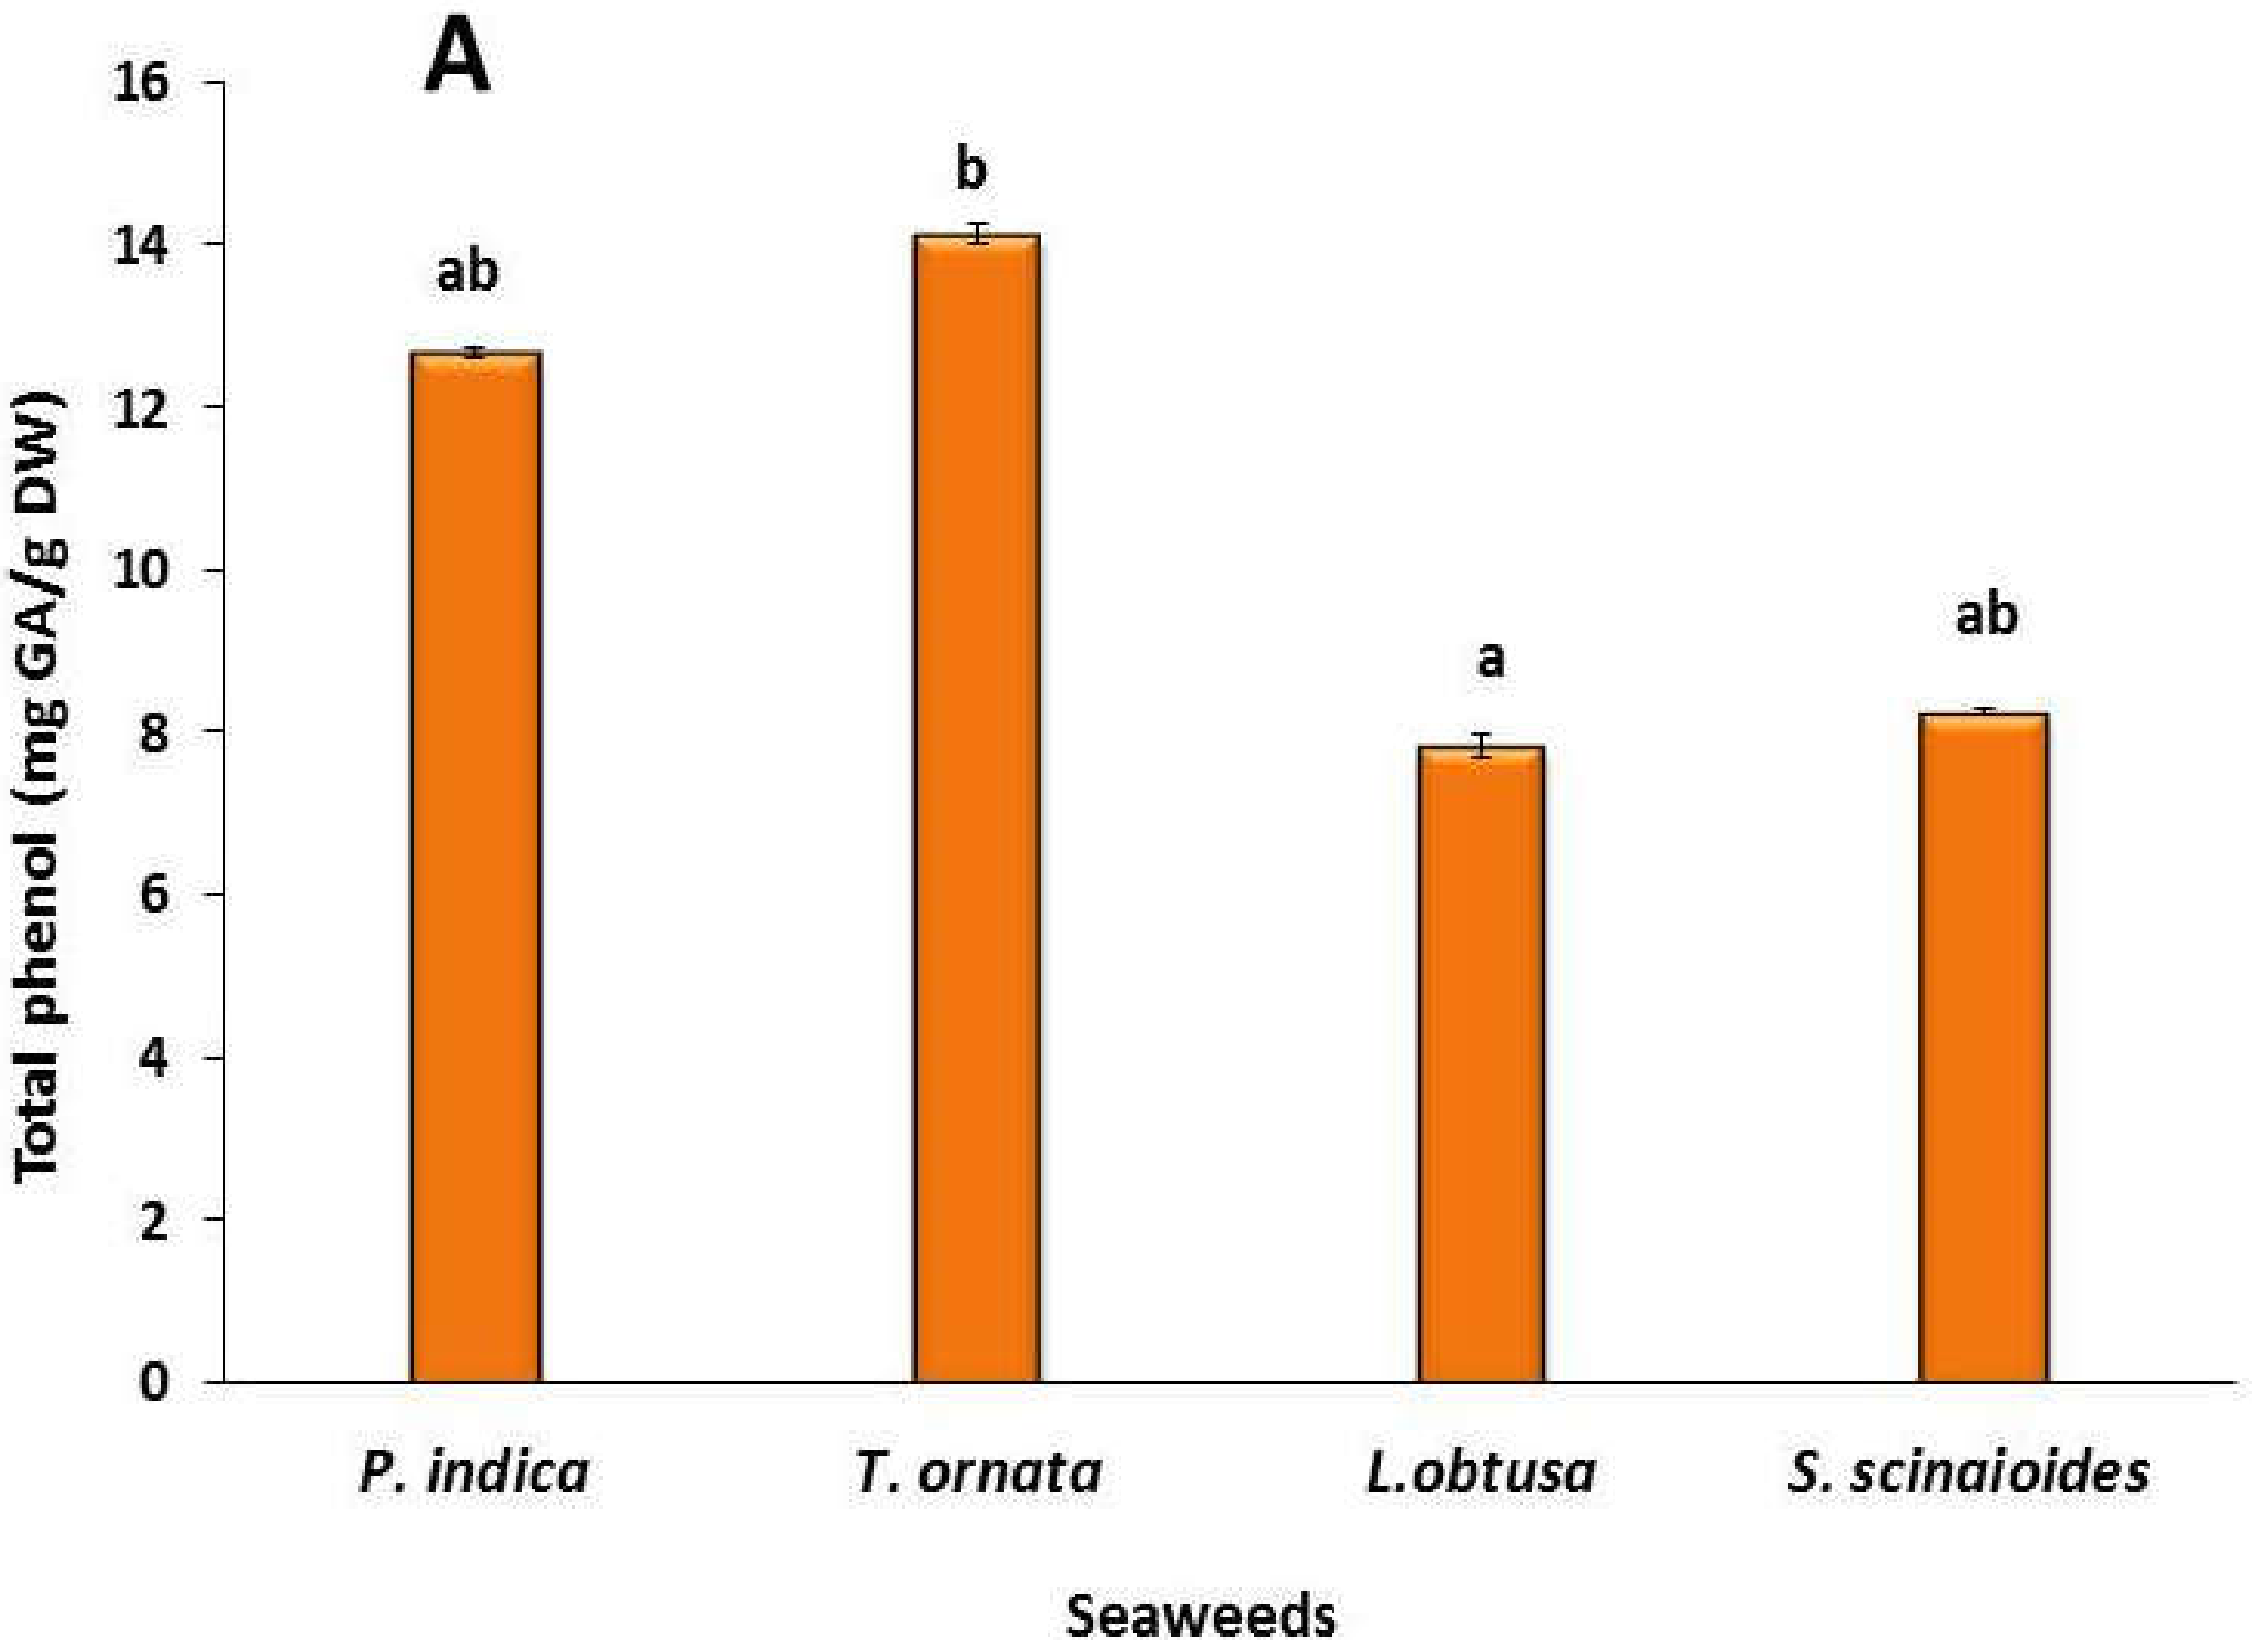
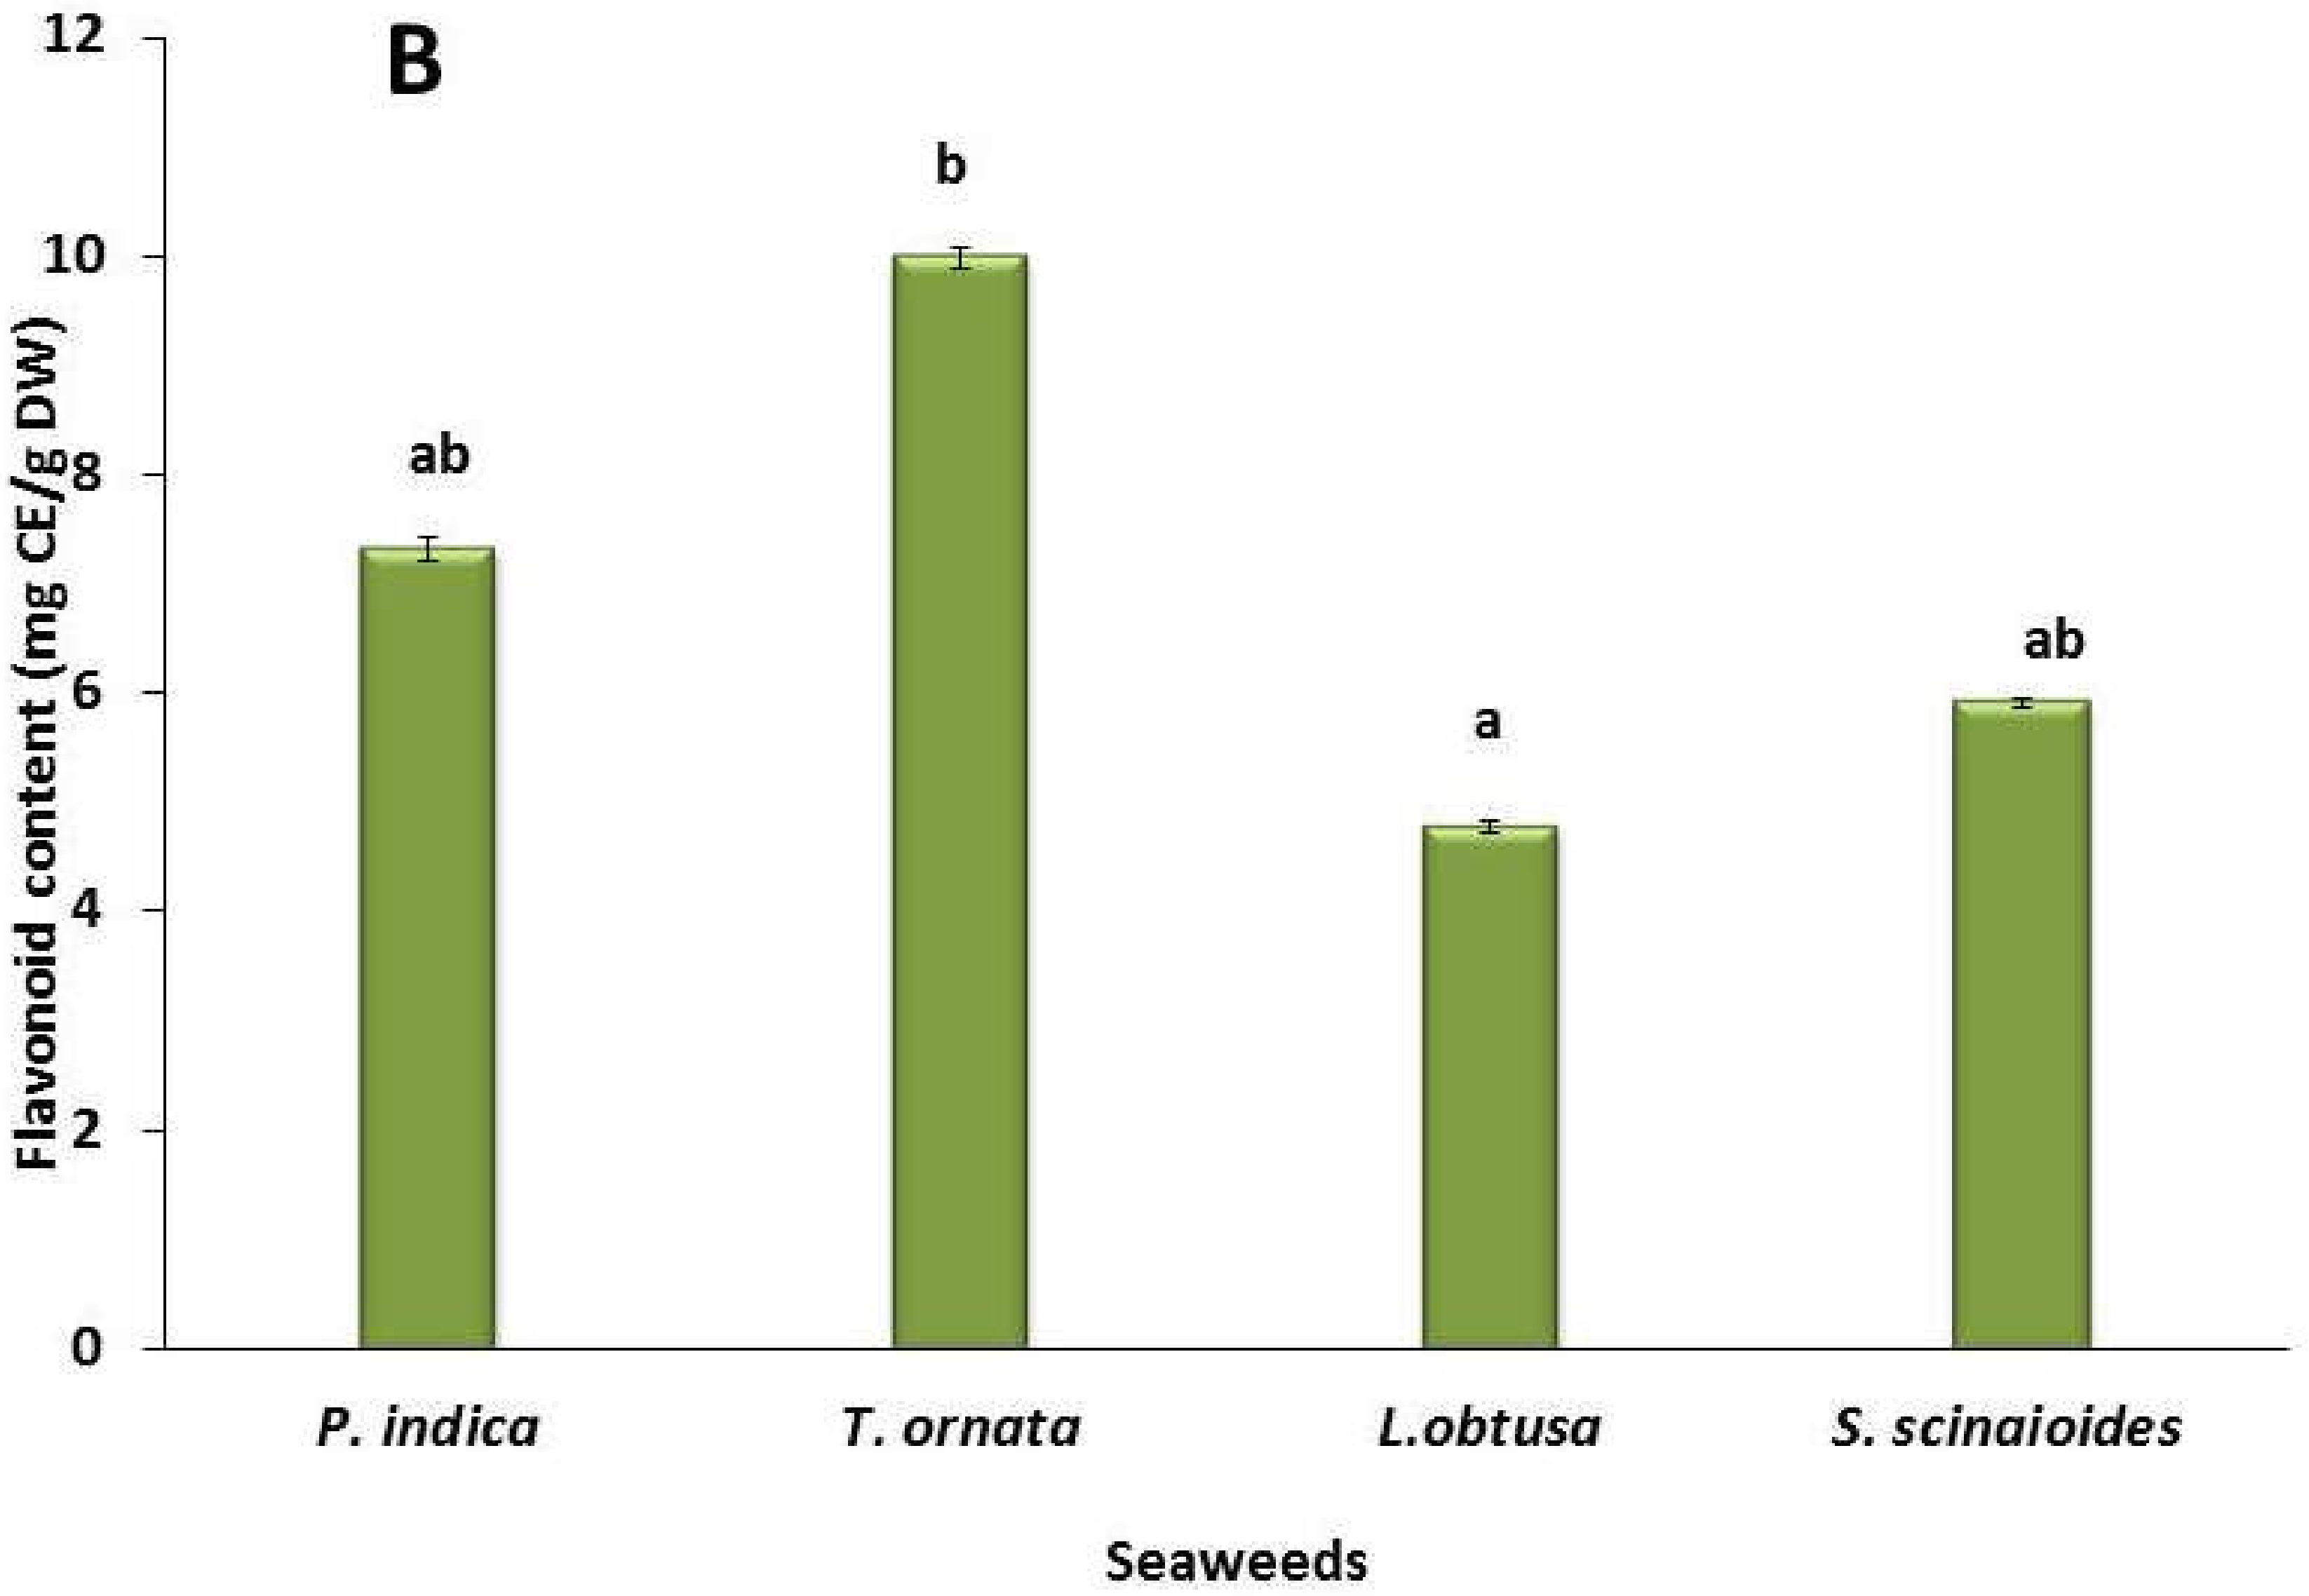
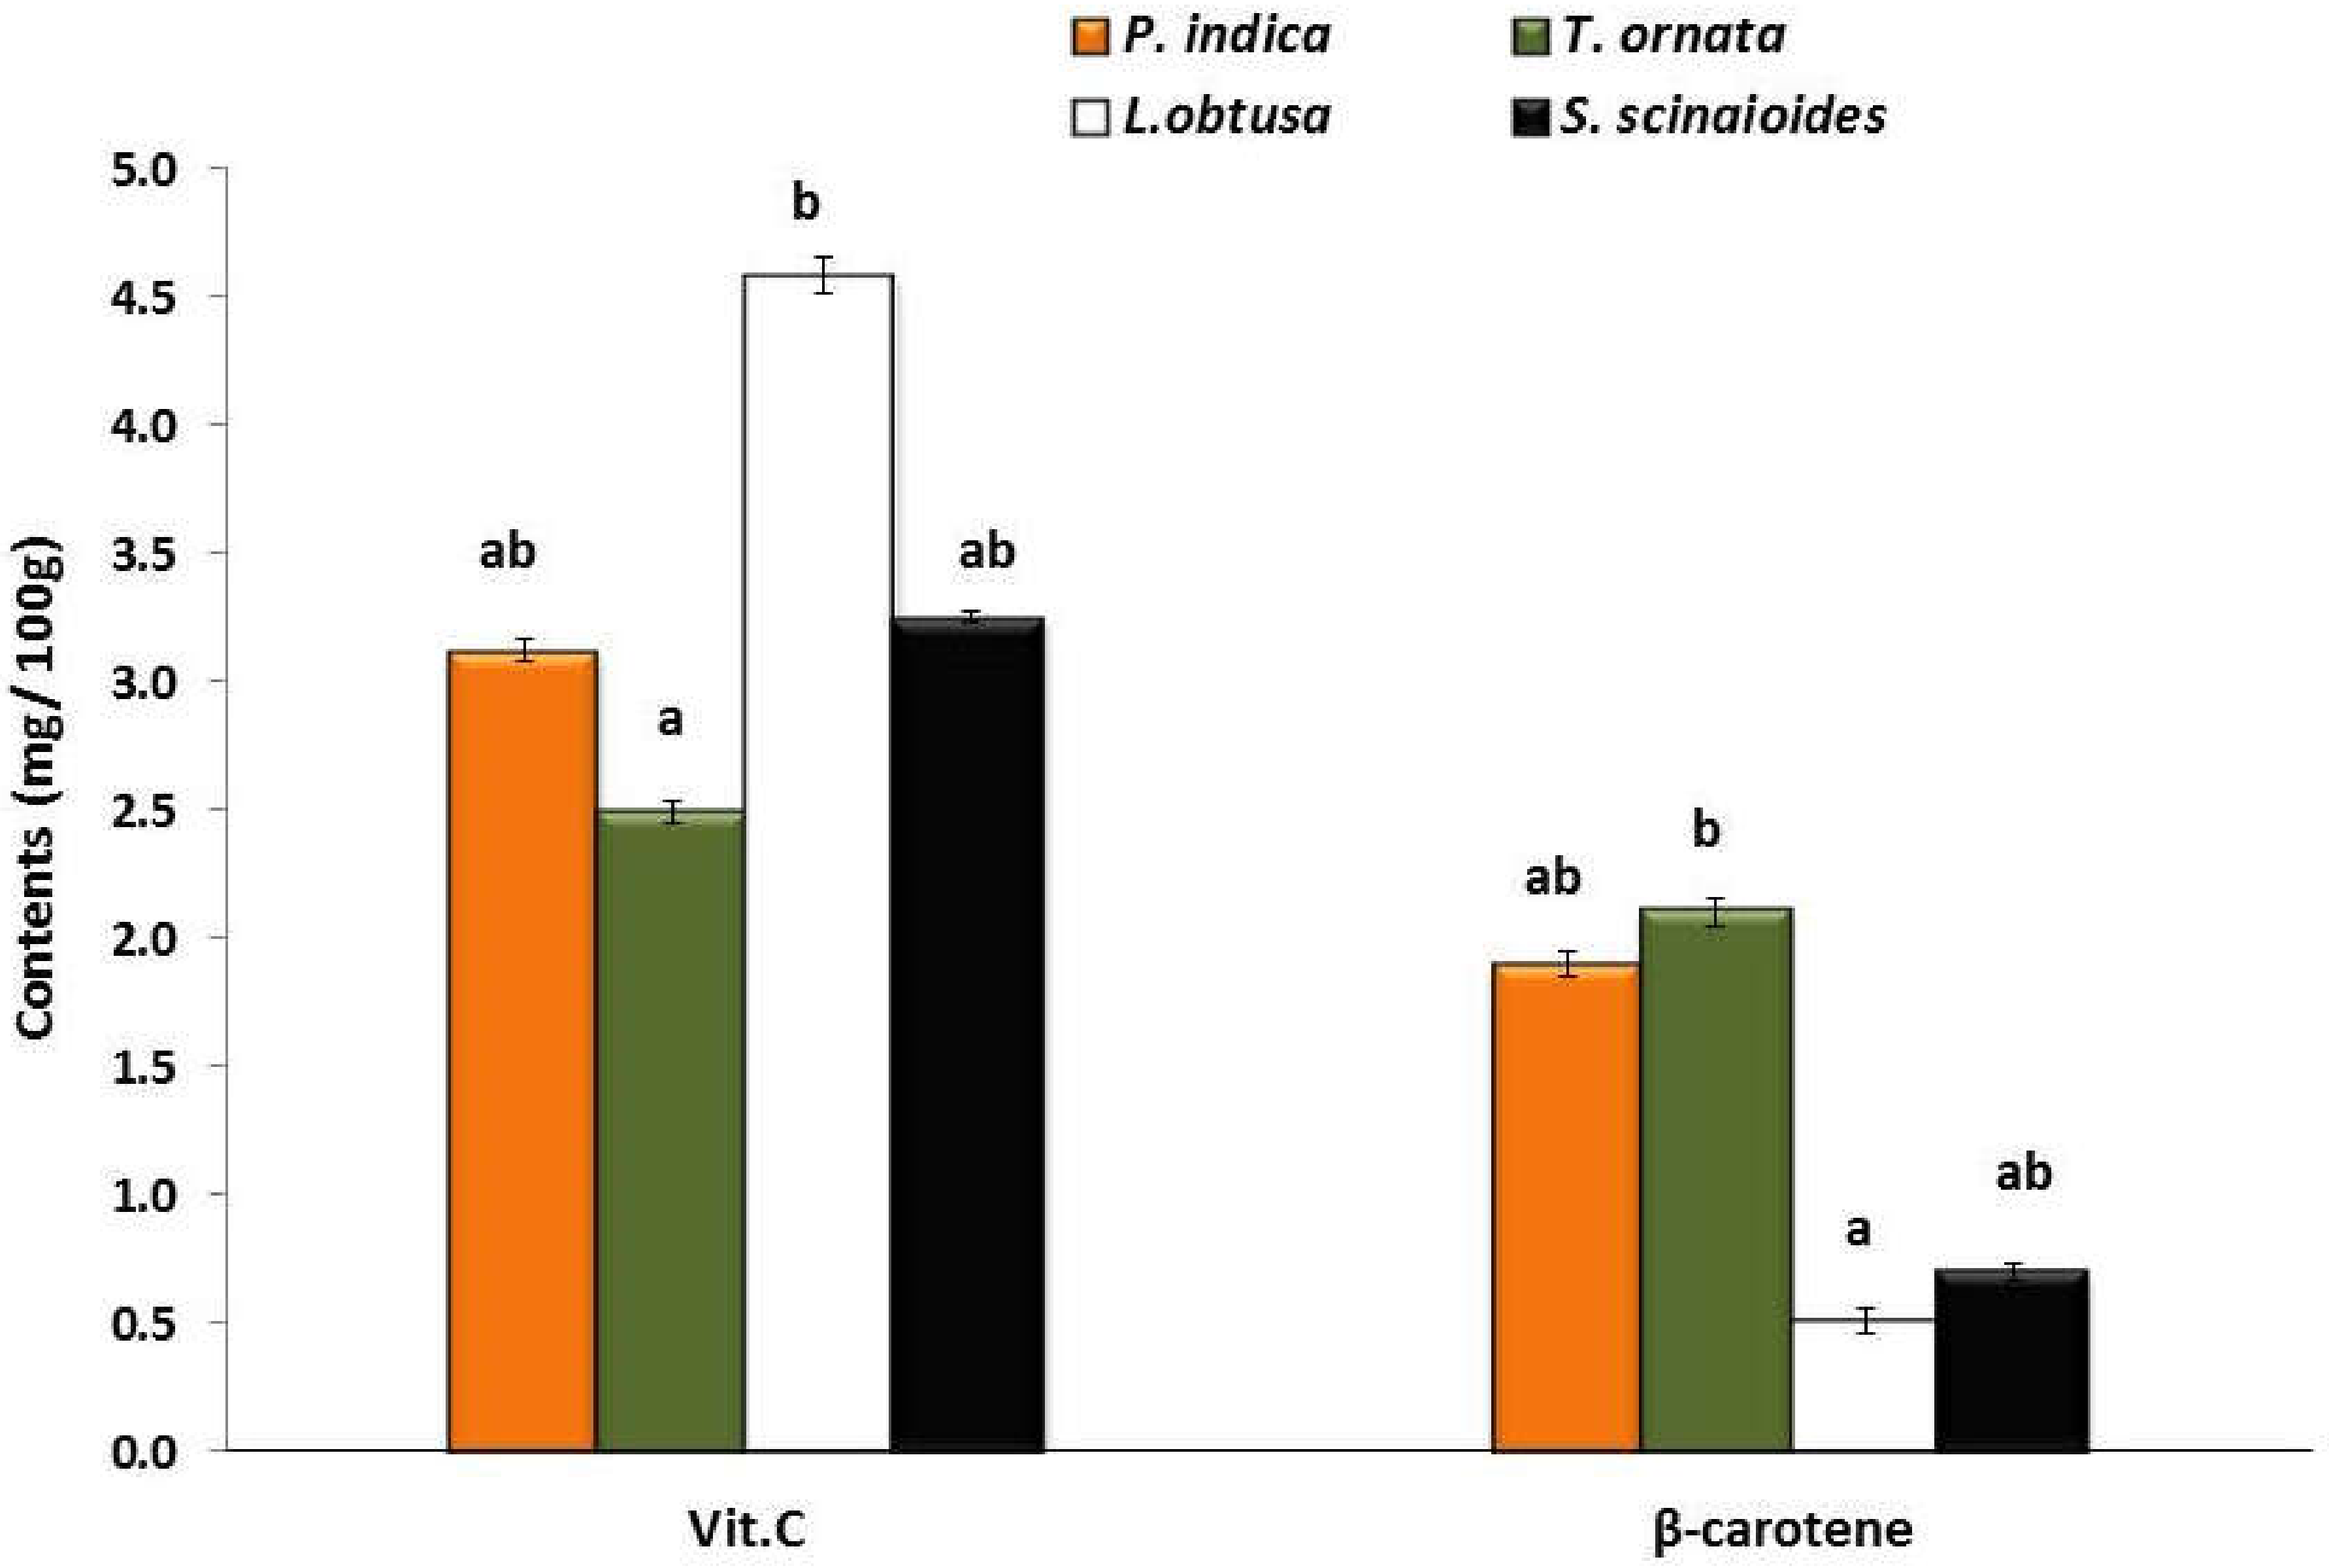
3.1. Antioxidant Contents

Natural antioxidant compounds such as phenolic compounds, flavonoids, alkaloids, and vitamin C are not only found on land sources; reports show that algae are also rich in these natural antioxidants [31]. By scavenging ROS and free radicals, these antioxidants aid in the treatment of a variety of severe illnesses, including cancer, cardiovascular disease, and aging disorders [32]. Phenol is a compound widely present in almost all algae species and has a wide range of biological activities, including antioxidant properties [33].
Figure 2 shows the total phenolic compound (TPC) and flavonoid contents of the four studied seaweeds. The T. ornata showed the maximum value total phenols and flavonoid contents (14.14 ± 0.1 mg GA/g DW and 9.98 ± 0. 09 mg CE/g DW, respectively) while the red alga (L. obtusa) recorded the lowest value total phenols and flavonoid contents (7.83 ± 0.14 mg GA/g DW and 4.78 ± 0.05 mg CE/g DW, respectively). These results are consistent with those of Manam and Subbaiah [34], who reported that total phenol and flavonoid contents of brown seaweeds Colpomenia sinuosa were high (56.45 and 12.13 mg/g DW, respectively) as compared to red seaweeds Halymenia porphyroides (9.02 and 4.43 mg/g DW, respectively).
Flavonoids are antioxidants, ROS scavengers, and lipid peroxidation inhibitors, as well as potential therapeutic agents for a wide range of illnesses. [35]. Kokilam and Vasuki [36] detailed that flavonoids have antihepatotoxic, mitigating, and antiulcer impacts other than ensuring against cardiovascular mortality.
Red seaweeds L. obtusa showed the highest ascorbic acid content (4.58 ± 0.07 mg/100 g), followed by S. scinaioides, P. indica, and T. ornata (3.25 ± 0.02, 3.12 ± 0.04, and 2.49 ± 0.04 mg/100 g, respectively) (Figure 3). These results are in agreement with those of Manam and Subbaiah [34], who proposed that red seaweed, Halymenia porphyroides, has a higher concentration of vitamin C (8.33 μg/g DW) than brown seaweed, Colpomenia sinuosa (0.0145 μg/g DW). The maximum content of β-carotene was detected in T. ornata (2.1 ± 0.06 mg/100 g) and the minimum content in L. obtusa (0.51± 0.05 mg/100 g) (Figure 3). Similarly, El-Shenody et al. [37] found that β-carotene contents of brown seaweeds Dictyota dichotoma and Turbinarina decurrens (1146.6 and 117.0 μg/g DW) were higher than those in red seaweed Laurencia obtusa (45.5 μg/g DW).
Vitamin C is a significant cancer prevention agent that aids in the development and fix of an assortment of body tissues, including ligaments, bones, ligaments, tendons, and teeth. Normal cancer prevention agents present in higher plants, such as nutrients, polyphenols, and β-carotene, were used to trap receptive oxygen species (ROS) that cause lipid peroxidation. These substances are now employed in the food industry to protect the human body from free radicals and to prevent a variety of chronic diseases.
Many studies have found that natural beta carotene sources should be used to reduce free radical damage, which contributes to reducing the effects of aging and prevents cancer [12].

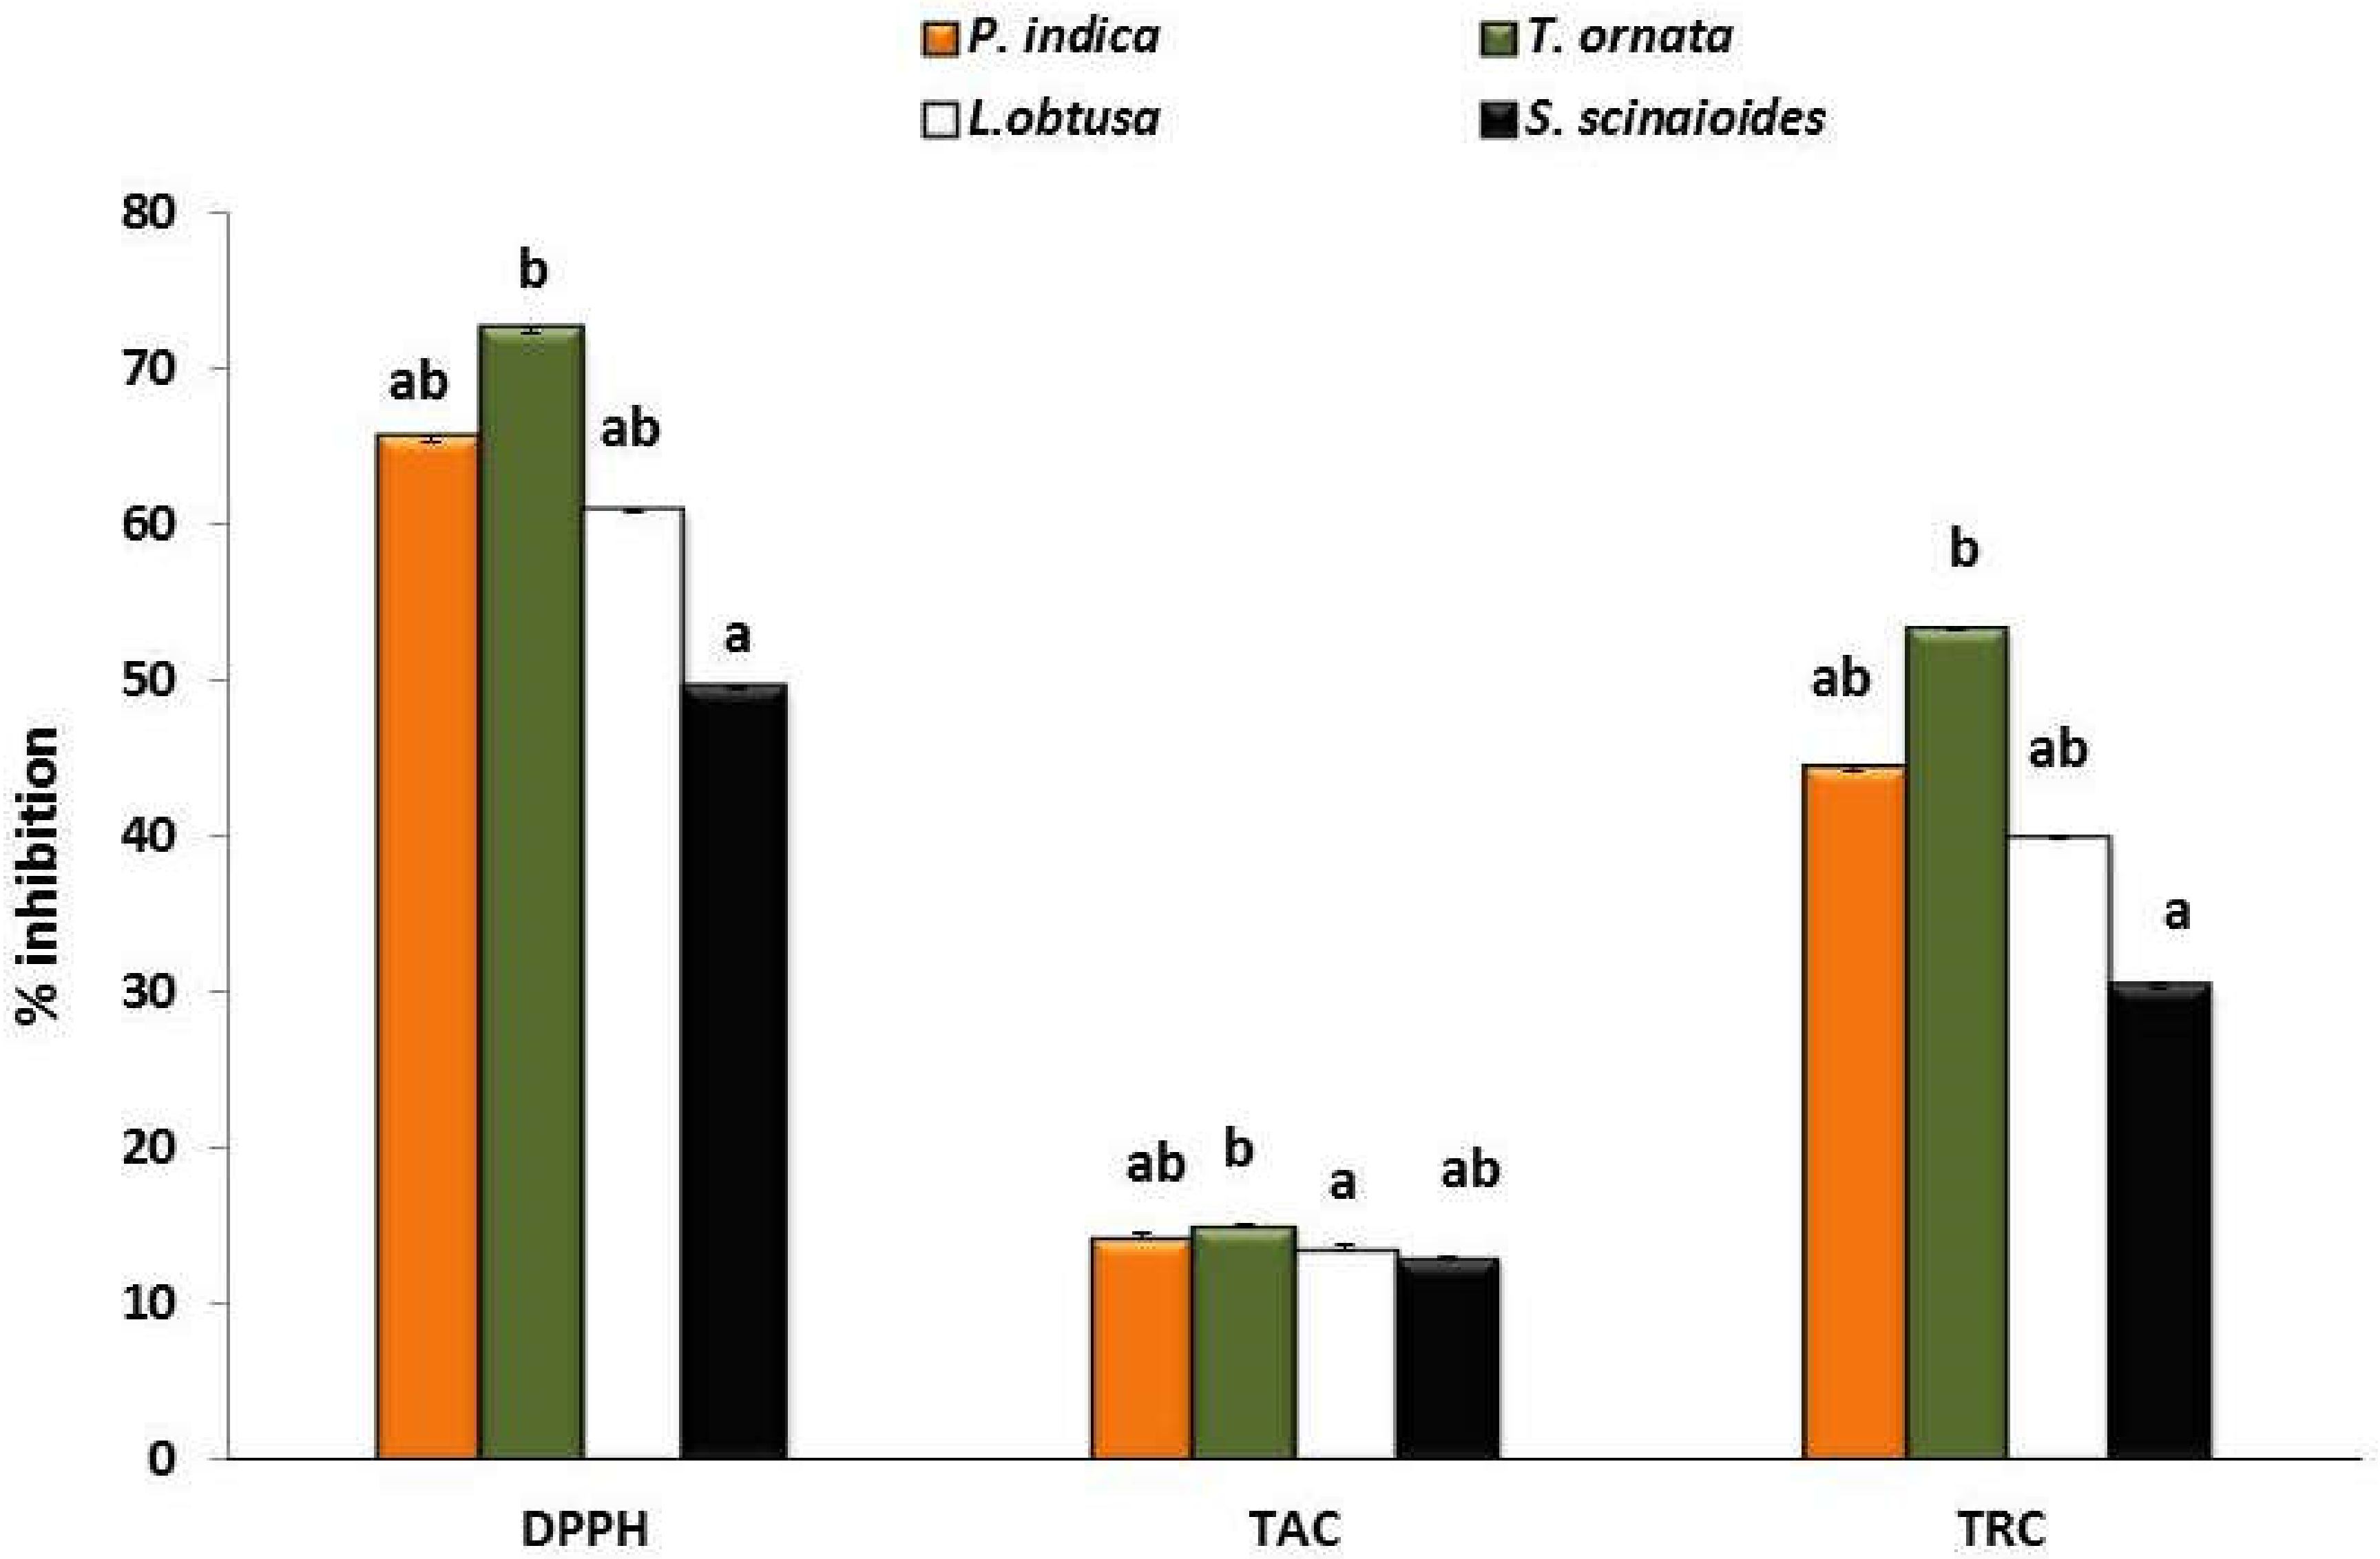
3.2. Antioxidant Activity

The ability of a compound to inhibit oxidation reactions, expressed as a percentage of inhibition, is known as antioxidant activity. The ability of algae to accumulate antioxidant compounds has attracted the attention of researchers because the environment in which algae grows is harsh, which can lead to the production of strong oxidants [5].
The antioxidant activity was determined using the DPPH, TAC, and TRC assays, and the results are shown in (Figure 4). The DPPH (1,1-diphenyl-2-picrylhydrazyl) test has been widely used as a stable free radical to evaluate reducing chemicals, and it is a suitable reagent for studying compounds’ free radicals [38]. The antioxidant scavenging activity of DPPH was considerably increased in all of the seaweeds tested, as shown in Figure 4. T. ornata showed higher DPPH scavenging activity of 72.48 ± 0.17% inhibition, while S. scinaioides exhibited lower activity of 49.54 ± 0.13% inhibition. These results were not only comparable to the ascorbic acid standard (62.35 ± 0.07%), but they were much higher in the case of brown species. These findings are in line with those of Parthiban et al. [39], who observed that brown seaweed Dictyota dichotoma acetone extract has high DPPH radical scavenging activity. The other two approaches, total antioxidant capacity (TAC) and reducing capacity (TRC), were used to assess and evaluate the antioxidant activity of various seaweed components (electron donors). Total antioxidant capacity (TAC) and reducing capacity (TRC) had similar results with different scavenging percentages (Figure 4), which were better in the case of brown seaweeds than red seaweeds and near to the evaluated value of the ascorbic acid standard (17.41 ± 0.03 and 57.21 ± 0.01, respectively) for two testes.
T. ornata observed the highest total antioxidant capacity and reducing capacity (15.02 ± 0.13% and 53.24 ± 0.11%, respectively) while S. scinaioides exhibited lower activity (12.96 ± 0.09% and 30.37 ± 0.14%, respectively). As a result, all of the studied species are deemed to be high in antioxidants. Brown seaweeds have more antioxidant activity than red seaweeds, according to El-Sheekh et al. [40] and Ismail [41], which explains why brown algae T. ornata and P. indica had the greatest antioxidant activity.
Antioxidants convert reactive oxygen species (ROS) to non-toxic compounds, prevent their harmful effects, and reduce the risk of diseases, ischemia, diabetes infections, cardiovascular disease, and cancer [42].
Biologically, antioxidants protect the body by transferring an electron or a hydrogen (H) atom to reactive substances [43]. As a result, hydrogen atoms transfer (HAT) and single electron transfer tests assess antioxidant capability.

3.3. Phytochemical Constituents of the Studied Seaweeds

Carbohydrates, proteins, and lipids are the main biochemical components of algae. The proportion of each component varies from the taxonomic group [44]. The data in Figure 5 show the carbohydrates, protein, lipids, and fibers of the four studied seaweeds. The concentration of carbohydrates was higher in the species of Phaeophyceae, followed by Rhodophyceae. Carbohydrate contents of the studied seaweeds ranged from 20.17% to 38.62% DW. The greatest carbohydrate content was found in T. ornata (38.62% ± 0.11%), while the lowest was found in L. obtusa (20.17% ± 0.1%) of algal dry weight (Figure 5). Similarly, Roy and Anantharaman [45] and El-Sheekh et al. [40] recorded the highest carbohydrates content in brown seaweeds than in red seaweeds.
Carbohydrates are necessary for organisms’ metabolism because they supply energy, and they often contain high levels of polysaccharides such alginate and fucoidan in brown algae and carrageenan and agar in red algae [46].
Polysaccharides are edible and described as an energy reserve and structural components of all organisms, including marine and higher plants. In seaweed, polysaccharides are the most significant macromolecule, which accounts for more than 80% of its weight.
The protein content of seaweeds varies between 5% and 17% of DW (Figure 5). The largest protein content in the brown seaweeds (P. indica, 17.61± 0.14% and T. ornata, 10.32 ± 0.10% of DW) and the lowest amounts in the red seaweeds (L. obtusa, 5.41± 0.11% and S. scinaioide, 7.52 ± 0.13% of DW), as compared to other protein-rich meals derived from terrestrial plants, such as pulses (ex. Phaseolus vulgaris and Lens culinaris) and moong dal (Vigna radiate), the obtained values were discovered to be complementary protein sources according to Ramu Ganesan et al. [47]. These results are consistent with those of Parthiban et al. [39], who reported that brown seaweeds species usually contain a larger protein fraction than red seaweeds. According to FAO [48], the daily protein intake should be 1 g/kg BW; hence, the selected seaweed would be a balanced protein with a high biological value of vital amino acids.
According to Gressler et al. [49], the source of these variances might be that the protein content of seaweeds varies across species and within species according to levels of maturity, time of year, and different habitats.
Seaweeds have comparatively low lipid content with wide variances among species [50]. Depending on the algal species, the lipid content of the four macroalgae investigated ranged from 1.12% to 3.04% (Figure 5). The red alga L. obtusa had the highest lipid content (3.04 ± 0.12% DW), followed by S. scinaioides (2.03 ± 0.08% DW), and the brown alga T. ornata had the lowest (1.12 ± 0.12% DW). Normally, seaweeds do not appear to be a suitable source of fat, with total lipid contents in most species being less than 4% of dry weight [51]. The results for L. obtusa were similar to the total lipid percentage found in the two Laurencia species previously investigated, which ranged from 1.1% to 6.4% DW (Gressler et al. [49] and El-Shenody et al. [37]. In contrast, Ramu Ganesan et al. [47] observed that the highest content of lipid was detected in brown alga Padina gymnospora (1.4 g) and a low value found in red alga Acanthophora spicifera (0.48 g). However, fat is necessary for fetal growth and provides significant energy for pregnant women to achieve a total weight increase of 12 kg, which should be obtained from protein and fat (WHO/FAO) [52].
The proportion of dietary fiber in seaweeds ranged between 35.65% and 11.63% of DW (Figure 5). Brown seaweed fiber content is greater than fiber found in red algae. The highest fiber was recorded in P. indica (35.65± 0.13%) followed by T. ornata (29.47 ± 0.08%), and the lowest was recorded in S. scinaioides (11.36 ± 0.09%). These results conformed to Kasimala et al. [53], who proposed that the brown alga Cystosoria myrica is rich in dietary fibers (32.39 mg/g) compared with other seaweeds. The fiber content of seaweed is higher than that of higher plants, according to Venugopal [54].
Dietary fibers are refractory polysaccharides that are not digested by the body but can ferment to varying degrees due to the enzymatic action of bacteria in the gut [55]. Seaweed carbohydrates fermentation can be expended for bioethanol production [56]. Dietary fiber is recognized today as an important component of healthy nutrition. Seaweeds can provide up to 12.5% of a person’s daily caloric intake. This is a significant amount when compared to other terrestrial foods [57].

3.4. Mineral Composition

Seaweeds have a much higher quantity of all essential minerals than any other plant on land. Mineral content varies according to seaweed phylum, geographical origin, and seasonal, environmental, and physiological variations [58].
Table 1 displays the mineral composition of selected seaweeds and the values recorded in edible seaweed (Gracilaria gracilis) according to Rasyid et al. [59], and it also includes the Nutrition Division’s (2003) dietary recommended intake (DRI) for Thai males and females aged 19 to 50 years according to Ivanovitch et al. [60]. The most abundant macromineral in the four seaweeds studied was potassium (578.38–1228.73 mg/100 g DW), followed by calcium (390.42–845.38 mg/100 g DW) and sodium (102.55–283.82 mg/100 g DW). A similar tendency was noticed by Fouda et al. [61]. They are reported that although potassium is essential for seaweed growth and metabolic activity, it has been found that certain seaweed accumulates more potassium than other elements.
P. indica had the greatest sodium, potassium, and magnesium concentrations (283.82, 1228.73, and 275.45 mg/100 g DW, respectively), and it had the lowest calcium concentration (390 mg/100 g DW), whereas L. obtusa had the highest calcium and zinc concentrations (845.38 and 4.9 mg/100 g DW, respectively). On average, dairy foods have 305 mg/100 g, while seaweed has 845 mg/100 g. As a consequence, seaweed is a considerably more valuable source of calcium. As a result, seaweed bioavailability and bioaccessibility must be investigated further [47].
The Na/K ratio in the species investigated varied from 0.369 to 0.118, showing ideal values for using these species as food to maintain a balanced Na/K ratio [62]. Seaweeds with low Na/K ratios are useful as salt replacers, according to Rodrigues et al. [63]. Potassium, sodium, and chloride maintain fluid balance in the gastrointestinal tract by reducing sodium intake and increasing potassium intake, while potassium, calcium, and magnesium are associated with lowering blood pressure and lowering the risk of stroke [64]. In this regard, Moreiras et al. [65] found that Wakame (Undaria pinnatifida) and Sea Spaghetti (Himanthalia elongata) seaweed species contained approximately eight times more calcium than milk, suggesting that they could be an excellent source of calcium for osteoporosis prevention and treatment, for growing children, and pre- and post-menopausal women. Calcium and magnesium were the most abundant elements in seaweeds for nutrient absorption binding sites, which increased Si and Cl accumulation during stress conditions [66]. Mineral elements are essential for overall mental and physical well-being because they are components of bones, teeth, soft tissues, hemoglobin, muscle, blood, and nerve cells [46].
All living organisms can have their ion quotient ratio calculated. It has better dietary and health benefits than simple Ca/Mg or Na/K ratios with concentrations expressed in moles [67]. [Ca+2 + Na+2]/[Mg+2 + K+2] ion quotient this molar ratio was calculated to be 0.315, 0.359, 0.492, and 0.743 for P. indica, T. ornata, L. obtusa, and S. scinaioides, respectively (Table 1). As a result, including such seaweed species in meals might lower the ion quotient range in the human body (2.5–4.0) and minimize the risk of illnesses, including hypertension, preeclampsia, and heart disease [68]. These findings suggest that eating seaweed species can minimize this range in the human body and disorders such as hypertension, preeclampsia, and heart disease.
Cadmium (Cd), lead (Pb), copper (Cu), and manganese (Mn) were also evaluated in this study, which recorded trace variable amounts among the investigated seaweeds (Table 1). As a result, consuming seaweed in single gram levels would not contribute considerably to the dietary recommended intake (DRI). However, manganese was involved in bone formation as well as the metabolism of lipids, amino acids, and carbohydrates [64]. The concentration of heavy metals in seaweeds reflects their concentration in the medium and the alga’s ability to chelate them up, according to Fouda et al. [61].

3.5. Amino Acids Analyzer of Studied Seaweeds

The contents of total amino acids ranged from 14.21 to 10.67 mg/100 mg DW (Table 2). P. indica contained the highest amount of total amino acids (14.21 mg/100 mg DW) followed by T. ornata (13.22) then L. obtusa (11.91) and S. scinaioides (10.67). These values correspond to 37.02%, 35.93%, 34.84%, and 35.05% of total amino acids content, respectively, were made up of essential amino acids (EAA). EAA, such as methionine, phenylalanine, threonine, and lysine, was high in all the selected seaweeds. Table 2 also includes the essential amino acids (EAA) of soya and eggs according to Galland-Irmouli et al. [69] to compare with our data. These results correspond to those of Dawczynski et al. [70], who reported that essential amino acids in seaweeds accounted for more than 30% of total amino acid content. The non-EAA, such as glutamic acid, aspartic acid, proline, and alanine, were high levels in all studied seaweeds showing significant amounts of cysteine, serine, and arginine, similar to results from previous studies [71]. The amino acid contents reported in this study were similar to those published in the literature. Gracilaria changii has an amino acid profile similar to that of hen’s eggs, with a ratio of essential to total amino acids of 0.4. [72]. According to Wong and Cheung [73], Hypnea japonica, Hypnea charoides (Rhodophyta), and Ulva lactuca (Chlorophyta) contained all essential amino acids, accounting for 42.1–48.4% of TAA. Because essential amino acids accounted for about 40% of total amino acids and the essential amino acid profile was similar to that of egg and soya protein, the researchers concluded that the proteins from the four seaweeds investigated were of excellent quality [74].

3.6. Fatty Acids Profile of Studied Seaweeds

Seaweeds were not a conventional source of energy since their total lipid content was low. In terms of fatty acid content, however, the majority of them were shown to be high in polyunsaturated fatty acids [75]. Environmental and genetic factors play a role in fatty acid concentration variations [76]. Twenty-one components were identified with varying amounts in the four seaweeds studied in terms of fatty acid composition. Saturated fatty acids (SFA) were found in abundance in the seaweeds studied, according to the fatty acid analyses (Table 3). Red algae exhibited a high percentage of saturated fatty acids (SFA) than brown algae. L. obtusa recorded the highest percentage, 75.2% of TFA, followed by S. scinaioides (70.9%), while brown species (T. ornata) contain the lowest content of the total saturated fatty acids (65.48% of TFA). These findings are consistent with prior study El-Shenody et al. [37], which revealed SFAs to constitute the dominant percentage of total fatty acids in seaweeds.
The seaweeds investigated included 10 saturated fatty acids (SAF). The predominant saturated fatty acids (SAF) detected in all seaweed species with varying percentages were palmitic acid (C16:0) and myristic acid (C14:0). The greatest percentages of palmitic acid (C16:0) were shown in S. scinaioides (35.63% of TFA), which is consistent with the previous study [77]. Palmitic acid was also the major SFA fraction in Porphyra spp. and Palmaria spp. [76], Gellidum micropterum [78], and Gracillaria changii (Rhodophyta) [72].
In the four species studied, six monounsaturated fatty acids (MUFA) were found: Myristoleic acid (C14:1), Cis-10-pentadecenoic (C15:1), palmitoleic acid (C16:1), oleic acid (ω9) (C18:1), Cis-11-Eicosenoic (C20: 1 ω9), and erucic acid (C22: 1 ω9), the brown seaweeds had the highest proportion of monounsaturated fatty acids (MUFA), whereas the red seaweeds had the lowest. These fatty acids constituted (27.51%) in T. ornata, followed by P. indica and S. scinaioides (24%) and then L. obtusa (19.73%) of TFA content. These findings were consistent with [41,79]. Oleic acid (ω9) (C18:1) and palmitoleic acid (C16:1ω7) were the most predominant monounsaturated fatty acids (MUFA), which agrees with Ismail et al. [80].
Oleic acid has the highest percentage of MUFA in brown seaweeds (P. indica and T. ornata), in accordance with the results of CAF et al. [77], reported that in brown algae (Toania atomaria and Padina pavonica), oleic acid made up the largest portion of the MUFA. Five polyunsaturated essential fatty acids (PUFA) were appeared in (Table 3) C18:2ω6 (linoleic acid), C18:3 ω3 (α-linolenic acid), C20:4 ω6 (arachidonic acid), C20:5 ω3 (Eicosapentaenoic acid) and C22:6 ω3 (Docosahexaenoic acid). Brown species (T. ornata and P. indica) attained the highest percent of the total polyunsaturated fatty acids, followed by red species S. scinaioides and L. obtusa recorded the lowest percent. The amount of α-Linolenic acid and linoleic acid in the studied seaweeds was notably higher than those reported in Porphyra sp. and Palmaria sp. (Table 3).
The original value of 1 for the ω6/ω3 ratio involved the balance of intake of both PUSFA ω6 and ω3 fatty acids [79]. The ratio of ω6/ω3 was 0.78, 0.74, 0.70, and 0.33 for P. indica, T. ornata, L. obtusa, and S. scinaioides, respectively.
This ratio should not exceed 10 in diets, according to the World Health Organization (WHO) [76], meaning that the seaweeds under investigation are edible after further research.
Diverse levels of ω3 fatty acids may explain why the seaweeds studied are used in different ways to reduce the risk of multiple sclerosis, inflammation, diabetes, cancer, and coronary heart disease.
According to Simopoulos [81], omega-3 fatty acids provide health benefits, including benefits for inflammatory bowel disease, cancer, psoriasis, and rheumatoid arthritis. In recent academic publications, the relevance of the ω6/ω3 ratio has been severely debated. PUFAs were found to play an important role in cell and tissue metabolism, such as controlling cell membrane fluidity, electron and oxygen transport, and thermal adaptation, and may lower the risk of coronary heart disease [82]. The fatty acid pattern of L. obtusa was nearly identical to that of Porphyra sp., but higher in total saturated and monounsaturated fatty acids and lower in palmitic acid (SFA). The species L. obtusa contains the highest percentage of the total fatty acids, while T. oranta has the lowest content of the total fatty acids.
These results conformed to Francavilla et al. [79] and Ismail [41], who stated that the saturated fatty acids constituted 70.01% of the total fatty acids. As compared with MUFA and PUFA, the SAF ratios of the four tested algae are relatively high [51].

4. Conclusions

The nutritional contents and antioxidant capacity of the Red Sea brown and red seaweeds, Polycladia indica, Turbinaria ornata, Laurencia obtusa, and Sarconema scinaioides were investigated and compared to those of various other seaweeds and local vegetables. The present study reveals the potent antioxidant properties of the studied seaweeds, especially brown seaweeds. The brown seaweeds are indicated to possess a high amount of carbohydrates, protein as well as amino acids compared to the red seaweeds. Red seaweeds are a rich source of vitamin C, lipids, and fatty acids. The presence of these compounds in high concentrations might indicate a possible pathway for these seaweeds to be used as a raw material in food processing and therapeutic industries to make inventive nutritive products.

Author Contributions

A.A.M.F.: Conceptualization, methodology, validation, formal analysis, investigation, data curation, and writing, M.M.E.-S.: writing, review, and editing, Z.M.A.-H.: review, editing, and funding acquisition. All authors have read and agreed to the published version of the manuscript.

Funding

This research received no external funding.

Institutional Review Board Statement

Not applicable.

Informed Consent Statement

Not applicable.

Conflicts of Interest

The authors declare no conflict of interest.

References

  1. Manzelat, F.S.; Mohammed, M.A.; Ahmed, H.B.; Ali, H.N.; Shuqaiq, A.; Huraidha, A.; Qahma, A.; Birk, A. Macro algae of the Red Sea from Jizan, Saudi Arabia. Phykos 2018, 48, 88–108. [Google Scholar] [CrossRef]
  2. McDermid, K.J.; Stuercke, B. Nutritional composition of edible Hawaiian seaweeds. J. Appl. Phycol. 2003, 15, 513–524. [Google Scholar] [CrossRef]
  3. Kumari, P.; Kumar, M.; Gupta, V.; Reddy, C.; Jha, B. Tropical marine macroalgae as potential sources of nutritionally important PUFAs. Food Chem. 2010, 120, 749–757. [Google Scholar] [CrossRef]
  4. Valentina, J.; Poonguzhali, T.V.; Josmin Laali Nisha, L.L.; Sumathi, E. Estimation of protein, carbohydrate, and mineral content in selected seaweeds. Int. J. Curr. Res. 2015, 7, 11329–11333. [Google Scholar]
  5. Zubia, M.; Robledo, D.; Freile-Pelegrin, Y. Antioxidant activities in tropical marine macroalgae from the Yucatan Peninsula, Mexico. J. Appl. Phycol. 2007, 19, 449–458. [Google Scholar] [CrossRef]
  6. Jaswir, I.; Mansur, H.A. Anti-inflammatory compounds of macro algae origin: A review. J. Med. Plant Res. 2011, 5, 7145–7156. [Google Scholar]
  7. Bonanno, G.; Orlando-Bonaca, M. Trace elements in Mediterranean seagrasses and macroalgae. Rew. Sci. Total Environ. 2018, 618, 1152–1159. [Google Scholar] [CrossRef] [PubMed]
  8. Škrovánková, S. Seaweed vitamins as nutraceuticals. Adv. Food Nutr. Res. 2011, 64, 357–369. [Google Scholar] [PubMed]
  9. Halliwell, B. Food-derived antioxidant evaluating their importance in food and in vivo. Food Sci. Agric. Chem. 1999, 1, 67–109. [Google Scholar]
  10. Gupta, S.; Abu-Ghannam, N. Recent development in the application of seaweeds or seaweed extracts as a means for enhancing the safety and quality attributes of foods. Innov. Food Sci. Emerg. Tecnol. 2011, 12, 600–609. [Google Scholar] [CrossRef]
  11. Heo, S.J.; Park, E.J.; Lee, K.W.; Jeon, Y.J. Antioxidant activities of enzymatic extracts from brown seaweeds. Bioresour. Technol. 2005, 96, 1613–1623. [Google Scholar] [CrossRef]
  12. Collins, K.G.; Fitzgerald, G.F.; Stanton, C.; Ross, R.P. Looking beyond the terrestrial: The potential of seaweed derived bioactives to treat non-communicable diseases. Mar. Drugs 2016, 14, 1–31. [Google Scholar] [CrossRef] [Green Version]
  13. Chakraborty, K.; Joseph, D.; Praveen, N.K. Antioxidant Activities and Phenolic Contents of Three Red Seaweeds (Division: Rhodophyta) Harvested from the Gulf of Mannar of Peninsular India. J. Food Sci. Technol. 2015, 52, 1924–1935. [Google Scholar] [CrossRef] [PubMed] [Green Version]
  14. Draisma, S.G.A.; Ballesteros, E.; Fousseau, F.; Thibaut, T. DNA Sequence Data Demonstrate the Polyphyly of the Genus Cystoseira and Other Sargassaceae Genera (Phaeophyceae). J. Phycol. 2010, 46, 1329–1345. [Google Scholar] [CrossRef]
  15. Guiry, M.D.; Guiry, G.M. AlgaeBase. National University of Ireland: Galaway, Ireland, 2011. Available online: http://www.algaebase.org (accessed on 1 November 2021).
  16. Dubois, M.; Gilles, K.A.; Hamilton, J.K.; Reborsand, P.A.; Smith, F. Calorimetric method for determination of sugars and related substances. Anal. Chem. 1956, 28, 350–356. [Google Scholar] [CrossRef]
  17. Lowry, O.H.; Rosebrough, N.J.; Farr, A.L.; Randall, R.J. Protein Measurement with the Folin Phenol Reagent. J. Biol. Chem. 1951, 193, 265–275. [Google Scholar] [CrossRef]
  18. Pak, N.; Araya, H. Valor nutritivo y aportes de fibra diete ’tica (soluble e insoluble) de microalgas comestibles de Chile, crudas y cocidas. Alimentos 1996, 21, 63–69. [Google Scholar]
  19. Karthick, P.; Siva Sankar, R.; Kaviarasan, T.; Mohanraju, R. Ecological implications of trace metals in seaweeds: Bio-indication potential for metal contamination in Wandoor, South Andaman Island. Egypt. J. Aquat. Res. 2012, 38, 227–231. [Google Scholar] [CrossRef] [Green Version]
  20. Bligh, E.G.; Dyer, W.J. A rapid method of total lipid extraction and purification. Can. J. Biochem. Physiol. 1959, 37, 911–917. [Google Scholar] [CrossRef] [PubMed]
  21. Radwan, S.S. Coupling of two-dimensional thin-layer chromatography with gas chromatography for the quantitative analysis of lipid classes and their constituent fatty acids. J. Chromatogr. Sci. 1978, 16, 538–542. [Google Scholar] [CrossRef]
  22. Walker, S.K.; Hill, J.L.; Kleemann, D.O.; Nancarrow, C.D. Development of ovine emberyos in synthetic oviductal fluid containing amino acids at oviductal fluid concentrations. Biol. Reprod. 1996, 55, 703–708. [Google Scholar] [CrossRef] [PubMed] [Green Version]
  23. Singleton, V.L.; Rossi, J.A. Colorimetry of total phenolics with phosphomolybdic-phosphotungstic acid reagents. Am. J. Enol. Vitic. 1965, 6, 144–158. [Google Scholar]
  24. Zhishen, J.; Mengcheng, T.; Jianming, W. The determination of flavonoid contents in mulberry and their scavenging effects on superoxide radicals. Food Chem. 1999, 64, 555–559. [Google Scholar] [CrossRef]
  25. Abushita, A.A.; Hebshi, E.A.; Daood, H.G.; Biacs, P.A. Determination of antioxidant vitamins in tomatoes. Food Chemis. 1997, 60, 207–212. [Google Scholar] [CrossRef]
  26. Tee, E.; Kuladevan, R.; Young, S.; Khor, S.; Zakiyah, H. Laboratory Procedures in Nutrient Analysis of Foods. Inst. Med Res. 1996, 82. [Google Scholar]
  27. Ismail, A.; Fun, C.S. Determination of vitamin C, β-carotene and riboflavin contents in five green vegetables organically and conventionally grown. Malays. J. Nutr. 2003, 9, 31–39. [Google Scholar]
  28. Yen, G.C.; Chen, H.Y. Antioxidant activity of various tea extracts in relation to their antimutagenicity. Agric. Food Chem. 1995, 43, 27–32. [Google Scholar] [CrossRef]
  29. Prieto, P.; Pineda, M.; Aguilar, M. Spectrophotometric quantitation of antioxidant capacity through the formation of a phosphomolybdenum complex: Specific application to the determination of vitamin E. Anal. Biochem. 1999, 269, 337–341. [Google Scholar] [CrossRef]
  30. Dyaizu, M. Studies on products of browning reaction- antioxidative activities of products of browning reaction prepared from glucosamine. Jpn. J. Nutr. 1986, 44, 307–315. [Google Scholar]
  31. Kuda, T.; Kunii, T.; Goto, H.; Suzuki, T.; Yano, T. Varieties of antioxidant and antibacterial properties of Ecklonia stolonifera and Ecklonia kurome products harvested and processed in the Noto peninsula, Japan. Food Chem. 2007, 103, 900–905. [Google Scholar] [CrossRef]
  32. Kohen, R.; Nyska, A. Invited review: Oxidation of biological systems: Oxidative stress phenomena, antioxidants, redox reactions, and methods for their quantification. Toxicol. Pathol. 2002, 30, 620–650. [Google Scholar] [CrossRef] [Green Version]
  33. Kurniawati, I.; Maftuch, M.; Hariati, A.M. Determination of the best solvent and extract duration on the technique of Gracilaria sp. maceration as well as its influence on moisture content and yield. Samakia J. Ilmu Perikan. 2016, 7, 72–77. [Google Scholar]
  34. Manam, V.K.; Subbaiah, M. Phytochemical, amino acid, fatty acid and vitamin investigation of marine seaweeds Colpomenia sinuosa and Halymenia porphyroides collected along Southeast Coast of Tamilnadu, India. World J. Pharm. Res. 2020, 9, 1088–1102. Available online: https://ssrn.com/abstract=3565775 (accessed on 1 November 2021). [CrossRef]
  35. Sarojini, Y.; Lakshminarayana, K.; Seshagiri Rao, P. Variations in Distribution of Flavonoids in Some Seaweed of Visakhapatnam Coast of India. Der Pharma Chem. 2012, 4, 1481–1484. [Google Scholar]
  36. Kokilam, G.; Vasuki, S. Biochemical and phytochemical analysis on Ulva fasciata and Caulerpa taxifolia. Int. J. Pharm. Pharm. Sci. Res. 2014, 4, 7–11. [Google Scholar]
  37. El-Shenody, R.A.; Ashour, M.; Ghobara, M.M. Evaluating the chemical composition and antioxidant activity of three Egyptian seaweeds: Dictyota dichotoma, Turbinaria decurrens, and Laurencia obtusa. Braz. J. Food Technol. 2019, 22, 1–15. [Google Scholar] [CrossRef] [Green Version]
  38. Dewi, Y.S.K.; Karunia, C.J.K.; Fadly, D. Antioxidant and Antimicrobial Activities of Methanolic Extracts of Scorodocarpus borneensis. Becc. Syst. Rev. Pharm. 2020, 11, 246–252. [Google Scholar]
  39. Parthiban, C.; Saranya, C.; Girija, K.; Hemalatha, A.; Suresh, M.; Anantharaman, P. Biochemical composition of some selected seaweeds from Tuticorin coast. Adv. Appl. Sci. Res. 2013, 4, 362–366. [Google Scholar]
  40. El-Sheekh, M.M.; El-Shenddy, R.A.; Bases, E.A.; El Shafay, S.M. Comparative assessment of antioxidant activity and biochemical composition of four seaweeds, Rocky Bay of Abu Qir in Alexandria, Egypt. Food Sci. Technol. Campinas. 2020, 41, 29–40. [Google Scholar] [CrossRef]
  41. Ismail, G.A. Biochemical composition of some Egyptian seaweeds with potent nutritive and antioxidant properties. Food Sci. Techno. 2017, 37, 294–302. [Google Scholar] [CrossRef] [Green Version]
  42. Al-Dabbas, M.M. Antioxidant activity of different extracts from the aerial part of Moringa peregrina (Forssk.) Fiori, from Jordan. Pak. J. Pharm. Sci. 2017, 30, 2151–2157. [Google Scholar]
  43. Apak, R.; Özyürek, M.; Güçlü, K.; Çapanoğlu, E. Antioxidant Activity/Capacity Measurement. 1. Classification, Physicochemical Principles, Mechanisms, and Electron Transfer (ET)-Based Assays. J. Agric. Food Chem. 2016, 10, 997–1027. [Google Scholar] [CrossRef]
  44. Yaich, H.; Garna, H.; Besbes, S.; Paquot, M.; Blecker, C.; Attia, H. Chemical composition and functional properties of Ulva lactuca seaweed collected in Tunisia. Food Chem. 2011, 128, 895–901. [Google Scholar] [CrossRef]
  45. Roy, S.; Anantharaman, P. Biochemical Compositions of Seaweeds Collected from Olaikuda and Vadakkadu, Rameshwaram, Southeast Coast of India. J. Marine Sci. Res. Dev. 2017, 7, 240. [Google Scholar] [CrossRef] [Green Version]
  46. Kuda, T.; Ikemori, T. Minerals, polysaccharides and antioxidant properties of aqueous solutions obtained from macroalgal beachcasts in the Noto Peninsula, Ishikawa, Japan. Food Chem. 2009, 112, 575–581. [Google Scholar] [CrossRef]
  47. Ramu Ganesan, A.; Subramani, K.; Shanmugam, M.; Seedevi, P.; Park, S.; Alfarhan, A.H.; Rajagopal, R.; Balasubramanian, B. A comparison of nutritional value of underexploited edible seaweeds with recommended dietary allowances. J. King Saud. Univ. Sci. 2020, 32, 1206–1211. [Google Scholar] [CrossRef]
  48. FAO; WHO. Human Vitamin and Mineral Requirements. Report of a Joint FAO/WHO Expert Consultation Bangkok, Thailand; Food and Agriculture Organization of the United Nations: Rome, Italy, 2001; pp. 235–247. [Google Scholar]
  49. Gressler, V.; Yokoya, N.S.; Fujii, M.T.; Colepicolo, P.; Filho, J.M.; Torres, R.P.; Pinto, E. Lipid, fatty acid, protein, amino acid and ash contents in four Brazilian red algae species. Food Chem. 2010, 120, 585–590. [Google Scholar] [CrossRef]
  50. Burtin, P. Nutritional value of seaweeds. Elec. J. Environ. Agric. Food Chem. 2003, 2, 498–503. [Google Scholar]
  51. Gosch, B.J.; Magnusson, M.; Paul, N.A.; Nys, R.D. Total lipid and fatty acid composition of seaweeds for the selection of species for oil-based biofuel and bioproducts. Glob. Change Biol. 2012, 4, 919–930. [Google Scholar] [CrossRef] [Green Version]
  52. WHO; FAO. Vitamin and Mineral Requirements in Human Nutrition; WHO: Geneva, Switzerland, 2004. [Google Scholar]
  53. Kasimala, M.; Mogos, G.G.; Negasi, K.T.; Bereket, G.A.; Abdu, M.M.; Melake, H.S. Biochemical composition of selected seaweeds from intertidal shallow waters of Southern Red Sea, Eritrea. Indian J. Mar. Sci. 2020, 49, 1153–1157. [Google Scholar]
  54. Venugopal, V. Marine Polysaccharides, Food Applications; CRC Press: New York, NY, USA, 2011; pp. 93–95. [Google Scholar]
  55. Nunraksa, N.; Rattanasansri, S.; Praiboon, J.; Chirapart, A. Proximate composition and the production of fermentable sugars, levulinic acid, and HMF from Gracilaria fisheri and Gracilaria tenuistipitata cultivated in earthen ponds. J. Appl. Phycol. 2019, 31, 683–690. [Google Scholar] [CrossRef]
  56. Offei, F.; Mensah, M.; Kemausuor, F.; Thygesen, A.A. biorefinery approach to bioethanol and bioelectricity co-production from tropical seaweeds. J. Appl. Phycol. 2019, 31, 3899–3913. [Google Scholar] [CrossRef]
  57. Peñalver, R.; Lorenzo, J.M.; Ros, G.; Amarowicz, R.; Pateiro, M.; Nieto, G. Seaweeds as a functional ingredient for a healthy diet. Mar. Drugs 2020, 18, 301. [Google Scholar] [CrossRef]
  58. Ruperez, P. Mineral content of edible marine Seaweeds. Food Chem. 2002, 79, 23–36. [Google Scholar] [CrossRef]
  59. Rasyid, A.; Ardiansyah, A.; Pangestuti, R. Nutrient Composition of Dried Seaweed Gracilaria gracilis. Indones. J. Mar. Sci. 2019, 24, 1–6. [Google Scholar] [CrossRef]
  60. Ivanovitch, K.; Klaewkla, J.; Chongsuwat, R.; Viwatwongkasem, C.; Kitvorapat, W. The intake of energy and selected nutrients by Thai urban sedentary workers: An evaluation of adherence to dietary recommendations. J. Nutrit. Metab. 2014. [Google Scholar] [CrossRef] [PubMed] [Green Version]
  61. Fouda, W.A.; Ibrahim, W.M.; Ellamie, A.M.; Ramadan, G. Biochemical and mineral compositions of six brown seaweeds collected from Red Sea at Hurghada Coast. Indian J. Geo-Mar. Sci. 2019, 48, 484–491. [Google Scholar]
  62. Insel, P.; Ross, D.; McMahon, K.; Bernstein, M. Nutrition, 3rd ed.; Jones and Bartlett Publishers: Burlington, MA, USA, 2007. [Google Scholar]
  63. Rodrigues, D.; Freitas, A.C.; Pereira, L.; Rocha-Santos, T.A.P.; Vasconcelos, M.W.; Roriz, M.; Rodríguez-Alcalá, L.M.; Gomes, A.M.P.; Duarte, A.C. Chemical composition of red, brown and green macroalgae from Buarcos bay in Central West Coast of Portugal. Food Chem. 2015, 183, 197–207. [Google Scholar] [CrossRef] [PubMed]
  64. Smith, J.; Summers, G.; Wong, R. Nutrient and heavy metal content of edible seaweeds in New Zealand. N. Z. J. Crop. Hort. 2010, 38, 19–28. [Google Scholar] [CrossRef]
  65. Moreiras, O.; Carbajal, Á.; Cabrera, L.; Cuadrado, C. Tablas de Composición de Alimentos, 7th ed.; Moreiras, O., Carbajal, Á., Cabrera, L., Cuadrado, C., Eds.; Ediciones Pirámide: Madrid, Spain, 2003. [Google Scholar]
  66. Munda, I.M.; Hudnik, V. Trace metal content in some seaweeds from the northern Adriatic. Bot. Mar. 1991, 34, 241–249. [Google Scholar] [CrossRef]
  67. Kiss, S.A.; Forster, T.; Dongo, A. Absorption and effect of the magnesium content of a mineral water in the human body. J. Am. Coll. Nutr. 2004, 23, 758S–762S. [Google Scholar] [CrossRef]
  68. Oucif, H.; Benaissa, M.; Mehidi, S.A.; Prego, R.; Aubourg, S.P.; El-Amine Abi-Ayad, S.M. Chemical composition and nutritional value of different seaweeds from the West Algerian Coast. J. Aquat. Food Prod. Technol. 2020, 29, 90–104. [Google Scholar] [CrossRef]
  69. Galland-Irmouli, A.V.; Fleurence, J.; Lamghari, R.; Luçon, M.; Rouxel, C. Nutritional value of proteins from edible seaweed Palmaria palmata (Dulse). J. Nutrit. Biochem. 1999, 10, 353–359. [Google Scholar] [CrossRef]
  70. Dawczynski, C.; Schubert, R.; Jahreis, G. Amino acids, fatty acids, a dietary fibre in edible seaweeds products. Food Chem. 2007, 103, 891–899. [Google Scholar] [CrossRef]
  71. Cian, R.E.; Drago, S.R.; de Medina, F.S.; Martínez-Augustin, O. Proteins and carbohydrates from red seaweeds: Evidence for beneficial effects on gut function and microbiota. Mar. Drugs 2015, 13, 5358–5383. [Google Scholar] [CrossRef] [PubMed] [Green Version]
  72. Norziah, M.H.; Ching, C.Y. Nutritional composition of edible seaweed Gracilaria changgi. Food Chem. 2000, 68, 69–76. [Google Scholar] [CrossRef]
  73. Wong, K.H.; Cheung, C.K. Nutritional Evaluation of Some Subtropical Red and Green Seaweeds Part I: Proximate Composition, Amino Acid Profiles and Some Physicochemical Properties. Food Chem. 2000, 71, 475–482. [Google Scholar] [CrossRef]
  74. Ratana-Arporn, P.; Chirapart, A. Nutritional Evaluation of Tropical Green Seaweeds Caulerpa Lentillifera and Ulva Reticulate. Kasetsart. J. Nat. Sci. 2006, 40, 75–83. [Google Scholar]
  75. Darcy-Vrillon, B. Nutritional aspects of the developing use of marine macroalgae for the human food industry. Int. J. Food Sci. Nutr. 1993, 44, 23–35. [Google Scholar]
  76. Sánchez -Machado, D.I.; Lopez-Cervantes, J.; Lopez-Hernandez, J.; Paseiro-Losada, P. Fatty acids, total lipid, protein and ash contents of processed edible seaweeds. Food Chem. 2004, 85, 439–444. [Google Scholar] [CrossRef]
  77. CAF, F.; Yilmaz, Ö.; Durucan, F.; Özdemir, N.Ş. Biochemical components of three marine macroalgae (Padina pavonica, Ulva lactuca and Taonia atomaria) from the Levantine sea coast of antalya, Turkey. J. Biol. Environ. Sci. 2015, 6, 401–411. [Google Scholar]
  78. Venkatesalu, V.; Sundaramoorthy, P.; Anantharaj, M.; Gopalakrishnan, M.; Chandrasekaran, M. Studies on the fatty acid composition of marine Algae of Rameswaram coast. Seaweed Res. Util. 2004, 26, 83–86. [Google Scholar]
  79. Francavilla, M.; Franchi, M.; Monteleone, M.; Caroppo, C. The red seaweed Gracilaria gracilis as a multi products source. Mar. Drugs 2013, 11, 3754–3776. [Google Scholar] [CrossRef] [PubMed] [Green Version]
  80. Ismail, M.M.; Ismail Abou-Dobara, M.; Abdou Mousa, M.; Refat, N.M. Variation of Fatty Acids and Antioxidants Contents of Vegetarian Rayeb Milk as Affected by Fortification with Natural and Artificial Sweeteners. Clin. Microbiol. Res. 2020, 3, 8–9. [Google Scholar] [CrossRef]
  81. Simopoulos, A.P. Omega-3 fatty acids in inflammation and autoimmune diseases. J. Am. Coll. Nutr. 2002, 21, 495–505. [Google Scholar] [CrossRef] [PubMed]
  82. Mozaffarian, D.; Ascherio, A.; Hu, F.B.; Stampfer, M.J.; Willett, W.C.; Siscovick, D.S.; Rimm, E.B. Interplay between different polyunsaturated fatty acids and risk of coronary heart disease in men. Circulation 2005, 111, 157–164. [Google Scholar] [CrossRef] [PubMed] [Green Version]
Figure 1. Photo of studied seaweeds: (A,B): the brown algae species: Turbinaria ornata and Polycladia indica, (C,D): the red algae species: Laurencia obtusa and Sarconema scinaioides, respectively.
Applsci 11 11079 g001
Figure 2. Total phenol compound (mg GA/g DW, (A)) and flavonoid content (mg CE/g DW, (B)) for studied seaweeds. Values are the mean of three replicates ± standard deviations (SD). Different letters refer to significant differences between species (p < 0.05).
Applsci 11 11079 g002aApplsci 11 11079 g002b
Figure 3. Vitamin C and β-carotene contents (mg/100 g) for studied seaweeds. Values are the mean of three replicates ± standard deviations (SD). Different letters refer to significant differences between species (p < 0.05).
Applsci 11 11079 g003
Figure 4. DPPH radical scavenging activity, total antioxidant capacity (TAC), and total reducing capacity (TRC) of the tested seaweed species are expressed as inhibition percentages. Values are the mean of three replicates ± standard deviations (SD). Different letters refer to significant differences between species (p < 0.05).
Applsci 11 11079 g004
Figure 5. Biochemical composition (% of DW) of the four studied seaweeds. Values are the mean of three replicates ± standard deviations (SD). Different letters refer to significant differences between species (p < 0.05).
Applsci 11 11079 g005
Table 1. Minerals contents (mg/100 g DW) of seaweed species compared to dietary reference intake (mg/day).
MineralsBrown Seaweed Red Seaweedmg/Day
T. ornataP. indicaL. obtusaS. scinaioidesG. gracilis *DRI Male **DRI Female **
Na255.41 ± 0.07 ab283.82 ± 0.06 b102.55 ± 0.03 a213.62 ± 0.02 ab290.89475–1450400–1200
Ca436.39 ± 0.1 ab390.42 ± 0.08 a845.38 ± 0.11 b632.71 ± 0.08 ab429.11800800
K1102.85 ± 0.11 ab1228.73 ± 0.05 b870.58 ± 0.13 ab578.38 ± 0.14 a1380.422450–41002050–3400
Mg266.4 ± 0.21 ab275.45 ± 0.12 b101.2 ± 0.13 a196.81 ± 0.11 abNr310–320250–260
Cd0.41 ± 0.05 ab0.5 ± 0.07 ab0.3 ± 0.05 a0.57 ± 0.01 bNrNrNr
Pb0.03 ± 0.003 b0.02 ± 0.003 ab0.01 ± 0.005 a0.02 ± 0.01 ab
Cu0.15 ± 0.006 ab0.08 ± 0.004 a0.17 ± 0.02 ab0.18 ± 0.0 bNr900/0.9900/0.9
Mn0.67 ± 0.006 b0.62 ± 0.06 ab0.55 ± 0.012 ab0.52 ± 0.025 aNr2.31.8
Zn2.12 ± 0.025 a2.16 ± 0.015 ab4.9 ± 0.05 b3.52 ± 0.013 abNr137
Na/K ratio0.232 ± 0.006 ab0.231 ± 0.001 ab0.118 ± 0.006 a0.369 ± 0.006 bNrNrNr
Ion quotient ratio (in moles) [Ca + Na]/[Mg + K]0.359 ± 0.001 ab0.315 ± 0.002 a0.492 ± 0.006 ab0.743 ± 0002 bNrNrNr
* Rasyid et al. [59]. ** Dietary reference intake: the amount recommended for consumption daily for Thai adults of age 19–50 years [56]. Nr: not reported due to lack of suitable data. Values are means of three replicates ± standard deviations (SD). Different letters refer to significant differences between species (p < 0.05).
Table 2. Amino acid compositions of the studied Phaeophyceae and Rhodophyceae species (g/100 g sample) and profiles (g/100 g amino acid).
Amino AcidsP. indicaT. ornataL. obtusaS. scinaioidesSoya #Egg #
g/100 g Sampleg/100 g Amino Acidg/100 g Sampleg/100 g Amino Acidg/100 g Sampleg/100 g Amino Acidg/100 g Sampleg/100 g Amino Acidg/100 g Amino Acidg/100 g Amino Acid
Essential amino acids
Histidine 0.382.670.322.420.231.930.21.87NDND
Lysine0.654.570.624.690.544.530.464.316.17.0
Isoleucine 0.513.590.473.560.413.440.373.475.15.4
Leucine0.453.170.413.100.363.020.32.817.68.6
Phenylalanine0.825.770.785.900.715.960.76.568.4 (+Tyr)9.3 (+Tyr)
Methionine0.986.900.916.880.816.800.787.31NDND
Valine0.684.790.53.780.463.860.363.375.26.6
Threonine 0.795.560.745.600.635.290.575.344.14.7
∑ Essential Amino acids5.2637.024.7535.934.1534.843.7435.0536.541.6
Non-essential amino acids
Alanine 0.876.120.876.580.826.880.757.03
Arginine0.775.420.725.450.685.710.646.00
Aspartic 1.4710.341.249.381.038.650.979.09
Cysteine 0.855.980.866.510.826.880.757.03
Glutamic 1.6411.541.5111.421.4111.841.049.75
Glycine 0.785.490.725.450.675.630.615.72
Proline 0.986.901.027.720.867.220.837.78
Serine 0.845.910.816.130.776.470.696.47
Tyrosine 0.755.280.725.450.75.880.656.09
∑ Non-essential Amino acids8.9562.988.4764.077.7665.166.9364.95
∑ TAA14.2113.22 11.91 10.67
# Galland-Irmouli et al. [69]. ND: not detected.
Table 3. Fatty acid compositions of the studied Phaeophyceae and Rhodophyceae species (mg/g sample) and profiles (g/100 g fatty acids).
Carbon No.Fatty Acidsmg/g Sampleg/100 g Fatty Acids
P. indicaT. ornataL. obtusaS. cinaioidesP. indicaT. ornataL. obtusaS. scinaioidesPorphyraa sp.Palmariaa sp.G. changii b
Saturated fatty acids (SFA)
C8:0Caprylic acid0.943.012.411.021.384.862.6001.19NDNDND
C10:0Capric acid3.252.841.020.864.774.591.101.0NDNDND
C12:0Lauric acid5.314.522.911.27.797.303.141.4NDNDND
C13:0Tetradecanoic acid2.111.545.213.653.092.495.634.26NDNDND
C14:0Myristic acid4.813.5712.0313.267.055.7613.0015.49NDNDND
C15:0Pentadecylic acid2.542.313.612.133.723.733.902.49
C16:0Palmitic acid18.0315.6826.0530.7226.4425.3228.1435.6363.1945.4422.0
C18:0Stearic acid3.942.746.514.125.784.427.034.781.231.28ND
C20:0Arachidic acid3.271.819.874.024.802.9210.664.66NDNDND
C22:0Behenic acid2.362.53NDND3.464.09NDND
∑ SFAs46.5640.5569.6260.9868.2865.4875.270.964.4246.7222
Monounsaturated fatty acids (MUFA)
C14:1Myristoleic acid2.953.713.253.414.335.993.513.98NDNDND
C15:1Cis-10-Pentadecenoic2.053.212.253.173.015.182.433.7
C16:1palmitoleic acid3.144.315.024.284.66.965.425.06.225.26ND
C18:1Oleic acid6.575.253.984.679.638.484.34.456.73.1321.9
C20: 1 ω9Cis-11-Eicosenoic1.87ND2.712.252.740.0002.932.634.70.20ND
C22: 1 ω9Erucic acidND0.561.0503.050.0000.91.133.56
∑ MUFA 16.5817.0418.2620.8324.3127.5119.7324.1617.628.5921.9
Polyunsaturated fatty acids (PUFA)
C18:2ω6Linoleic acid 1.091.020.981.081.61.651.061.251.170.69ND
C18:3ω3α-Linolenic acid1.210.961.041.541.771.551.121.790.230.59ND
C20:4 ω6Arachidanoic acid1.130.820.9501.661.321.0306.81.45ND
C20:5 ω3Eicosapentaenoic acid1.081.541.040.911.582.491.121.066.0324.0533.1
C20:6 ω3Docosahexaenoic acid 0.54ND0.670.870.79000.721.01NDND12.9
∑ PUFA 5.054.344.684.47.417.015.065.114.2326.7846.0
∑ PUFA (ω6) 2.221.841.931.083.262.952.081.257.972.140
∑ PUFA (ω3) 2.832.52.753.324.154.032.973.856.2624.6446
Ratio ω6/ω3 0.780.740.700.33 1.270.090
∑ TFA 68.1961.9392.5686.21 96.2782.0989.9
a Sánchez-Machado et al. [76]. b Norziah and Ching [72]. ND: Not detected.
Publisher’s Note: MDPI stays neutral with regard to jurisdictional claims in published maps and institutional affiliations.

