Article

Fluorescence Spectroscopy of Enantiomeric Amide Compounds Enforced by Chiral Light

Dipartimento di Scienze di Base ed Applicate per l’Ingegneria, Sapienza Università di Roma, Via A. Scarpa 14, I-00161 Rome, Italy
*
Authors to whom correspondence should be addressed.
Submission received: 5 November 2021 / Revised: 27 November 2021 / Accepted: 29 November 2021 / Published: 1 December 2021
(This article belongs to the Special Issue Optical Chirality: Structures, Detection and Applications)

Abstract

:

Featured Application

Fluorescence-detected circular dichroism in novel molecules.

Abstract

Chirality, the absence of mirror symmetry, governs behavior in most biologically important molecules, thus making the chiral recognition of great importance in the pharmaceutical and agrochemical industries, as well as medicine. Chiral molecules can be characterized by means of optical experiments based on chiro-optical excitation of molecules. Specifically, chiral absorptive materials differently absorb left- and right-circular polarized light, i.e., they possess circular dichroism (CD). Unfortunately, the natural CD of most molecules is very low and lies in the ultraviolet range. Fluorescence-detected CD is a fast and sensitive tool for investigation of chiral molecules which emit light; ultralow CD in absorption can be detected as the difference in emission. In this work, we perform fluorescence-detected CD on novel chiral amide compounds, designed specifically for visible green emission; we synthesize two enantiomeric fluorescent compounds using low-cost starting compounds and easy purification. We investigate different solutions of the enantiomers at different concentrations, and we show that the fluorescence of the intrinsically chiral compounds depends on the polarization state of the penetrating light, which is absorbed at 400 nm and emits across the green wavelength range. We believe that these compounds can be coupled with plasmonic nanostructures, which further shows promise in applications regarding chiral sensing or chiral emission.

1. Introduction

Chirality, the lack of the mirror symmetry, is a general property found in nature, governing biochemical reactions of most important molecules. Chiral molecules come in two types, R- and S-, and these are called enantiomers. Even though the two enantiomers have the same atomic formula and the same physical properties, their interaction with the environment (e.g., human body) can be dramatically divergent. Indeed, they can follow different metabolic pathways; while one enantiomer acts as a drug, the other one can be inactive or even induce serious side-effects [1,2]. The intrinsic lack of mirror symmetry leads to the differential absorption when the chiral molecule is excited by left- and right-circular polarized light (LCP and RCP, respectively); this property is called electronic circular dichroism (ECD). ECD spectroscopy is conventionally used in investigations of configurational and conformational properties of organic molecules [3,4,5,6,7]; specifically, it was shown to be a powerful tool for probing the 3D structure of proteins and their secondary-structure analysis [8]. Unfortunately, a vast majority of biochemical systems exhibit low ECD in the ultraviolet range; specifically, pharmacologically relevant small chiral molecules such as naproxen [9], thalidomide, ibuprofen, methamphetamine [10], and ephedrine [11] have circular dichroism (CD) bands between 200 and 300 nm, which practically complicates the ECD measurements. Moreover, in complex systems containing more chiral molecules, addressing the ECD target of interest can be challenging.
In attempt to increase the sensitivity of CD measurements and extend the signal detection to the more practical visible and near-infrared range, researchers have developed methods which involve CD revelation through fluorescence. In chiral compounds exhibiting fluorescence, CD coming from differential absorption of circular polarizations can be measured as a differential fluorescence intensity resulting from that differential absorption. This technique is called fluorescence-detected circular dichroism (FDCD), and it is based on the fact that the amount of the light emission directly depends on the light absorption [12]. Therefore, it is an indirect measurement of the absorption CD at the wavelength which is used for the excitation of fluorescence. Being a fluorescence-based characterization, FDCD was expected to offer higher sensitivity and specificity of chiral detection. It was previously applied in the detection of structural change in the tertiary structure of metmyoglobin [13], as well as in exciton-coupled stereochemical analysis [14,15], and it was proposed for measurements of the enantiomeric excess in substances containing randomly orientated absorbing molecules [16]; moreover, FDCD was used in attempts to detect single-molecule chirality [17,18,19]. Another application of FDCD was to study the CD of chiral Eu(III) complexes, where conventional CD would require high concentrations and high material volume [20].
However, it can be noted that, since the first FDCD experiments [12], there has only been a limited number of papers reporting on FDCD applications. This is due to the experimental problems including instrumentation artefacts and, again, the very low absorption CD, which would induce the fluorescence difference. Only very recently, Prabodh et al. proved that FDCD offers chiral characterization of supramolecular host–guest complexes at much lower concentrations compared to ECD [21]. On the other hand, the nanophotonic community proposed the use of resonant nanostructured materials as substrates for chiral sensing, where the near-fields at the resonances enhance the molecular absorption. By electromagnetic confinement at the nanoscale, nanostructures can enhance and control chiral near-fields [22,23,24,25,26,27], potentially providing the enantioselective enhancement of the absorption rates of nearby molecules. After a number of numerical proposals, this idea was experimentally demonstrated very recently by Solomon et al. [28], using background-free FDCD to demonstrate the enhancement of intrinsic molecular CD due to the coupling of chiral molecules with a resonant metasurface based on Si nanodiscs. These recent studies will surely contribute to the revival of FDCD-based characterizations and the sensitivity improvements by means of combination with nanophotonics.
In this work, we report on FDCD measurements done on novel chiral amide compounds. We specifically design chiral compounds to exhibit circular dichroism in the ultraviolet range and emit in the visible green range. The choice of this design is due to two reasons; firstly, proof-of-concept FDCD measurements of new solutions are experimentally easier in the visible range, and, secondly, we were led by the recent reports of chirality in nanostructured substrates in the visible range [29,30], which have potential for coupling with emitting molecules in future. The synthesis is based on affordable starting compounds, mild reactions, and easy purification, which result in two pure enantiomeric compounds R-FA1 and S-FA1. We then investigate different solutions and mixtures of the enantiomers by means of a FDCD setup. Different polarization states of a laser light at 400 nm are differently absorbed, and the according difference is monitored through the intensity of green fluorescence. We believe that the reported FDCD signals of these compounds can be further investigated via coupling with plasmonic nanostructures, thus opening new pathways toward enhanced chiral sensing applications.

2. Materials and Methods

All reagents (9-oxo-9H-fluorene-2-carboxylic acid, 1,1′-carbonyldiimidazole CDI, (R)-1-phenylethanamine, (S)-1-phenylethanamine), solvents (ethyl acetate AcOEt, petroleum ether), and deuterated solvents (dimethyl sulfoxide DMSO-d6, dimethyl formamide DMF-d7) were of high analytical grade and were purchased from Sigma-Aldrich (St. Louis, MO, USA).
1H- and 13C-NMR spectra were acquired on AVANCE400 Bruker spectrometer, operating at 400 and 100 MHz respectively, in DMSO-d6 and in DMF-d7 at 27 °C; chemical shift values are given in δ (ppm) relatively to TMS as internal reference. Coupling constants are given in Hz. The following abbreviations are used: s = singlet, d = doublet, t = triplet, m = multiplet.
IR spectra were recorded on a FT-IR Perkin-Elmer Spectrum One equipped with an ATR system; signals are given as ν (cm−1).
GC–MS analyses were performed using a Perkin-Elmer GC Clarus 500 system and gas chromatograph interfaced to a mass spectrometer (GC–MS) equipped with a Restek RTX-1, fused silica capillary column (60 m × 0.25 mm ID, 0.25 μm df, composed of 100% dimethylpolysiloxane). For GC–MS detection, an electron ionization system with ionizing energy of 70 eV was used. Helium gas was used as the carrier gas at a constant flow rate of 1 mL/min, and 1 μL of a 10−5 M sample solution in DMF was injected. The inlet line and the ion-source temperatures were 200 °C and 180 °C, respectively. The oven temperature was programmed from 70 °C for 1 min, with an increase of 10 °C/min up to 180 °C for 6 min, then 10 °C/min up to 270 °C, ending with a 43 min isothermal hold at 270 °C.
Optical rotations were measured on a Jasco DIP-370 digital polarimeter. The c values are expressed in g/100 mL. αobs was registered 10 times per sample, and [α]20D was calculated considering the mean value. The cell length was 0.10 dm.

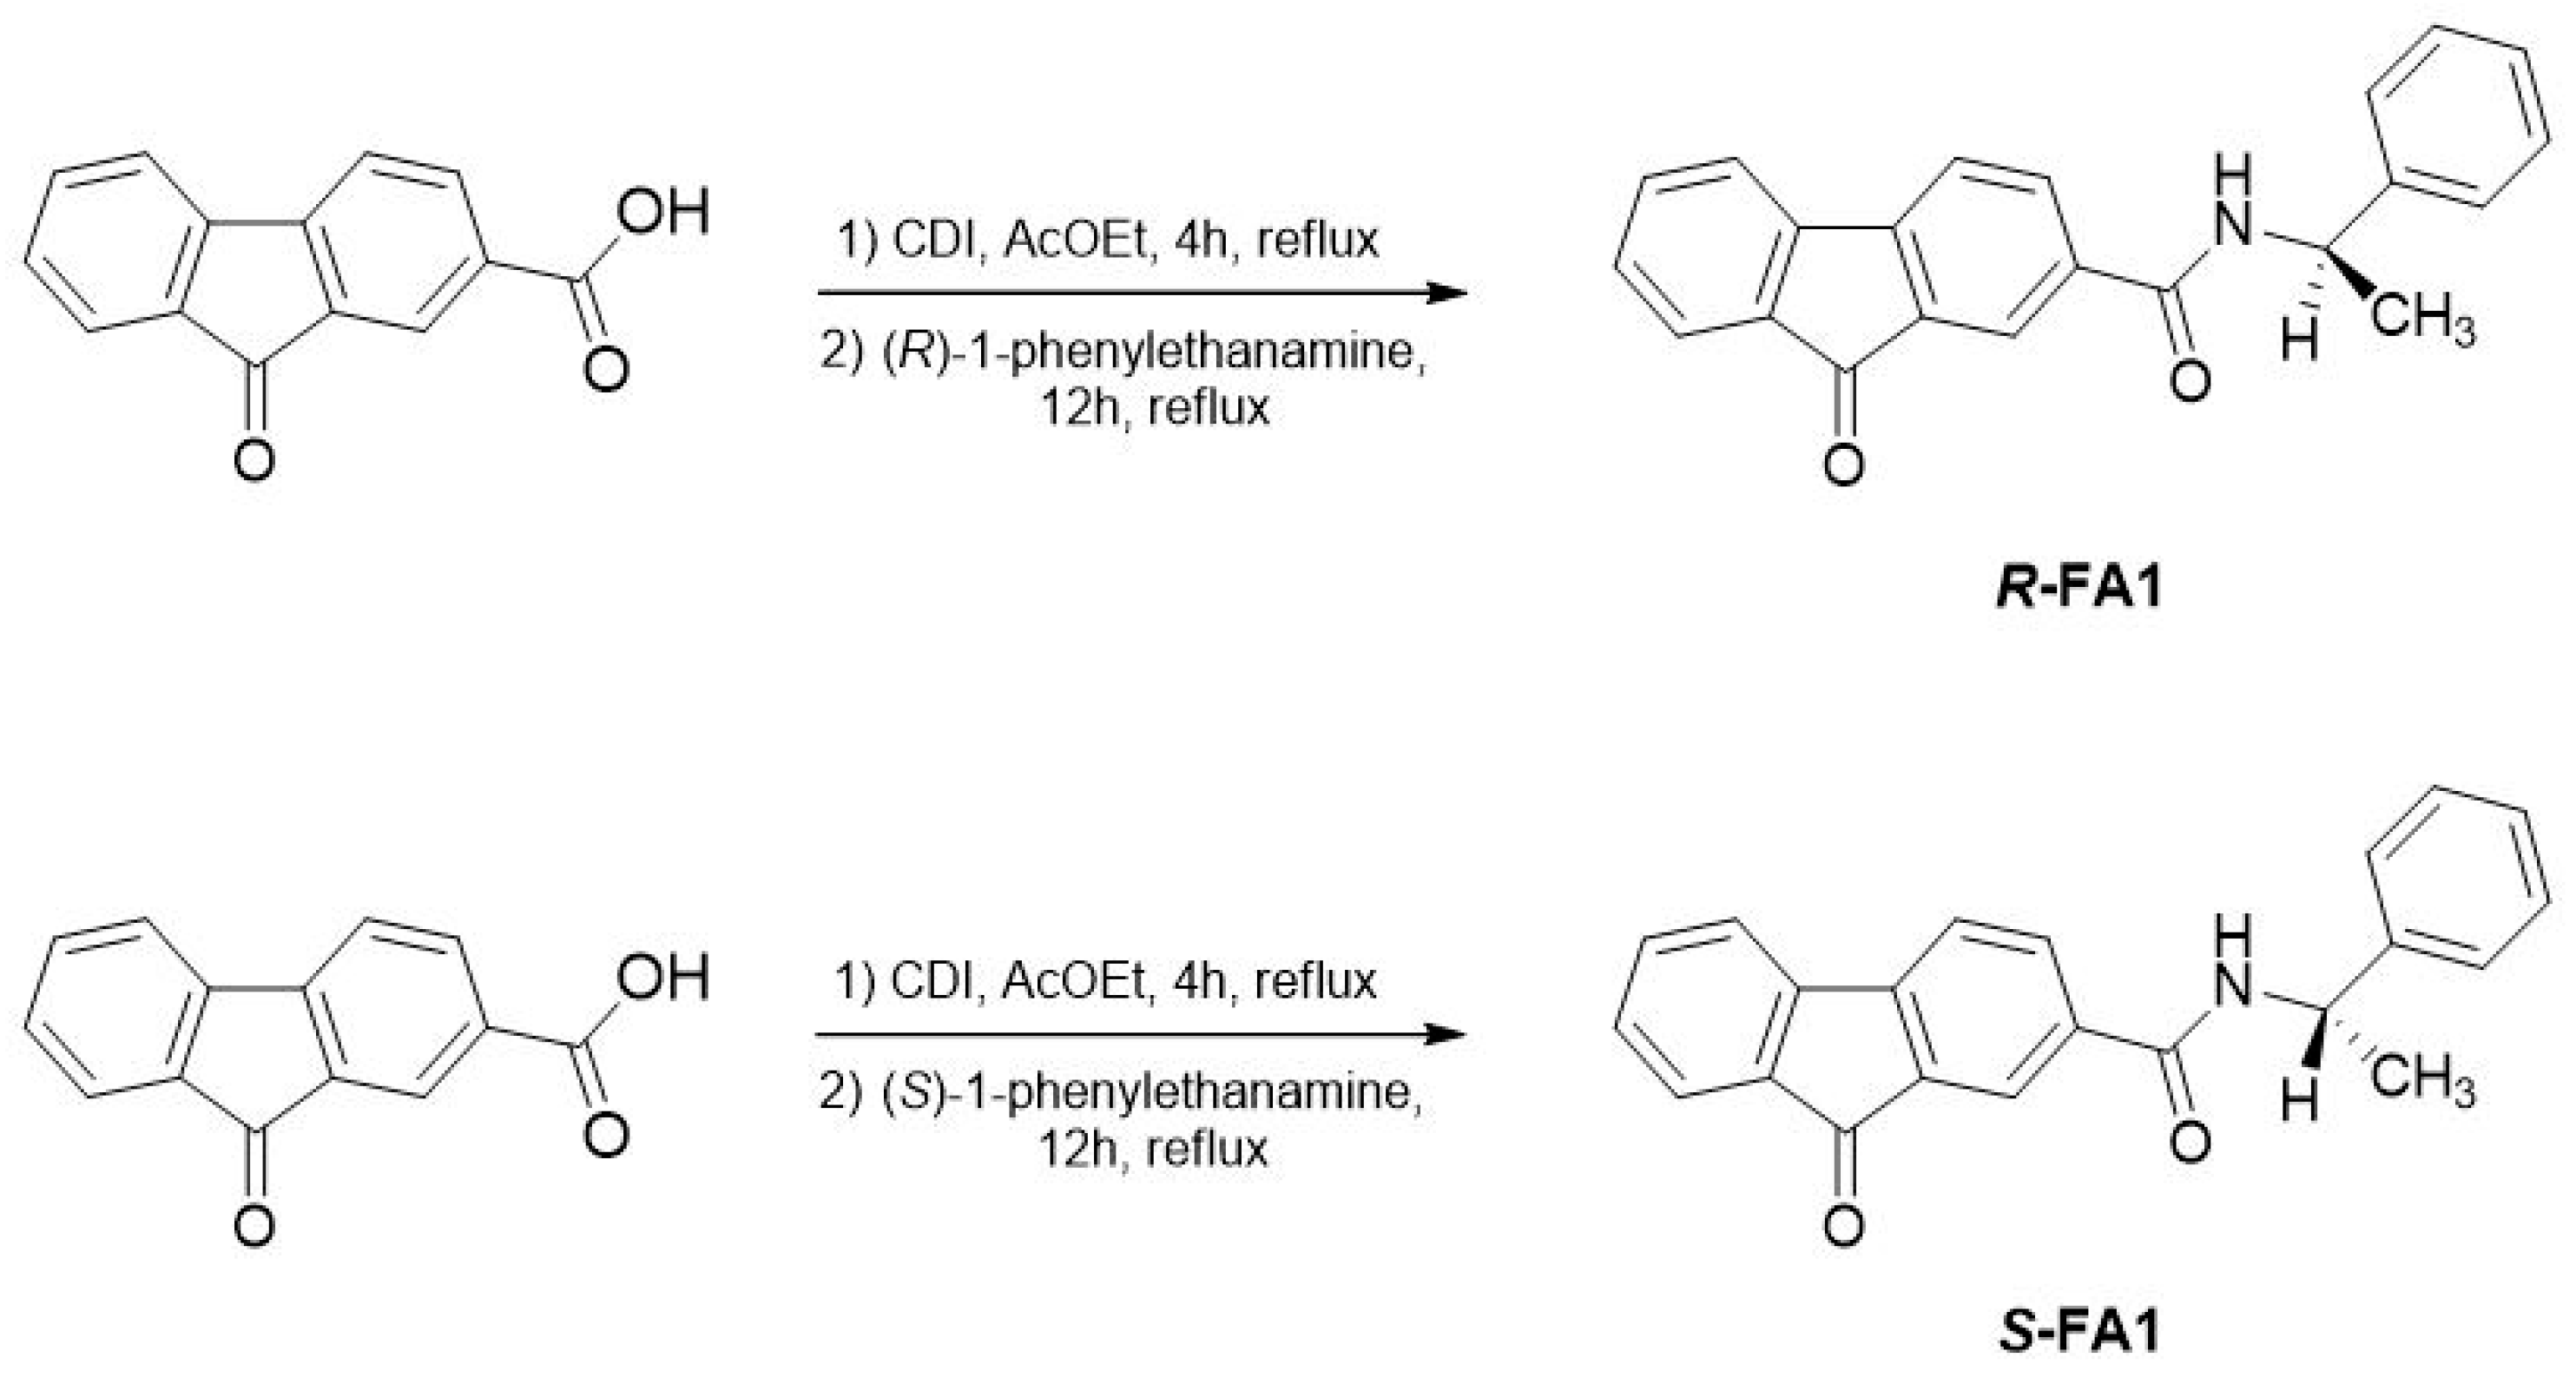
2.1. Chemical Synthesis of Enantiomeric Amide Compounds

Two new enantiomeric fluorescent compounds (R)-9-oxo-N-(1-phenylethyl)-9H-fluorene-2-carboxamide (R-FA1) and (S)-9-oxo-N-(1-phenylethyl)-9H-fluorene-2-carboxamide (S-FA1) were specifically synthesized for this work, following the reactions represented in Figure 1. In particular, 9-oxo-9H-fluorene-2-carboxylic acid was activated using 1,1′-carbonyldiimidazole (CDI), and then the opportune enantiomeric amine was added to obtain the corresponding enantiomeric amide, which was purified by classical procedures. The detailed synthetic procedures, as well as the analytical and spectroscopic data of the synthesized compounds, are reported in the Supplementary Materials and are in agreement with the proposed structures.
In Figure 2, we report on the unpolarized absorption spectra of the two compounds. It can be seen that the absorption reaches its maximum at ~260 nm, but its tail extends to longer wavelengths, encompassing 400 nm (which is of interest for our experimental possibilities).

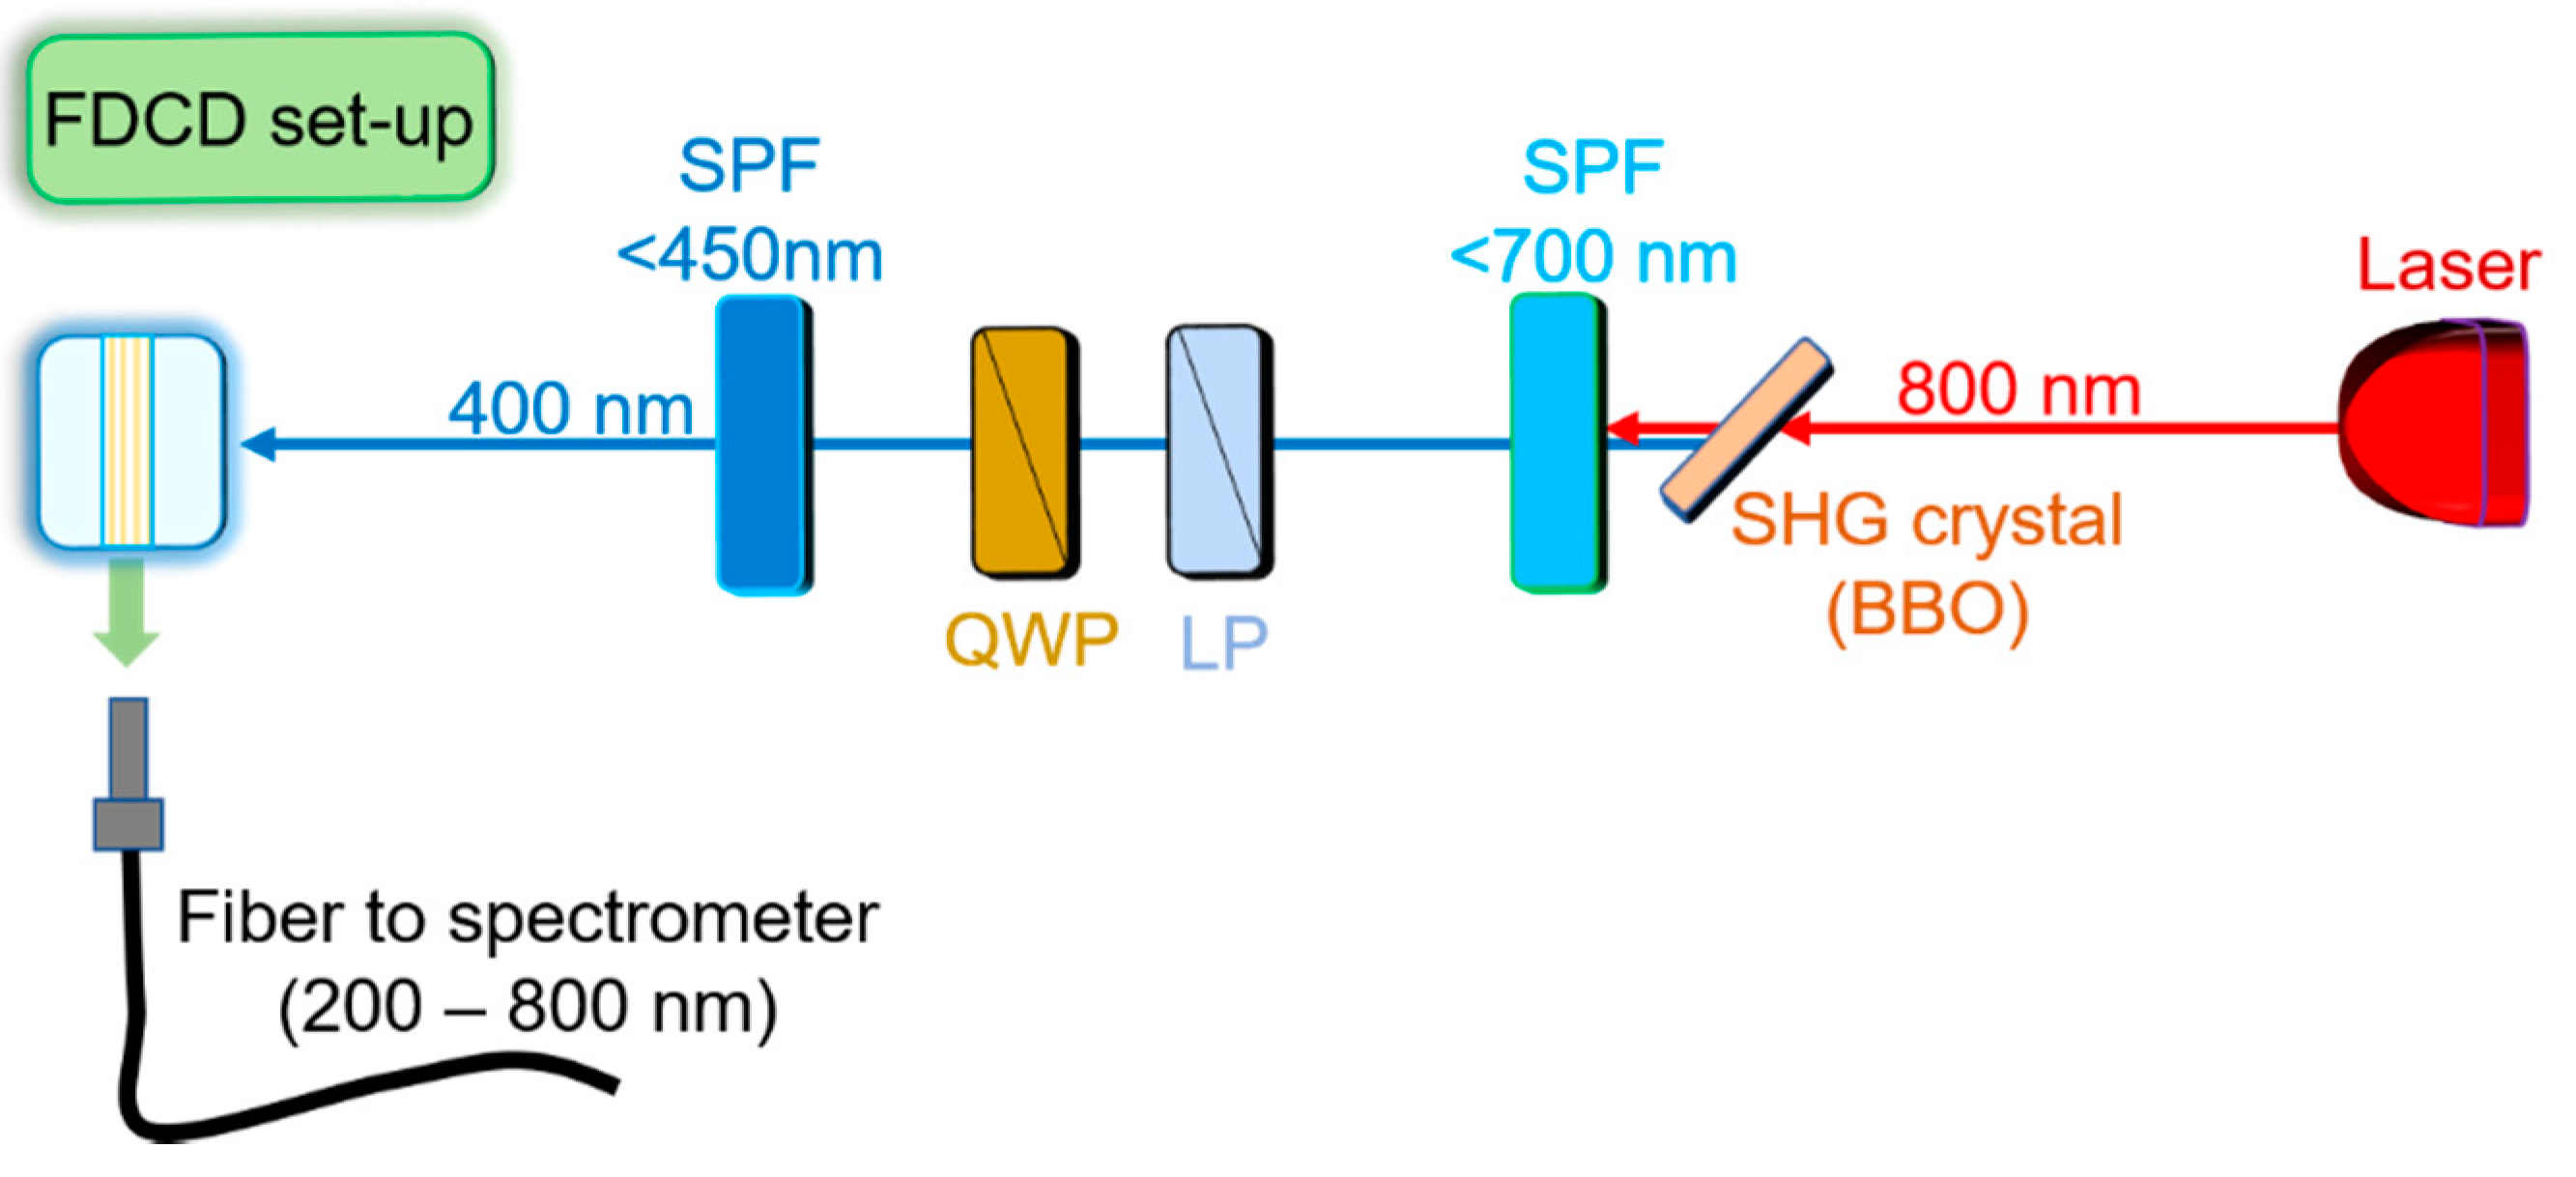
2.2. Fluorescence Spectroscopy Setup
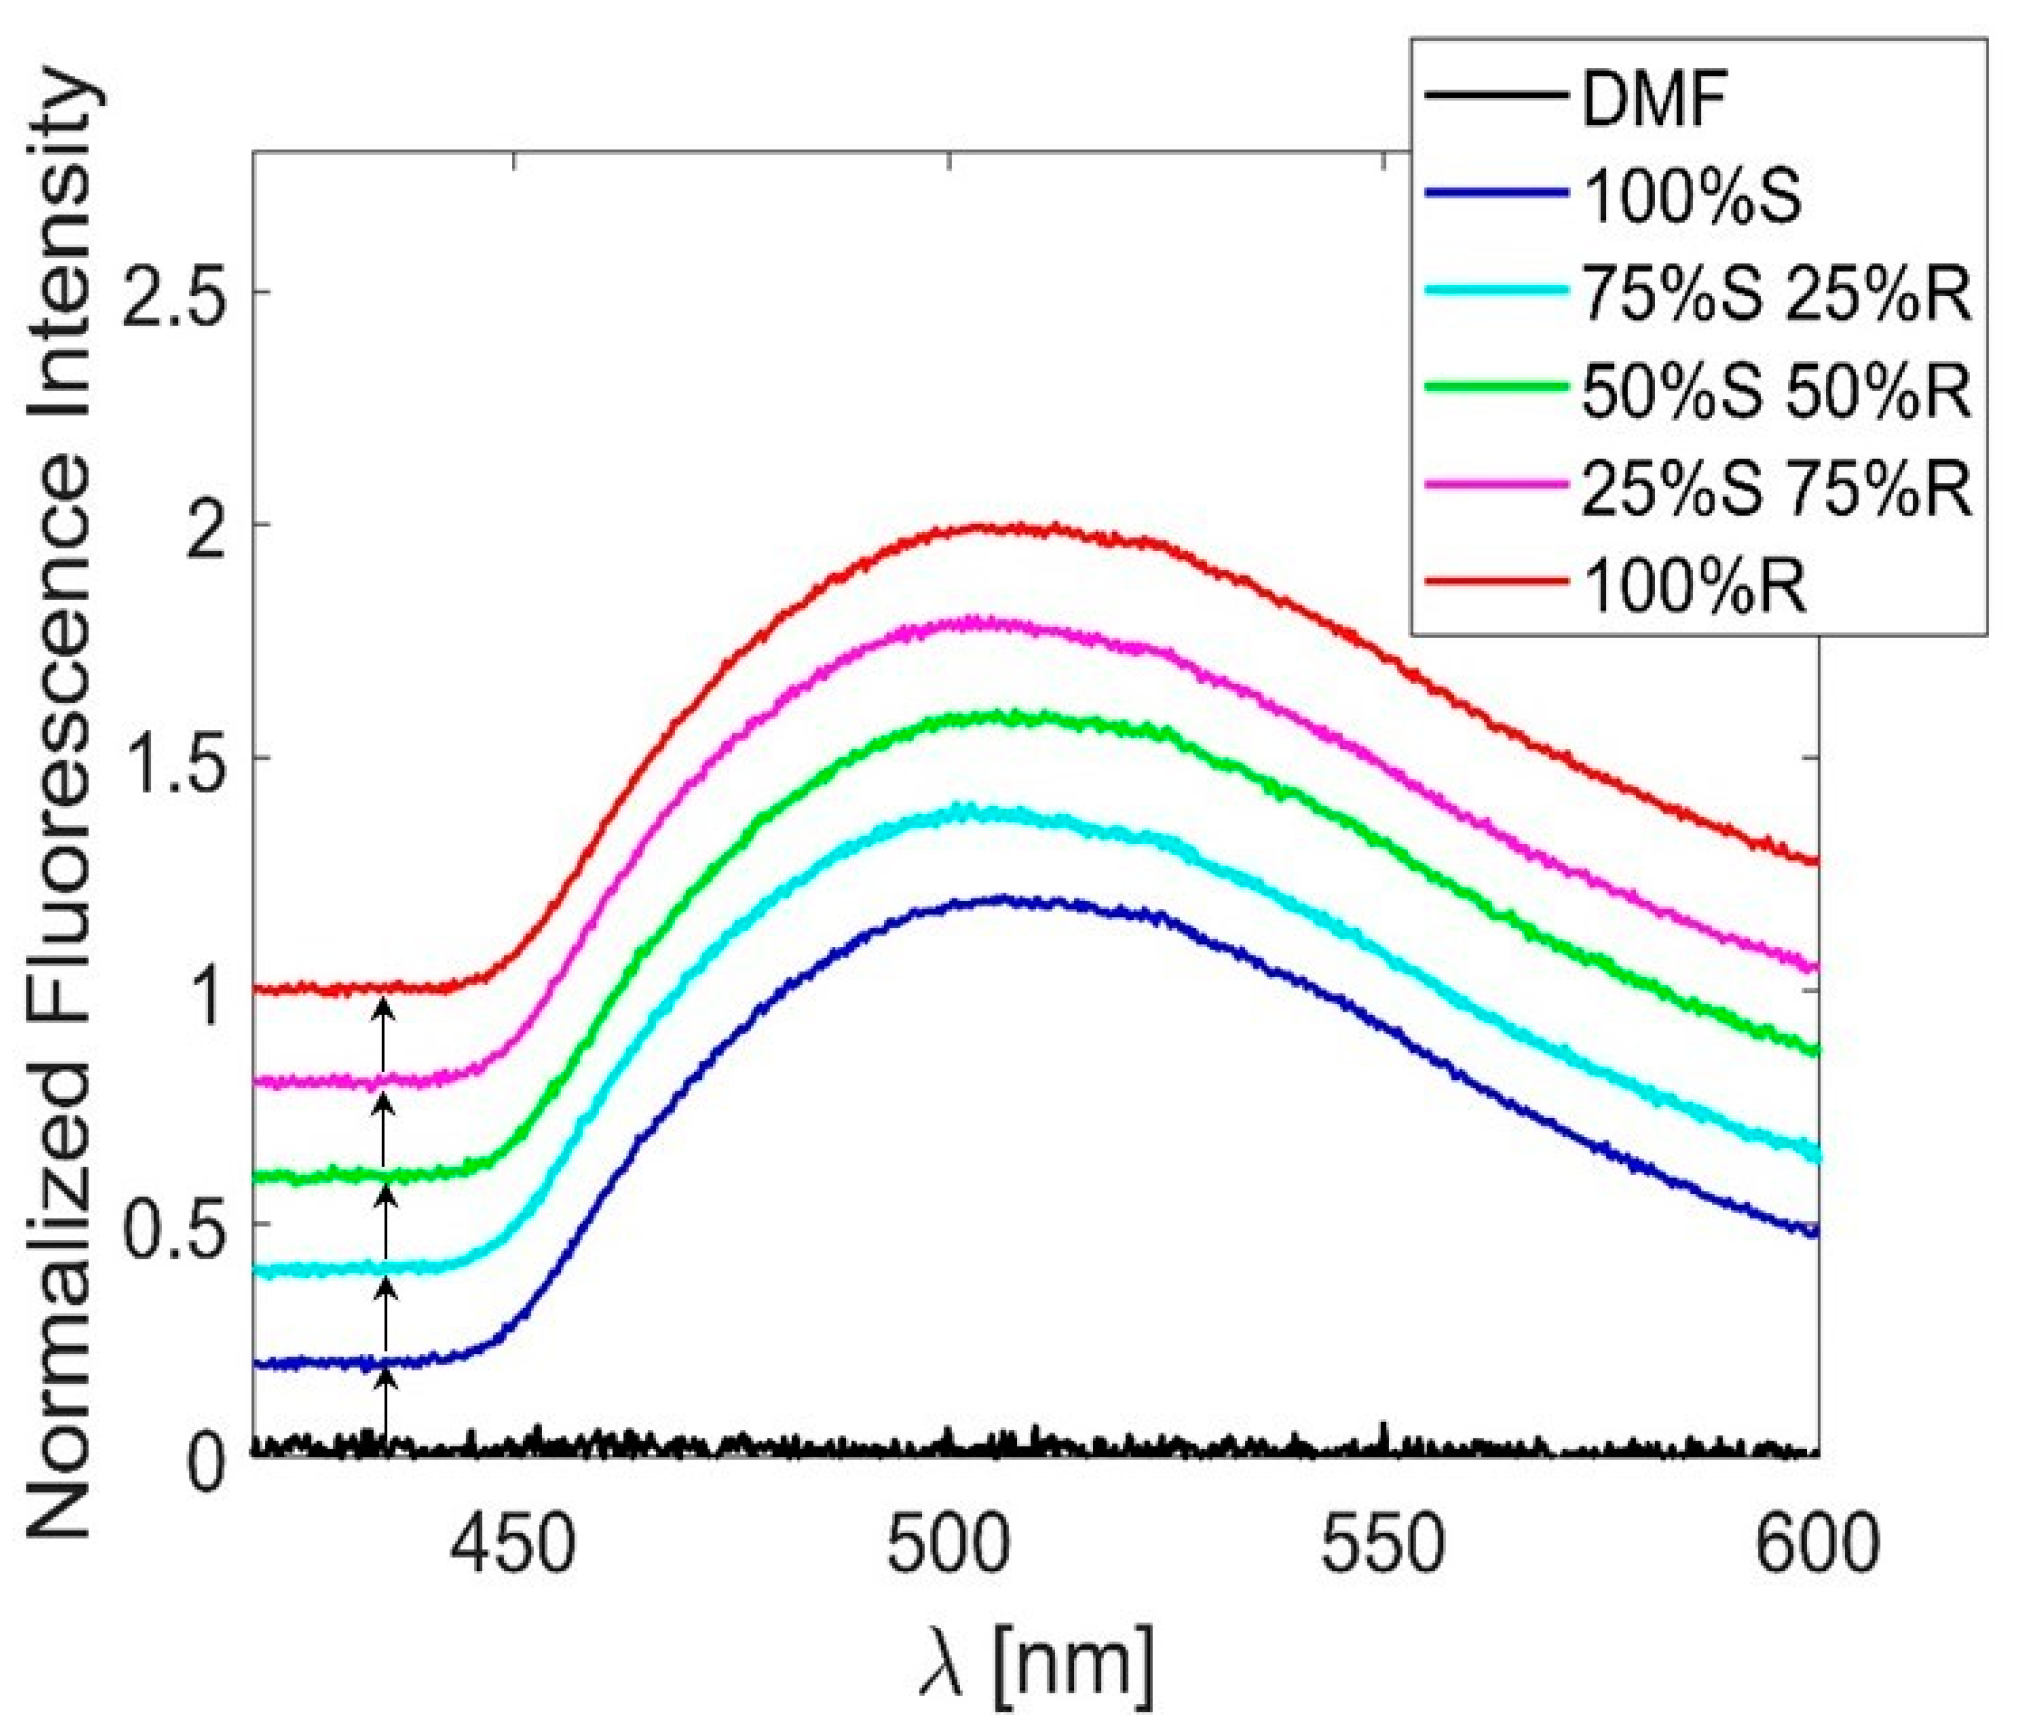
To excite the enantiomers and measure their fluorescence, we used the FDCD setup shown in Figure 3. We used a near-infrared laser (Chameleon Ultra II by Coherent Inc., Santa Clara, CA, USA), with a pulse duration of 140 fs and a repetition rate of 80 MHz. The laser gave maximum power (>3.5 W) at 800 nm, and the spot size had a diameter of 1.2 mm high collimated, M2 < 1.1. Then, the beam at this wavelength was directed toward a beta barium borate (BBO) crystal through a lens whose focus was 75 mm. In order to prevent any damage, the BBO crystal was positioned out of focus with respect to the lens of 15 mm. The incident angle of the laser on the BBO was set to optimize phase matching in order to produce a linear polarized second harmonic beam at 400 nm. The 400 nm beam, with 0.1 mW of average power, passed through a short pass filter (SPF) filter (<700 nm), which filtered the strong fundamental beam. The light then passed through a linear polarizer (LP) and quarter wave plate (QWP); QWP rotation defines the polarization state of the excitation, which can be LCP, RCP, or linear (Lin). A further SPF (<450 nm) removed any residual of the fundamental beam. We prepared cuvettes with different relative concentrations of S- and R-enantiomers in dimethylformamide (DMF) solvent. The cuvette was placed in a holder which was well isolated from the environmental light fluctuations. The laser light at 400 nm impinged on the cuvette with a 2 mm diameter spot on one side of the cuvette, in a way that it was normal to the longer side of the cuvette volume (see Figure 3). From the lateral side of the cuvette, we detected the fluorescence using a Hamamatsu compact spectrometer (200 nm–800 nm range), with a lens whose focus was 20 mm and a UV graded fiber with a 200 micron core. The spectrometer was set to a 5000 ms acquisition time per spectrum in order to acquire a clear luminesce signal. In this way, the detection was always done at the same point (half of the cuvette side) and under the same conditions. Moreover, choosing the shorter side of the cuvette volume for 400 nm light absorption ensured that we obtained a stable fluorescence signal from that part of the excited substance. Before each measurement, the “dark” signal from the environment was measured and subsequently subtracted from the signal coming from the fluorescence in the cuvette. During the single spectrum acquisitions, part of the laser light was continuously monitored in time using a photodiode (not represented in the scheme) and used as a reference for the luminescence intensity normalization.

3. Results

We investigated the following combinations of the S- and R-solutions in DMF solvent: 100% S, 75% S/25% R, 50% S/50% R, 25% S/75% R, 100% R, and pure DMF. In Figure 4, we show the luminescence properties when these substances were excited with 400 nm light with linear polarization. As expected, DMF showed no fluorescence. All mixtures had a broad green fluorescence, starting around 430 nm and peaking at around 510 nm. It can be noted that the broadband fluorescence spectral shape almost did not depend on the relative enantiomer concentrations in the solutions; this is in accordance with chirality being the property of the absence of mirror symmetry, while keeping the molecular constituents equal.
We next rotated the QWP and measured the intensity of the fluorescence for enantio-pure solutions (100% S and 100% R). In Figure 5a, slight differences can be noted in the fluorescence signal under the excitations with LCP and RCP states of light. Such a difference reversed sign by changing the enantio-pure solutions from 100% S to 100% R. Finally, we calculated FDCD as the normalized difference in intensities emitted with LCP and RCP excitation (ILCP and IRCP, respectively).
F D C D [ % ] = 100 I L C P I R C P I L C P + I R C P .
Figure 5b plots the FDCD for the two pure enantiomers. Due to the low luminescence signal in the spectral region where the wavelengths were shorter that 470 nm or larger than 570 nm, we report the FDCD only in the spectral region 470–570 nm, where the signal-to-noise ratio resulted to be larger than one. While the solution with 100% R molecule gave a rather flat negative FDCD (−1.1% ± 0.3%) signal from 470 nm to 570 nm, the opposite enantiomer gave a positive FDCD in this range. The difference in CD for opposite enantiomers was around 1.5%, well beyond the sensitivity of the system of 0.3%.
Figure 6a plots spectra of the mixtures, i.e., 75% S/25% R solution, 25% S/75% R solution, and 50% S/50% R racemic solution. The difference in luminescence between LCP and RCP excitation was noticeably smaller with respect to the pure solutions, as can be evidenced by calculating the FDCD (Figure 6b). As expected, the 50% S/50% R racemic solution gave a negligible FDCD, whereas S- and R-enantiomer excess in a mixture led to a negative and positive FDCD signal, respectively.
Lastly, it can be noted that FDCD signals of 10 mmol enantiomer concentrations reached an absolute value of 1.1% in the green range. As previously stated, chiral detection at much lower concentrations is needed in the industry, and the authors in [31] managed to detect enantiomer concentrations down to zeptomole levels by coupling them with the resonant nanostructured materials and monitoring the transmission changes in the near-infrared range. Here, our molecules were designed to emit in the green range, which overlaps with resonances of plasmonic nanostructures such as nanohole arrays [29,30,32]. In future work, we will cover plasmonic nanostructures with the presented solutions and measure both FDCD and passive extinction changes. We believe that the coupling with properly designed nanostructures which have resonance overlap in the excitation or emission range of our enantiomer could lead to new discoveries and pathways to higher FDCD, thus leading to the possibility of stable signals at lower concentrations, i.e., enantioselectivity enhancement.

4. Conclusions

In this work, we synthesized new chiral amide compounds which emit green light. We then performed FDCD characterization, i.e., we reported how the fluorescence intensity depends on the circular polarization state of the excitation light at 400 nm. The results are promising in terms of FDCD demonstration, which is tunable with different relative concentrations of the enantiomers in the solution. The chiral compounds exhibited circular dichroic behavior in the blue part of the visible spectrum, as could be revealed in the more suitable green part by measuring the fluorescence. The overlap of these regions with resonant properties of the plasmonic nanostructures could open new pathways toward enhanced enantioselectivity.

Supplementary Materials

The following are available online at https://0-www-mdpi-com.brum.beds.ac.uk/article/10.3390/app112311375/s1. In the Supplementary Material we report on Experimental Section of Chemical Synthesis, and on 1H-NMR and 13C-NMR spectra of R-FA1 and S-FA1.

Author Contributions

Conceptualization, F.P., D.R., L.M., A.B. and C.S.; methodology, A.B. and C.S.; software, E.P.; validation, C.S.; formal analysis, A.B.; investigation, A.B., E.P. and R.G.; resources, F.P. and D.R.; data curation, R.G.; writing—original draft preparation, A.B. and E.P.; writing—review and editing, A.B., E.P., C.S. and L.M.; visualization, E.P.; supervision, A.B.; project administration, C.S.; funding acquisition, C.S. All authors have read and agreed to the published version of the manuscript.

Funding

This research received no external funding.

Institutional Review Board Statement

Not applicable.

Informed Consent Statement

Not applicable.

Acknowledgments

A.B. acknowledges LASAFEM Sapienza Università di Roma Infrastructure Project Prot. n. MA31715C8215A268.

Conflicts of Interest

The authors declare no conflict of interest.

References

  1. Nguyen, L.A.; He, H.; Pham-Huy, C. Chiral drugs: An overview. Adv. Nat. Sci. Nanosci. Nanotechnol. 2006, 2, 85–100. [Google Scholar]
  2. Smith, S.W. Chiral Toxicology: It’s the Same Thing…Only Different. Toxicol. Sci. 2009, 110, 4–30. [Google Scholar] [CrossRef]
  3. Berova, N.; Di Bari, L.; Pescitelli, G. Application of electronic circular dichroism in configurational and conformational analysis of organic compounds. Chem. Soc. Rev. 2007, 36, 914–931. [Google Scholar] [CrossRef]
  4. Pescitelli, G.; Di Bari, L.; Berova, N. Conformational aspects in the studies of organic compounds by electronic circular dichroism. Chem. Soc. Rev. 2011, 40, 4603–4625. [Google Scholar] [CrossRef]
  5. Zinna, F.; Resta, C.; Górecki, M.; Pescitelli, G.; Di Bari, L.; Jávorfi, T.; Hussain, R.; Siligardi, G. Circular Dichroism Imaging: Mapping the Local Supramolecular Order in Thin Films of Chiral Functional Polymers. Macromolecules 2017, 50, 2054–2060. [Google Scholar] [CrossRef]
  6. Homberg, A.; Brun, E.; Zinna, F.; Pascal, S.; Górecki, M.; Monnier, L.; Besnard, C.; Pescitelli, G.; Di Bari, L.; Lacour, J. Combined reversible switching of ECD and quenching of CPL with chiral fluorescent macrocycles. Chem. Sci. 2018, 9, 7043. [Google Scholar] [CrossRef] [Green Version]
  7. Albano, G.; Górecki, M.; Pescitelli, G.; Di Bari, L.; Jávorfi, T.; Hussain, R.; Siligardi, G. Electronic circular dichroism imaging (CDi) maps local aggregation modes in thin films of chiral oligothiophenes. New J. Chem. 2019, 43, 14584–14593. [Google Scholar] [CrossRef]
  8. Matsuo, K.; Yonehara, R.; Gekko, K. Secondary-structure analysis of proteins by vacuum-ultraviolet circular dichroism spectroscopy. J. Biochem. 2004, 135, 405–411. [Google Scholar] [CrossRef]
  9. Wenzel, S.; Buss, V. Circular dichroism and electronic structure calculations on naproxen. J. Phys. Org. Chem. 1992, 5, 748–754. [Google Scholar]
  10. Okuom, M.O.; Burks, R.; Naylor, C.; Holmes, A.E. Applied Circular Dichroism: A Facile Spectroscopic Tool for Configurational Assignment and Determination of Enantiopurity. J. Anal. Methods Chem. 2015, 2015, 865605. [Google Scholar] [CrossRef]
  11. Mitscher, L.A.; Kautz, F.; LaPidus, J. Optical rotatory dispersion and circular dichroism of diastereoisomers. I. The ephedrines and chloramphenicols. Can. J. Chem. 1969, 47, 1957–1963. [Google Scholar] [CrossRef]
  12. Tinoco, I., Jr.; Turner, D.H. Fluorescence detected circular dichroism. Theory. J. Am. Chem. Soc. 1976, 98, 6453–6456. [Google Scholar] [CrossRef]
  13. Nehira, T.; Ishihara, K.; Matsuo, K.; Izumi, S.; Yamazaki, T.; Ishida, A. A sensitive method based on fluorescence-detected circular dichroism for protein local structure analysis. Anal. Biochem. 2012, 430, 179–184. [Google Scholar] [CrossRef]
  14. Nehira, T.; Parish, C.A.; Jockusch, S.; Turro, N.J.; Nakanishi, K.; Berova, N. Fluorescence-Detected Exciton-Coupled Circular Dichroism: Scope and Limitation in Structural Studies of Organic Molecules. J. Am. Chem. Soc. 1999, 121, 8681–8691. [Google Scholar] [CrossRef]
  15. Tanaka, K.; Pescitelli, G.; Nakanishi, K.; Berova, N. Fluorescence Detected Exciton Coupled Circular Dichroism: Development of New Fluorescent Reporter Groups for Structural Studies. Monatsh. Chem. 2005, 136, 367–395. [Google Scholar] [CrossRef]
  16. Salam, A.; Meath, W.J. On the relative populations of excited state enantiomers, for randomly orientated molecules, obtained through the use of circularly polarized pulsed lasers. Chem. Phys. Lett. 1997, 277, 199–207. [Google Scholar] [CrossRef]
  17. Hassey, R.; Swain, E.J.; Hammer, N.I.; Venkataraman, D.; Barnes, M.D. Probing the Chiroptical Response of a Single Molecule. Science 2006, 314, 1437. [Google Scholar] [CrossRef]
  18. Tang, Y.; Cook, T.A.; Cohen, A.E. Limits on Fluorescence Detected Circular Dichroism of Single Helicene Molecules. J. Phys. Chem. A 2009, 113, 6213–6216. [Google Scholar] [CrossRef]
  19. Hassey-Paradise, R.; Cyphersmith, A.; Tilley, A.M.; Mortsolf, T.; Basak, D.; Venkataraman, D.; Barnes, M.D. Dissymmetries in fluorescence excitation and emission from single chiral molecules. Chirality 2009, 21, E265–E276. [Google Scholar] [CrossRef]
  20. Muller, G.; Muller, F.C.; Maupin, C.L.; Riehl, J.P. The measurement of the fluorescence detected circular dichroism (FDCD) from a chiral Eu (III) system. Chem. Commun. 2005, 2005, 3615–3617. [Google Scholar] [CrossRef] [PubMed]
  21. Prabodh, A.; Wang, Y.; Sinn, S.; Albertini, P.; Spies, C.; Spuling, E.; Yang, L.-P.; Jiang, W.; Bräse, S.; Biedermann, F. Fluorescence detected circular dichroism (FDCD) for supramolecular host-guest complexes. Chem. Sci. 2021, 12, 9420–9431. [Google Scholar] [CrossRef]
  22. Chi-Sing Ho, H.; Garcia-Etxarri, A.; Zhao, Y.; Dionne, J. Enhancing Enantioselective Absorption Using Dielectric Nanospheres. ACS Photonics 2017, 4, 197–203. [Google Scholar]
  23. Petronijevic, E.; Centini, M.; Belardini, A.; Leahu, G.; Hakkarainen, T.; Sibilia, C. Chiral near-field manipulation in Au-GaAs hybrid hexagonal nanowires. Opt. Express 2017, 25, 14148. [Google Scholar] [CrossRef]
  24. Mohammadi, E.; Tsakmakidis, K.I.; Askarpour, A.N.; Dehkhoda, P.; Tavakoli, A.; Altug, H. Nanophotonic Platforms for Enhanced Chiral Sensing. ACS Photonics 2018, 5, 2669–2675. [Google Scholar] [CrossRef]
  25. Petronijevic, E.; Sibilia, C. Enhanced near-field chirality in periodic arrays of Si nanowires for chiral sensing. Molecules 2019, 24, 853. [Google Scholar] [CrossRef] [Green Version]
  26. Petronijevic, E.; Sandoval, E.M.; Ramezani, M.; Ordóňez-Romero, C.L.; Noguez, C.; Bovino, F.A.; Sibilia, C.; Pirruccio, G. Extended Chiro-optical Near-Field Response of Achiral Plasmonic Lattices. J. Phys. Chem. C 2019, 123, 23620–23627. [Google Scholar] [CrossRef]
  27. Hu, J.; Lawrence, M.; Dionne, J. High Quality Factor Dielectric Metasurfaces for Ultraviolet Circular Dichroism Spectroscopy. ACS Photonics 2020, 7, 36–42. [Google Scholar] [CrossRef]
  28. Solomon, M.L.; Abendroth, J.M.; Poulikakos, L.V.; Hu, J.; Dionne, J.A. Fluorescence-Detected Circular Dichroism of a Chiral Molecular Monolayer with Dielectric Metasurfaces. J. Am. Chem. Soc. 2020, 142, 18304–18309. [Google Scholar] [CrossRef]
  29. Petronijevic, E.; Belardini, A.; Leahu, G.; Cesca, T.; Scian, C.; Mattei, G.; Sibilia, C. Circular dichroism in low-cost plasmonics: 2D arrays of nanoholes in silver. Appl. Sci. 2020, 10, 1316. [Google Scholar] [CrossRef] [Green Version]
  30. Petronijevic, E.; Ghahri, R.; Sibilia, C. Plasmonic Elliptical Nanohole Arrays for Chiral Absorption and Emission in the Near-Infrared and Visible Range. Appl. Sci. 2021, 11, 6012. [Google Scholar] [CrossRef]
  31. Zhao, Y.; Askarpour, A.N.; Sun, L.; Shi, J.; Li, X.; Alù, A. Chirality detection of enantiomers using twisted optical metamaterials. Nat. Commun. 2017, 8, 14180. [Google Scholar] [CrossRef] [PubMed]
  32. Petronijević, E.; Leahu, G.; Mussi, V.; Sibilia, C.; Bovino, A.F. Photoacoustic technique for the characterization of plasmonic properties of 2D periodic arrays of gold nanoholes. AIP Adv. 2017, 7, 025210. [Google Scholar] [CrossRef] [Green Version]
Figure 1. Chemical synthesis of enantiomeric amide compounds (R-FA1 and S-FA1).
Applsci 11 11375 g001
Figure 2. Absorbance spectra of the pure enantiomeric compounds R-FA1 and S-FA1. Insets: photos of the DMF solutions of R-FA1 and S-FA1 in daylight (top) and under UV light excitation at 365 nm (bottom).
Applsci 11 11375 g002
Figure 3. Experimental FDCD setup. Laser light at 800 nm impinges on the BBO crystal, which generates the second harmonic. The high-intensity fundamental beam is filtered by two short-pass filters, while the second harmonic is polarized by a linear polarizer and quarter waveplate. This beam excites the cuvette with molecules. Fluorescence is laterally caught by a fiber and sent to the spectrometer.
Applsci 11 11375 g003
Figure 4. Fluorescence for different relative concentrations of enantiomer solutions in DMF, under linearly polarized excitation at 400 nm. The fluorescence intensities are normalized to their own maximum value and translated by a factor of 0.2 in order to increase the curve visibility. As a reference, we also report the measurements for DMF alone, which, as expected, did not produce any luminescence.
Applsci 11 11375 g004
Figure 5. (a) Fluorescence spectra of DMF solutions with (red, blue curves) 100% S and 100% R (cyan, magenta curves), under LCP and RCP excitation. (b) FDCD spectra of the two solutions.
Applsci 11 11375 g005
Figure 6. (a) Fluorescence spectra of DMF solutions with relative enantiomer concentrations of 75% S/25% R (blue, red), 50% S/50% R (black, green), and 25% S/75% R (cyan, magenta), under LCP and RCP excitation. (b) FDCD spectra of the three solutions.
Applsci 11 11375 g006
Publisher’s Note: MDPI stays neutral with regard to jurisdictional claims in published maps and institutional affiliations.

