Article

Judgments of Object Size and Distance across Different Virtual Reality Environments: A Preliminary Study

1
Department of Construction Science, Texas A&M University, College Station, TX 77843, USA
2
Department of Psychological and Brain Sciences, Texas A&M University, College Station, TX 77843, USA
3
Department of Visualization, Texas A&M University, College Station, TX 77843, USA
*
Author to whom correspondence should be addressed.
Submission received: 13 October 2021 / Revised: 30 November 2021 / Accepted: 1 December 2021 / Published: 4 December 2021
(This article belongs to the Collection Virtual and Augmented Reality Systems)

Abstract

:

Featured Application

VR-based simulations to train future workforce to adapt to work in altered environments.

Abstract

Emerging technologies offer the potential to expand the domain of the future workforce to extreme environments, such as outer space and alien terrains. To understand how humans navigate in such environments that lack familiar spatial cues this study examined spatial perception in three types of environments. The environments were simulated using virtual reality. We examined participants’ ability to estimate the size and distance of stimuli under conditions of minimal, moderate, or maximum visual cues, corresponding to an environment simulating outer space, an alien terrain, or a typical cityscape, respectively. The findings show underestimation of distance in both the maximum and the minimum visual cue environment but a tendency for overestimation of distance in the moderate environment. We further observed that depth estimation was substantially better in the minimum environment than in the other two environments. However, estimation of height was more accurate in the environment with maximum cues (cityscape) than the environment with minimum cues (outer space). More generally, our results suggest that familiar visual cues facilitated better estimation of size and distance than unfamiliar cues. In fact, the presence of unfamiliar, and perhaps misleading visual cues (characterizing the alien terrain environment), was more disruptive than an environment with a total absence of visual cues for distance and size perception. The findings have implications for training workers to better adapt to extreme environments.

1. Introduction

Emerging technologies have transformed the world of work and increasingly are making desolate and hard-to-reach environments, such as outer space, deep oceans, and polar regions, more accessible to humans [1,2,3,4,5,6]. The visuospatial conditions of these environments may adversely affect the spatial cognitive processing of people in such environments, hindering their ability to work safely and productively [7,8,9,10]. In normal environments, familiar natural or manmade landmarks, such as roads, people, cars, buildings, streetlights, and trees, offer spatial cues to help individuals not just to create a clear mental representation of the area, but also to relate to the various spatial elements, judge their size and position, and determine the speed of a moving object [11,12]. Such cues are not available in remote and desolate places devoid of landmarks, such as the North and South Poles and deserts. Likewise, the alien terrains of the Earth’s moon or Mars lack familiar spatial landmarks. To help humans better adapt to such altered conditions, reliable and cost-effective training technologies are needed. Therefore, to inform design principles for such technologies, examining how a lack of visuo-spatial cues affects spatial perception is also critical.
Virtual reality technology has been employed by multiple studies to simulate extreme physical conditions in order to investigate spatial cognitive processing in such conditions [13,14,15]. For instance, some studies [16,17] simulated a multi-module space station in VR and concluded that spatial tests displayed in VR can predict work and navigation performance in such environments. Other studies [18,19] have successfully employed VR to simulate extreme environments and found that VR has the potential to serve as a training system to help people adapt to a microgravity environment. In fact, applying VR-based simulations to test and train spatial abilities of astronauts has been recommended as a cost-effective and safer approach than conventional parabolic flights and drop towers [19,20].
Newly developed training tools to address the impact of limited spatial cues will need fundamental research to examine their efficacy. Such knowledge is critical to informing the design and development of training tools to prepare a broad population for space exploration. Although extreme environments pose a range of challenges (e.g., microgravity or extreme temperature), this study focuses on potential challenges of operating in environments that lack familiar visual cues. Specifically, we examine how the absence of familiar spatial cues influences spatial perception. Spatial perception, in the context of this study, refers to the ability to accurately estimate the distance and scale of objects in space [21]. This is particularly important under extreme conditions. Misinterpreting size and distance may not only hinder work productivity but also result in life-threatening conditions. In 1997, a Russian Progress supply spacecraft and the Russian Mir space station collided due to human error in estimating distance and size ([22], cited by [23]). To avoid catastrophic effects, there is an urgent need to understand how limited visual cues or the absence of visual cues affects human spatial perception in extreme conditions.
Previous research has established that in a real-world environment people judge size and distance based on visual cues such as landmarks. Judgments of size and distance can be adversely affected when visual cues are limited or incomplete. Our study compares the accuracy of estimating spatial dimensions across three levels of visual cue availability using virtual reality environments. We hypothesize that a higher availability of familiar visual cues will facilitate more accurate perceptions of object distance and size.

2. Background

Prior research has established the existence of perceptual distortions in extreme environments. Mars, the Moon, and deep space asteroids are just three examples. In a study of eight astronauts on board the International Space Station, [23] reported that the astronauts’ judgment of size and distance was adversely impacted by microgravity. Astronauts underestimated distance in the depth plane (7.9–18.2%) and perceived a 3D cuboid to be 3.5% taller, 4.5% thinner, and 3.5% shallower than the actual dimensions, demonstrating distorted perception under microgravity conditions.
Oravetz et al. [24] investigated the perceptual distortion of slope, distance, and height estimation within lunar-like and lunar VR environments. Results showed that slope was significantly overestimated, that distance estimates also varied significantly, and that estimation accuracies were affected by viewing distance. People tend to underestimate distance at a far-viewing distance but overestimate at a near-viewing distance. Height estimates also varied considerably, ranging from −568 to 688 m. Oravetz et al. also showed that the perception of the height of a hill is influenced by the viewing distance. Participants overestimate the height of a small hill at both the near- and far-viewing distances. Although there is no statistical significance in the case of taller hills, there is a greater tendency to underestimate the height at a near-viewing than a far-viewing distance.
The underlying causes of perceptual distortions are not fully understood, with most studies attributing distortion to Earth-discrepant gravity conditions [25,26]. Jörges and López-Moliner [26] used the concept of a “gravity prior” to describe long-term experience in the Earth gravity environment. Based on a Bayesian framework of perception, a gravity prior implies that individuals tend to rely on their strong prior experiences on Earth. Furthermore, people find it very difficult to perceptually adapt to a non-Earth gravity environment [26,27,28]. Few studies have directly addressed unfamiliar and limited visual cues as a source of inaccuracies in spatial perception.
On Earth, visuospatial cues provided by familiar landmarks, such as roads, buildings, and trees, play an important role in creating an accurate cognitive representation of what exists [20]. Research has [29,30] suggested that these landmarks, or non-geometric spatial features, influence the perception of distance, size, direction, and scale. Naceri and Hoinville [31] also found that familiar objects may provide linear perspective and a sense of scale (familiar size) which in turn may lead to more accurate distance judgement.
Vienne et al. [32] investigated how screen distance in VR influences perceived depth in two environments, a gray-untextured background environment and a cue-rich environment. They found that distance perception was substantially affected by screen distance for the far-distance stimuli. However, the effect lessened under a cue-rich environment. Ballestin et al. [33] examined a 3D blind reaching task using video (VST) and optical see-through (OST) head-mounted displays and found an underestimation of distance, particularly with OST systems. Gerig et al. [34] studied the effect of the absence of visual cues such as aerial and linear perspective, shadows, texture gradient, and occlusion, in virtual environments. After comparing the results of a computer screen and an Head Mounted Display(HMD) group, they concluded that the screen group performed worse than the HMD group in terms of completion time. Additionally, both HMD groups, the one with and without visual cues, achieved the optimal minimum in terms of speed peaks and hand path ratio.
Wayfinding research [35] has underscored the significance of landmarks when determining spatial representation and planning navigation toward a destination. The absence of spatial cues, therefore, may cause difficulties in spatial cognitive processing. In a desert or polar region, spatial cognitive challenges arise due to the absence of landmarks, suggesting that landmarks provide a context for calculating depth, height, position, and direction [20]. In this regard, it seems plausible that the limited and incomplete visual cues in extreme environments affect the accuracy of spatial perception in the same way it does on Earth.
In summary, the literature to date suggests that inaccuracies in size and distance judgments under extreme environments are a consequence of the absence of familiar spatial cues. Here we investigate this claim using VR as a platform. Specifically, we explored perception of size (i.e., depth, height, and length) and distance under three separate VR environments differing in their degree of familiar visual cues. The use of a VR platform allowed us to examine the role of landmarks and of other environmental conditions under more controlled conditions than in previous research.

3. Materials and Methods

3.1. Research Goal and Objectives

The main goal of this research was to understand how a lack of visual cues affects spatial perception, particularly distance and size perception. The study had the following research objectives:
  • To identify the impact of different levels of visuospatial cues on distance perception. For this, we specifically measured both self-to-object (egocentric) distance and object-to-object (allocentric) distances.
  • To assess the influence of visuospatial cues on the accuracy of size perception. To this end, we considered all dimensions of an object (i.e., length, depth, and height).

3.2. Participants

There were 32 participants (12 females), each with normal or corrected-to-normal vision. Participants were students recruited through an announcement sent through the university’s email system. They ranged in age from 18 to 39 years old (M = 24.8, SD = 6.27). All participants provided written consent prior to the study and the study was approved by the university’s Institutional Review Board. A power analysis was conducted in G*Power 3.1.9.2 using reed measures ANOVA to determine a sufficient sample size, with α = 0.05, power = 0.8, and effect size (d) = 0.96. The desired sample sizes needed to be around 20 for the distance estimation task, and around 11 for the size estimation task.

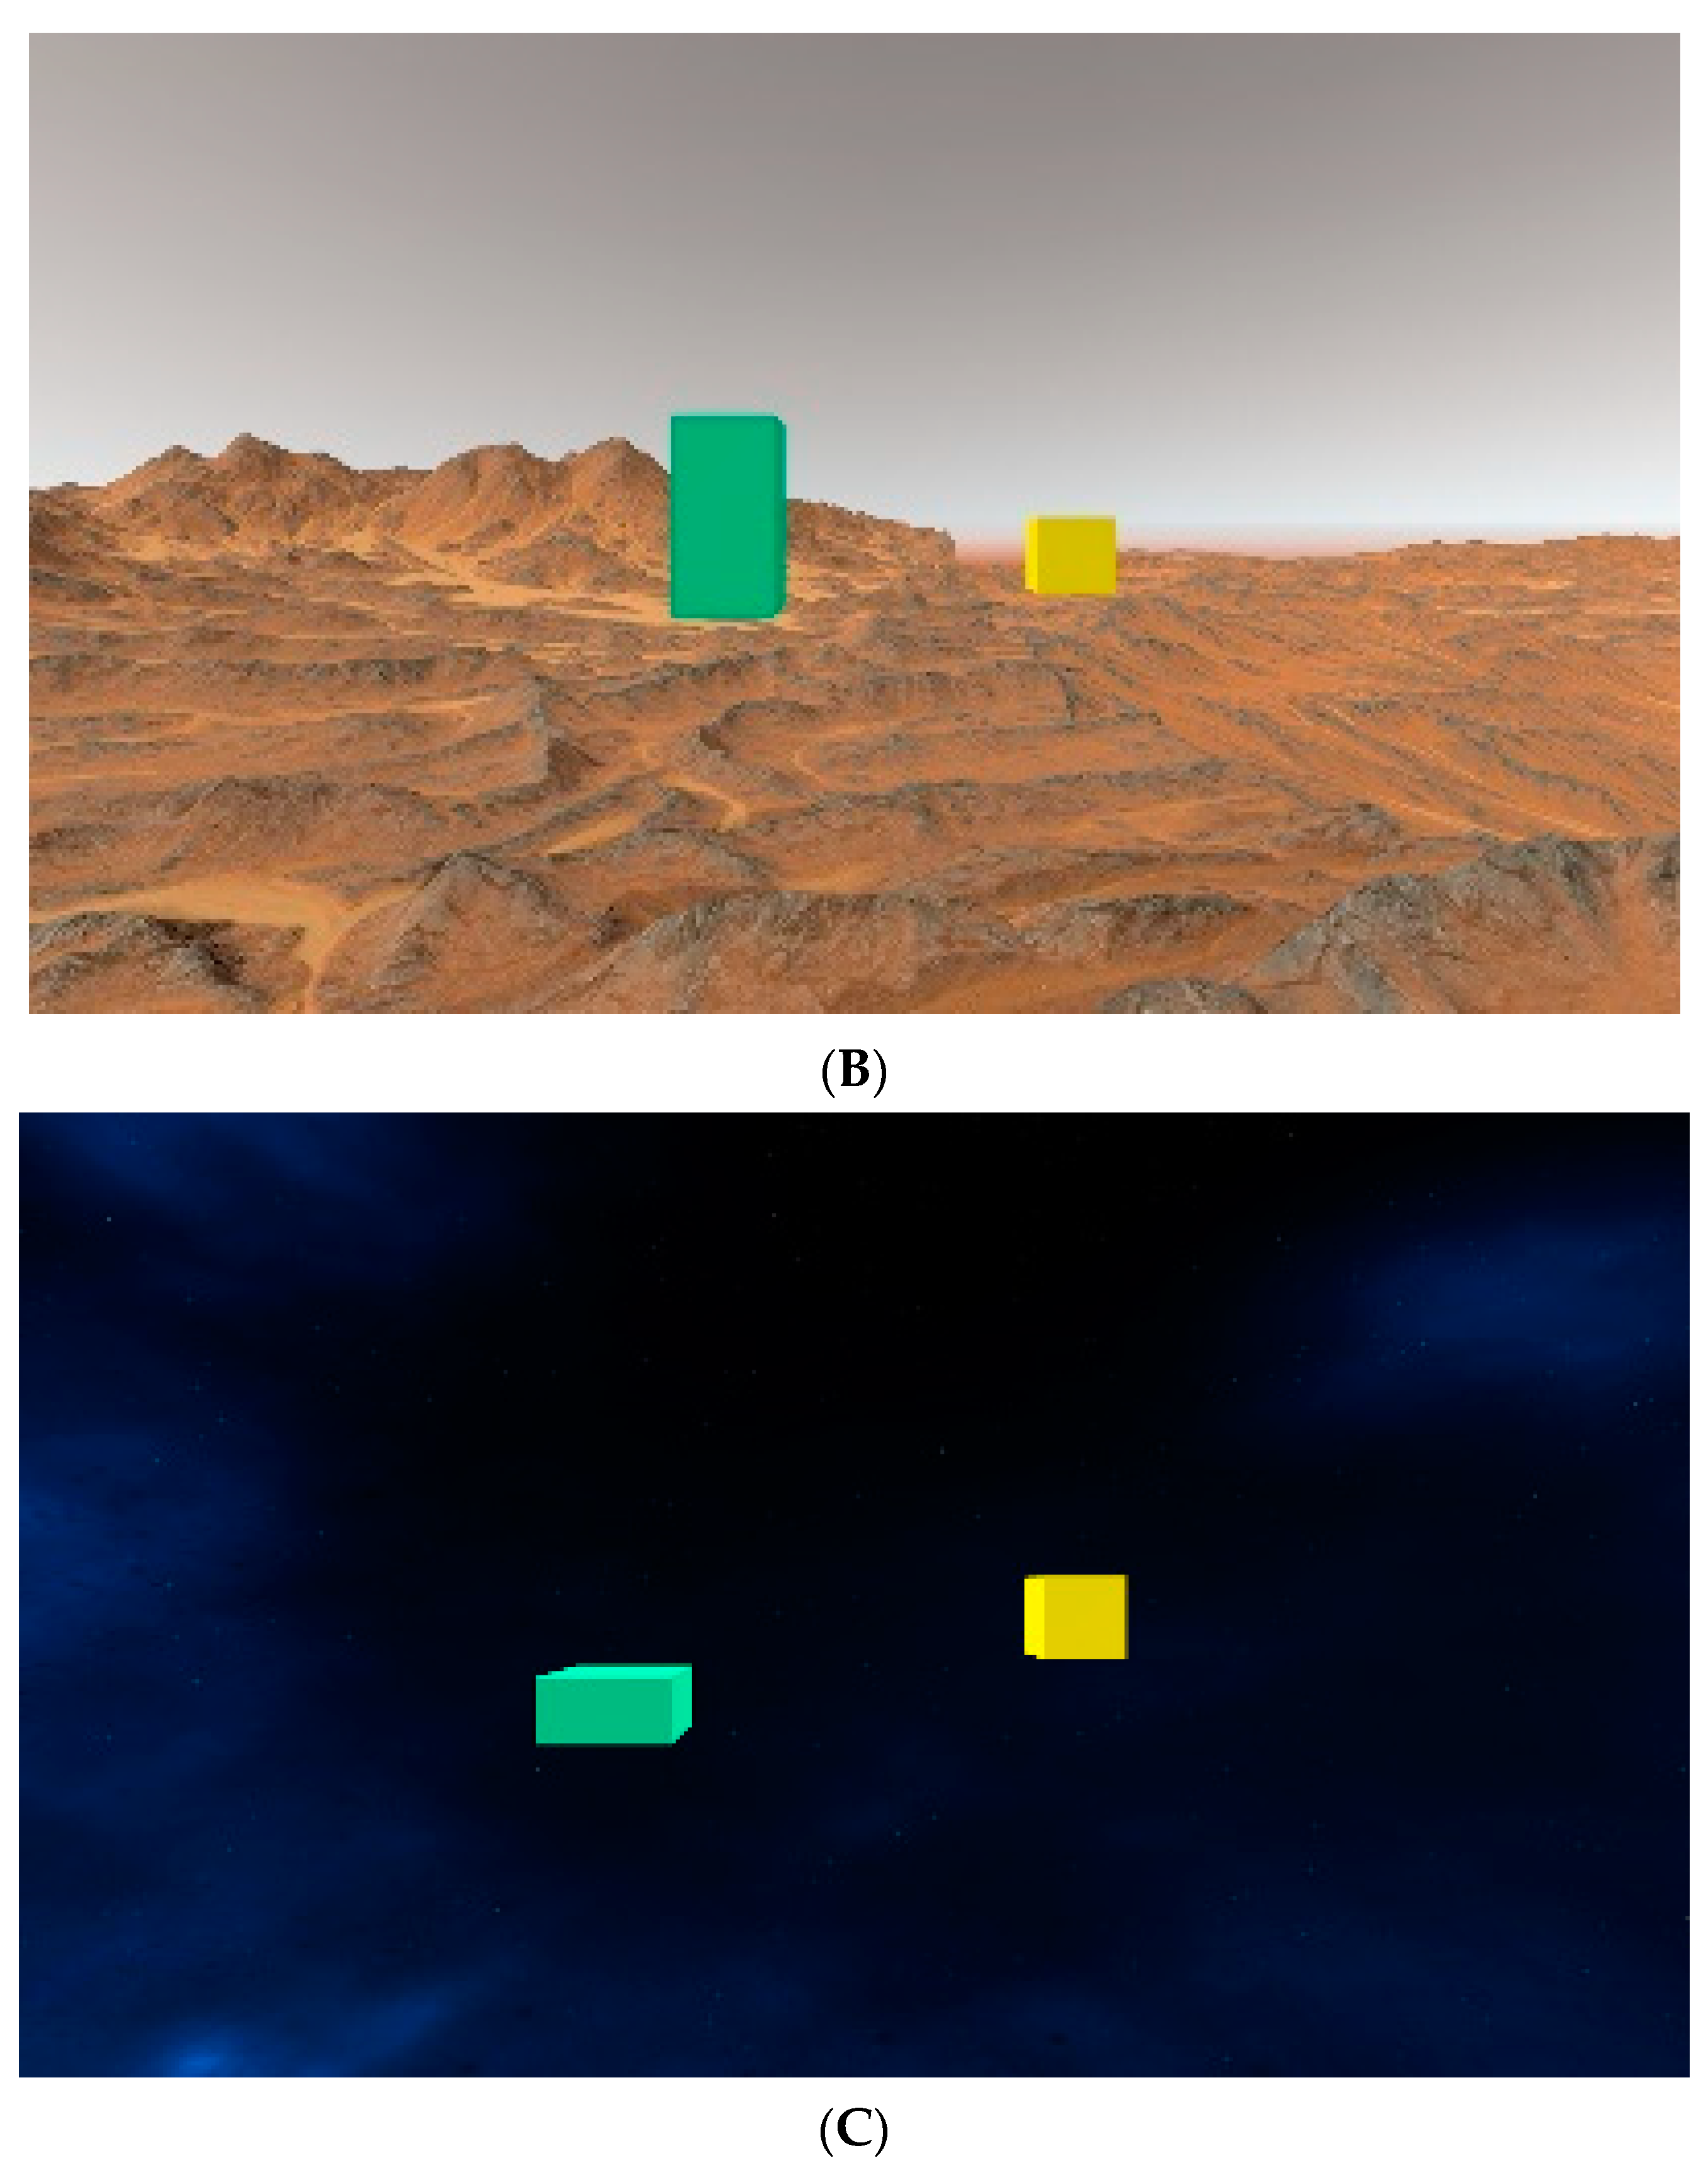
3.3. Study Environment

The VR environments were created in the Unity 3D game engine [36]. Unity 3D offers the ability to customize environments and interaction through scripts to emulate specific performance and functionality [36].
We created three environments with a set of two stimuli as shown in Figure 1. Each environment contained either maximal, moderate, or minimal visual and gravitational cues. The environments were chosen to represent different environments as follows:
Environment 1: Cityscape. This environment was constructed to represent a typical city. It included familiar landmarks and both visual and gravitational frames of reference. This environment was designed to offer the maximum number of cues (Figure 1A).
Environment 2: Spacescape. This environment was constructed to represent an alien planet (e.g., Mars). It included visual and gravitational frames of reference due to the presence of terrain and hypo-gravity. This environment did not contain familiar landmarks. This environment was designed to offer a moderate number of cues (Figure 1B).
Environment 3: Outer space. This environment was constructed to represent space. It did not contain visual or gravitational frames of reference nor familiar landmark objects, such as trees, cars, and buildings. This environment was designed to offer a minimum number of cues (Figure 1C).
Each of the three environments were constructed with equal visual quality (resolution and sharpness) to allow for fair comparison across stimuli.
For each trial, participants were seated in a swivel chair and viewed the interior of one of the three environments presented on the HTC VIVE System HMD at a per-display resolution of 1440 × 1600 pixels, and a 110° field of view (FOV). Participants were free to explore all 360-degrees of the virtual environment during the experiments.

3.4. Task and Procedure

The participants’ task was to estimate the size and distance of stimuli in three separate environments. At the beginning of the study participants completed a demographic questionnaire. Then, they were introduced to the three VR environments. Three sets of two rectangular cuboids (set A, set B, and set C), one yellow one green, served as a target for both the distance and size estimation task. In each set, the two cuboids in different sizes were placed at two separated distances, near and far (see Figure 2). Near targets were placed 6 to 9 m from the participant. Far targets were placed 12 to 13 m from the participant. Figure 2 illustrates this. The stimuli were colored in yellow and green to allow them to stand out from the background and allow the participant to clearly distinguish between the two. We wanted to make participants rely solely on the spatial cues of the environment when they perform the spatial tasks. The target objects should not serve as a spatial cue. Therefore, we used rectangular cuboids as stimuli as these would not have features that could bias participants. Additionally, studies, such as Gerig et al. [34], showed that visual depth cues rendered in virtual environments may have a minor effect on participants’ performance while completing a task.
Prior to each experiment trial, participants completed two practice trials. The study employed a within-subject design. Each participant completed one of the cuboids sets (set A, set B, or set C) in each environmental condition (minimum, moderate, and maximum cues). The order of the environment and the cuboids sets were counterbalanced to avoid a learning effect (see Table 1). Participants first completed the distance estimation task, then the size estimation task.

3.4.1. Distance Estimation Task

Participants were asked to estimate and verbally report the absolute distance between their own position and the position of each of the two targets in the perspective (egocentric distance). Participants also reported the distance between the two targets (allocentric distance) Distances were reported using the participants’ choice of conventional unit system (e.g., feet, yards, or meters), thereby allowing distance reporting in familiar units.

3.4.2. Size Estimation Task

Participants were asked to determine the relative size of two rectangular cuboids (green and yellow) by first identifying the shortest side of the cuboids (e.g., depth, height, or length). Participants were then subsequently asked to define the aspect ratio of the other sides relative to the shortest side. For example, imagine the given stimuli’s shortest side is its length (χ), the depth is same as the length and the height is twice bigger than the length. In this example, the aspect ratio of the cuboid is χ: χ: 2χ. In the study, the shortest side (χ) was set at 1 for convenience. A schematic of this is shown in Figure 3.

4. Results

To ensure consistency, distance estimation units were converted into SI units (meters). The ratio of the difference between the actual distance and the estimated distance was used as relative error. The same formula was used to calculate the relative error for size. A relative error of 0 indicated a perfect estimation. A negative value represented underestimation in distance, whereas a positive value represented overestimation of distance.
For each analysis, relative errors more than two standard deviations from the respective mean were considered outliers and discarded from the analysis [37]. We felt it was important to screen for and remove outliers to improve the reliability of the dataset; the importance of doing so was underscored by Osborne et al. [38], who observed that less than 10% of the studies they reviewed even checked for the presence of outliers. Strategies for dealing with outliers have generated debate (e.g., see [39] vs. [40]). For the present study, we followed the widely accepted criterion of 2 or 3 standard deviations (SD) for identification of outlier data points ([37,41]). We found that there was no meaningful difference between using the criterion of 2 SD versus 3 SD in our dataset and so we used the more conservative cutoff of 2 SD. In dealing with the outlier points, it has been shown that elimination of extreme values from the data set results in more accuracy and less errors of statistical inferences [37]. In our preliminary study, the strategy of outlier elimination was adopted to aim for as accurate results as possible. Due to the within-subject design of the study for all tasks’ conditions, the sample size remained acceptable even after removing the outliers (see the power analysis reported above).

4.1. Egocentric Distance Perception

One participant failed to complete this task, so was not included. In addition, we screened for outliers by condition (there were about 23% outliers). As a result, data from 24 participants were used for the final analyses.
The data showed a tendency for underestimation of distance in environments with maximum cues (Mrelative error (near) = 0.60, SD = 0.22; Mrelative error (far) = 0.57, SD = 0.23) and minimum visual and gravitational cues (Mrelative error (near) = 0.56, SD = 0.35; Mrelative error (far) = 0.58, SD = 0.32). However, for the moderate cue environment participants tended to overestimate the distance between themselves and the targets (Mrelative error (near) = −6.67, SD = 26.55; Mrelative error (far) = −5.46, SD = 20.23).
For further analyses, absolute relative errors were used to represent inaccurate estimation, regardless of direction, under each environmental condition (i.e., overestimation or underestimation). However, in terms of the magnitude of error, a negative relative error is just as different from zero (i.e., accurate estimation) as an equivalent positive relative error. A 3 (maximum vs. moderate vs. minimum visual and gravitational cues) × 2 (near vs. far) repeated measures ANOVA was performed to investigate the effects of the within-subject variables of environmental condition and proximity of the target, respectively, on the absolute relative error of distance estimation. The results showed no main effect of environmental condition or target proximity. The interaction of the two variables was not significant, either (all p > 0.05, Greenhouse–Geisser correction; see Figure 4).
Because there was no significant effect of target proximity, we increased the power of the analyses by combining the data from the near and far targets by averaging the absolute relative error of the two proximity conditions for each participant. For participants whose data point for either the near or far condition was an outlier, we used the data point that was not an outlier. This resulted in omission of fewer data points (~16%) and the remaining data from 26 participants was entered into this analysis. A repeated measures ANOVA was conducted on the effect of environmental condition on the relative error of distance perception. The effect of the environmental condition approached significance, F (1, 25) = 2.92, p = 0.10, η2p = 0.11; Greenhouse–Geisser correction. The relative error was larger under the environment with a moderate level of visual and gravitational cues (Mrelative error = 10.71, SD = 30.11) than the environment with minimum cues (Mrelative error = 0.62, SD = 0.21) or relative to the environment with maximum cues (Mrelative error = 0.57, SD = 0.21).
To examine whether the absolute relative error of egocentric distance perception under each environmental condition was significantly greater than zero, we conducted one-sample t-tests (one-tailed) against zero for each environmental condition. The results revealed significant deviation from zero, i.e., an accurate estimation under all environments with maximum (t (25) = 13.60, p < 0.001, d = 2.67), moderate (t (25) = 1.81, p = 0.04, d = 0.36), and minimum (t (25) = 14.99, p < 0.001, d = 2.94) visual and gravitational cues.

4.2. Allocentric Distance Perception

One participant failed to complete this task. For each environmental condition, the outlier data points were dropped from the analyses, which led to the omission of about 16% of the data. The analyses were conducted on the data from the remaining 26 participants.
Overall, participants’ responses showed an overestimation of the distance between the two targets under the environment with moderate cues (Mrelative error = −16.4, SD = 50.78), while showing an underestimation of the distance in environments with maximum (Mrelative error = 0.44, SD = 0.36) and minimum (Mrelative error = 0.36, SD = 0.66) visual and gravitational cues.
Again, for further analyses, the absolute relative error was used. A one-way repeated-measures ANOVA on perception of allocentric distance perception revealed an effect of the environmental condition that approached significance; F (1, 25) = 2.82, p = 0.11 (Greenhouse–Geisser correction). In estimation of the distance between the two targets, participants made larger errors under the environment with moderate visual and gravitational cues (Mrelative error = 17.24, SD = 50.49) than the environment with minimum cues (Mrelative error = 0.66, SD = 0.32) than the environment with maximum visual and gravitational cues (Mrelative error = 0.51, SD = 0.27; see Figure 4).
To determine if the absolute relative error of allocentric distance perception under each environmental condition was significantly greater than zero, we conducted single sample t-tests (one-tailed) against zero for each environmental condition. The results revealed significant deviation from zero, i.e., an accurate estimation under all environments with maximum (t (25) = 9.25, p < 0.001, d = 1.82), moderate (t (25) = 1.74, p = 0.047, d = 0.34), and minimum (t (25) = 10.43, p < 0.001, d = 2.05) visual and gravitational cues.
Together, the results of both egocentric and allocentric distance estimation tasks showed an underestimation of distance in the environment with both visual and gravitational cues (maximum: cityscape) and the environment with no cues at all (minimum: outer space). However, there was a tendency for an overestimation of distance in the environment that had gravitational cues but no familiar visual cues (moderate: space scape).

4.3. Size Estimation

Two participants failed to complete this task appropriately. Further, for each study condition, outliers were dropped from the analyses, which resulted in the exclusion of about 13% of the data. The remaining data from 23 participants was entered into the analyses. In the environment with maximum visual and gravitational cues, participants underestimated the depth dimension of the near target (Mrelative error (near) = 0.19, SD = 0.27) but accurately estimated the depth of the far target (Mrelative error (far) = 0, SD = 0), while overestimating the height (Mrelative error (near) = −0.46, SD = 0.64; Mrelative error (far) = −0.40, SD = 0.55) and length (Mrelative error (near) = −0.54, SD = 0.69; Mrelative error (far) = −0.40, SD = 0.54) of both the near and far targets. Similarly, under the environment with a moderate level of cues, there was a tendency for underestimation of depth of the near target (Mrelative error (near) = 0.21, SD = 0.23) but accurate estimation of the depth of the far target (Mrelative error (far) = 0, SD = 0). However, there was an overestimation of height (Mrelative error (near) = −1.02, SD = 1.45; Mrelative error (far) = −0.99, SD = 1.34) and length (Mrelative error (near) = −0.85, SD = 1.21; Mrelative error (far) = −0.94, SD = 1.23) of both the near and far targets. Depth perception was accurate under the environment with minimum cues for both the near and far targets (Mrelative error = 0, SD = 0), whereas the height (Mrelative error (near) = −1.50, SD = 1.27; Mrelative error (far) = −0.80, SD = 0.82) and length (Mrelative error (near) = −1.16, SD = 0.99; Mrelative error (far) = −0.82, SD = 0.98) were overestimated for both the near and far targets.
Similar to the analyses of distance estimation data, the sign of relative errors was removed for further analyses of size estimation data. A 3 (maximum vs. moderate vs. minimum visual and gravitational cues) × 2 (near vs. far) × 3 (depth vs. height vs. length) repeated measures ANOVA was performed to examine the effects of the within-subject variables of the environmental condition, proximity of the target, and dimension of the cuboid, respectively, on the absolute relative error of size estimation.
The analysis revealed significant main effects of the environmental condition (F (1.54, 33.85) = 3.60, p = 0.036, η2p = 0.14; Greenhouse–Geisser correction), target proximity (F (1, 22) = 9.56, p = 0.005, η2p = 0.30), and cuboid dimension (F (1.24, 27.17) = 29.02, p < 0.001, η2p = 0.57; Greenhouse–Geisser correction). The two-way interaction between the main effects of environmental condition and dimension was also significant (F (1.73, 37.94) = 3.87, p = 0.035, η2p = 0.15; Greenhouse–Geisser correction). Most importantly, the three-way interaction between environmental condition, dimension, and target proximity was significant (F (2.44, 53.56) = 5.05, p = 0.006, η2p = 0.19; Greenhouse–Geisser correction). None of the other effects reached significance (see Figure 5).
To break down the significant three-way interaction, simple two-way interaction analyses between environmental condition and dimension were conducted within each level of target proximity, using Bonferroni correction (i.e., p < 0.025). The interaction between environmental condition and dimension was only significant in size estimation of the near target (F (1.6, 35.21) = 5.035, p = 0.017, η2p = 0.186; Greenhouse–Geisser correction) but not the far target (p > 0.025).
We followed up with simple effects analyses of the environmental condition within each level of dimension for the near target, using Bonferroni correction (p < 0.017). In estimation of depth, the effect of environmental condition was significant, F (1.1, 24.17) = 7.37, p = 0.01, η2p = 0.251; Greenhouse–Geisser correction. Simple pairwise comparisons with Bonferroni adjustment revealed that estimation of depth was significantly more accurate in the environment with minimum cues (Mrelative error = 0, SD = 0) than in environments with moderate (Mrelative error = 0.21, SD = 0.23; p < 0.001) and maximum (Mrelative error = 0.23, SD = 0.23; p = 0.001) cues. However, estimation of depth was equally accurate under the environments with maximum and moderate visual and gravitational cues.
In estimation of height, the effect of environmental condition was significant, F (1.47, 32.32) = 5.62, p = 0.014, η2p = 0.204; Greenhouse–Geisser correction. Simple pairwise comparisons with Bonferroni adjustment showed significantly more accurate estimation of the height in the environment with maximum cues (Mrelative error = 0.50, SD = 0.60) than the environment with minimum visual and gravitational cues (Mrelative error = 1.50, SD = 1.27; p = 0.006). None of the other pairwise comparisons reached significance. Nevertheless, in estimation of length, the effect of environmental condition was not significant (p > 0.017).
In conclusion, the interaction of environmental condition and estimated dimension of the cuboid was dependent on target proximity. This interaction was only significant in size estimation of the near target. Further analyses on estimation of the near target revealed an effect of environmental condition in estimation of the depth and height, but not in estimation of length. Namely, the accuracy of estimation of depth was substantially better in the environment without any visual or gravitational cues than the other two environments. However, estimation of height was more accurate in the environment with maximum cues than the environment with minimum visual and gravitational cues. On a descriptive level, estimation of depth overall was more accurate than the other two dimensions, regardless of the target proximity and environmental condition (see Figure 5).

5. Discussion

This study was designed to better understand how variability across environments in the presence of familiar spatial cues can influence spatial perception ability. Specifically, we investigated participants’ ability to determine the absolute distance and relative size of stimuli under three environmental conditions.
Results confirmed difficulties in distance and size estimation, in particular under the moderate visual cues environment (environment 2: space scape). However, even with maximum visual cues (environment 1: cityscape), perceived distance significantly deviated from the actual distance, and was consistently underestimated. Distance compression could be due to the VR platform. Existing studies have shown that distance estimation is regularly underestimated in a VE when compared to the real world [14,42,43,44,45,46,47,48]. Thompson et al. [35], for example, compared absolute distance judgment in the real world with varying quality VR environments (e.g., low-quality graphics and wireframe graphics). They showed that distance judgment in VR was significantly underestimated. For this study, we evaluated relative distances to mitigate this underestimation. Virtual environments may also not be able to represent the real physical environments exactly. There may also be perceived dilations and compressions of space as found by Cutting [49] in a study of lenses that may influence the field of view aspect of computer graphics and VR.
We found that the absolute distance to the target was underestimated in maximum (environment 1: cityscape) and minimum (environment 2: space scape) spatial cue conditions, whereas it was overestimated in the moderate cue (environment 3: outer space) condition. We attribute more accurate perceptual judgments in environment 1 to the present’s recognizable objects. These objects serve as key frames of reference to determine the distance and size of other objects [50]. This was also expressed in several participants’ comments. When judging a target’s absolute distance in environment 1: cityscape, the maximum visual cue environment, participants noted that they used the uniform tiles on the floor or standard height street poles to measure the relative distance and size of the virtual objects.
In contrast to our expectation that environment 3 (outer space), which had the least amount of visual cues, would yield the highest relative error, it was in fact environment 2 (space scape), the moderate visual cue condition, that produced the highest relative error. The reason for this is unclear, but one may speculate that unfamiliar visual cues in the presence of other familiar cues such as gravity, could lead to misjudgments regarding distance and size. This partially replicates previous findings that show the deceptive nature of surfaces, and that the absence of familiar objects hinders distance judgment [51,52,53,54].
Participants also reported difficulties in estimating distance in environment 2 (space scape), the moderate spatial cue condition, due to the presence of unfamiliar spatial features, such as mountains, valleys, and craters. Some participants reported it was challenging to determine whether the mountain on the Mars-like terrain was a big mountain far away or a small sandpile close by, because of the deceptive nature of the altered environment’s surface. Therefore, distance judgment varied considerably between participants. One participant estimated a target at an actual distance nine meters from the standing point as being one meter away, while another judged the same 9-m target to be 356 m away. Alan Shepard, a former Apollo 14 astronaut, remarked in On the Moon: The Apollo Journals, that “It’s crystal clear up there–there’s no closeness that you try to associate with it in Earth terms–it just looks a lot closer than it is” ([55], as cited in [51]).
In the size estimation task, a tendency to underestimate depth was observed. This resonates with previous studies [23,24,56]. Existing research indicated consistent underestimation of depth and overestimation of height by participants in altered conditions, such as microgravity and lunar terrain. Moreover, our experiment found that the size estimation was more accurate under the minimum visual cue condition, suggesting that the relationship between size perception and presence of visual cues might be non-linear. The existence of unfamiliar visual cues may potentially produce more misleading size perceptions than an environment with no visual cues, where individuals solely rely on an idiosyncratic reference frame.
Our findings underscore the need for extra support for spatial perception ability through workforce training for extreme environmental conditions (e.g., alien or arctic terrain). As [57] stated, “If an astronaut cannot accurately visualize the volume of the station, its surroundings, or a planetary surface, navigation may cause delays and frustration. There may also be consequences for space habitat design if squared volumes do not look square to people in space”.

6. Limitations

The study reported here has certain limitations that are important to mention. As it was a preliminary study, the number of trials and participants was relatively small. Future research should increase both. The extreme environment (e.g., Mars-like terrain) simulated in this study did not consider different lighting conditions [24,58]. Relatedly, we did not consider shadows, surface color, nor textural contrast [59]. Additionally, virtual environments may not be fully representative of a real environment; thus, caution must be exercised in interpreting the results. Future work should directly compare virtual and real conditions to see if these cues may moderate human spatial perception.

7. Conclusions

This novel study demonstrated a clear impairment of spatial perception under extreme conditions. The results suggest that new tools are necessary to train future workers, whose environment may well be extreme, to improve spatial abilities. Future work in space, for example, will include constructing habitable bases or stations, conducting experiments, and collecting samples in vast uninhabited environments. These tasks, and those perhaps yet unimagined, will require a wide range of perceptual motor and perceptual cognitive tasks, all requiring excellent spatial abilities [23,54,60,61]. Piloting-based tasks, such as safely flying and landing quadcopters and operating unmanned/manned rovers, require complete understanding of the spatial characteristics necessary to successfully execute the task. Spatial perception including judgement of relative size, height, scale, and position of spatial components will be critical to such work [4,21]. In the same vein, spatial ability is relevant to submarine and polar exploration missions, and a similar ability will be necessary to succeed in these environments, as in space missions [20].
Our findings have potential applications in other work domains exhibiting extreme visual and gravitational conditions; deep sea and deserts are two such candidates. Similar spatial difficulties are often reported by workers in underwater environments [62]. Our study, though preliminary, provides insights into how environments with limited or no visual cues impair spatial cognition. It also illuminates the use of technologies for training workers to adapt to such extreme environments and suggests how such tools could be designed and developed. It is hoped that this study provides an impetus for similar investigations in a range of other extreme environmental conditions.

Author Contributions

Conceptualization, H.P. and M.D.; methodology, H.P. and M.D.; VR development, H.P.; formal analysis, N.F.; writing—original draft preparation, H.P.; writing—review and editing, M.D., J.V., A.M.; visualization, H.P.; supervision, M.D. All authors have read and agreed to the published version of the manuscript.

Funding

This research was funded by National Science Foundation (NSF) under Grant 1928695. We have no conflicts of interest to disclose.

Institutional Review Board Statement

The study was approved by the Institutional Review Board of Texas A&M University (IRB2019-1707D, Approval Date: 2 November 2019).

Informed Consent Statement

Informed consent was obtained from all subjects involved in the study.

Data Availability Statement

Not applicable.

Conflicts of Interest

The authors declare no conflict of interest. The funders had no role in the design of the study; in the collection, analyses, or interpretation of data; in the writing of the manuscript, or in the decision to publish the results.

References

  1. Clément, G.; Allaway, H.C.; Demel, M.; Golemis, A.; Kindrat, A.N.; Melinyshyn, A.N.; Thirsk, R. Long-duration spaceflight increases depth ambiguity of reversible perspective figures. PLoS ONE 2015, 10, e0132317. [Google Scholar]
  2. Stapleton, T.; Heldmann, M.; Schneider, S.; O’Neill, J.; Samplatsky, D.; White, K.; Corallo, R. Environmental Control and Life Support for Deep Space Travel. In Proceedings of the 46th International Conference on Environmental Systems, Vienna, Austria, 10–14 July 2016. [Google Scholar]
  3. Kanas, N. Psychology in deep space. Psychologist 2015, 28, 804–807. [Google Scholar]
  4. Marin, F.; Beluffi, C. Computing the Minimal Crew for a multi-generational space journey towards Proxima Centauri b. J. Br. Interplanet. Soc. 2018, 71, 45–52. [Google Scholar]
  5. Smith, C.M. Estimation of a genetically viable population for multigenerational interstellar voyaging: Review and data for project Hyperion. Acta Astronaut. 2014, 97, 16–29. [Google Scholar] [CrossRef]
  6. Tiziani, M. The Colonization of Space, An Anthropological Outlook. Antrocom Online J. Anthropol. 2013, 9, 225–236. [Google Scholar]
  7. Stahn, A.C.; Gunga, H.C.; Kohlberg, E.; Gallinat, J.; Dinges, D.F.; Kühn, S. Brain changes in response to long Antarctic expeditions. N. Engl. J. Med. 2019, 381, 2273–2275. [Google Scholar] [CrossRef]
  8. Menchaca-Brandan, M.A.; Liu, A.M.; Oman, C.M.; Natapoff, A. Influence of perspective-taking and mental rotation abilities in space teleoperation. In Proceedings of the ACM/IEEE International Conference on Human-Robot Interaction, Arlington, VA, USA, 9–11 March 2007; pp. 271–278. [Google Scholar]
  9. Lapointe, J.F.; Dupuis, E.; Hartman, L.; Gillett, R. An analysis of low-earth orbit space operations. In National Research Council of Canada. In Proceedings of the Joint Association of Canadian Ergonomists/Applied Ergonomics (ACE-AE) Conference, Banff, AB, Canada, 21–23 October 2002. [Google Scholar]
  10. Oman, C. Spatial orientation and navigation in microgravity. In Spatial Processing in Navigation, Imagery and Perception; Springer: Boston, MA, USA, 2007; pp. 209–247. [Google Scholar]
  11. Heth, C.D.; Cornell, E.H.; Alberts, D.M. Differential use of landmarks by 8-and 12-year-old children during route reversal navigation. J. Environ. Psychol. 1997, 17, 199–213. [Google Scholar] [CrossRef]
  12. Dabbs, J.M., Jr.; Chang, E.L.; Strong, R.A.; Milun, R. Spatial ability, navigation strategy, and geographic knowledge among men and women. Evol. Hum. Behav. 1998, 19, 89–98. [Google Scholar] [CrossRef]
  13. Castelli, L.; Corazzini, L.L.; Geminiani, G.C. Spatial navigation in large-scale virtual environments: Gender differences in survey tasks. Comput. Hum. Behav. 2008, 24, 1643–1667. [Google Scholar] [CrossRef]
  14. Witmer, B.G.; Sadowski, W.J., Jr. Nonvisually guided locomotion to a previously viewed target in real and virtual environments. Hum. Factors 1998, 40, 478–488. [Google Scholar] [CrossRef]
  15. Weisberg, S.M.; Schinazi, V.R.; Newcombe, N.S.; Shipley, T.F.; Epstein, R.A. Variations in cognitive maps: Understanding individual differences in navigation. J. Exp. Psychol. Learn. Mem. Cogn. 2014, 40, 669. [Google Scholar] [CrossRef] [PubMed] [Green Version]
  16. Shebilske, W.L.; Tubré, T.; Tubré, A.H.; Oman, C.M.; Richards, J.T. Three-dimensional spatial skill training in a simulated space station: Random vs. blocked designs. Aviat. Space Environ. Med. 2006, 77, 404–409. [Google Scholar] [PubMed]
  17. Guo, J.; Jiang, G.; Liu, Y.; Tian, Y. The Hierarchical Model of Spatial Orientation Task in a Multi-Module Space Station. In Advances in Ergonomics Modeling, Usability & Special Populations; Springer: Cham, Switzerland, 2017; pp. 129–138. [Google Scholar]
  18. Jain, D.; Sra, M.; Guo, J.; Marques, R.; Wu, R.; Chiu, J.; Schmandt, C. Immersive terrestrial scuba diving using virtual reality. In Proceedings of the 2016 CHI Conference Extended Abstracts on Human Factors in Computing Systems, San Jose, CA, USA, 7–12 May 2016; pp. 1563–1569. [Google Scholar]
  19. Miiro, S. The Issues and Complexities Surrounding the Future of Long Duration Spaceflight. Master’s Thesis, Embry-Riddle Aeronautical University, Daytona Beach, FL, USA, 2017. [Google Scholar]
  20. Kanas, N.; Manzey, D. Space Psychology and Psychiatry; Springer Science & Business Media: Berlin/Heidelberg, Germany, 2008; Volume 22. [Google Scholar]
  21. Newcombe, N.S. Spatial cognition. In Steven’s Handbook of Experimental Psychology; Pashler, H., Medin, D., Eds.; Jossey-Bass: San Francisco, CA, USA, 2002; Volume 2, pp. 113–163. [Google Scholar]
  22. Linenger, J.M. Off the Planet: Surviving Five Perilous Months aboard the Space Station Mir; McGraw-Hill: New York, NY, USA, 2000; p. 256. [Google Scholar]
  23. Clément, G.; Lathan, C.; Lockerd, A. Perception of depth in microgravity during parabolic flight. Acta Astronaut. 2008, 63, 828–832. [Google Scholar] [CrossRef]
  24. Oravetz, C. Human Estimation of Slope, Distance, and Height of Terrain in Simulated Lunar Conditions. Ph.D. Thesis, Massachusetts Institute of Technology, Cambridge, MA, USA, 2009. [Google Scholar]
  25. Villard, E.; Garcia-Moreno, F.T.; Peter, N.; Clément, G. Geometric visual illusions in microgravity during parabolic flight. Neuroreport 2005, 16, 1395–1398. [Google Scholar] [CrossRef]
  26. Jörges, B.; López-Moliner, J. Gravity as a strong prior: Implications for perception and action. Front. Hum. Neurosci. 2017, 11, 203. [Google Scholar] [CrossRef] [Green Version]
  27. MacNeil, R.R.; Che, H.; Khan, M. Human space exploration: Neurosensory, perceptual and neurocognitive considerations. Univ. Tor. Med. J. 2016, 93, 19–26. [Google Scholar]
  28. Lockard, E.S. From Hostile to Hospitable: Changing Perceptions of the Space Environment. In Proceedings of the 45th International Conference on Environmental Systems, Bellevue, WA, USA, 12–16 July 2015. [Google Scholar]
  29. Riecke, B.E.; Veen, H.A.V.; Bülthoff, H.H. Visual homing is possible without landmarks: A path integration study in virtual reality. Presence Teleoperators Virtual Environ. 2002, 11, 443–473. [Google Scholar] [CrossRef]
  30. Sturz, B.R.; Bodily, K.D. Encoding of variability of landmark-based spatial information. Psychol. Res. 2010, 74, 560–567. [Google Scholar] [CrossRef]
  31. Naceri, A.; Chellali, R.; Hoinville, T. Depth perception within peripersonal space using head-mounted display. Presence Teleoperators Virtual Environ. 2011, 20, 254–272. [Google Scholar] [CrossRef]
  32. Vienne, C.; Masfrand, S.; Bourdin, C.; Vercher, J.L. Depth Perception in Virtual Reality Systems: Effect of Screen Distance, Environment Richness and Display Factors. IEEE Access 2020, 8, 29099–29110. [Google Scholar] [CrossRef]
  33. Ballestin, G.; Chessa, M.; Solari, F. A Registration Framework for the Comparison of Video and Optical See-through Devices in Interactive Augmented Reality. IEEE Access 2021, 9, 64828–64843. [Google Scholar] [CrossRef]
  34. Gerig, N.; Mayo, J.; Baur, K.; Wittmann, F.; Riener, R.; Wolf, P. Missing depth cues in virtual reality limit performance and quality of three dimensional reaching movements. PLoS ONE 2018, 13, e0189275. [Google Scholar] [CrossRef] [PubMed] [Green Version]
  35. Thompson, W.B.; Willemsen, P.; Gooch, A.A.; Creem-Regehr, S.H.; Loomis, J.M.; Beall, A.C. Does the quality of the computer graphics matter when judging distances in visually immersive environments? Presence Teleoperators Virtual Environ. 2004, 13, 560–571. [Google Scholar] [CrossRef]
  36. Unity 3D. 2019. Available online: https://unity3d.com/ (accessed on 17 August 2019).
  37. Osborne, J.W.; Overbay, A. The power of outliers (and why researchers should always check for them). Pract. Assess. Res. Eval. 2004, 9, 6. [Google Scholar]
  38. Osborne, J.W.; Christiansen, W.R.I.; Gunter, J.S. Educational psychology from a statistician’s perspective: A review of the quantitative quality of our field. In Proceedings of the Annual Meeting of the American Educational Research Association, Seattle, WA, USA, 10–14 April 2001. [Google Scholar]
  39. Judd, C.M.; McClelland, G.H.; Ryan, C.S. Data Analysis: A Model Comparison Approach; Routledge: London, UK, 2011. [Google Scholar]
  40. Barnett, V.; Lewis, T. Outliers in Statistical Data; Wiley Series in Probability and Mathematical Statistics. Applied Probability and Statistics; Wiley: Hoboken, NJ, USA, 1984. [Google Scholar]
  41. Van Selst, M.; Jolicoeur, P. A solution to the effect of sample size on outlier elimination. Q. J. Exp. Psychol. Sect. A 1994, 47, 631–650. [Google Scholar] [CrossRef]
  42. Knapp, J.M.; Loomis, J.M. Limited field of view of head-mounted displays is not the cause of distance underestimation in virtual environments. Presence Teleoperators Virtual Environ. 2004, 13, 572–577. [Google Scholar] [CrossRef]
  43. Willemsen, P.; Gooch, A.A. Perceived egocentric distances in real, image-based, and traditional virtual environments. In Proceedings of the IEEE Virtual Reality 2002, Orlando, FL, USA, 24–28 March 2002; IEEE: Piscataway, NJ, USA, 2002; pp. 275–276. [Google Scholar]
  44. Rousset, T.; Bourdin, C.; Goulon, C.; Monnoyer, J.; Vercher, J.L. Misperception of egocentric distances in virtual environments: More a question of training than a technological issue? Displays 2018, 52, 8–20. [Google Scholar] [CrossRef]
  45. Peer, A.; Ponto, K. Evaluating perceived distance measures in room-scale spaces using consumer-grade head mounted displays. In Proceedings of the 2017 IEEE Symposium on 3d User Interfaces (3dui), Los Angeles, CA, USA, 18–19 March 2017; IEEE: Piscataway, NJ, USA, 2017; pp. 83–86. [Google Scholar]
  46. Renner, R.S.; Velichkovsky, B.M.; Helmert, J.R. The perception of egocentric distances in virtual environments—A review. ACM Comput. Surv. (CSUR) 2013, 46, 1–40. [Google Scholar] [CrossRef] [Green Version]
  47. Creem-Regehr, S.H.; Stefanucci, J.K.; Thompson, W.B. Perceiving absolute scale in virtual environments: How theory and application have mutually informed the role of body-based perception. In Psychology of Learning and Motivation; Academic Press: Cambridge, MA, USA, 2015; Volume 62, pp. 195–224. [Google Scholar]
  48. Jones, J.A.; Swan, J.E.; Singh, G.; Kolstad, E.; Ellis, S.R. The effects of virtual reality, augmented reality, and motion parallax on egocentric depth perception. In Proceedings of the 5th Symposium on Applied Perception in Graphics and Visualization, Los Angeles, CA, USA, 9–10 August 2008; pp. 9–14. [Google Scholar]
  49. Cutting, J.E. How the eye measures reality and virtual reality. Behav. Res. Methods Instrum. Comput. 1997, 29, 27–36. [Google Scholar] [CrossRef] [Green Version]
  50. Jones, E.M.; Glover, K. (Eds.) Apollo Lunar Surface Journal. 25 November 2008. Available online: http://history.nasa.gov/alsj/ (accessed on 27 April 2021).
  51. Oravetz, C.T.; Young, L.R.; Liu, A.M. Slope, distance, and height estimation of lunar and lunar-like terrain in a virtual reality environment. Gravit. Space Res. 2011, 22. [Google Scholar]
  52. Clark, T.K.; Young, L.R.; Stimpson, A.J.; Duda, K.R.; Oman, C.M. Numerical simulation of human orientation perception during lunar landing. Acta Astronaut. 2011, 69, 420–428. [Google Scholar] [CrossRef]
  53. Redelmeier, D.A.; Raza, S. Optical illusions and life-threatening traffic crashes: A perspective on aerial perspective. Med. Hypotheses 2018, 114, 23–27. [Google Scholar] [CrossRef] [PubMed]
  54. Demidov, N.E.; Lukin, V.V. Antarctica as a testing ground for manned missions to the Moon and Mars. Sol. Syst. Res. 2017, 51, 104–120. [Google Scholar] [CrossRef]
  55. Heiken, G.; Jones, E. On the Moon: The Apollo Journals; Springer Science & Business Media: Berlin/Heidelberg, Germany; IBM Corp.: Armonk, NY, USA, 2007. [Google Scholar]
  56. Patterson, Z. Effects of Avatar Hand-Size Modifications on Size Judgments of Familiar and Abstract Objects in Virtual Reality. Master’s Thesis, University of Minnesota, Minneapolis, MN, USA, 2019. [Google Scholar]
  57. Clément, G. Fundamentals of Space Medicine; Springer Science & Business Media: Berlin/Heidelberg, Germany, 2011; Volume 23. [Google Scholar]
  58. Rahill, K. Lunar Psychophysics: Effects of Atmospheric Light Scattering on Perceptual Distortions in a Lunar Virtual Environment. Ph.D. Thesis, Catholic University of America, Washington, DC, USA, 2019. [Google Scholar]
  59. Higashiyama, A. Horizontal and vertical distance perception: The discorded-orientation theory. Percept. Psychophys. 1996, 58, 259–270. [Google Scholar] [CrossRef] [PubMed]
  60. Bertels, C. Crew Maintenance Lessons Learned from ISS and Considerations for Future Manned Missions. In Proceedings of the SpaceOps 2006 Conference, Rome, Italy, 19–23 June 2006; p. 5952. [Google Scholar]
  61. Serna, J.G.; Gonzalez, F.; Vanegas, F.; Flannery, D. A probabilistic based UAV mission planning and navigation for planetary exploration. In Proceedings of the 2020 International Conference on Unmanned Aircraft Systems (ICUAS), Athens, Greece, 1–4 September 2020; IEEE: Piscataway, NJ, USA, 2020; pp. 594–599. [Google Scholar]
  62. Ross, H.E. Perceptual and motor-skills of divers under water. Int. Rev. Ergon. 1989, 3, 155–181. [Google Scholar]
Figure 1. (A) Environment 1, a cityscape with maximum spatial cues. Familiar landmarks include the chair, trees, bollard, road, doors, and lamp posts. Visual cues denote a gravitational environment, such as the placement of objects on the ground and the horizon. Green and yellow rectangular cuboids are the stimuli for the distance and size estimation test. (B) Environment 2, a space scape with moderate spatial cues. Visual cues denote a gravitational environment include the horizon and the terrain on the ground. It did not contain familiar landmarks. The green and yellow rectangular cuboid is the stimuli for distance and size estimation test. (C) Experimental environment with minimum spatial cues. It did not contain visual cues nor familiar landmark. The green and yellow rectangular cuboid is the stimuli for the distance and size estimation test.
Applsci 11 11510 g001aApplsci 11 11510 g001b
Figure 2. Distance estimation task. “a” and “b” show the egocentric distance between the participant and near and far targets, respectively, and “c” shows the allocentric distance between the two targets.
Applsci 11 11510 g002
Figure 3. Size estimation task for a near (A) and a far (B) object. Participants first identified the shortest side of the cuboid and then were asked to define the aspect ratio of the other side using the proportions of the shortest side.
Applsci 11 11510 g003
Figure 4. Relative error in distance estimation by environmental condition (maximum, moderate, and minimum). The left y axis represents the maximum and minimum conditions and the right y axis the moderate condition. Near and far bars represent the egocentric distances between the participant and each target. Allocentric bars represent the distance between the two targets. Error bars represent SE.
Applsci 11 11510 g004
Figure 5. Relative error in size estimation by environmental condition (maximum, moderate, and minimum) and target proximity (near and far). Error bars represent SE.
Applsci 11 11510 g005
Table 1. The counterbalanced order of environment and stimuli.
EnvironmentStimuli
Group 1E1E2E3Set ASet BSet C
Group 2E2E1E3Set BSet ASet C
Group 3E3E2E1Set CSet ASet B
Group 4E1E3E2Set ASet CSet B
Group 5E2E3E2Set BSet CSet A
Group 6E3E1E2Set CSet BSet A
E1: Environment 1 (cityscape), E2: Environment 2 (space scape), E3: Environment 3 (outer space).
Publisher’s Note: MDPI stays neutral with regard to jurisdictional claims in published maps and institutional affiliations.

