
An Analysis of Sound Event Detection under Acoustic Degradation Using Multi-Resolution Systems


AUDIAS, Electronic and Communication Technology Department, Escuela Politécnica Superior, Universidad Autónoma de Madrid, Av. Francisco Tomás y Valiente, 11, 28049 Madrid, Spain
*
Author to whom correspondence should be addressed.
Appl. Sci. 2021, 11(23), 11561; https://0-doi-org.brum.beds.ac.uk/10.3390/app112311561
Submission received: 15 October 2021
/
Revised: 29 November 2021
/
Accepted: 1 December 2021
/
Published: 6 December 2021
(This article belongs to the Special Issue IberSPEECH 2020: Speech and Language Technologies for Iberian Languages)
Abstract
:The Sound Event Detection task aims to determine the temporal locations of acoustic events in audio clips. In recent years, the relevance of this field is rising due to the introduction of datasets such as Google AudioSet or DESED (Domestic Environment Sound Event Detection) and competitive evaluations like the DCASE Challenge (Detection and Classification of Acoustic Scenes and Events). In this paper, we analyze the performance of Sound Event Detection systems under diverse artificial acoustic conditions such as high- or low-pass filtering and clipping or dynamic range compression, as well as under an scenario of high overlap between events. For this purpose, the audio was obtained from the Evaluation subset of the DESED dataset, whereas the systems were trained in the context of the DCASE Challenge 2020 Task 4. Our systems are based upon the challenge baseline, which consists of a Convolutional-Recurrent Neural Network trained using the Mean Teacher method, and they employ a multiresolution approach which is able to improve the Sound Event Detection performance through the use of several resolutions during the extraction of Mel-spectrogram features. We provide insights on the benefits of this multiresolution approach in different acoustic settings, and compare the performance of the single-resolution systems in the aforementioned scenarios when using different resolutions. Furthermore, we complement the analysis of the performance in the high-overlap scenario by assessing the degree of overlap of each event category in sound event detection datasets.
1. Introduction
Humans are able to identify the occurrences of our near environment using only acoustic information, namely, by hearing the sounds that are produced by those occurrences. For instance, it is sufficient to hear the knocking of a door to understand the underlying event and act in consequence. In this case, the knock on the door would be an example of a sound event.
The task that aims to automatize the localization of sound events in time and their classification is called Sound Event Detection (SED), and it is currently a relevant field of research in machine learning and signal processing. Over the last decade, several datasets were released with the objective of developing and evaluating SED systems. Urbansound [1] was proposed as an ontology and a sound dataset containing recordings of 10 event categories of urban outdoors environments. Google AudioSet [2] was also released as both an ontology of sound events and a dataset, but considering a wider set of event categories (632) from different domains, and using YouTube (http://youtube.com (accessed on 6 December 2021)) videos as source for the sound clips. The general-purpose ontology of AudioSet was partially used by more recent sound event datasets, such as Freesound Datasets (FSD) [3], which contains 200 event categories and sound recordings from Freesound (http://freesound.org (accessed on 6 December 2021)), or DESED (Domestic Environment Sound Event Detection) [4], which focuses on 10 event categories belonging to the domain of domestic environments and also uses AudioSet as a source for audio recordings, in addition to Vimeo (http://vimeo.com (accessed on 6 December 2021)) and synthetic recordings that are generated by overlapping target events and recordings of background sounds.
Moreover, the competitive evaluations organized by the DCASE (Detection and Classification of Acoustic Scenes and Events) community [5] greatly supported the recent research in the field, and helped to define benchmarks not only for Sound Event Detection, but also for other related tasks such as Acoustic Scene Classification [6] or Anomalous Sound Detection [7]. The DCASE Challenge proposes the task “Sound event detection and separation in domestic environments”, with the goal of determining the temporal boundaries of sound events in 10-second audio clips and classifying them.
In the last years, different deep-learning-based approaches were proposed for the task of Sound Event Detection [8]. Most of them rely on the use of convolutional neural networks (CNN), recurrent neural networks (RNN), or a combination of both (convolutional neural networks, or CRNN) [9,10,11,12,13,14,15]. These neural networks are usually trained over audio features such as the Short-Time Fourier Transform (STFT), mel-spectrograms, or mel-frequency cepstral coefficients (MFCC) [16], in which a bank of filters is applied to short segments of the input audio signal, obtaining a time-frequency representation of the audio. Some recent approaches have also employed attention-based networks [17,18,19] like Conformers [20], which were originally proposed for Speech Recognition.
Whereas the aforementioned deep-learning methods are widely used for other signal processing tasks (e.g., CNN and CRNN for image representation [21,22] or music tagging [23], and conformers for speaker diarization [24] or audio-visual speech recognition [25]), other works tried to further improve SED performance by tackling specific problems like domain mismatch between synthetic and real data [26,27], or by training a sound separation front-end [28], which aims to aid the detection system.
During the 2020 edition of the DCASE Challenge, we introduced an approach that increased the performance of a SED system based in convolutional-recurrent neural networks (CRNN) by using several time-frequency resolutions in the process of mel-spectrogram feature extraction, and then combining the outputs obtained with up to five different time-frequency resolution points. The idea behind this method is that each time-frequency resolution is more adequate for the detection of certain event categories, depending on their temporal and spectral characteristics. Therefore, the combination of resolutions leads to systems that show better overall performance.
In this paper, we offer an analysis of the performance of single-resolution and multiresolution SED systems when facing adverse acoustic scenarios that critically affect the spectra of the acoustic signals (high-pass and low-pass filtering) or their dynamic range (clipping and dynamic range compression), as well as situations in which the acoustic events are noticeably overlapped in time. For this purpose, we process the audio segments of the Public Evaluation set of DESED to achieve the mentioned acoustic conditions, and then compute SED metrics over the resulting datasets. Through this study, we aim to determine whether the improvement on performance obtained by the multiresolution approach is robust to the proposed types of acoustic degradation. These adverse settings represent plausible scenarios that could be found when applying the detectors in other data. For instance, audio from web sources can be recorded using a wide variety of capturing devices that affect their quality and their acoustic characteristics. In the case of a real life application in which sound events are detected in a stream of recorded audio, similar kinds of channel distortions could appear due to the malfunction of the capturing device.
The application of artificially generated acoustic conditions to DESED evaluation data is inspired by some of the scenarios described in the DESED Synthetic evaluation set, in particular, high- and low-pass filtering, dynamic range compression, and clipping. Whereas this dataset was already used to analyze the robustness of state-of-the-art SED systems [29] using synthetically generated audio segments, in this work we apply different degradations to the DESED Public evaluation set, which is formed by real audio recordings obtained from YouTube videos.
The rest of the paper is organized as follows. Section 2 explains the materials used in this work and the methodology of the experiments: the Sound Event Detection task of the DCASE Challenge 2020 (Section 2.1) and its baseline system (Section 2.2), our multiresolution approach (Section 2.3), and the motivation of this analysis and the different acoustic scenarios that we are considering (Section 2.4). In Section 3, the results of the experiments are provided and discussed. Finally, the conclusions of this work are highlighted in Section 4.
2. Materials and Methods
2.1. DCASE 2020 Challenge: “Sound Event Detection and Separation in Domestic Environments”
In the 2020 edition of the DCASE Challenge, one of the tasks proposes a Sound Event Detection scenario where systems are trained using the DESED dataset [4], composed of 10-second audio recordings (Task 4). An optional preprocessing step based on sound separation is proposed in the task, however, the source separation stage is out of the scope of this work.
The training data used for this work includes 1578 weakly labeled and 14,412 unlabeled audio clips extracted from Google AudioSet, along with 2584 strongly labeled audio segments that were synthetically generated using the Scaper toolkit [30]. Synthetic clips contain mixtures of foreground events from Freesound and background soundscapes extracted from the SINS dataset [31].
In addition, a subset of 1168 AudioSet segments is provided (DESED Validation set) with strong, human-verified annotations, which are used to validate the performance of the systems. Finally, the YouTube subset of the DESED 2019 Evaluation set, which is called DESED Public Evaluation, is intended to act as a benchmark for SED performance.
The set of target categories includes ten event categories which are usually found in the acoustic context of a house: Speech, Dog, Cat, Alarm/bell/ringing, Dishes, Frying, Blender, Running water, Vacuum cleaner, and Electric shaver/toothbrush. More than one target category, or several events of the same class, could be present in the same audio recording, and different categories are allowed to overlap in time. The number of occurrences of each event category is not balanced, but the distribution of events is similar across datasets, with some of the categories, like Speech or Dishes presenting larger numbers of appearances, whereas some other classes like Vacuum cleaner or Blender have less examples. Table 1 shows the number of events of each class that can be found in the strongly labeled subsets of DESED.
Systems output the predicted onset and offset times of the detected events, along with their category. To define whether a prediction is correct, a collar of 200 ms is considered for the onset times, whereas for the offset times the collar is the maximum between 200 ms and 20% of the event length, aiming to handle the difficulty to determine the offset times of long events. The system performance is measured by means of the score metric, which is computed as a combination of the True Positive (TP), False Positive (FP) and False Negative (FN) counts [32]:
Firstly, scores are computed for each event category, then the Macro is obtained by averaging the class-wise scores. Macro is used to measure the global performance of the systems.
2.2. DCASE 2020 Baseline System
The challenge provides a baseline system as a benchmark of SED performance [33]. Such system is based on a Convolutional Recurrent Neural Network implemented in pytorch (https://github.com/turpaultn/dcase20_task4 (accessed on 6 December 2021)) and trained using the Mean Teacher method [34] for semisupervised learning. This method defines a teacher network identical to the student, but which weights are computed as an exponential moving average of the student weights. To allow the network to learn from the different types of annotations present in DESED, including strongly labeled, weakly labeled, and unlabeled data, a classification loss and a consistency loss are defined for weak and strong predictions. Whereas the classification loss consists on the binary cross-entropy between the student predictions and the annotations of labeled data, the consistency loss measures the mean square error between the predictions of teacher and student. Therefore, considering that the computation of this consistency loss does not require ground truth annotations, it allows the network to leverage unlabeled data.
The CRNN model is composed of 7 convolutional layers and 2 bidirectional recurrent layers. Each convolutional layer is composed by a different number of blocks that perform three operations: a 2D convolution using a kernel, a ReLU (Rectified Linear Unit) activation function [35], and an average pooling. The convolutions are meant to learn transformations over the input features, while the pooling operations reduce the size of the feature representations in each layer. The recurrent layers are formed by bidirectional gated recurrent units (BiGRU) [36], which are intended to further model the output of the convolutional stage. Additionally, an attention pooling module is used to infer the temporal locations of events using weak labels. The system is fed with the mel-spectrogram features of the audio segments, and the output of the network is a sigmoid layer with 10 outputs, one for each target category. For a given audio segment, this layer provides 10 time sequences, containing the score values (from 0 to 1) of each target category along the duration of the segment. Finally, a threshold is applied to these score sequences, and the resulting binary vectors are smoothed by means of a median filter of approximately 450 ms. A threshold value of is used to compute score. A visual representation of the baseline system structure is presented in Figure 1.
2.3. Multiresolution Analysis
Each sound event category shows different temporal and spectral characteristics. This fact is easily illustrated by the different durations of the event categories, shown in Table 2. Therefore, to improve SED performance, our main idea is that different time-frequency resolutions would be more suited to detect different types of events. Thus, combining the information of several mel-spectrogram features extracted at different resolution points should lead to a better overall performance [37].
Aiming to test this hypothesis, we defined five different time-frequency resolutions, taking as a starting point the resolution used by the baseline system, which we called . Each resolution point is defined by a set of values for the parameters of feature extraction: Fast Fourier Transform (FFT) length (N), window length (L), window hop (R) and number of filters in the Mel filterbank (). Due to the feature extraction process, there is a compromise between temporal resolution and frequency resolution. For instance, increasing the length of the window (L) allows a finer frequency analysis, but implies obtaining a lower time resolution. Hence, we propose a resolution point with twice better time resolution than the baseline, which we call , and a resolution point with twice better frequency resolution than the baseline, which we call . In the intermediate points between each of these points and , we define and , respectively. The parameters of the five resolution points are described in Table 3.
To obtain multiresolution systems, firstly, we trained single-resolution systems, which were based on the DCASE Challenge baseline and modified to operate on each of the different resolution points by adapting the sizes of the pooling layers in the convolutional stage. Then, we performed a model fusion averaging the score sequences given by systems trained with different resolutions before the application of the threshold and the median filter. Using this method, we obtained a three-resolution system which combines the resolution with and , denoted as 3res in this paper, and a five-resolution system combining all the mentioned resolutions, denoted as 5res.
Through the use of the 3res and 5res systems, we were able to outperform the single-resolution baseline system in the DCASE 2020 Challenge task 4 [37,38]. The improvement of performance in terms of macro score was observed over the DESED Validation set and the DESED Public evaluation set. The 5res system was submitted to the evaluation and outperformed the baseline system over the DESED 2020 Evaluation set.
2.4. Experiments under Acoustic Degradation Scenarios
Both the DESED Validation set and the Public Evaluation set consist of YouTube audio segments drawn from Google AudioSet. Due to the crowdsourced nature of a web resource like YouTube, the audio clips can have diverse origins and qualities, ranging from mobile recordings to professional studio productions. Therefore, the evaluation of Sound Event Detection on YouTube data requires the systems to be able to handle a variety of acoustic conditions that sometimes may be adverse for the task.
To test the performance of Sound Event Detection in a wider range of acoustic settings, we have applied several types of degradations to the DESED Public evaluation set, which contains 692 audio clips. We computed the scores of single-resolution and multiresolution systems over the original set and its degraded copies, aiming to analyze to what extent does multiresolution help to improve performance when the test data is degraded.
We consider several types of degradations for the audio segments: frequency filtering, dynamic range compression, clipping, and audio overlap. Whereas the first three scenarios modify the audio segments while keeping the same ground truth labels, the audio overlap scenario sums each audio segment with another one in the dataset, obtaining different clips and labels rather than degraded versions of them. Frequency filtering, dynamic range compression, and clipping are performed employing MATLAB, whereas Python is used to obtain the overlapped audios and annotations.
We apply each operation to the whole dataset, obtaining a total of nine new sets.
2.4.1. Frequency Filtering
We apply high- and low-pass filtering separately. In both cases, aiming to cover different degrees of acoustic degradation, the cutoff frequencies are 500 Hz, 1000 Hz, and 2000 Hz, leading to a total of six copies of the DESED Public evaluation set. The filters used are FIR (Finite Impulse Response), with a steepness factor of .
2.4.2. Dynamic Range Compression
We apply dynamic range compression with a threshold of −50 dB and a ratio value of 5:1. The compressor acts with an attack time of s, and a release time of s.
2.4.3. Clipping
To obtain clipping distortion, we multiply the audio signals, which are bounded to , by a scale factor of 5, limiting the output values again to .
2.4.4. Audio Overlap
Each audio segment in the DESED Public evaluation set is summed with a randomly chosen segment from the same dataset. The assignment of segments is performed through a random permutation of the set, therefore each audio clip is summed exactly once. Additionally, it is assured that clips are not assigned to be summed with themselves. The labels of each resulting segment are computed as the union of the ground truth annotations of both involved clips, resulting in a predominance of event overlap. We performed three random permutations, and summed the original dataset with each one of them, obtaining an overlapped set with three times the size of the Public evaluation set (2076 audio segments).
3. Results and Discussion
All the results are provided in terms of event-based score, considering the same collar settings as in the DCASE 2020 Challenge task 4.
3.1. Results over DESED Public Evaluation Set
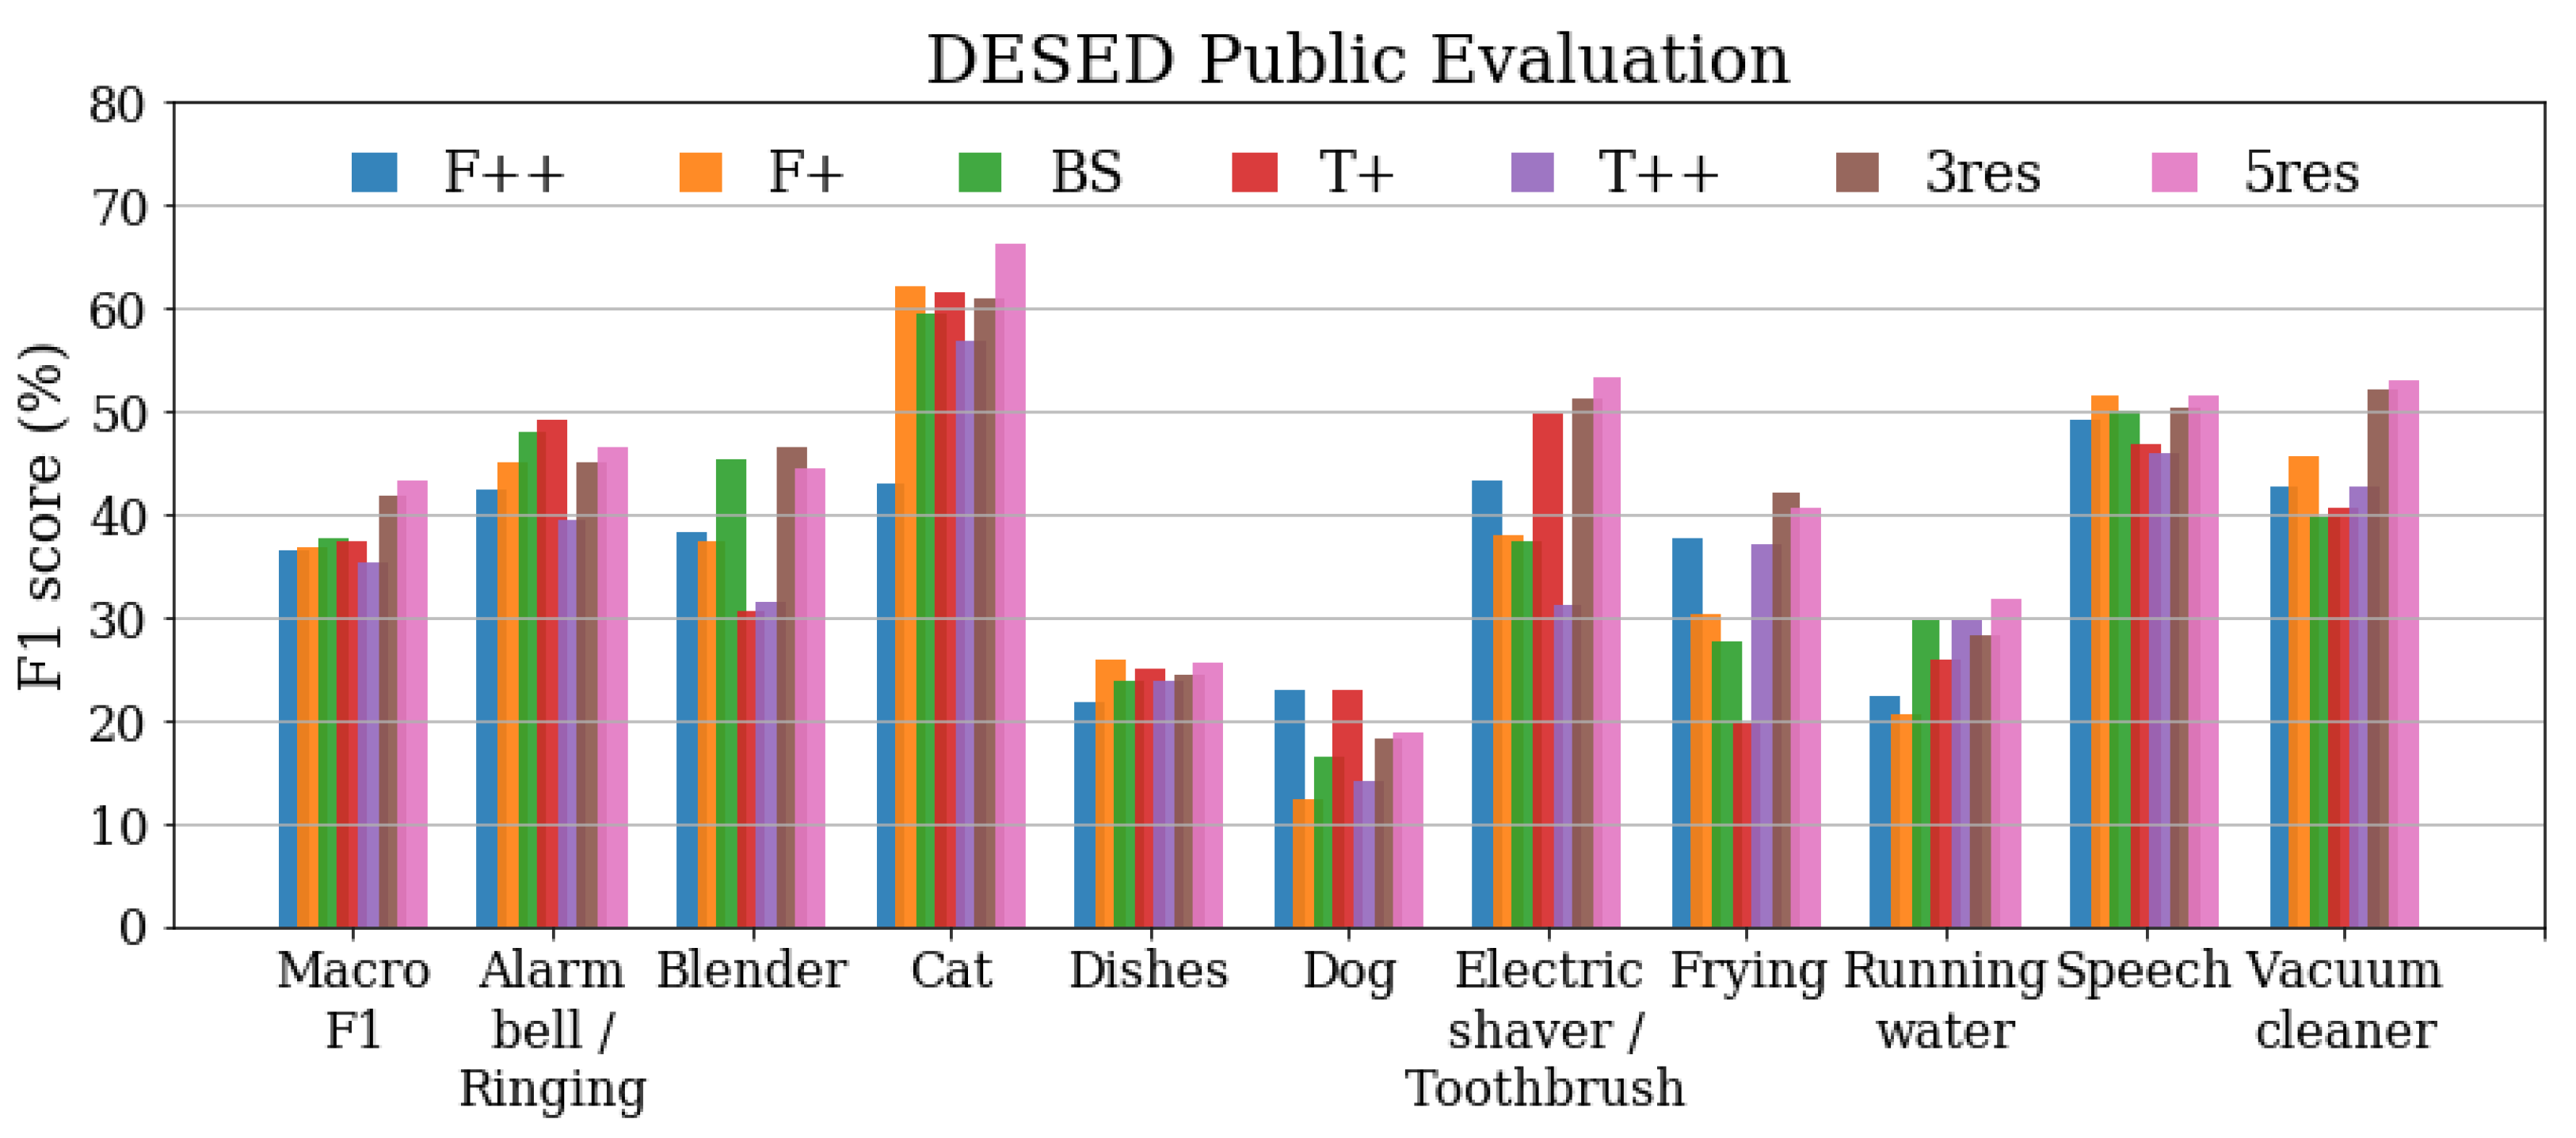
The results of the seven systems over the original DESED Public evaluation set are presented in Figure 2. The figure represents the scores of each system in groups of bars, one group for each event category and an additional one for the macro average, which represents the global performance.
In terms of macro , the 3res and 5res systems both outperform every single-resolution system. However, this improvement is not applicable to every target class. Whereas most event categories obtain their best performance when using a multiresolution system, other classes reach their maximum score with a single-resolution system; this is the case with Alarm/bell/ringing (), Dishes (), Dog (), and Speech ().
3.2. Results under High-Pass Filtering
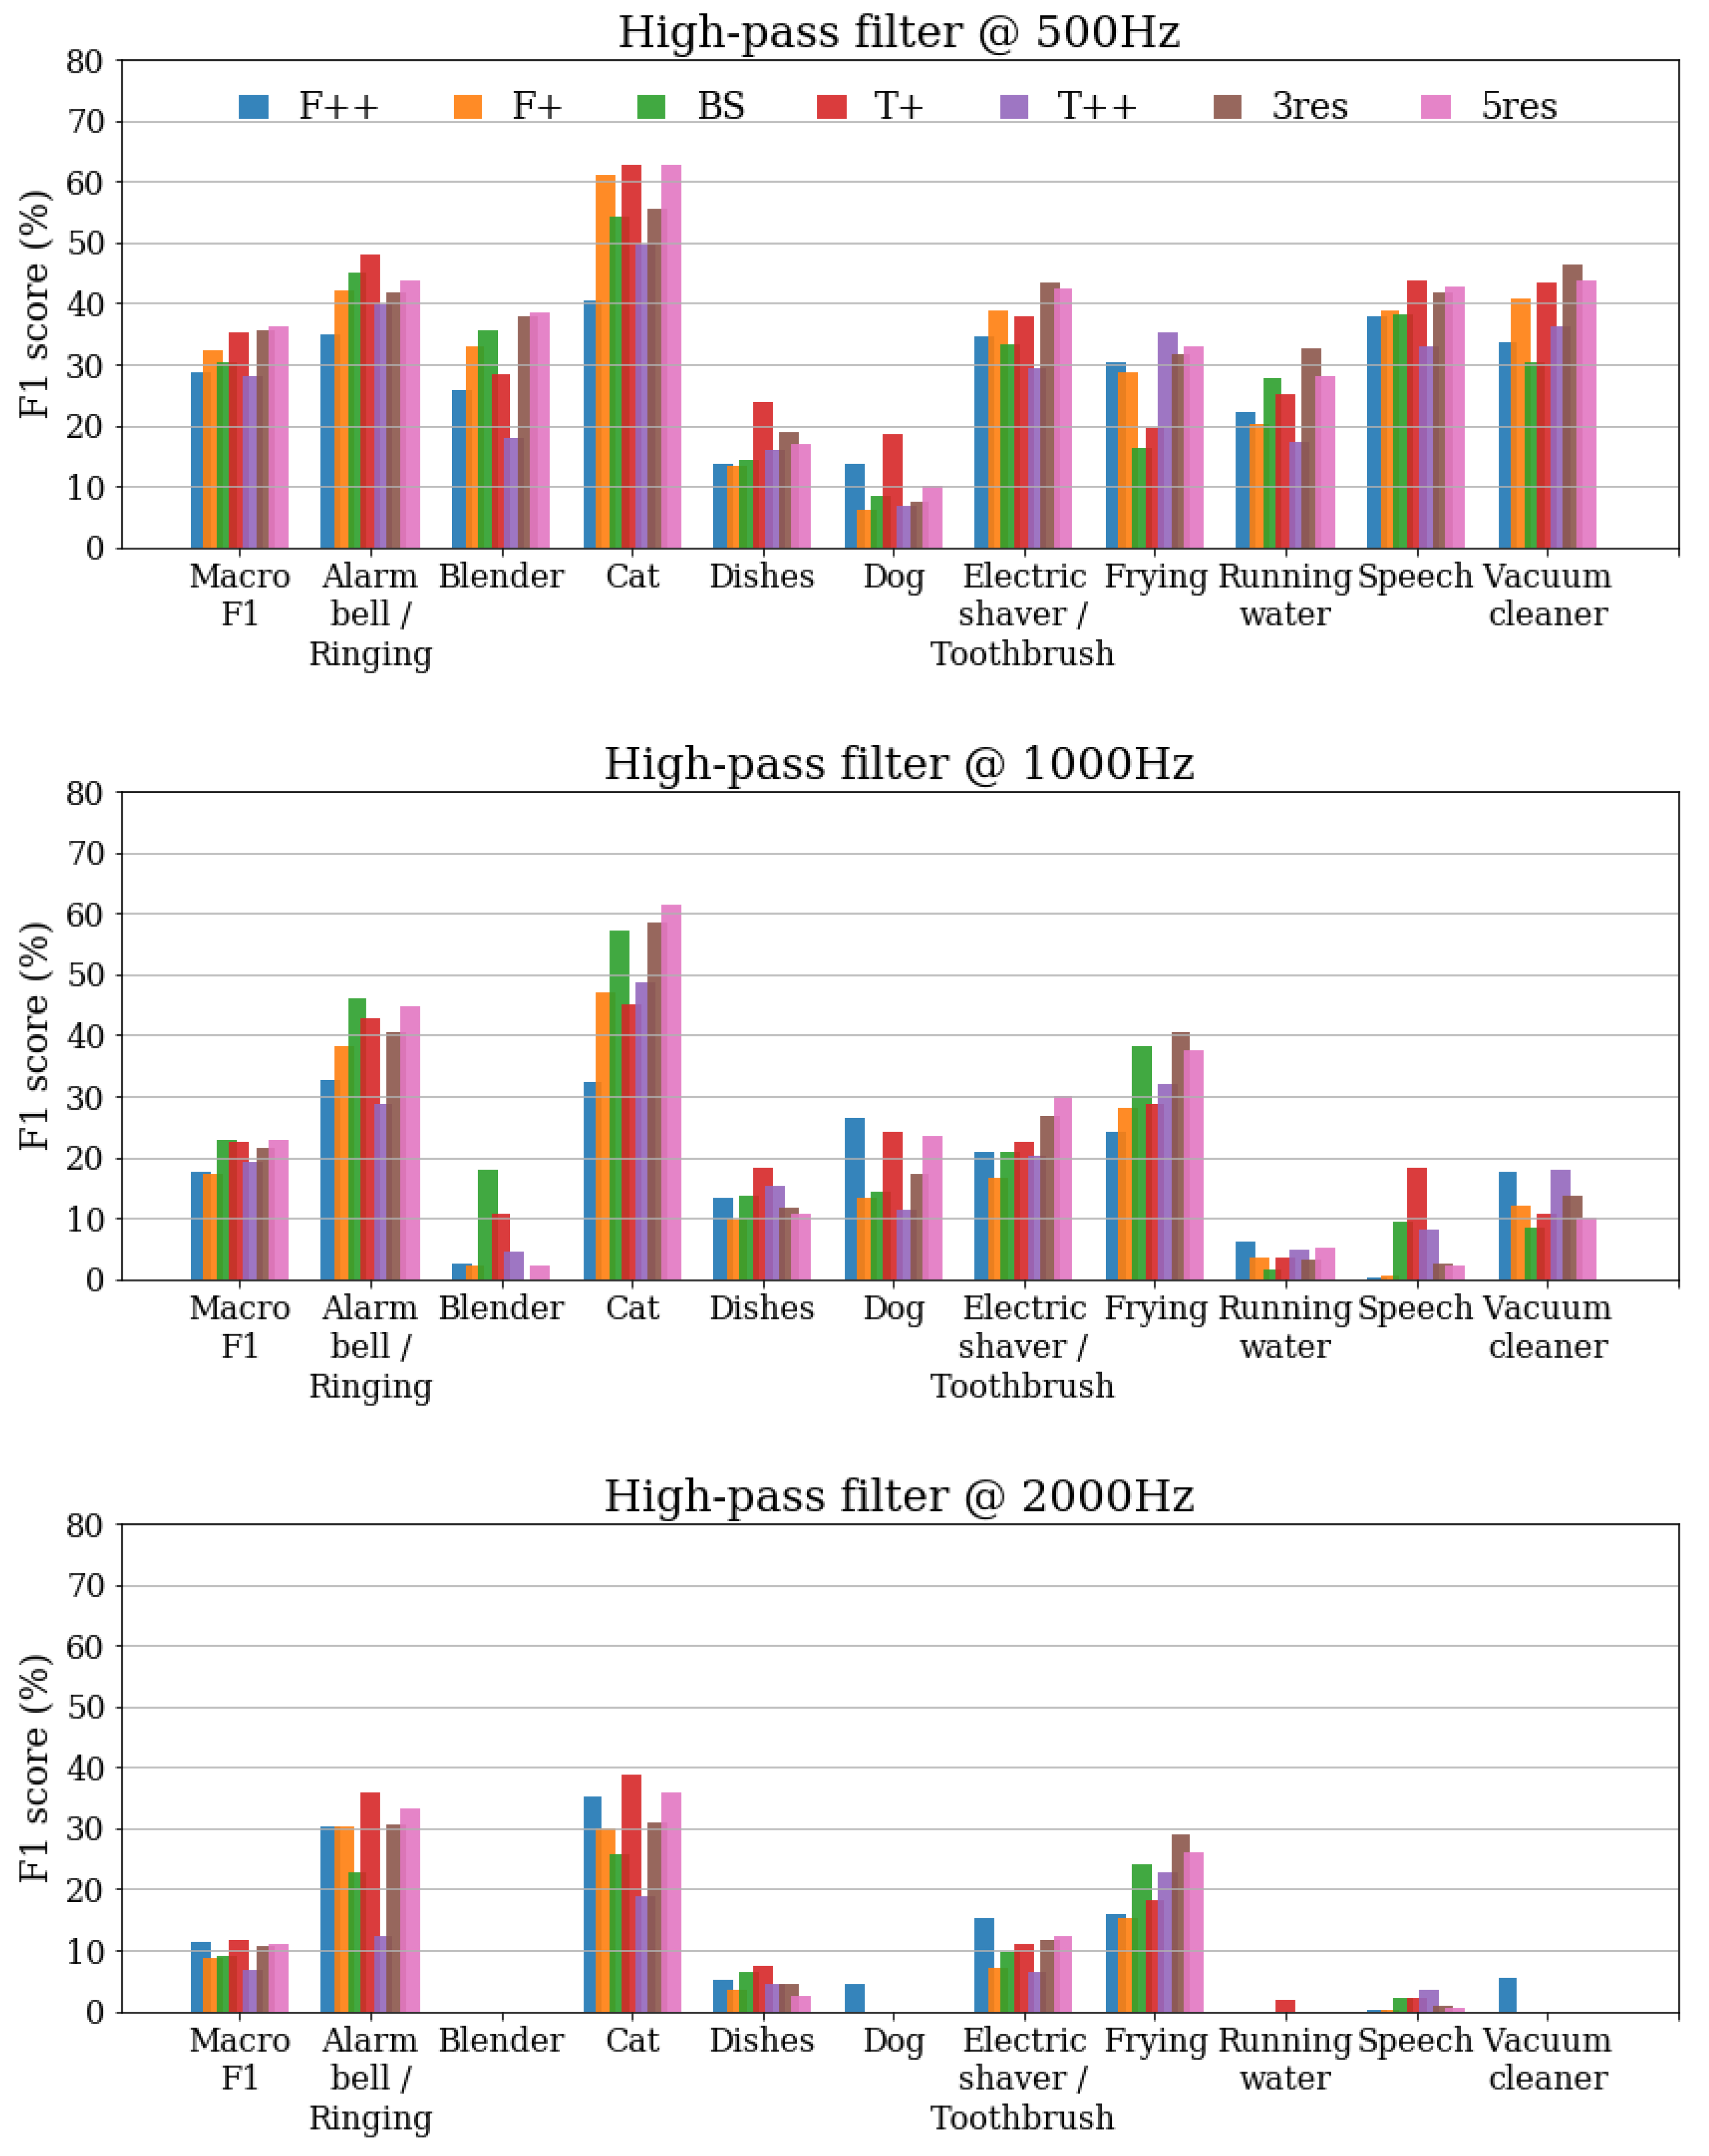
The results obtained when applying high-pass filtering to the DESED Public evaluation set are shown in Figure 3. Three separate graphs are presented, one for each cutoff frequency (). As expected, the general performance decreases for every class and every system when the cutoff frequency of the high-pass filter increases. In terms of macro score, the multiresolution systems 3res and 5res achieve the best results for Hz, similarly to the clean set. However, for 1000 Hz and 2000 Hz the highest macro scores are obtained with some of the single-resolution systems, and , respectively.
3.3. Results under Low-Pass Filtering
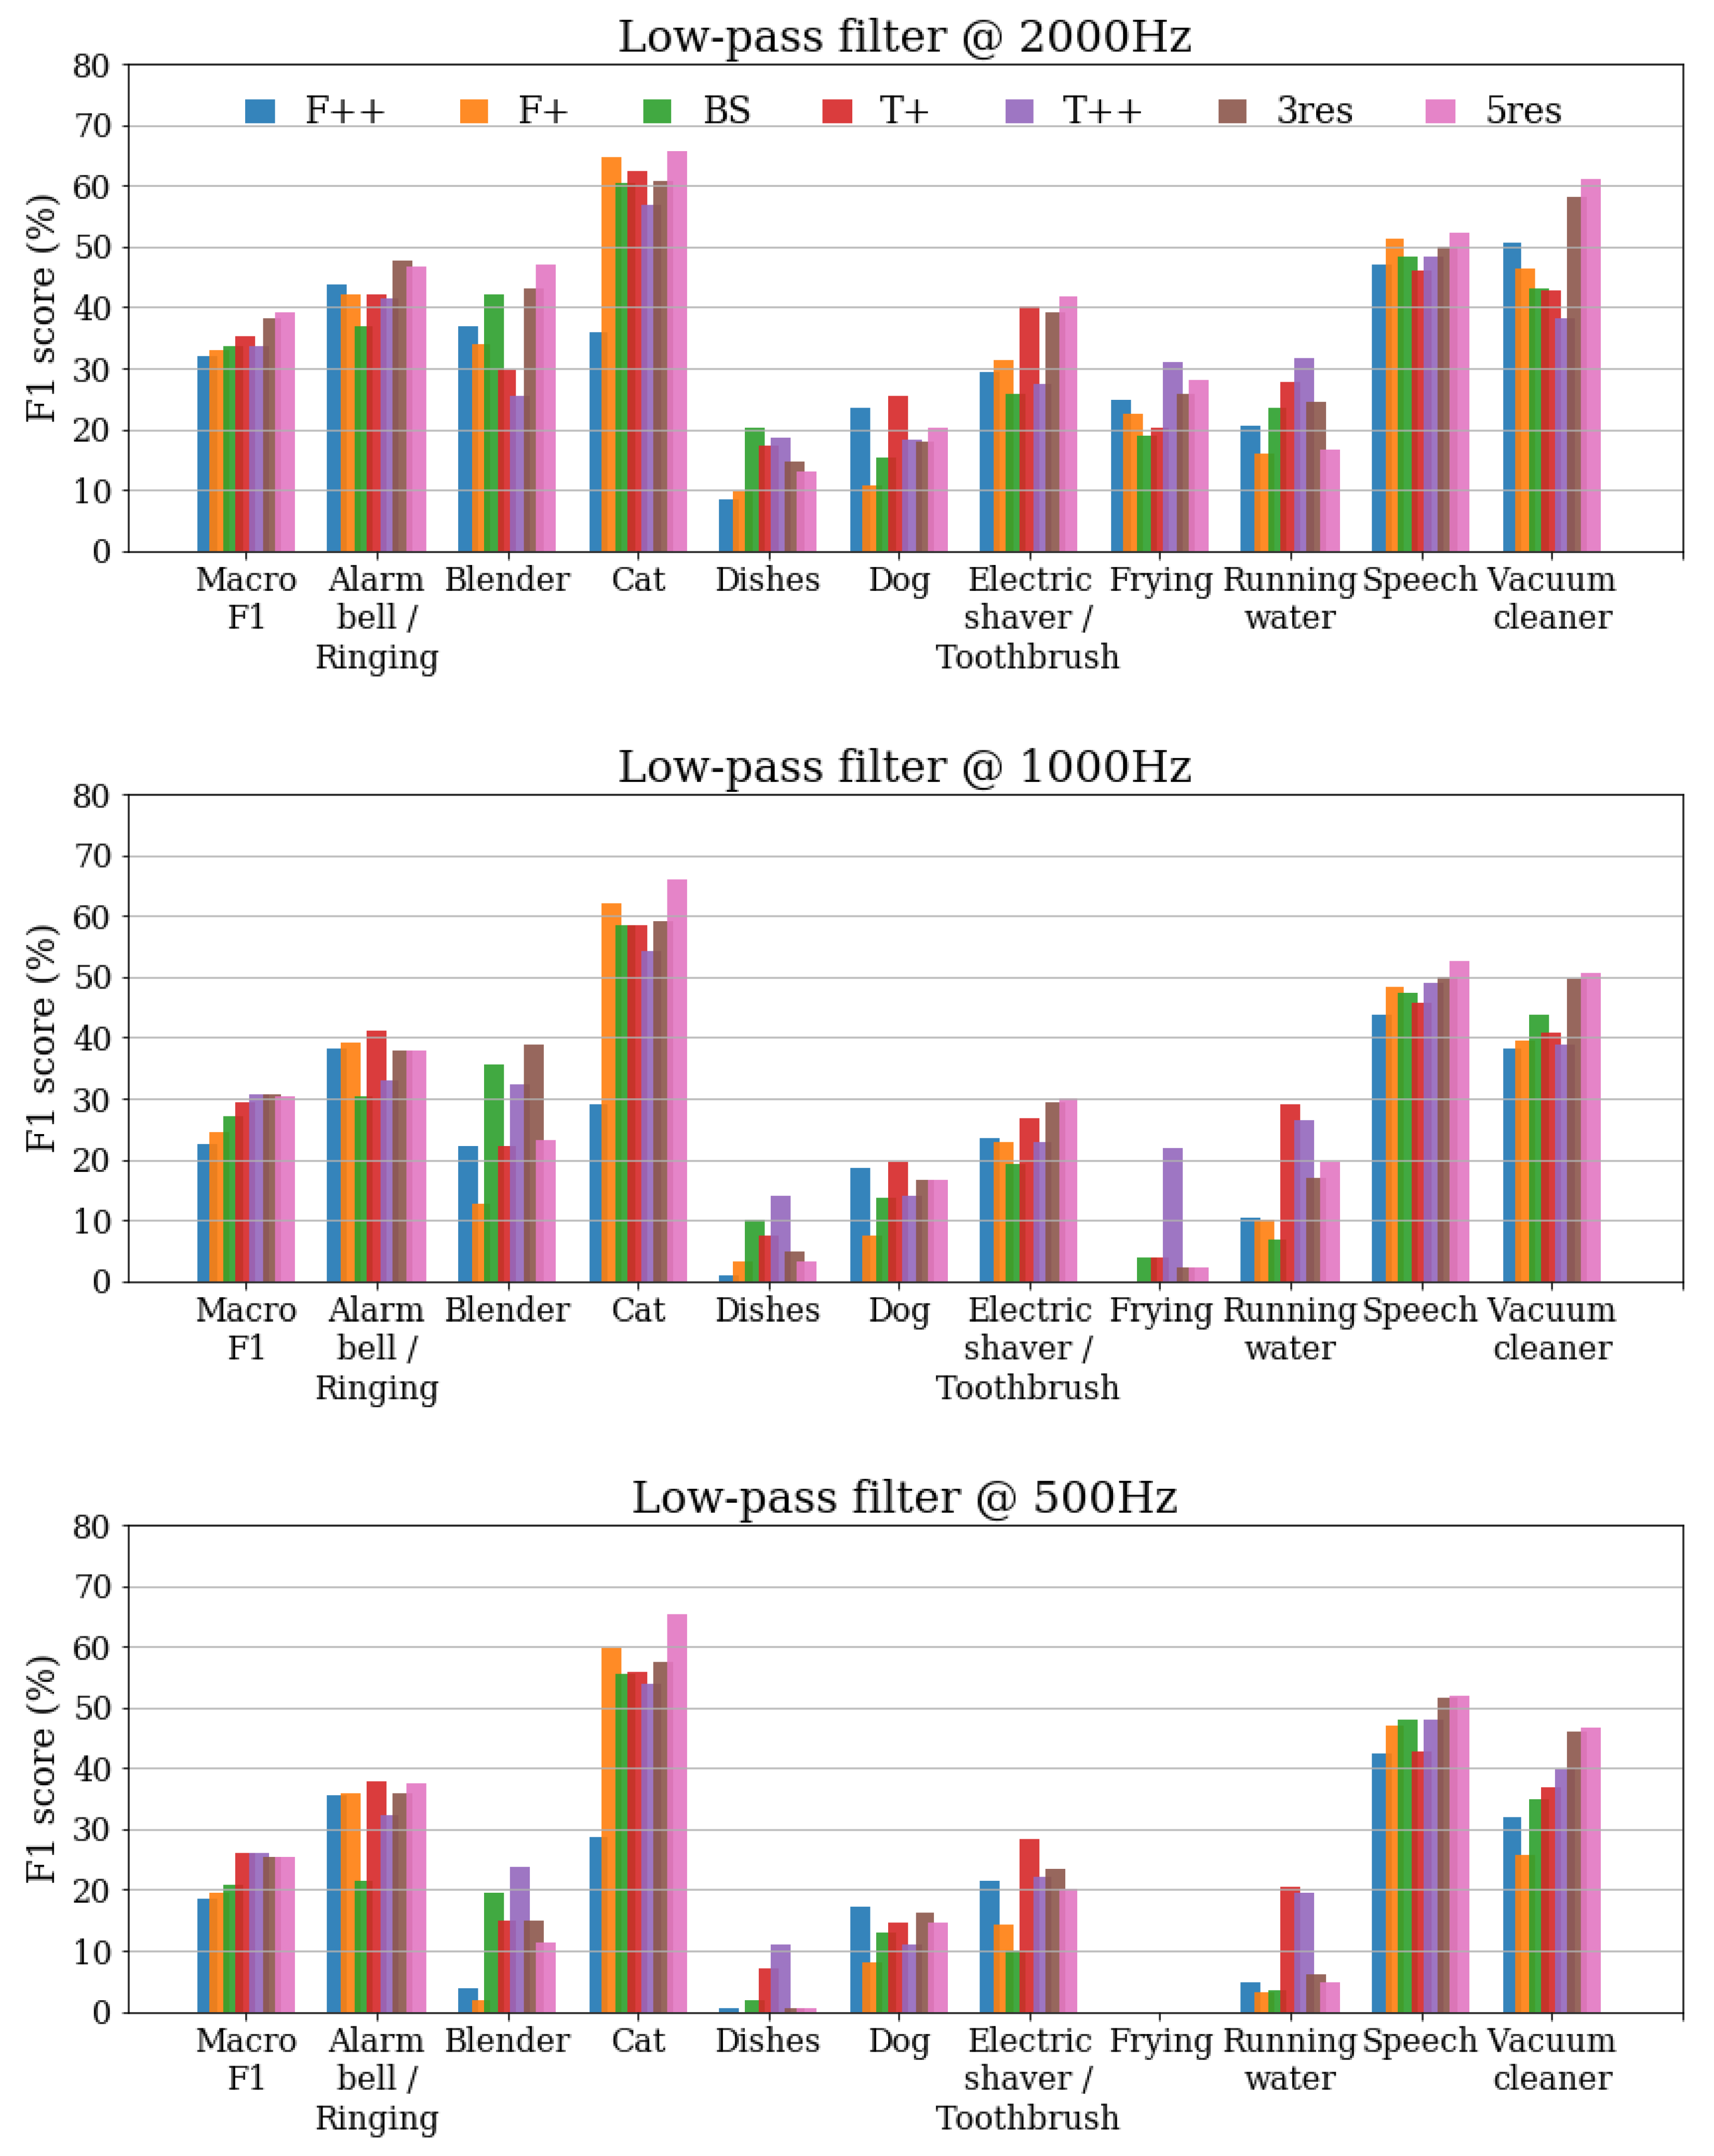
Figure 4 shows the results for the DESED Public evaluation set after applying low-pass filtering with 2000 Hz, 1000 Hz and Hz. The performances decrease when lowering the cutoff frequency of the filter, which is the expected behavior. When using a cutoff frequency 2000 Hz, the best overall performance is obtained by the multiresolution system 5res, whereas for 1000 Hz both 3res and achieve the highest macro . When the cutoff frequency is set to Hz, the best macro scores are obtained with the single-resolution systems and .
3.4. Results under Dynamic Range Compression
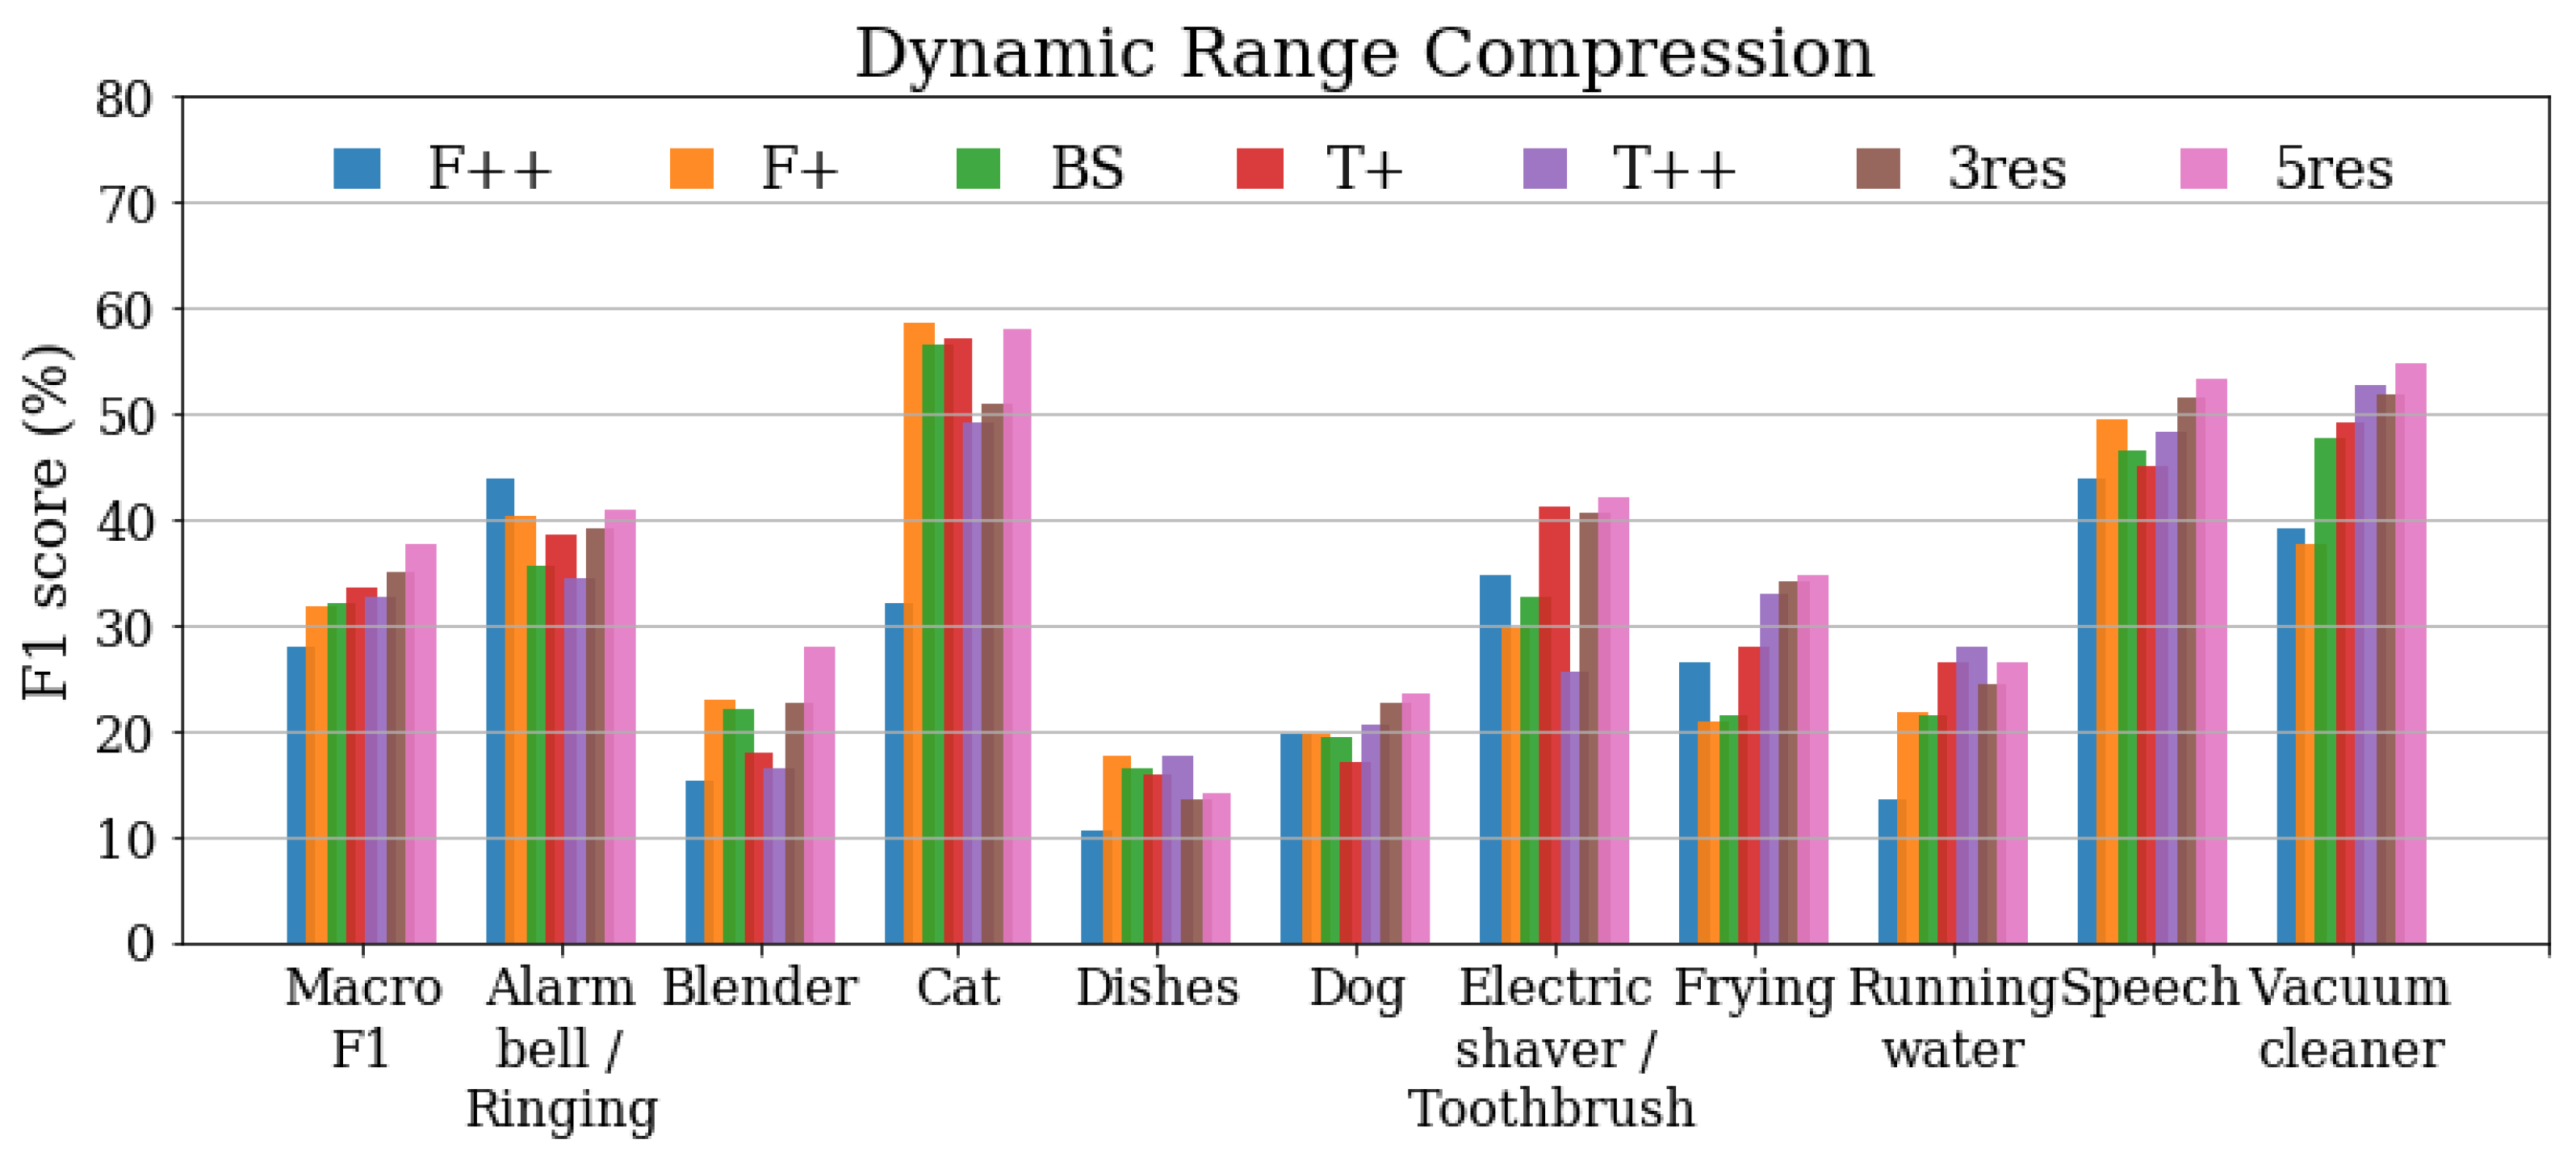
The results obtained after applying dynamic range compression to the DESED Public evaluation set are presented in Figure 5. In this scenario, the best overall performance (macro ) is obtained by the multiresolution systems, 3res and 5res. However, for some particular classes the best performance is obtained with a single-resolution system, as observed in the clean set results. Such is the case of Alarm/bell/ringing (), Cat (), Dishes (), and Running water ().
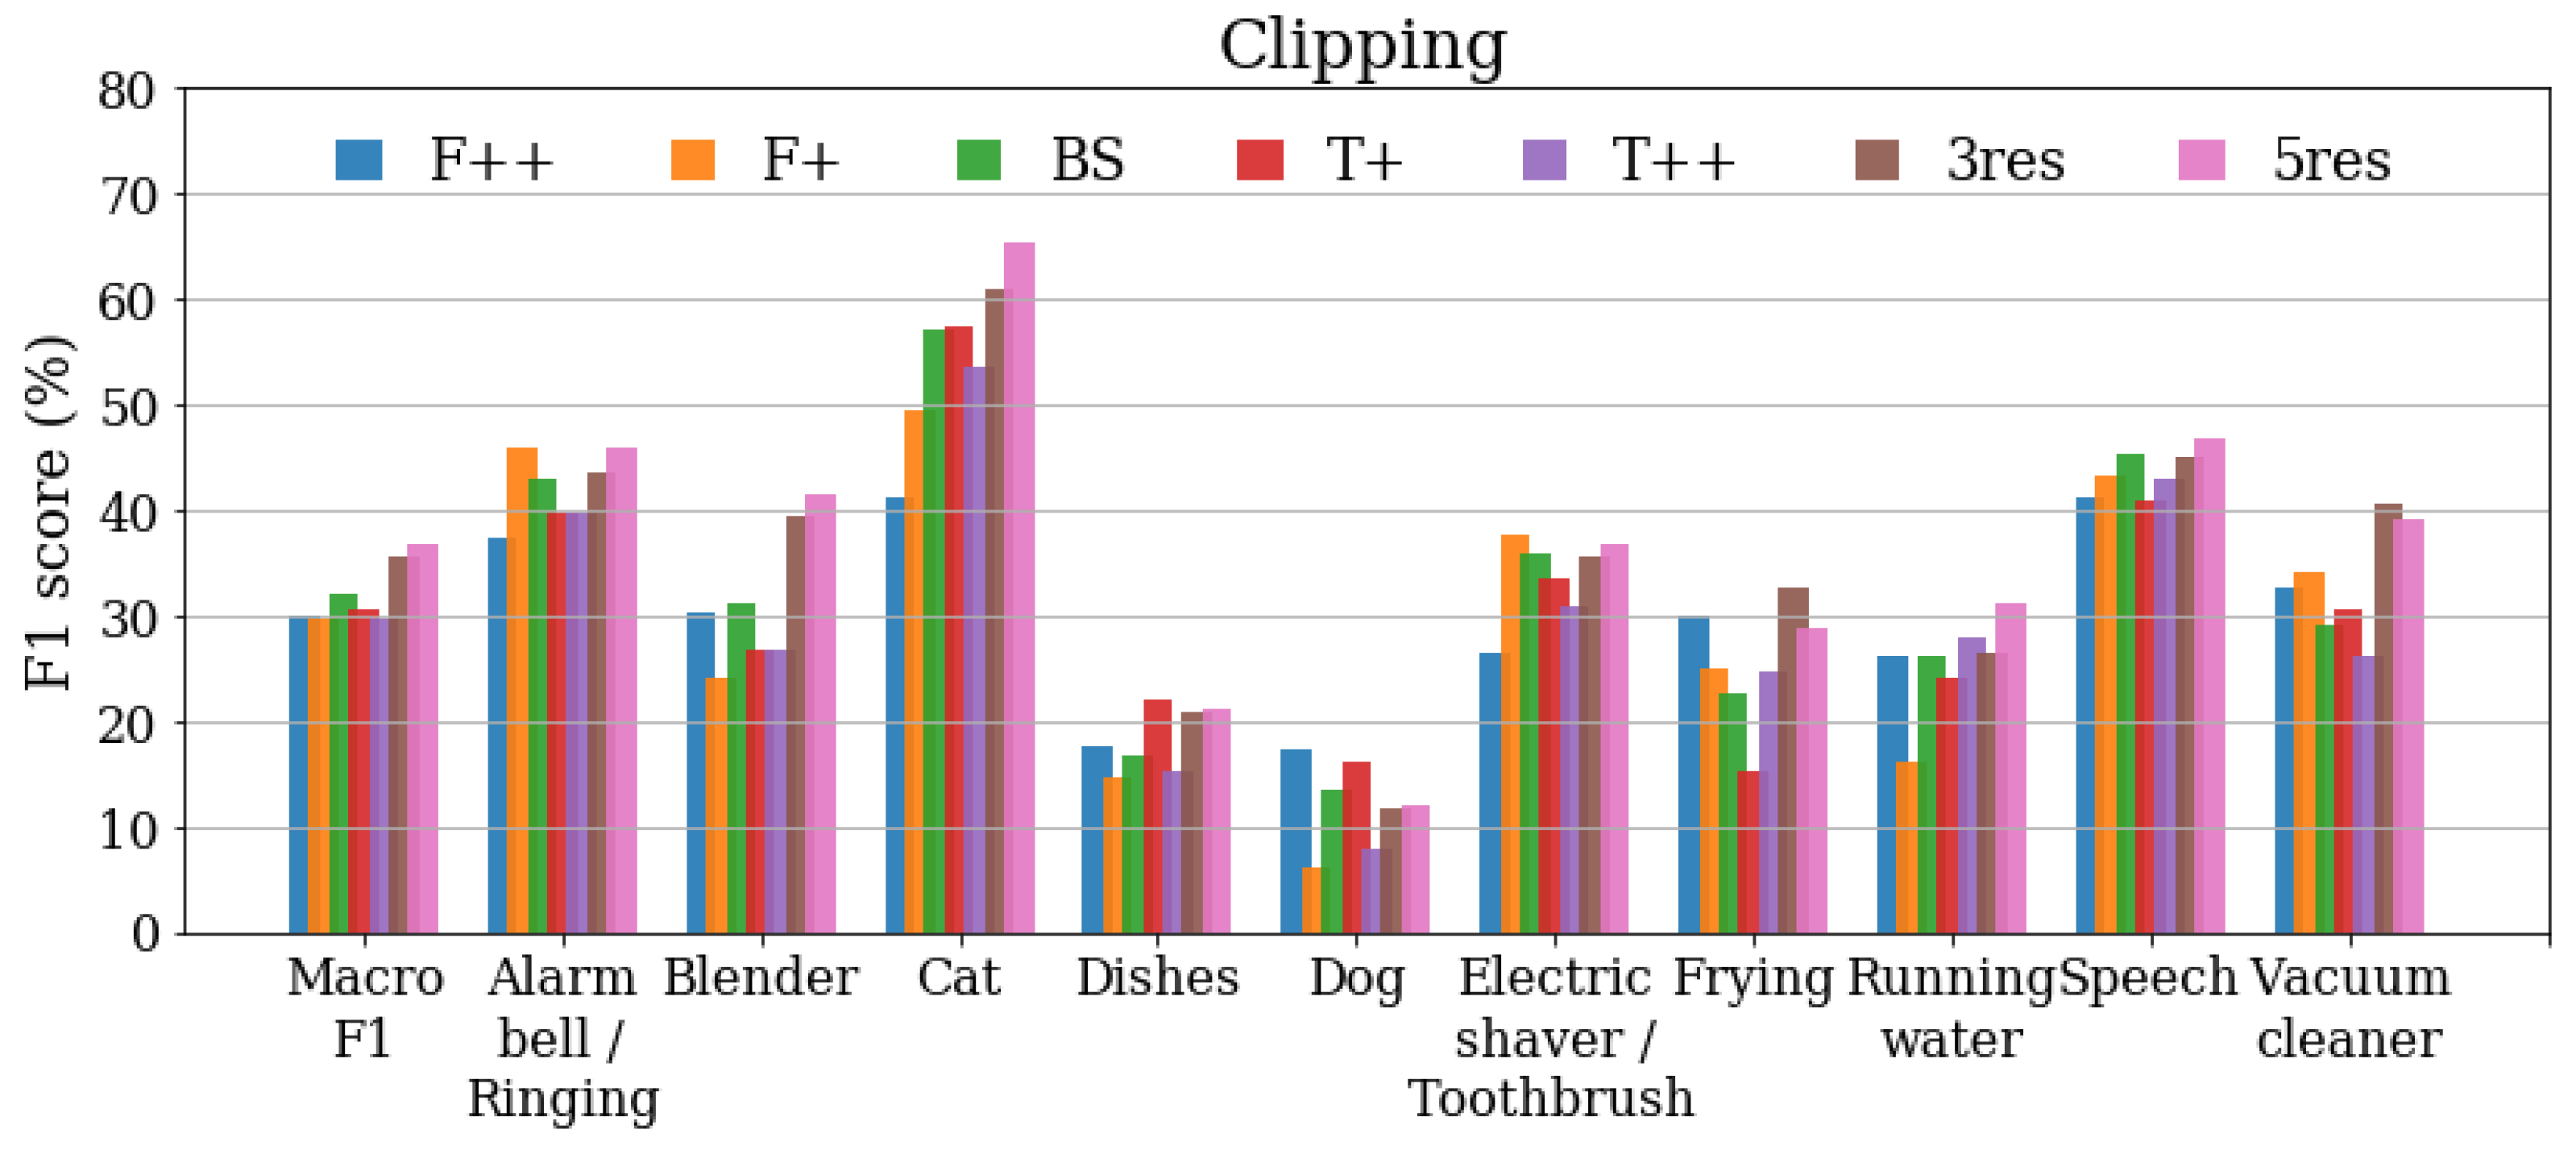
3.5. Results under Clipping
Figure 6 presents the results obtained when applying clipping saturation to the Public evaluation set. The best macro performances are achieved by the multiresolution systems, whereas in some event categories multiresolution is not able to outperform every single-resolution system. This situation is observed for Dishes (), Dog () and Shaver ().
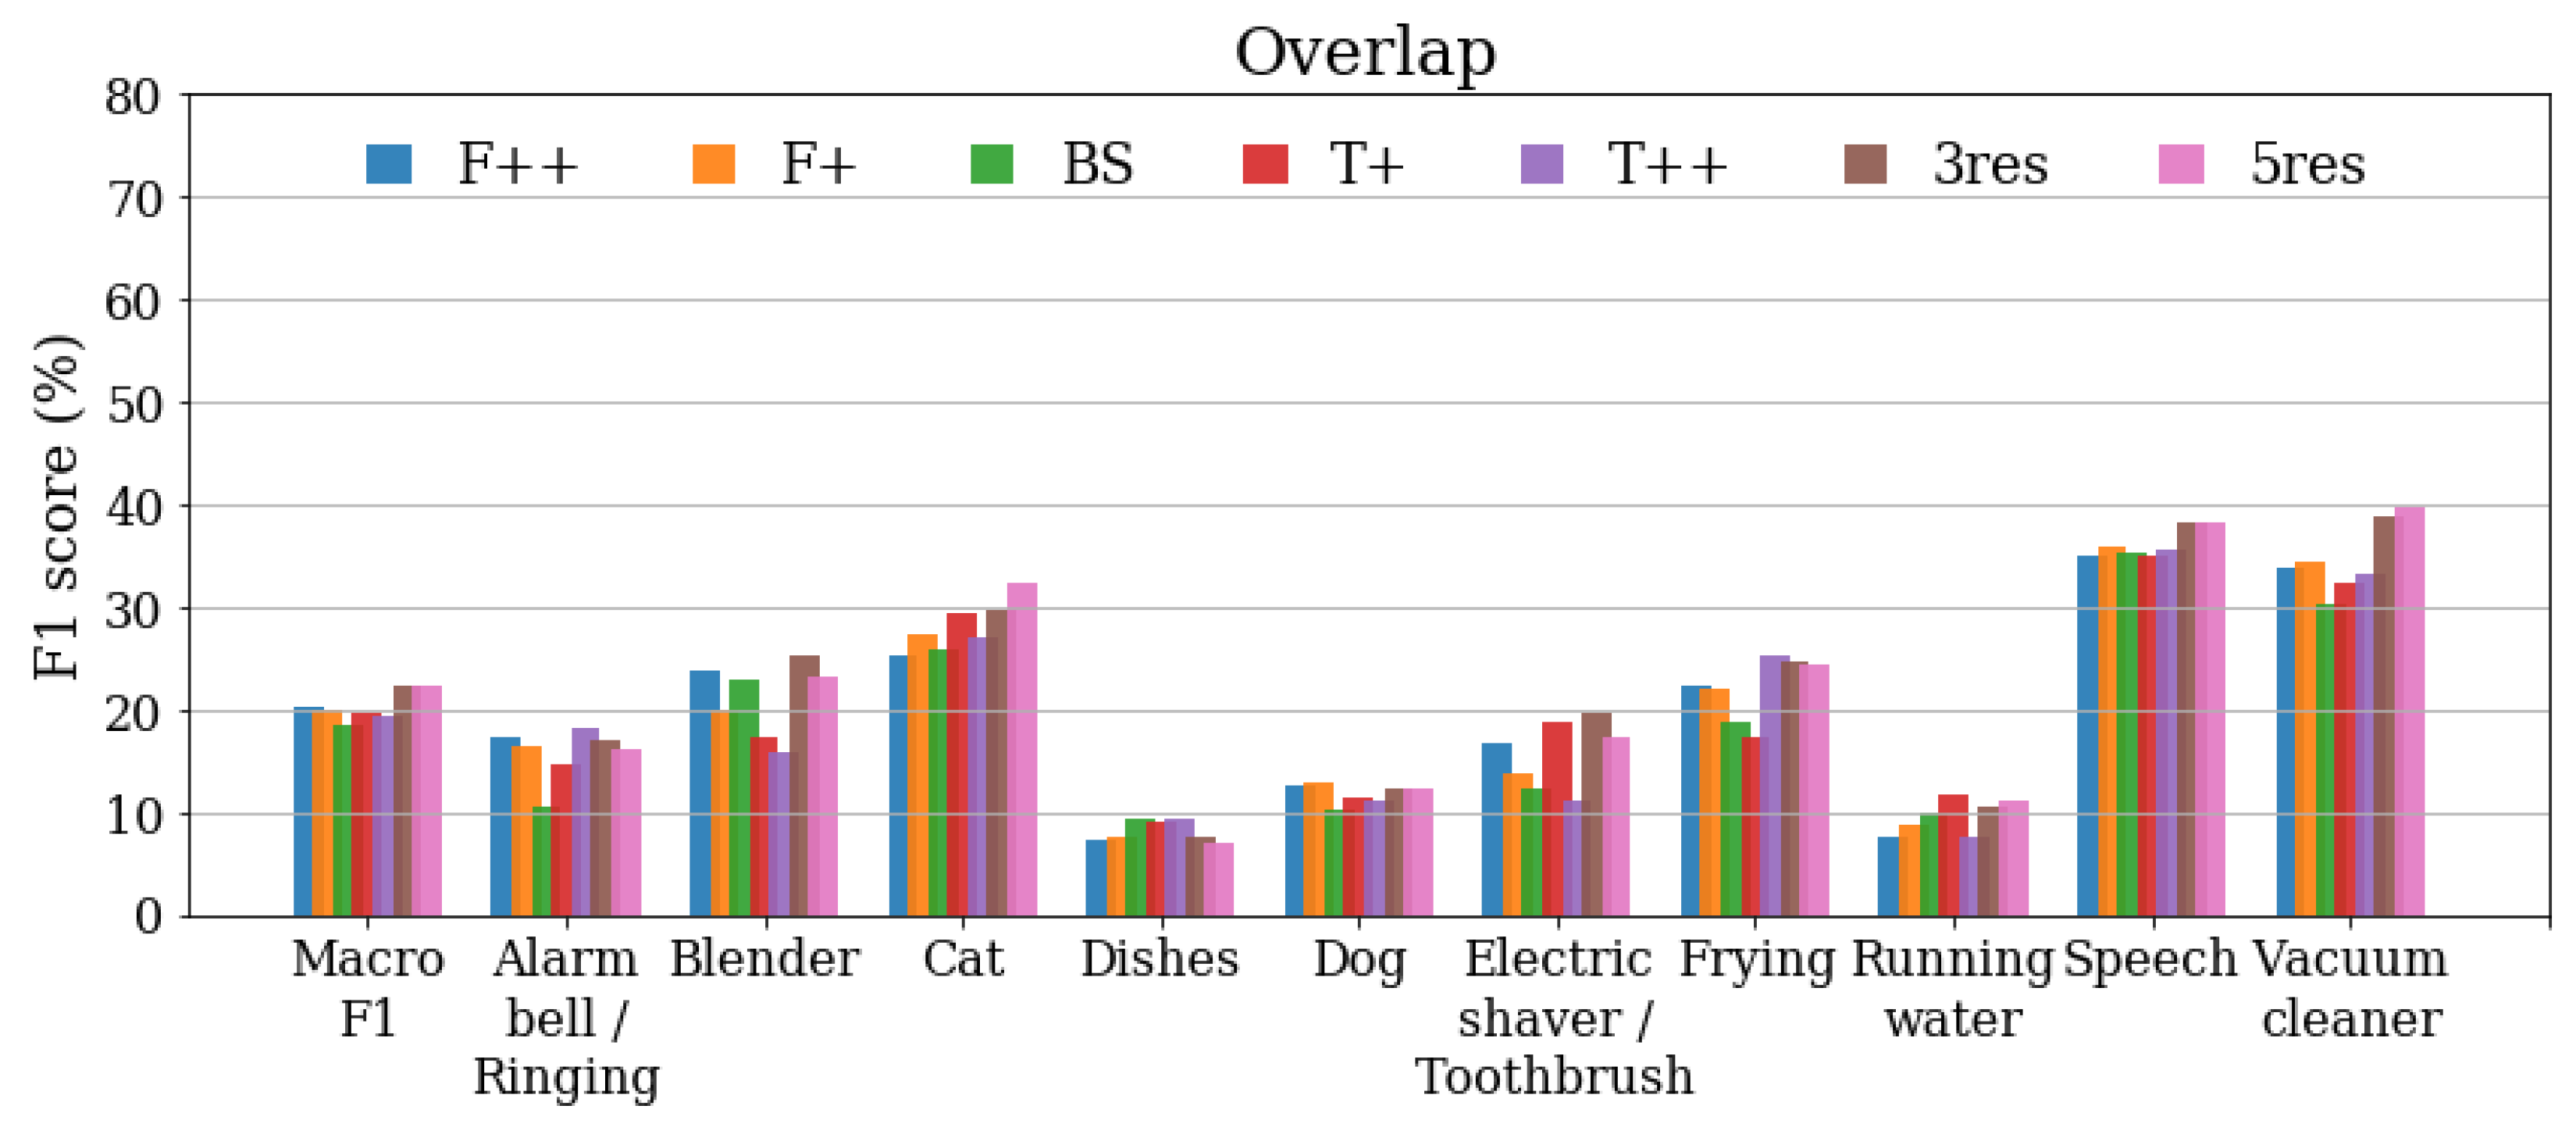
3.6. Results under Event Overlap
The results obtained for the Overlapped set are depicted in Figure 7. The Macro performance of the single-resolution systems decreases to 20% or below, whereas the multiresolution fusions 3res and 5res offer a slight improvement, reaching 22% Macro . However, this decrease of performance is not equally observed in each event category. Attending to the relative difference between the results with overlap and over the original data, some classes (Alarm/bell/ringing, Dishes, or Running water) present between 60% and 70% relative decrease in , while other categories (Speech or Vacuum cleaner) only suffer a relative decrease of around 25%.
Additionally, not all categories obtain higher scores when applying multiresolution: For Alarm/bell/ringing and Frying, the best performance is obtained with . In the case of Running water, slightly outperforms the multiresolution systems in terms of score. However, in these cases the performance of multiresolution is near the best single-resolution result, and above other resolution points that obtain lower scores. Only for the Dishes category multiresolution supposes a decrease in performance with respect to every single-resolution system.
3.7. Discussion
The proposed adverse settings have a negative impact on the performance of both single-resolution and multiresolution Sound Event Detection systems. Among frequency filtering, dynamic range compression, and clipping, the most critical scenario is high-pass filtering, especially with values of 1000 Hz and above. This suggests that the information of low frequencies is essential for this task, especially when considering categories like Blender, Speech, Running water, or Vacuum cleaner. On the other hand, low-pass filtering is the most adverse condition for the class Frying, implying that high frequencies are particularly relevant for this event.
In the case of an increased proportion of event overlap, SED performance is noticeably decreased with respect to the original data. This behavior is explained by the low level of event overlap found in the strongly labeled training data, more similar to that of the Public evaluation set than the studied Overlapped set. Nevertheless, the multiresolution systems offer better results in most categories.
To compare the levels of overlap in different datasets, we compute a value, , for each event in the ground truth annotations. We define as the ratio between the overlapped time of an event (i.e., the duration of the intervals of time in which such event coincides with one or more other events) and the total length of the event:
Therefore, the value of can range from 0, if the event does not overlap with any other target event, to 1, if the entirety of the event sounds at the same time than other events. Nontarget events are not included in the ground truth annotations, and thus are not considered for this measure.
The global overlap level of a dataset is computed as the average across all the events in its ground truth annotations. Whereas the Synthetic training set has an overlap level of and the Validation set has , the Public Evaluation set shows a slightly superior, yet similar, overlap level of . In contrast, in the Overlapped set this value rises to . The global and class-wise values of in the Public Evaluation and Overlapped sets are presented in Table 4.
Although we already stated the problem of event overlap in SED, as well as analyzed its impact in single-resolution and multiresolution systems [39], the scarcity of highly overlapped events in the Validation data was a limiting factor for the study of the behavior of our systems in such a situation. Nonetheless, in this work the generation of artificially overlapped data helped to overcome that limitation.
Despite not being a very frequent problem in current evaluation data, event overlap could cause a severe degradation of performance in certain applications in which events tend to overlap, such as event detection in crowded areas. To combat the negative effects of event overlap, some existing strategies could be used. On the one hand, Mixup training [40] is a form of data augmentation that provides the deep learning algorithms with linear combinations of training examples, thus helping them to learn to confront this type of data. On the other hand, source separation algorithms aim to extract the underlying events or different audio sources in a segment [41,42], thus reducing event overlap before the event detection system. Both Mixup and source separation have already been explored to increase the performance of SED in the DCASE evaluation [43,44], however, the impact of these techniques in highly overlapped scenarios has not been explicitly assessed yet.
Table 5 presents the macro-averaged results of the discussed systems over the original DESED Public evaluation set and its degraded versions, showing that the improvement on performance obtained when combining several single-resolution systems into a multiresolution system does not always hold when facing very adverse conditions. Likely, this effect is due to the way in which our multiresolution systems are obtained. An average fusion of the scores of different models can result in more accurate scores when the individual scores are precise enough. On the other hand, in scenarios where the individual systems perform worse, the average fusion is not able to obtain better results.
Nevertheless, under these adverse settings, multiresolution systems always hold better macro- than the average result of the single resolution systems. In this sense, our multiresolution approach provides an improved robustness against these very adverse distortion and overlap scenarios. The best performing system across all the proposed degradations is 5res, with an average macro- of .
4. Conclusions
In this paper, we studied the performance of several Sound Event Detection systems over a public dataset when diverse acoustic perturbations are applied. Five of these systems are convolutional neural networks with a common structure, but employing mel-spectrogram features extracted using different time-frequency resolutions. Two more systems are considered, which combine the previous systems into multiresolution models by means of an average fusion, increasing the performance over the evaluation subsets of the DESED dataset.
According to the results, the proposed acoustic scenarios have a clearly negative impact on the performance of our systems, as expected. Although our multiresolution approach is robust to slight degradations, the average fusion is unable to improve performance when facing adverse conditions. However, an extra robustness against these adverse scenarios is observed when using multiple resolutions.
Along with the generation of an artificially overlapped subset, we introduce a way to measure the level of overlap in sound event detection datasets, defining the metric as the ratio between overlapped time and total duration of an event. This metric allows to compare the amount of event coincidences that are found in different datasets.
Possible lines of future research include the extension of the analysis to consider other acoustic conditions, such as additional background noise or reverberation, and other evaluation metrics like the Polyphonic Sound Detection Score [45]; the exploration of other methods to combine the information from different resolution points, and the development of algorithms to tackle specific problems like event overlap.
Furthermore, the data generated and the results obtained through this study will serve as a benchmark to evaluate the performance of future Sound Event Detection approaches and their robustness to diverse acoustic settings.
Author Contributions
Conceptualization, D.d.B.-G., D.T.T. and D.R.; methodology, D.d.B.-G., D.T.T. and D.R.; software, D.d.B.-G.; validation, D.d.B.-G., D.T.T. and D.R.; formal analysis, D.d.B.-G., D.T.T. and D.R.; investigation, D.d.B.-G., D.T.T. and D.R.; resources, D.T.T. and D.R.; data curation, D.d.B.-G.; writing—original draft preparation, D.d.B.-G.; writing—review and editing, D.d.B.-G., D.T.T. and D.R.; visualization, D.d.B.-G., D.T.T. and D.R.; supervision, D.T.T. and D.R.; project administration, D.T.T. and D.R.; funding acquisition, D.T.T. and D.R. All authors have read and agreed to the published version of the manuscript.
Funding
This research and the APC were supported by project DSForSec (grant number RTI2018-098091-B-I00) funded by the Ministry of Science, Innovation and Universities of Spain and the European Regional Development Fund (ERDF).
Institutional Review Board Statement
Not applicable.
Informed Consent Statement
Not applicable.
Data Availability Statement
DESED (Domestic Environment Sound Event Detection) dataset is publicly available through the following website: https://project.inria.fr/desed/, accessed on 7 October 2021.
Conflicts of Interest
The authors declare no conflict of interest. The funders had no role in the design of the study; in the collection, analyses, or interpretation of data; in the writing of the manuscript, or in the decision to publish the results.
References
- Salamon, J.; Jacoby, C.; Bello, J.P. A Dataset and Taxonomy for Urban Sound Research. In Proceedings of the 22nd ACM International Conference on Multimedia (ACM-MM’14), Orlando, Fl, USA, 3–7 November 2014; pp. 1041–1044. [Google Scholar]
- Gemmeke, J.F.; Ellis, D.P.W.; Freedman, D.; Jansen, A.; Lawrence, W.; Moore, R.C.; Plakal, M.; Ritter, M. Audio Set: An ontology and human-labeled dataset for audio events. In Proceedings of the IEEE ICASSP, New Orleans, LA, USA, 5–9 March 2017. [Google Scholar]
- Fonseca, E.; Pons, J.; Favory, X.; Font, F.; Bogdanov, D.; Ferraro, A.; Oramas, S.; Porter, A.; Serra, X. Freesound Datasets: A platform for the creation of open audio datasets. In Proceedings of the 18th International Society for Music Information Retrieval Conference (ISMIR 2017), Suzhou, China, 23–27 October 2017; pp. 486–493. [Google Scholar]
- Turpault, N.; Serizel, R.; Parag Shah, A.; Salamon, J. Sound event detection in domestic environments with weakly labeled data and soundscape synthesis. In Proceedings of the Workshop on Detection and Classification of Acoustic Scenes and Events, New York, NY, USA, 25–26 October 2019. [Google Scholar]
- Detection and Classification of Acoustic Scenes and Events (DCASE Community). Available online: http://dcase.community/ (accessed on 6 December 2021).
- Heittola, T.; Mesaros, A.; Virtanen, T. Acoustic scene classification in DCASE 2020 Challenge: Generalization across devices and low complexity solutions. In Proceedings of the Detection and Classification of Acoustic Scenes and Events 2020 Workshop (DCASE2020), Tokyo, Japan, 2–3 November 2020. Submitted. [Google Scholar]
- Koizumi, Y.; Kawaguchi, Y.; Imoto, K.; Nakamura, T.; Nikaido, Y.; Tanabe, R.; Purohit, H.; Suefusa, K.; Endo, T.; Yasuda, M.; et al. Description and Discussion on DCASE2020 Challenge Task2: Unsupervised Anomalous Sound Detection for Machine Condition Monitoring. In Proceedings of the Detection and Classification of Acoustic Scenes and Events 2020 Workshop (DCASE2020), Tokyo, Japan, 2–3 November 2020; pp. 81–85. [Google Scholar]
- Heittola, T.; Çakır, E.; Virtanen, T. The Machine Learning Approach for Analysis of Sound Scenes and Events. In Computational Analysis of Sound Scenes and Events; Virtanen, T., Plumbley, M.D., Ellis, D., Eds.; Springer International Publishing: Cham, Switzerland, 2018; pp. 13–40. [Google Scholar] [CrossRef]
- Cakır, E.; Parascandolo, G.; Heittola, T.; Huttunen, H.; Virtanen, T. Convolutional recurrent neural networks for polyphonic sound event detection. IEEE ACM Trans. Audio Speech Lang. Process. 2017, 25, 1291–1303. [Google Scholar] [CrossRef] [Green Version]
- Hershey, S.; Chaudhuri, S.; Ellis, D.P.W.; Gemmeke, J.F.; Jansen, A.; Moore, C.; Plakal, M.; Platt, D.; Saurous, R.A.; Seybold, B.; et al. CNN Architectures for Large-Scale Audio Classification. In Proceedings of the International Conference on Acoustics, Speech and Signal Processing (ICASSP), New Orleans, LA, USA, 5–9 March 2017. [Google Scholar]
- de Benito-Gorron, D.; Lozano-Diez, A.; Toledano, D.T.; Gonzalez-Rodriguez, J. Exploring convolutional, recurrent, and hybrid deep neural networks for speech and music detection in a large audio dataset. EURASIP J. Audio Speech Music. Process. 2019, 2019, 1–18. [Google Scholar] [CrossRef] [Green Version]
- Lin, L.; Wang, X.; Liu, H.; Qian, Y. Guided Learning Convolution System for DCASE 2019 Task 4. In Proceedings of the Detection and Classification of Acoustic Scenes and Events 2019 Workshop (DCASE2019), New York, NY, USA, 25–26 October 2019; pp. 134–138. [Google Scholar]
- Ciaburro, G.; Iannace, G. Improving Smart Cities Safety Using Sound Events Detection Based on Deep Neural Network Algorithms. Informatics 2020, 7, 23. [Google Scholar] [CrossRef]
- Chan, T.K.; Chin, C.S. Multi-Branch Convolutional Macaron net for Sound Event Detection. IEEE ACM Trans. Audio Speech Lang. Process. 2021, 29, 2972–2985. [Google Scholar] [CrossRef]
- Ebbers, J.; Haeb-Umbach, R. Self-Trained Audio Tagging and Sound Event Detection in Domestic Environments. In Proceedings of the Detection and Classification of Acoustic Scenes and Events 2021 Workshop (DCASE2021), Online, 15–19 November 2021; pp. 226–230. [Google Scholar]
- Serizel, R.; Turpault, N. Sound event detection from partially annotated data: Trends and challenges. In Proceedings of the IcETRAN Conference, Srebrno Jezero, Serbia, 3–6 June 2019. [Google Scholar]
- Miyazaki, K.; Komatsu, T.; Hayashi, T.; Watanabe, S.; Toda, T.; Takeda, K. Conformer-Based Sound Event Detection with Semi-Supervised Learning and Data Augmentation. In Proceedings of the Detection and Classification of Acoustic Scenes and Events 2020 Workshop (DCASE2020), Tokyo, Japan, 2–3 November 2020; pp. 100–104. [Google Scholar]
- Sundar, H.; Sun, M.; Wang, C. Event Specific Attention for Polyphonic Sound Event Detection. In Proceedings of the Interspeech 2021, Brno, Czech Republic, 30 August–3 September 2021; pp. 566–570. [Google Scholar] [CrossRef]
- Zheng, X.; Song, Y.; McLoughlin, I.; Liu, L.; Dai, L.R. An Improved Mean Teacher Based Method for Large Scale Weakly Labeled Semi-Supervised Sound Event Detection. In Proceedings of the ICASSP 2021—2021 IEEE International Conference on Acoustics, Speech and Signal Processing (ICASSP), Singapore, 22–27 May 2021; pp. 356–360. [Google Scholar] [CrossRef]
- Gulati, A.; Qin, J.; Chiu, C.C.; Parmar, N.; Zhang, Y.; Yu, J.; Han, W.; Wang, S.; Zhang, Z.; Wu, Y.; et al. Conformer: Convolution-augmented Transformer for Speech Recognition. arXiv 2020, arXiv:2005.08100. [Google Scholar]
- Simonyan, K.; Zisserman, A. Very Deep Convolutional Networks for Large-Scale Image Recognition. In Proceedings of the ICLR 2015: International Conference on Learning Representations 2015, San Diego, CA, USA, 7–9 May 2015. [Google Scholar]
- Zuo, Z.; Shuai, B.; Wang, G.; Liu, X.; Wang, X.; Wang, B.; Chen, Y. Convolutional Recurrent Neural Networks: Learning Spatial Dependencies for Image Representation. In Proceedings of the IEEE Conference on Computer Vision and Pattern Recognition (CVPR) Workshops, Boston, MA, USA, 7–12 June 2015. [Google Scholar]
- Choi, K.; Fazekas, G.; Sandler, M.; Cho, K. Convolutional recurrent neural networks for music classification. In Proceedings of the 2017 IEEE International Conference on Acoustics, Speech and Signal Processing (ICASSP), New Orleans, LA, USA, 5–9 March 2017; pp. 2392–2396. [Google Scholar] [CrossRef] [Green Version]
- Liu, Y.C.; Han, E.; Lee, C.; Stolcke, A. End-to-End Neural Diarization: From Transformer to Conformer. In Proceedings of the Interspeech 2021, Brno, Czech Republic, 30 August—3 September 2021; pp. 3081–3085. [Google Scholar] [CrossRef]
- Ma, P.; Petridis, S.; Pantic, M. End-To-End Audio-Visual Speech Recognition with Conformers. In Proceedings of the ICASSP 2021—2021 IEEE International Conference on Acoustics, Speech and Signal Processing (ICASSP), Singapore, 22–27 May 2021; pp. 7613–7617. [Google Scholar] [CrossRef]
- Cornell, S.; Olvera, M.; Pariente, M.; Pepe, G.; Principi, E.; Gabrielli, L.; Squartini, S. Domain-Adversarial Training and Trainable Parallel Front-End for the DCASE 2020 Task 4 Sound Event Detection Challenge. In Proceedings of the Detection and Classification of Acoustic Scenes and Events 2020 Workshop (DCASE2020), Tokyo, Japan, 2–3 November 2020; pp. 26–30. [Google Scholar]
- Olvera, M. Improving Sound Event Detection with Foreground-Background Classification and Domain Adaptation. In Proceedings of the Detection and Classification of Acoustic Scenes and Events 2021 Workshop (DCASE2021), Online, 15–19 November 2021; pp. 231–235. [Google Scholar]
- Cornell, S.; Olvera, M.; Pariente, M.; Pepe, G.; Principi, E.; Gabrielli, L.; Squartini, S. Task-Aware Separation for the DCASE 2020 Task 4 Sound Event Detection and Separation Challenge. In Proceedings of the Detection and Classification of Acoustic Scenes and Events 2020 Workshop (DCASE2020), Tokyo, Japan, 2–3 November 2020; pp. 31–35. [Google Scholar]
- Serizel, R.; Turpault, N.; Shah, A.; Salamon, J. Sound event detection in synthetic domestic environments. In Proceedings of the ICASSP 2020—45th International Conference on Acoustics, Speech, and Signal Processing, Barcelona, Spain, 4–8 May 2020. [Google Scholar]
- Salamon, J.; MacConnell, D.; Cartwright, M.; Li, P.; Bello, J.P. Scaper: A library for soundscape synthesis and augmentation. In Proceedings of the 2017 IEEE Workshop on Applications of Signal Processing to Audio and Acoustics (WASPAA), New Paltz, NY, USA, 15–18 October 2017; pp. 344–348. [Google Scholar]
- Dekkers, G.; Lauwereins, S.; Thoen, B.; Adhana, M.W.; Brouckxon, H.; Van den Bergh, B.; van Waterschoot, T.; Vanrumste, B.; Verhelst, M.; Karsmakers, P. The SINS database for detection of daily activities in a home environment using an acoustic sensor network. In Proceedings of the Acoustic Scenes and Events 2017 Workshop (DCASE2017), Munich, Germany, 16–17 November 2017. [Google Scholar]
- Mesaros, A.; Heittola, T.; Virtanen, T. Metrics for polyphonic sound event detection. Appl. Sci. 2016, 6, 162. [Google Scholar] [CrossRef]
- Turpault, N.; Serizel, R. Training Sound Event Detection on a Heterogeneous Dataset. In Proceedings of the Detection and Classification of Acoustic Scenes and Events 2020 Workshop (DCASE2020), Tokyo, Japan, 2–3 November 2020; pp. 200–204. [Google Scholar]
- Tarvainen, A.; Valpola, H. Mean teachers are better role models: Weight-averaged consistency targets improve semi-supervised deep learning results. In Proceedings of the 31st International Conference on Neural Information Processing Systems (NIPS’17), Long Beach, CA, USA, 4–9 December 2017; pp. 1195–1204. [Google Scholar]
- Nair, V.; Hinton, G.E. Rectified Linear Units Improve Restricted Boltzmann Machines. In Proceedings of the ICML, Haifa, Israel, 21–24 June 2010; pp. 807–814. [Google Scholar]
- Chung, J.; Gulcehre, C.; Cho, K.; Bengio, Y. Empirical evaluation of gated recurrent neural networks on sequence modeling. In Proceedings of the NIPS 2014 Workshop on Deep Learning, Montreal, QC, Canada, 8–13 December 2014. [Google Scholar]
- de Benito-Gorrón, D.; Ramos, D.; Toledano, D.T. A multiresolution approach to sound event detection in DCASE 2020 task4. In Proceedings of the Detection and Classification of Acoustic Scenes and Events 2020 Workshop (DCASE2020), Tokyo, Japan, 2–3 November 2020; pp. 36–40. [Google Scholar]
- de Benito-Gorron, D.; Segovia, S.; Ramos, D.; Toledano, D.T. Multiple Feature Resolutions for Different Polyphonic Sound Detection Score Scenarios in DCASE 2021 Task 4. In Proceedings of the Detection and Classification of Acoustic Scenes and Events 2021 Workshop (DCASE2021), Online, 15–19 November 2021; pp. 65–69. [Google Scholar]
- de Benito-Gorrón, D.; Ramos, D.; Toledano, D.T. A Multi-Resolution CRNN-Based Approach for Semi-Supervised Sound Event Detection in DCASE 2020 Challenge. IEEE Access 2021, 9, 89029–89042. [Google Scholar] [CrossRef]
- Zhang, H.; Cisse, M.; Dauphin, Y.N.; Lopez-Paz, D. mixup: Beyond Empirical Risk Minimization. In Proceedings of the International Conference on Learning Representations, Vancouver, BC, Canada, 30 April–3 May 2018. [Google Scholar]
- Kavalerov, I.; Wisdom, S.; Erdogan, H.; Patton, B.; Wilson, K.; Le Roux, J.; Hershey, J.R. Universal Sound Separation. In Proceedings of the 2019 IEEE Workshop on Applications of Signal Processing to Audio and Acoustics (WASPAA), New Paltz, NY, USA, 20–23 October 2019; pp. 175–179. [Google Scholar] [CrossRef] [Green Version]
- Delcroix, M.; Žmolíková, K.; Ochiai, T.; Kinoshita, K.; Nakatani, T. Speaker activity driven neural speech extraction. In Proceedings of the ICASSP, IEEE International Conference on Acoustics, Speech and Signal Processing, IEEE Signal Processing Society, Toronto, ON, Canada, 6—11 June 2021; pp. 6099–6103. [Google Scholar] [CrossRef]
- Delphin-Poulat, L.; Nicol, R.; Plapous, C.; Peron, K. Comparative Assessment of Data Augmentation for Semi-Supervised Polyphonic Sound Event Detection. In Proceedings of the 2020 27th Conference of Open Innovations Association (FRUCT), Trento, Italy, 7–9 September 2020; pp. 46–53. [Google Scholar] [CrossRef]
- Wisdom, S.; Erdogan, H.; Ellis, D.P.W.; Serizel, R.; Turpault, N.; Fonseca, E.; Salamon, J.; Seetharaman, P.; Hershey, J.R. What’s all the Fuss about Free Universal Sound Separation Data? In Proceedings of the ICASSP 2021—2021 IEEE International Conference on Acoustics, Speech and Signal Processing (ICASSP), Singapore, 22–27 May 2021; pp. 186–190. [Google Scholar] [CrossRef]
- Bilen, Ç.; Ferroni, G.; Tuveri, F.; Azcarreta, J.; Krstulović, S. A framework for the robust evaluation of sound event detection. In Proceedings of the ICASSP 2020—2020 IEEE International Conference on Acoustics, Speech and Signal Processing (ICASSP), Barcelona, Spain, 4–8 May 2020; pp. 61–65. [Google Scholar]
Figure 1.
Block diagram showing structure of Sound Event Detection baseline system. First step is extraction of mel-spectrogram features from audio waveform. Mel-spectrograms are fed into Convolutional Recurrent Neural Network, which is composed of a convolutional stage (CNN), a recurrent stage (RNN), and an attention pooling module. Outputs of CRNN are K score sequences, one for each target category (). Finally, to compute score, score sequences are converted into binary values using a threshold of , and then smoothed with a median filter of s.

Figure 2.
scores of single-resolution systems () and multiresolution systems (3res, 5res) over DESED Public Evaluation set. “Macro F1” shows average score over 10 target categories. Best viewed in color.
Figure 2.
scores of single-resolution systems () and multiresolution systems (3res, 5res) over DESED Public Evaluation set. “Macro F1” shows average score over 10 target categories. Best viewed in color.

Figure 3.
scores of single-resolution systems () and multiresolution systems (3res, 5res) over DESED Public Evaluation set applying a high-pass filter with cutoff frequencies of 500 Hz (top), 1000 Hz (center), and 2000 Hz (bottom). “Macro F1” shows average score over 10 target categories. Best viewed in color.

Figure 4.
scores of single-resolution systems () and multiresolution systems (3res, 5res) over DESED Public Evaluation set applying a low-pass filter with cutoff frequencies of 2000 Hz (top), 1000 Hz (center), and 500 Hz (bottom). “Macro F1” shows average score over 10 target categories. Best viewed in color.

Figure 5.
scores of single-resolution systems () and the multiresolution systems (3res, 5res) over DESED Public Evaluation set applying dynamic range compression. “Macro F1” shows average score over 10 target categories. Best viewed in color.
Figure 5.
scores of single-resolution systems () and the multiresolution systems (3res, 5res) over DESED Public Evaluation set applying dynamic range compression. “Macro F1” shows average score over 10 target categories. Best viewed in color.

Figure 6.
scores of single-resolution systems () and multiresolution systems (3res, 5res) over DESED Public Evaluation set applying clipping saturation. “Macro F1” shows average score over 10 target categories. Best viewed in color.
Figure 6.
scores of single-resolution systems () and multiresolution systems (3res, 5res) over DESED Public Evaluation set applying clipping saturation. “Macro F1” shows average score over 10 target categories. Best viewed in color.

Figure 7.
scores of single-resolution systems () and multiresolution systems (3res, 5res) over Overlapped set. “Macro F1” shows average score over 10 target categories. Best viewed in color.
Figure 7.
scores of single-resolution systems () and multiresolution systems (3res, 5res) over Overlapped set. “Macro F1” shows average score over 10 target categories. Best viewed in color.


Table 1.
Number of events per class in the strongly labeled DESED subsets: Synth Training, Validation, and Public Evaluation, and total number of events and audio clips in each set. The total number of events and sound clips in each dataset is presented in the bottom rows.
Table 1.
Number of events per class in the strongly labeled DESED subsets: Synth Training, Validation, and Public Evaluation, and total number of events and audio clips in each set. The total number of events and sound clips in each dataset is presented in the bottom rows.
| Event Class | Synth Train | Validation | Public Eval |
|---|---|---|---|
| Alarm/bell/ringing | 587 | 420 | 196 |
| Blender | 370 | 94 | 84 |
| Cat | 731 | 341 | 240 |
| Dishes | 1123 | 559 | 488 |
| Dog | 824 | 570 | 441 |
| Electric shaver/toothbr. | 345 | 65 | 108 |
| Frying | 229 | 94 | 90 |
| Running water | 270 | 237 | 109 |
| Speech | 2760 | 1752 | 913 |
| Vacuum cleaner | 343 | 92 | 96 |
| N° events | 10,885 | 4224 | 2765 |
| N° clips | 2584 | 1168 | 692 |
Table 2.
Mean and standard deviations of durations of sound events in DESED Public Evaluation set, computed for each target category.
Table 2.
Mean and standard deviations of durations of sound events in DESED Public Evaluation set, computed for each target category.
| Event Class | Mean (s) | Std. (s) |
|---|---|---|
| Alarm/bell/ringing | 2.42 | 2.88 |
| Blender | 5.57 | 2.87 |
| Cat | 1.05 | 1.05 |
| Dishes | 0.57 | 0.69 |
| Dog | 0.72 | 0.92 |
| Electric shaver/toothbr. | 5.43 | 3.24 |
| Frying | 8.72 | 2.09 |
| Running water | 6.37 | 3.60 |
| Speech | 1.36 | 1.10 |
| Vacuum cleaner | 8.31 | 2.20 |
Table 3.
FFT length (N), window length (L), window hop (R), and number of Mel filters () of five proposed time-frequency resolution working points. N, L, and R are reported in samples, using a sample rate = 16,000 Hz.
Table 3.
FFT length (N), window length (L), window hop (R), and number of Mel filters () of five proposed time-frequency resolution working points. N, L, and R are reported in samples, using a sample rate = 16,000 Hz.
| Resolution | |||||
|---|---|---|---|---|---|
| N | 1024 | 2048 | 2048 | 4096 | 4096 |
| L | 1024 | 1536 | 2048 | 3072 | 4096 |
| R | 128 | 192 | 255 | 384 | 512 |
| 64 | 96 | 128 | 192 | 256 |
Table 4.
Value of overlap ratio () per class in each dataset. The overlap level of a class in a dataset is computed as the average across all the events belonging to that class, where for each event is the ratio between its overlapped time and its total length. The global of each dataset is computed as the event-wise average.
| Event Class | Public Evaluation | Overlapped Set |
|---|---|---|
| Alarm/bell/ringing | 0.16 | 0.78 |
| Blender | 0.11 | 0.76 |
| Cat | 0.06 | 0.76 |
| Dishes | 0.55 | 0.88 |
| Dog | 0.17 | 0.81 |
| Electric shaver/toothbr. | 0.30 | 0.80 |
| Frying | 0.30 | 0.80 |
| Running water | 0.12 | 0.74 |
| Speech | 0.41 | 0.79 |
| Vacuum cleaner | 0.05 | 0.72 |
| Global (event-wise) | 0.31 | 0.80 |
Table 5.
Macro-averaged, event-based scores of single-resolution and multiresolution systems over DESED Public evaluation set (“Clean”) and proposed degradation scenarios. “Avg-S” column presents average performance of single-resolution systems (). “Overall” row presents averaged results across all degradation scenarios. Best result for each row is highlighted in bold.
| Dataset | BS | Avg-S | 3res | 5res | ||||
|---|---|---|---|---|---|---|---|---|
| Clean | 36.26 | 36.74 | 37.62 | 37.12 | 35.15 | 36.58 | 41.81 | 43.05 |
| HPF @ 500Hz | 28.71 | 32.29 | 30.38 | 35.15 | 28.12 | 30.93 | 35.72 | 36.20 |
| HPF @ 1000Hz | 17.53 | 17.09 | 22.73 | 22.43 | 19.10 | 19.78 | 21.41 | 22.72 |
| HPF @ 2000Hz | 11.17 | 8.62 | 9.09 | 11.50 | 6.80 | 9.44 | 10.71 | 11.04 |
| LPF @ 2000Hz | 32.11 | 32.87 | 33.44 | 35.38 | 33.72 | 33.51 | 38.14 | 39.18 |
| LPF @ 1000Hz | 22.44 | 24.41 | 26.90 | 29.45 | 30.58 | 26.76 | 30.55 | 30.16 |
| LPF @ 500Hz | 18.64 | 19.56 | 20.71 | 25.89 | 26.13 | 22.19 | 25.22 | 25.26 |
| Compression | 27.80 | 31.74 | 31.88 | 33.55 | 32.44 | 31.48 | 35.01 | 37.45 |
| Clipping | 29.88 | 29.58 | 31.95 | 30.51 | 29.47 | 30.28 | 35.53 | 36.74 |
| Overlap | 20.15 | 19.85 | 18.55 | 19.66 | 19.36 | 19.51 | 22.35 | 22.14 |
| Overall | 23.16 | 24.00 | 25.07 | 27.06 | 25.08 | 24.87 | 28.29 | 28.99 |
Publisher’s Note: MDPI stays neutral with regard to jurisdictional claims in published maps and institutional affiliations. |
© 2021 by the authors. Licensee MDPI, Basel, Switzerland. This article is an open access article distributed under the terms and conditions of the Creative Commons Attribution (CC BY) license (https://creativecommons.org/licenses/by/4.0/).
Share and Cite
MDPI and ACS Style
de Benito-Gorrón, D.; Ramos, D.; Toledano, D.T. An Analysis of Sound Event Detection under Acoustic Degradation Using Multi-Resolution Systems. Appl. Sci. 2021, 11, 11561. https://0-doi-org.brum.beds.ac.uk/10.3390/app112311561
AMA Style
de Benito-Gorrón D, Ramos D, Toledano DT. An Analysis of Sound Event Detection under Acoustic Degradation Using Multi-Resolution Systems. Applied Sciences. 2021; 11(23):11561. https://0-doi-org.brum.beds.ac.uk/10.3390/app112311561
Chicago/Turabian Stylede Benito-Gorrón, Diego, Daniel Ramos, and Doroteo T. Toledano. 2021. "An Analysis of Sound Event Detection under Acoustic Degradation Using Multi-Resolution Systems" Applied Sciences 11, no. 23: 11561. https://0-doi-org.brum.beds.ac.uk/10.3390/app112311561
Note that from the first issue of 2016, this journal uses article numbers instead of page numbers. See further details here.