
B-Line Detection and Localization in Lung Ultrasound Videos Using Spatiotemporal Attention

 , , and
Abstract
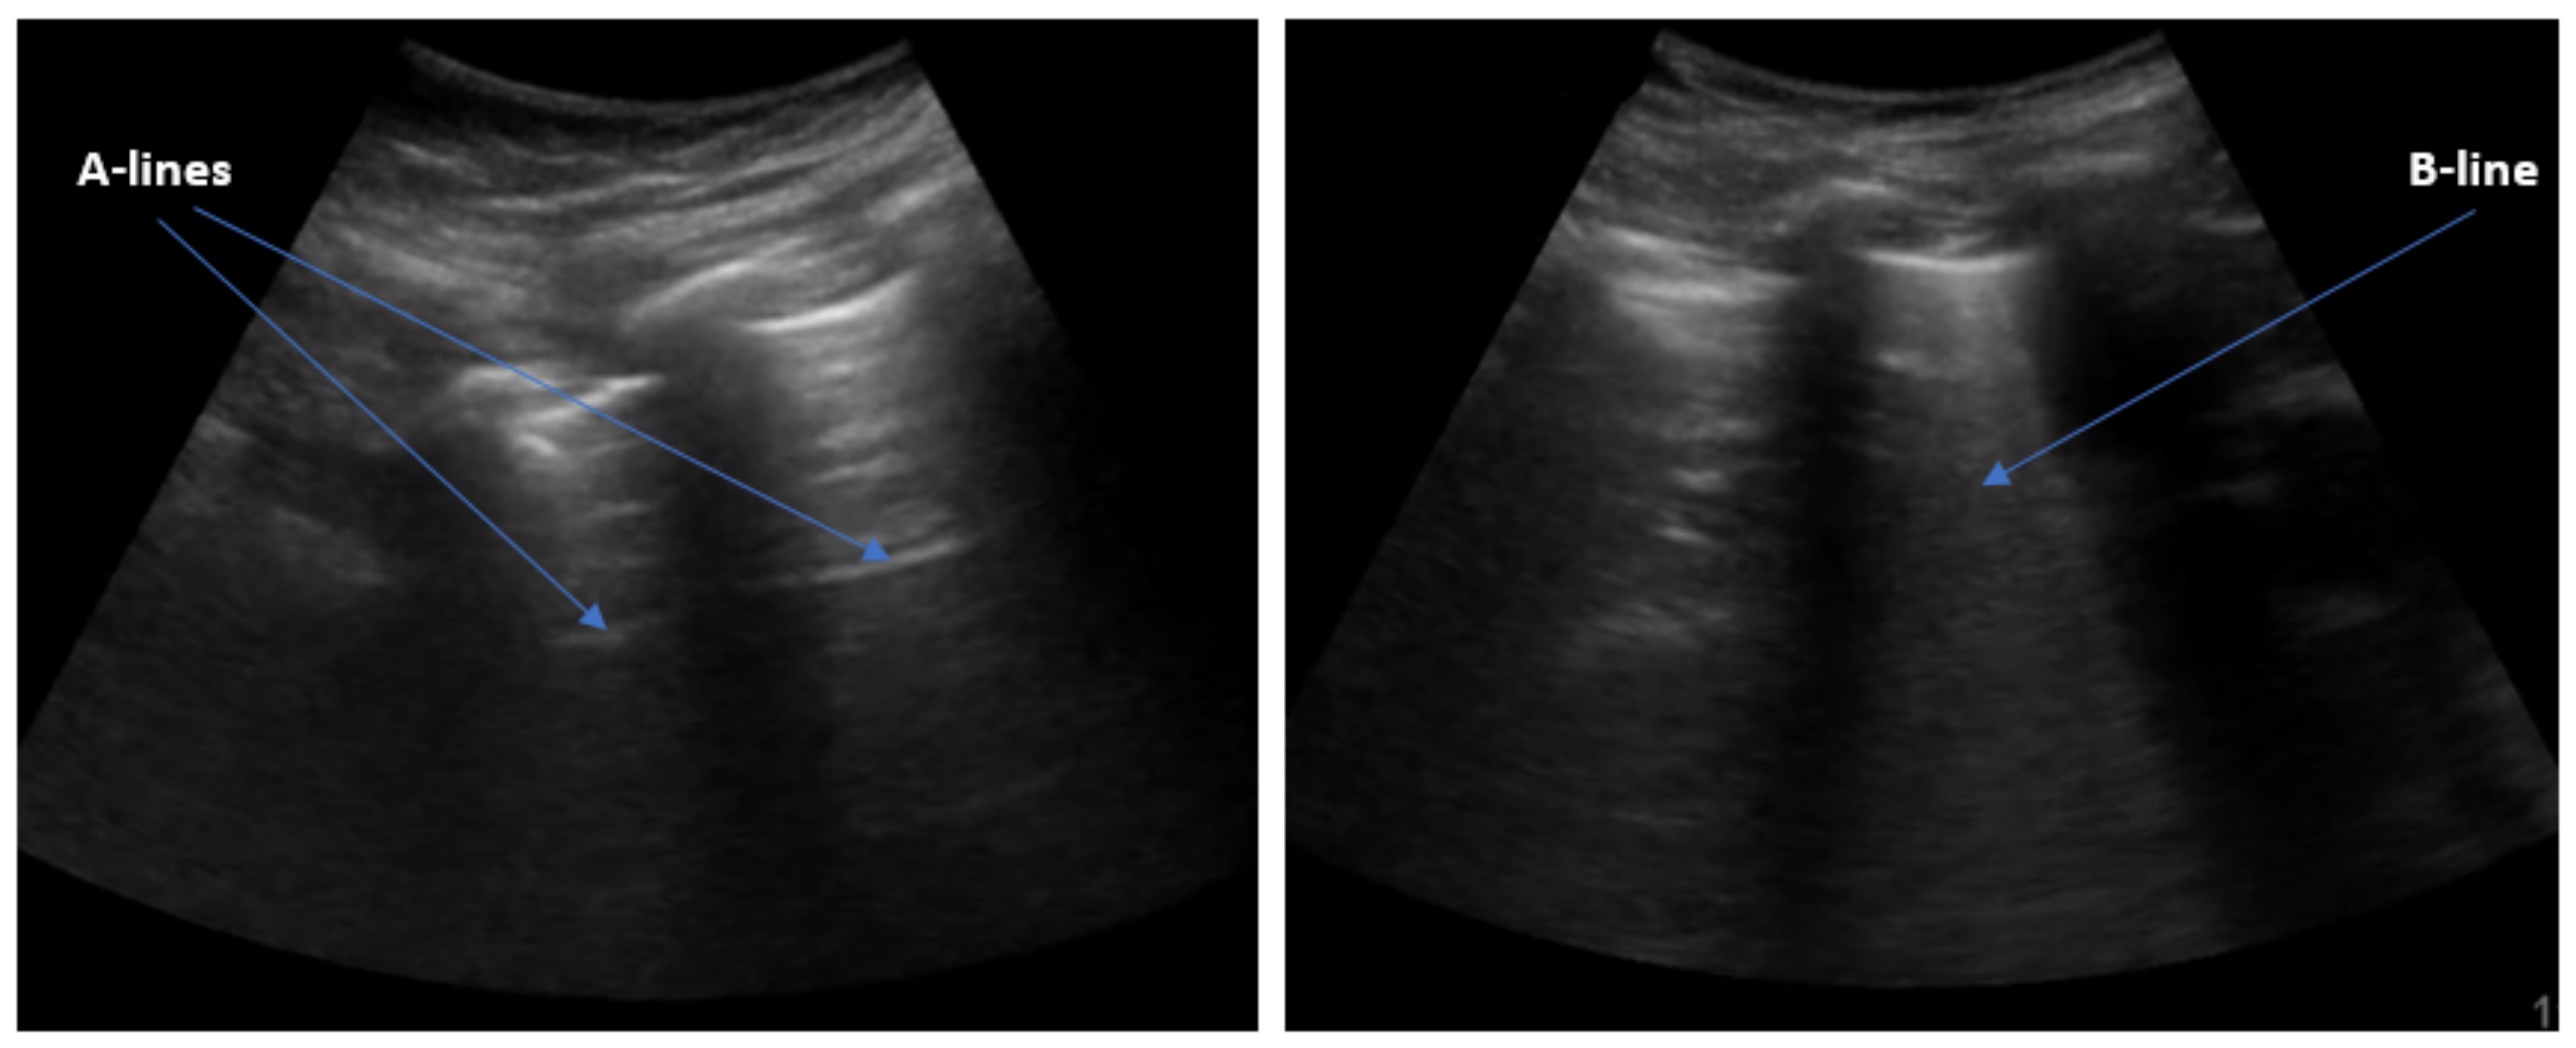
:1. Introduction
2. Related Work
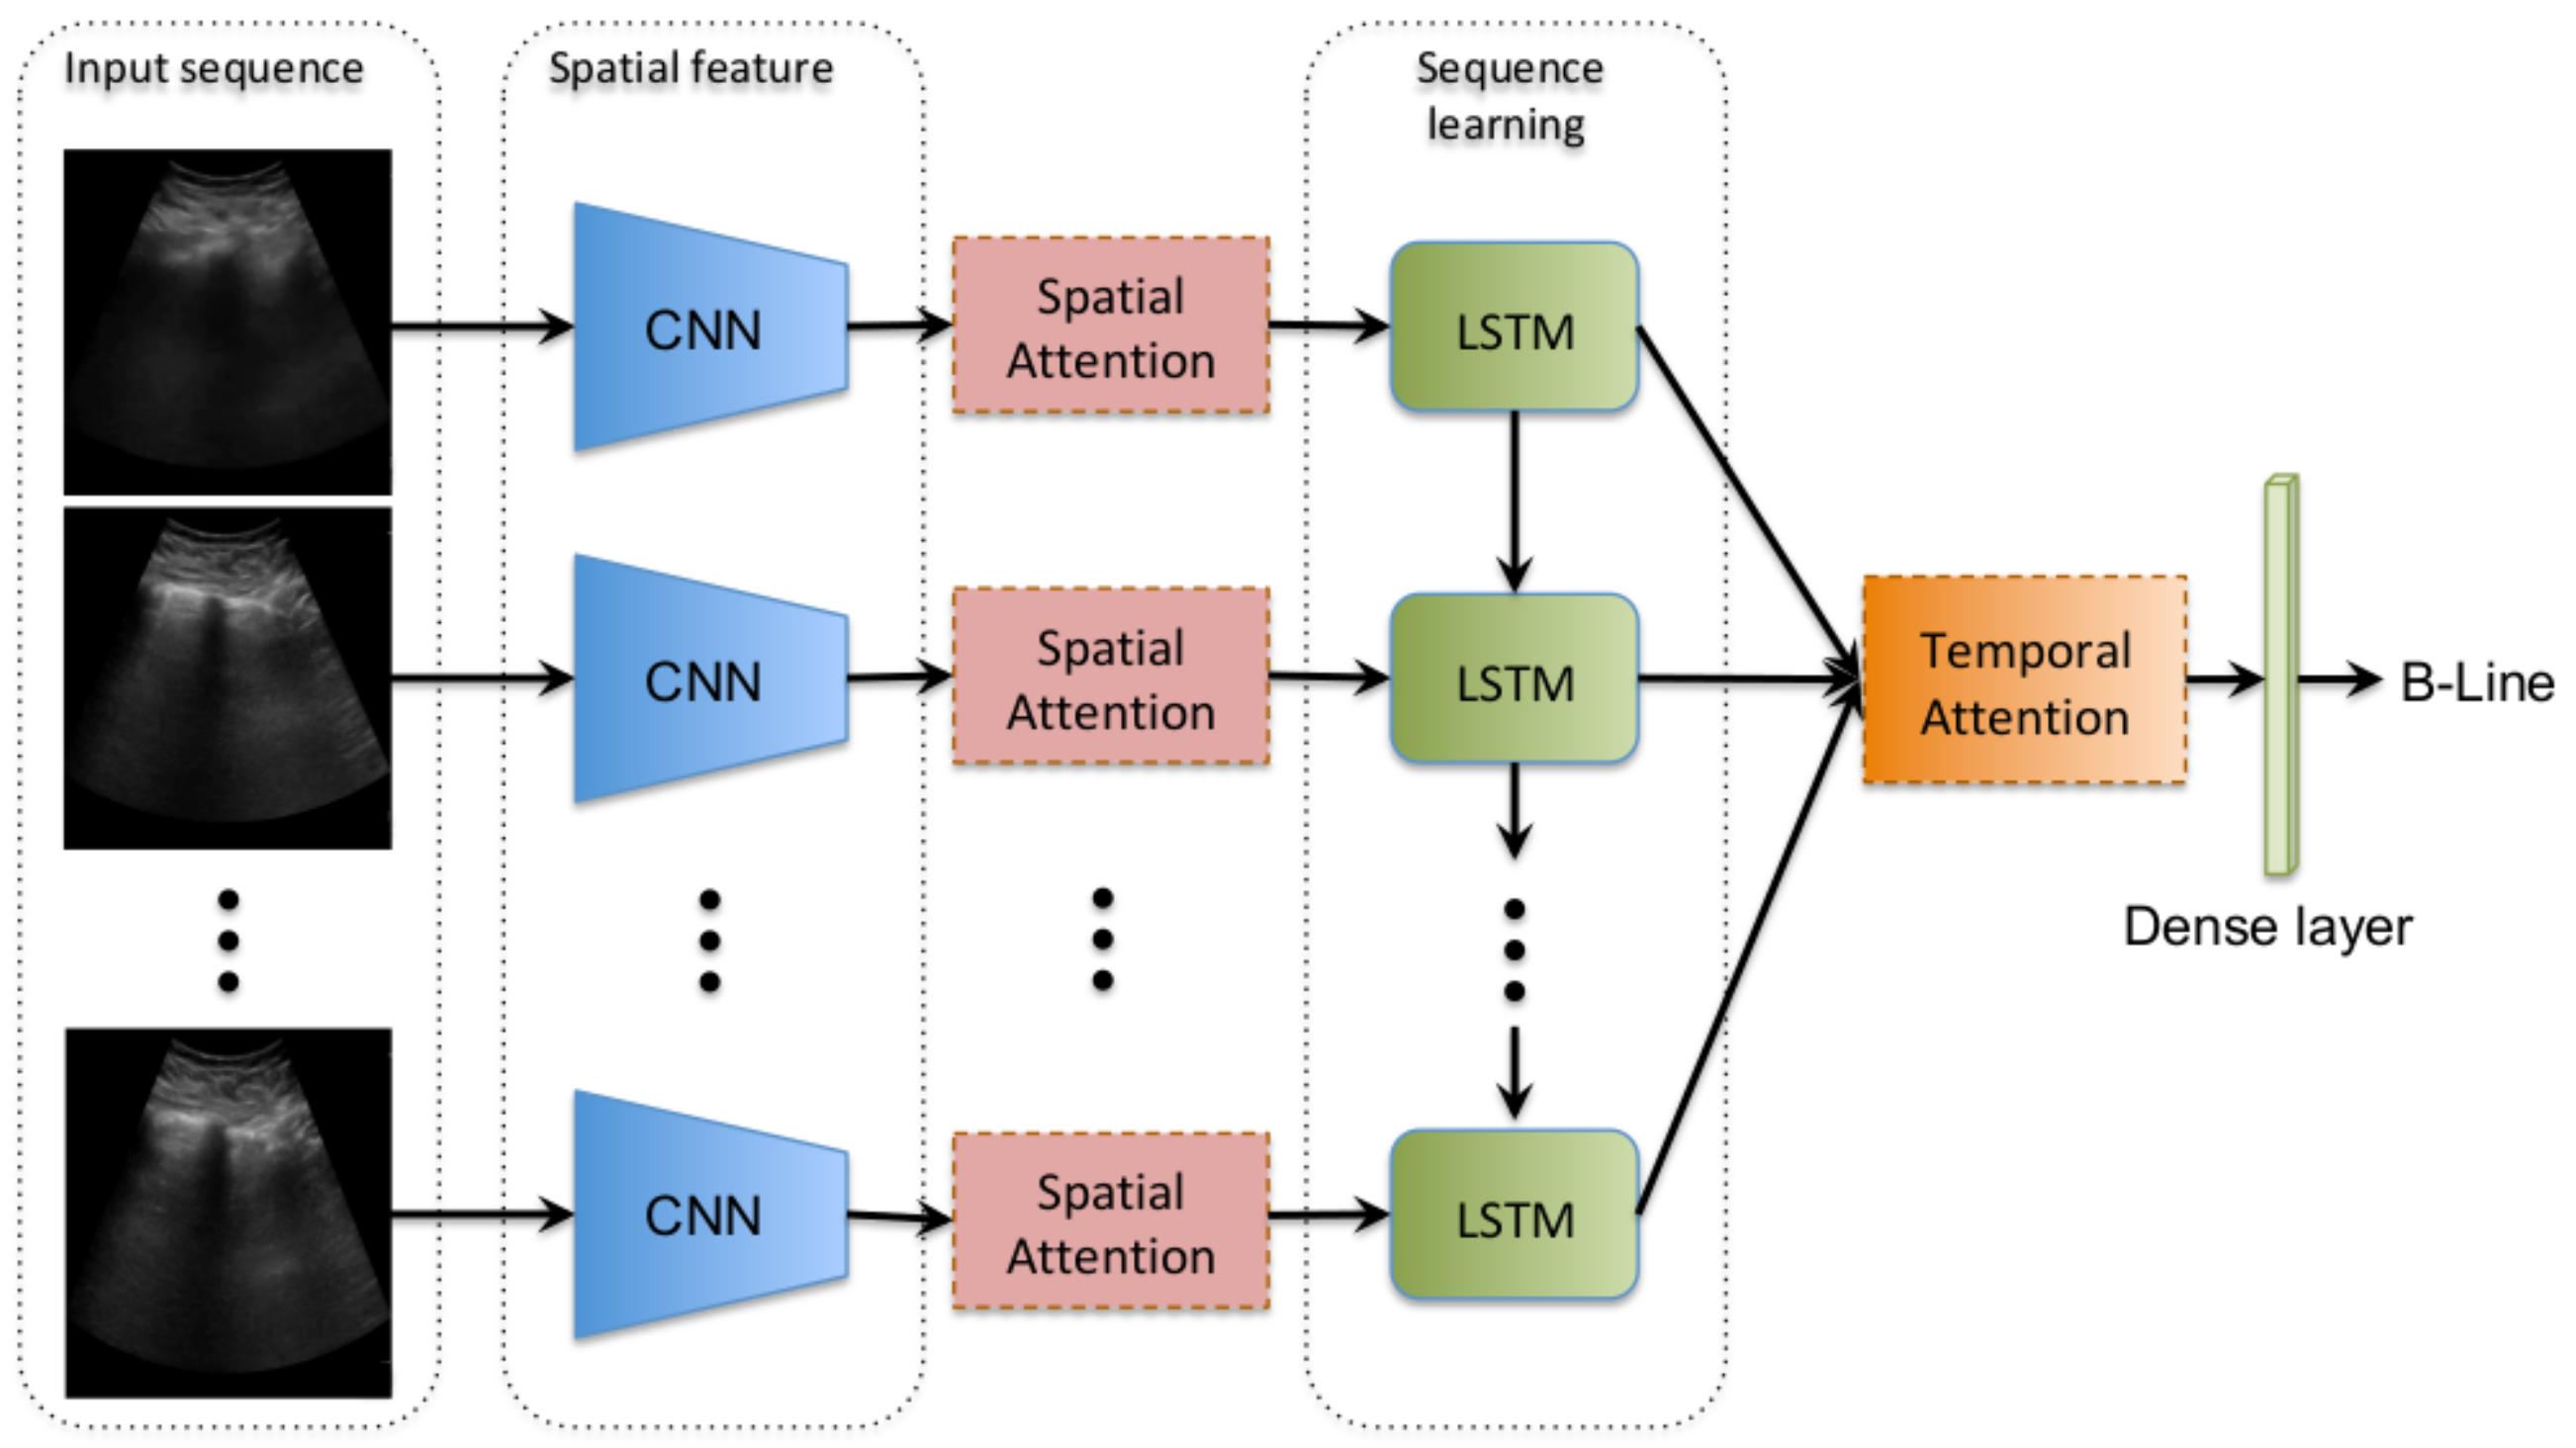
3. Methods
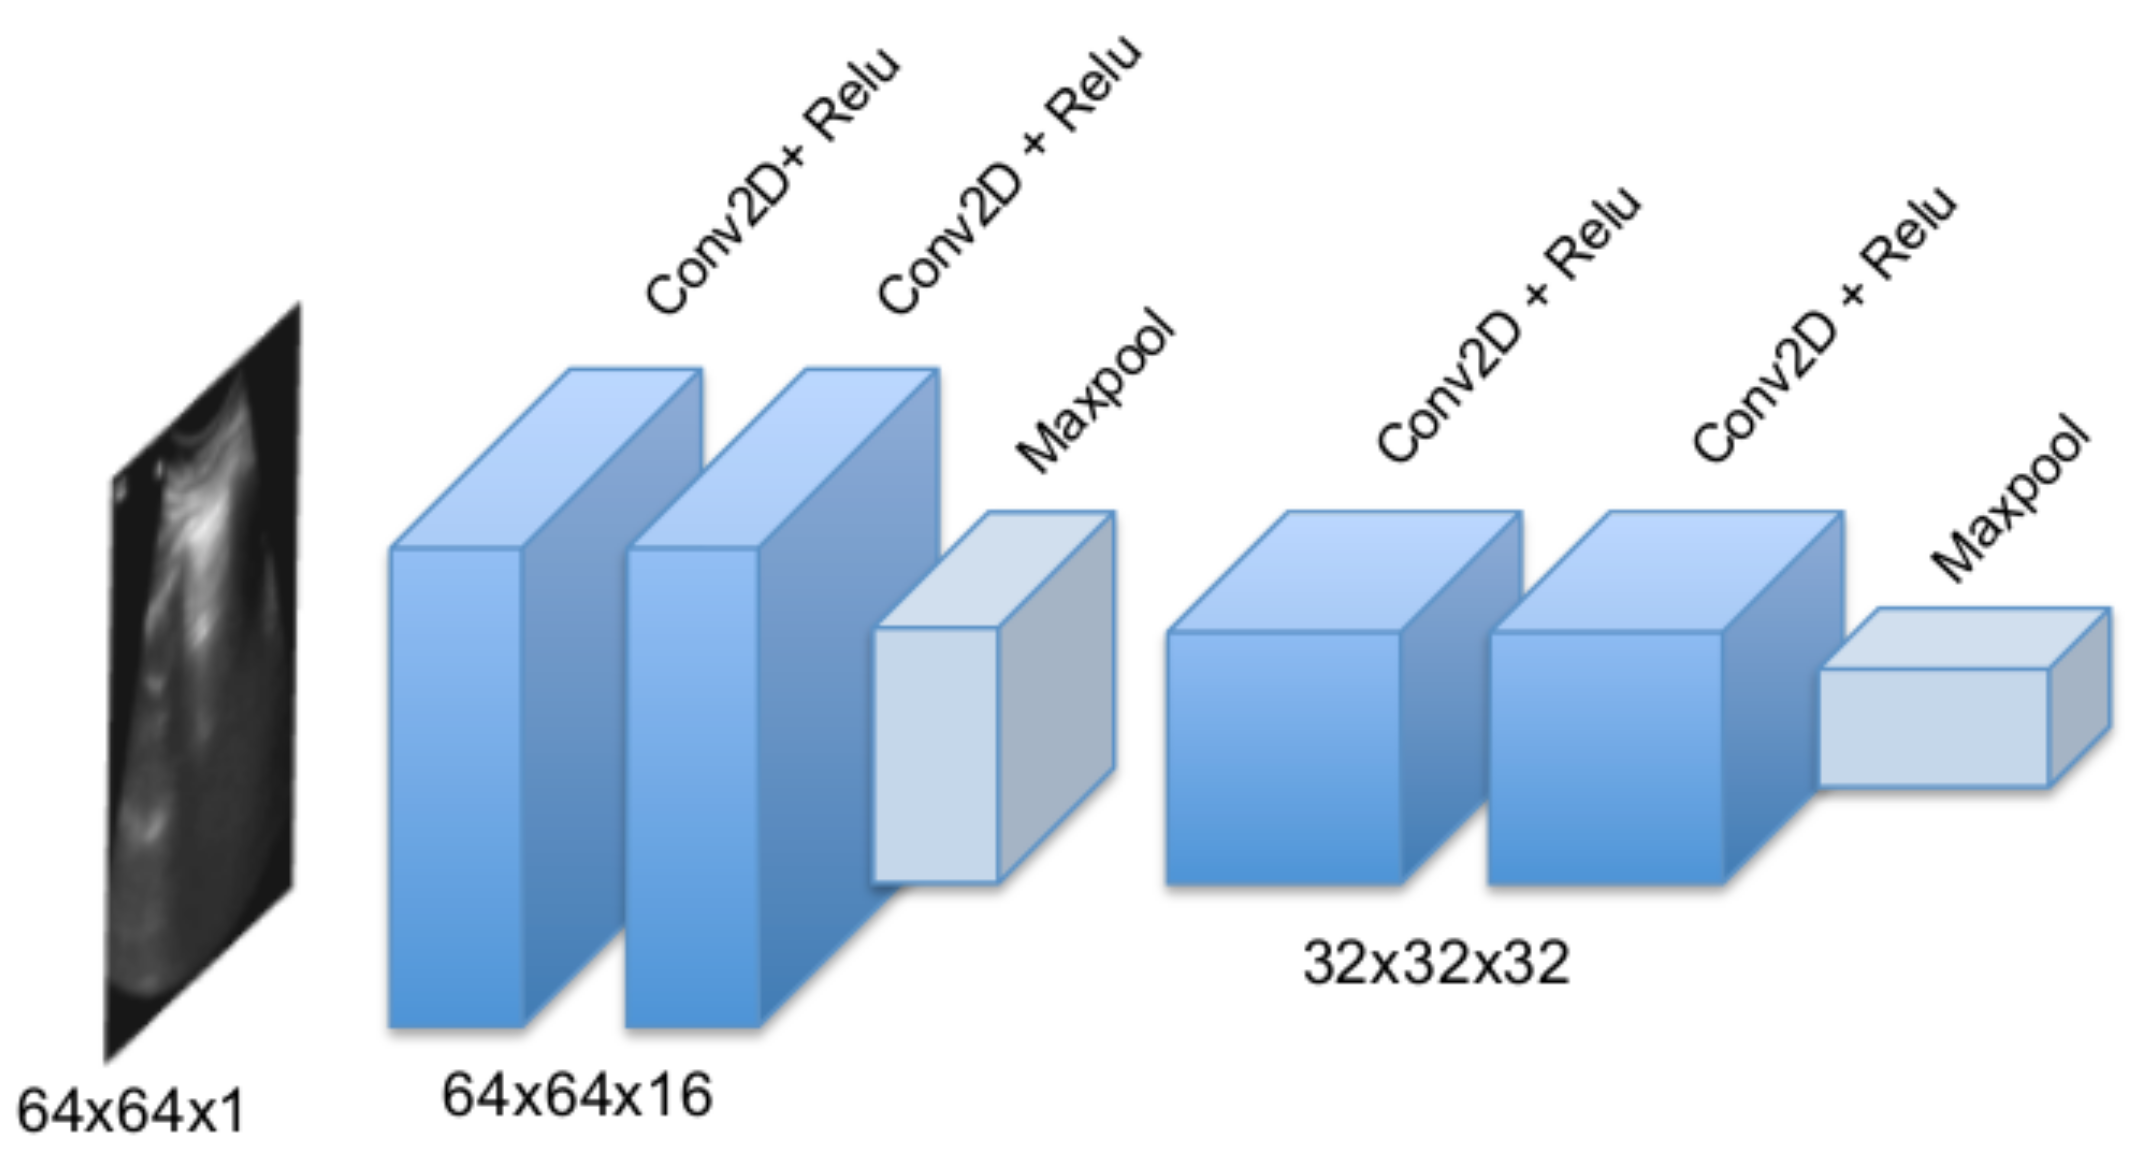
3.1. Convolutional Frame Feature Extraction Network
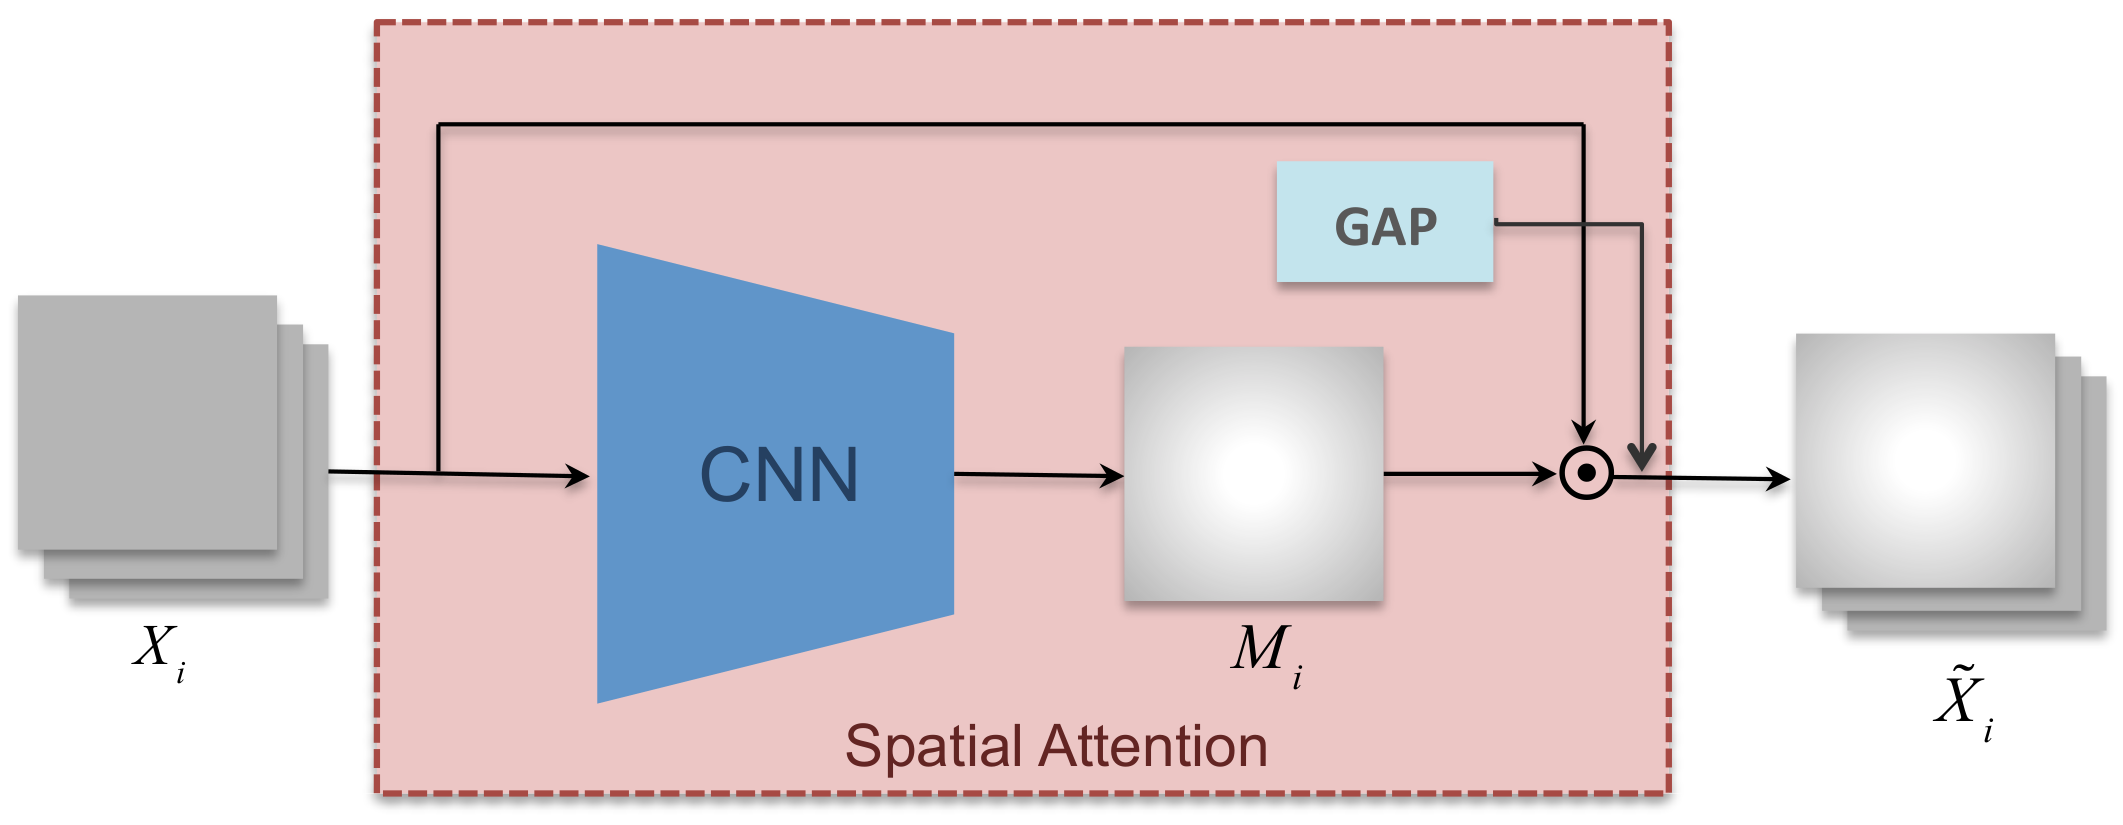
3.2. Spatial Attention Mechanism
3.3. Bidirectional LSTM and Temporal Attention
4. Materials and Experimental Setup
4.1. Data Collection and Annotation
4.2. Implementation Details
4.3. Evaluation Metrics
5. Experiment Results
5.1. B-Line Classification
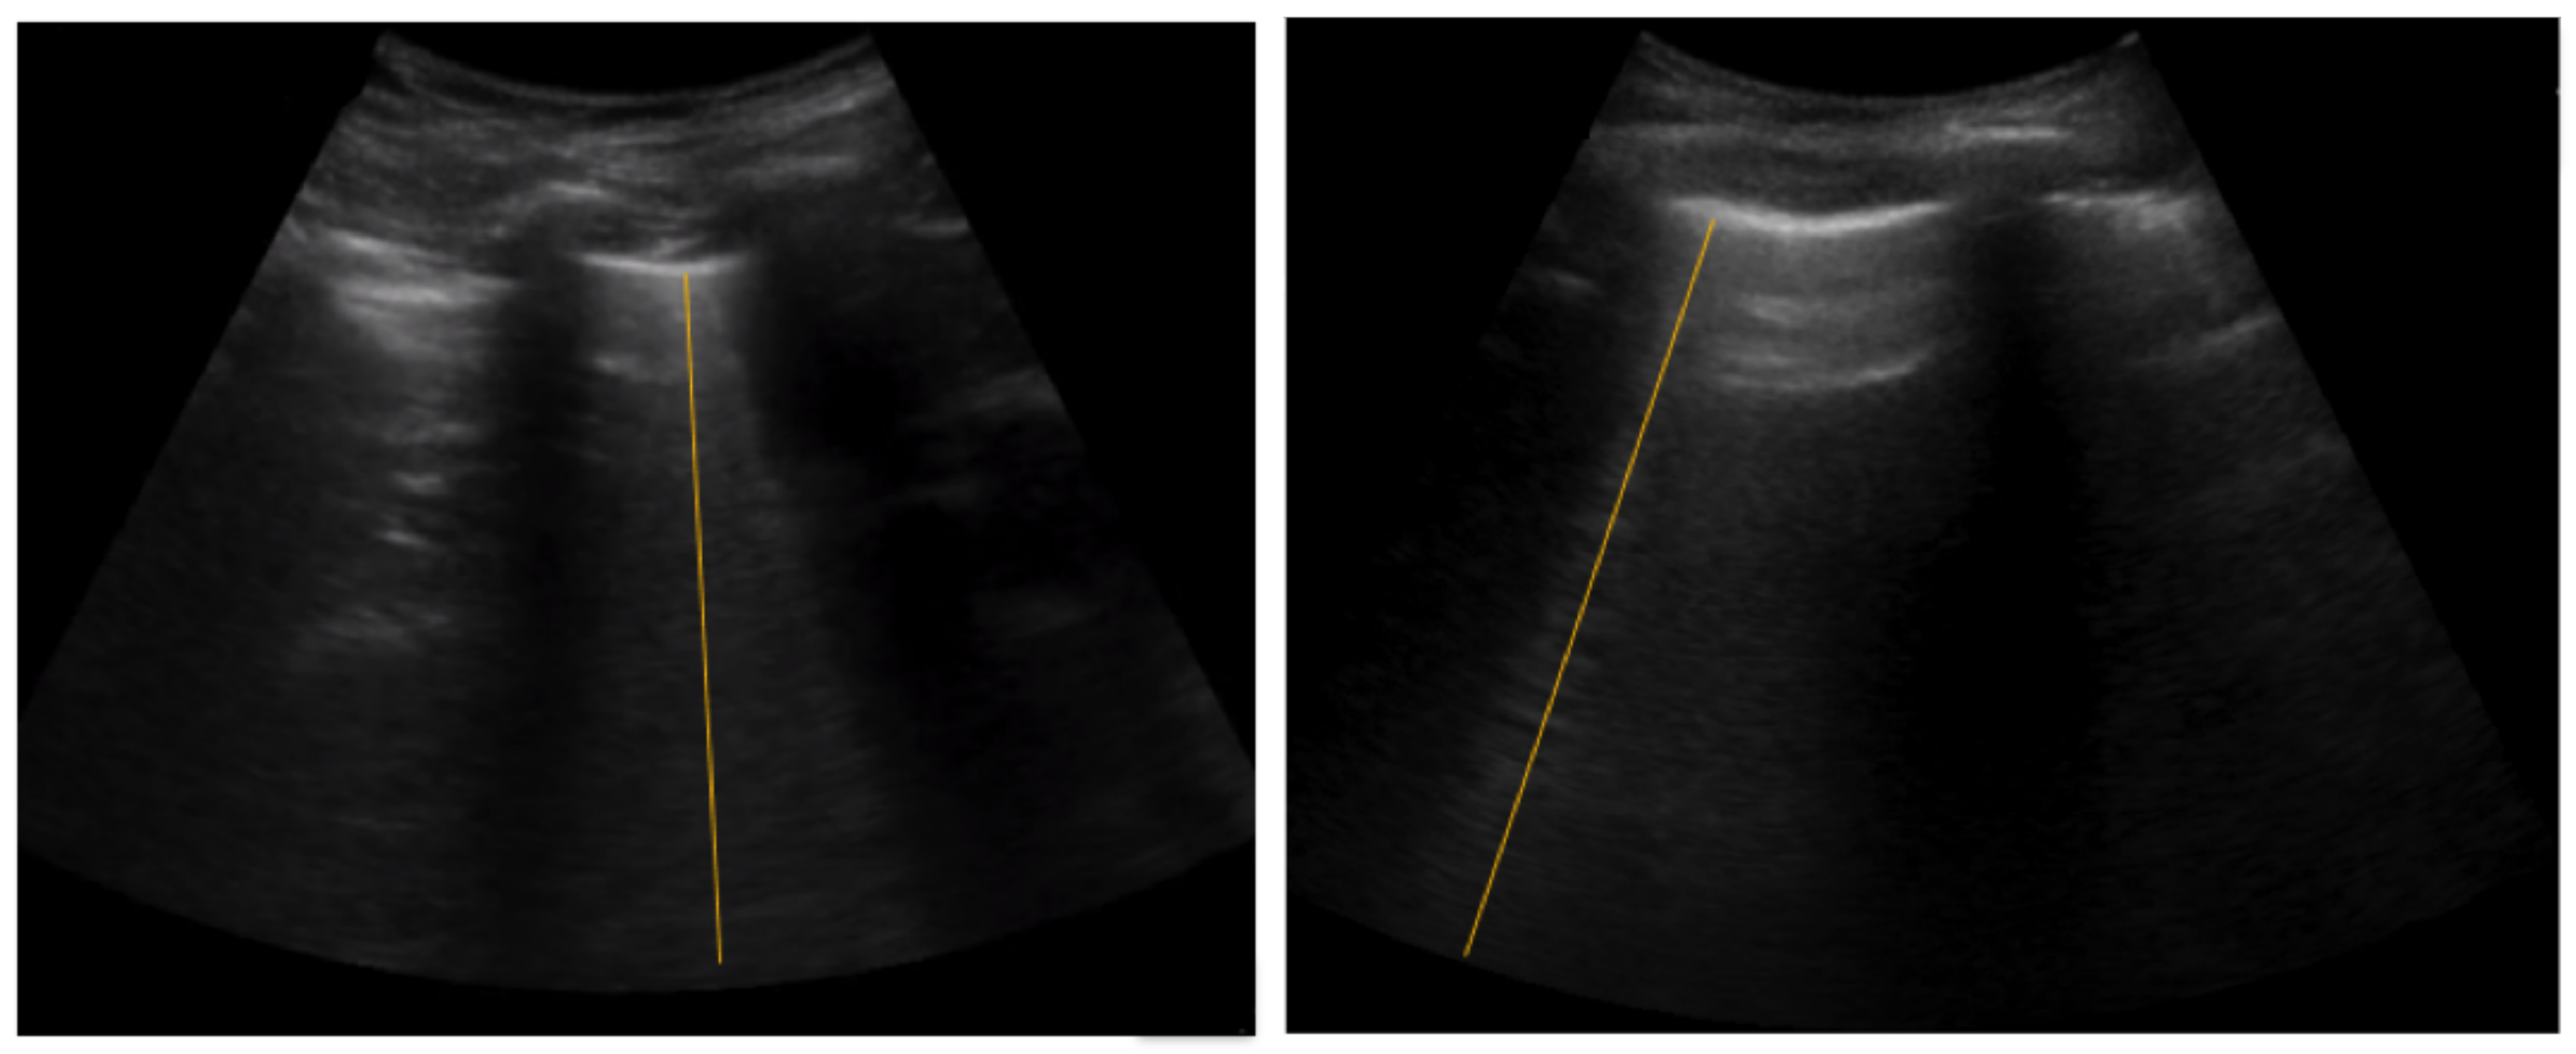
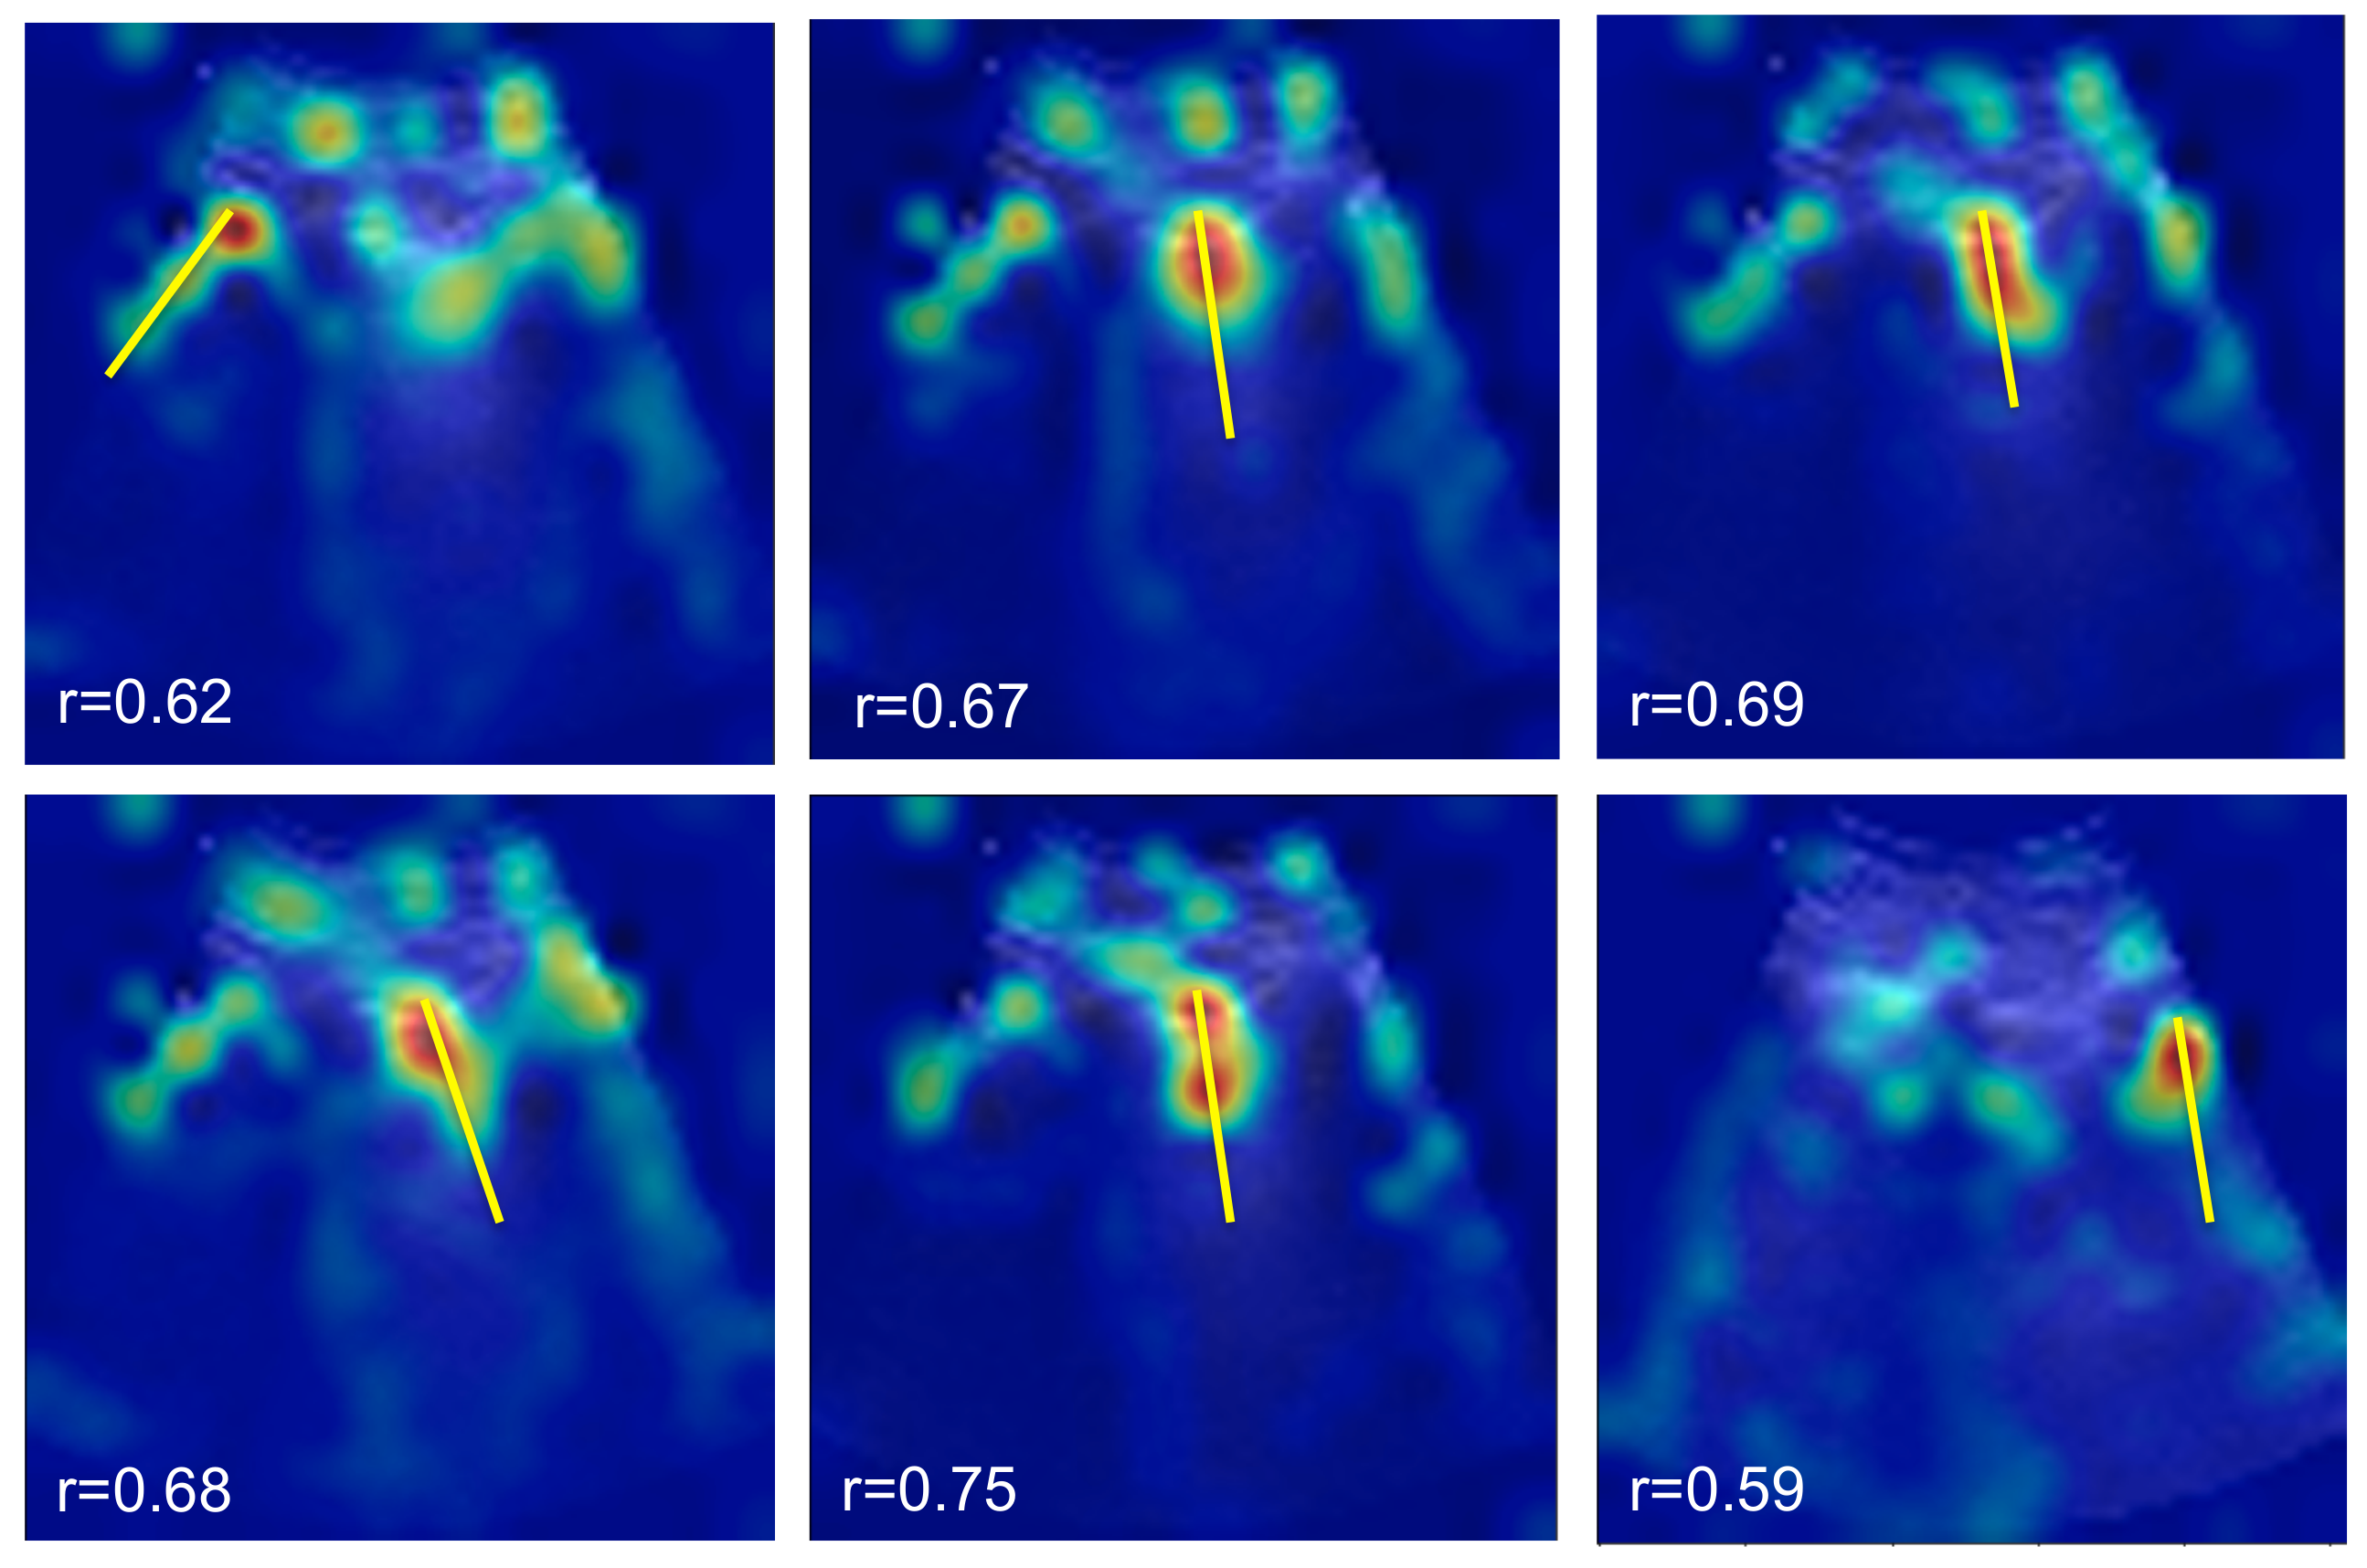
5.2. Spatial B-Line Localization
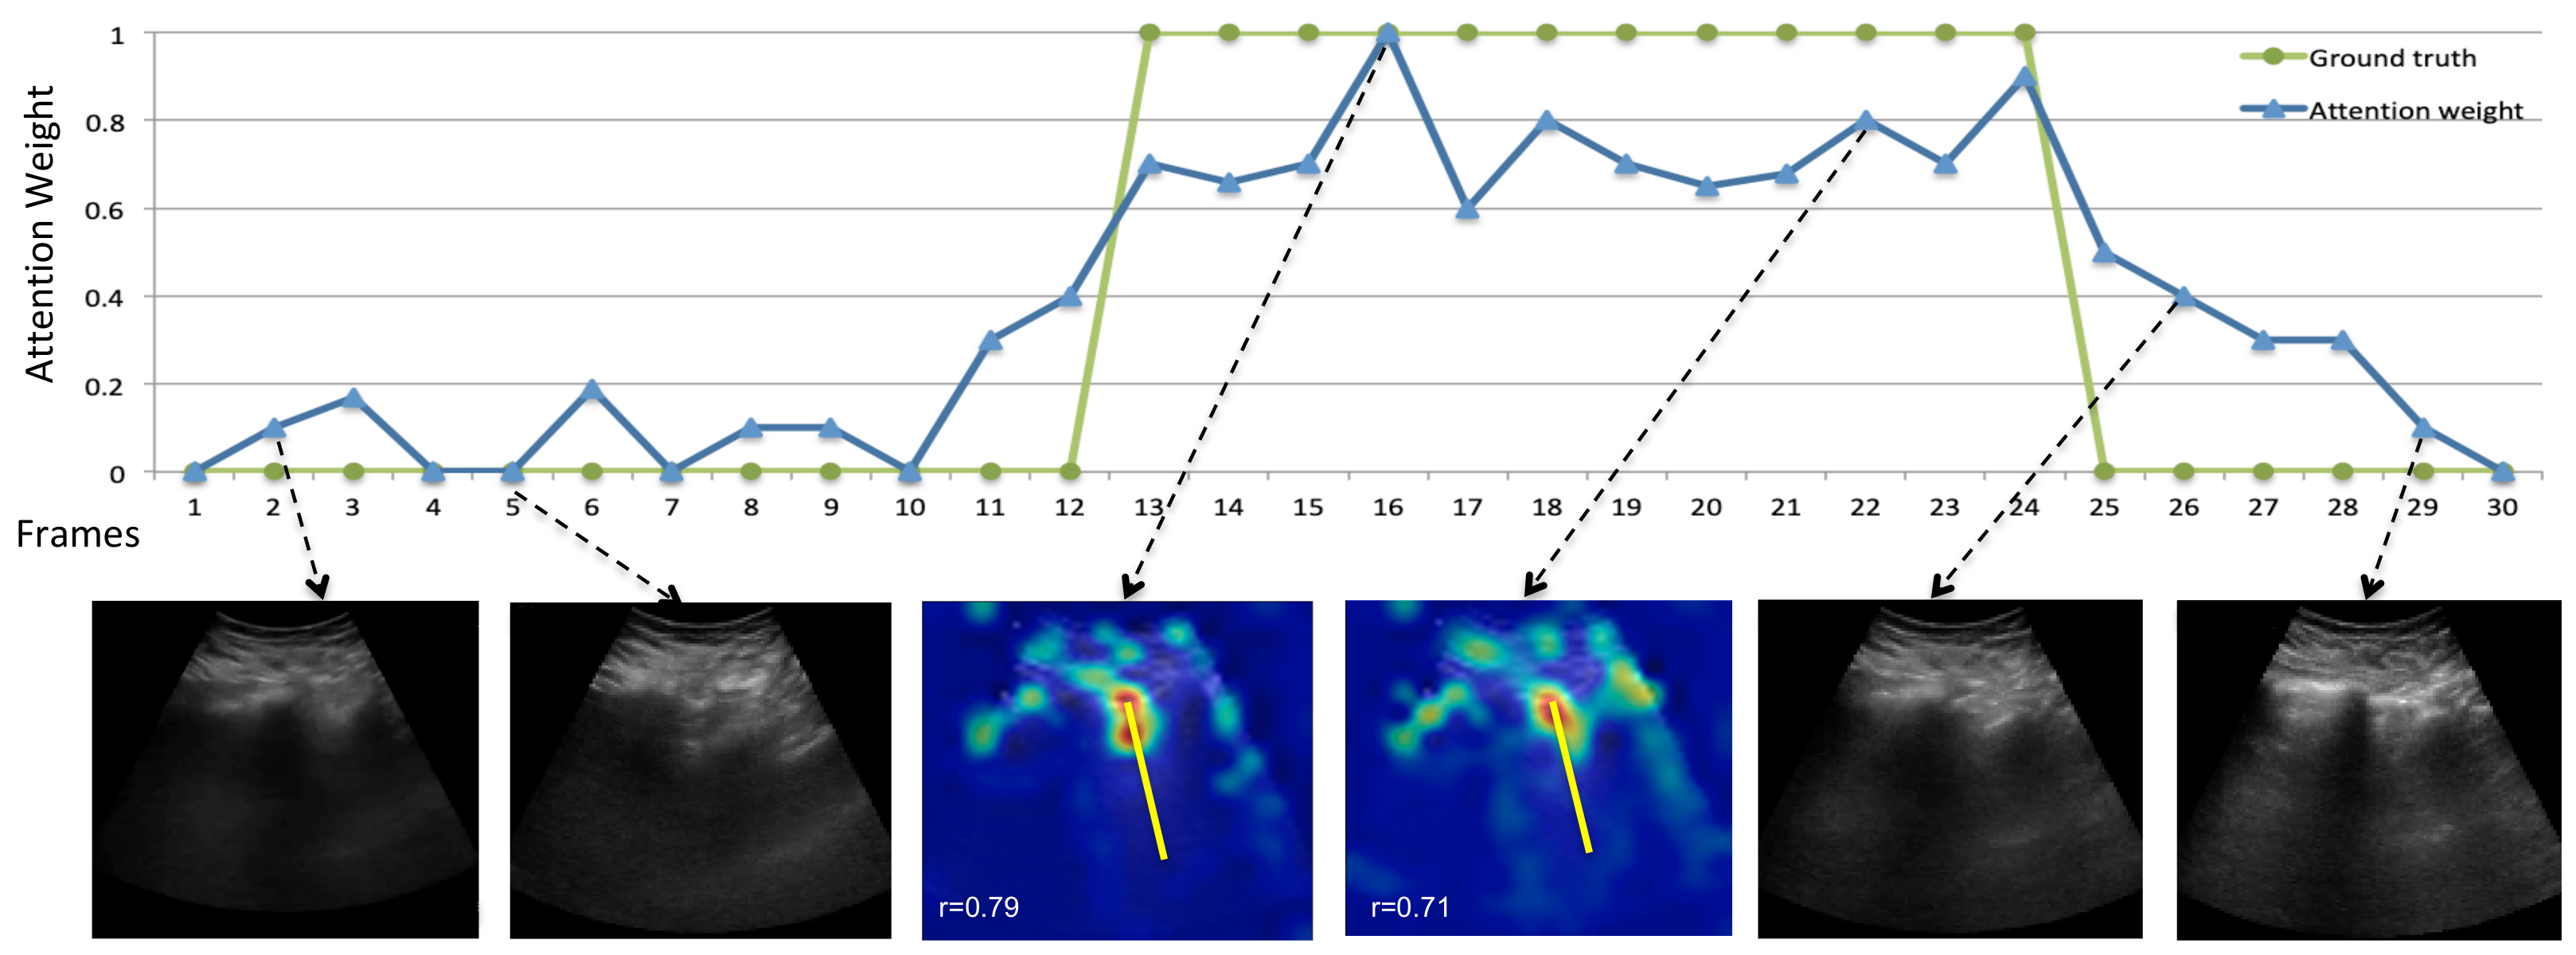
5.3. Temporal B-Line Localization
5.4. Effect of Video Length on B-Line Classification Performance
5.5. Ablation Study
6. Discussion and Conclusions
Author Contributions
Funding
Institutional Review Board Statement
Informed Consent Statement
Data Availability Statement
Acknowledgments
Conflicts of Interest
References
- Tuiskunen Bäck, A.; Lundkvist, Å. Dengue viruses—An overview. Infect. Ecol. Epidemiol. 2013, 3, 19839. [Google Scholar] [CrossRef] [PubMed]
- Yacoub, S.; Wertheim, H.; Simmons, C.; Screaton, G.; Wills, B. Cardiovascular manifestations of the emerging dengue pandemic. Nat. Rev. Cardiol. 2014, 11, 335. [Google Scholar] [CrossRef] [PubMed]
- Yacoub, S.; Wills, B. Dengue: An update for clinicians working in non-endemic areas. Clin. Med. 2015, 15, 82. [Google Scholar] [CrossRef] [PubMed] [Green Version]
- Soldati, G.; Demi, M.; Demi, L. Ultrasound patterns of pulmonary edema. Ann. Transl. Med. 2019, 7, S16. [Google Scholar] [CrossRef]
- Dietrich, C.F.; Mathis, G.; Blaivas, M.; Volpicelli, G.; Seibel, A.; Wastl, D.; Atkinson, N.S.; Cui, X.W.; Fan, M.; Yi, D. Lung B-line artefacts and their use. J. Thorac. Dis. 2016, 8, 1356. [Google Scholar] [CrossRef] [Green Version]
- Van Sloun, R.J.; Demi, L. Localizing B-lines in lung ultrasonography by weakly supervised deep learning, in-vivo results. IEEE J. Biomed. Health Inform. 2019, 24, 957–964. [Google Scholar] [CrossRef]
- Van Sloun, R.J.G.; Cohen, R.; Eldar, Y. Deep learning in ultrasound imaging. Proc. IEEE 2019, 108, 11–29. [Google Scholar] [CrossRef] [Green Version]
- Lu, J.; Yang, J.; Batra, D.; Parikh, D. Hierarchical question-image co-attention for visual question answering. arXiv 2016, arXiv:1606.00061. [Google Scholar]
- Rohit, G.; Ramanan, D. Attentional pooling for action recognition. arXiv 2017, arXiv:1711.01467. [Google Scholar]
- Vaswani, A.; Shazeer, N.; Parmar, N.; Uszkoreit, J.; Jones, L.; Gomez, A.N.; Kaiser, Ł.; Polosukhin, I. Attention is all you need. arXiv 2017, arXiv:1706.03762. [Google Scholar]
- Kerdegari, H.; Nhat, P.T.H.; McBride, A.; Razavi, R.; Van Hao, N.; Thwaites, L.; Yacoub, S.; Gomez, A. Automatic Detection of B-lines in Lung Ultrasound Videos From Severe Dengue Patients. In Proceedings of the IEEE 18th International Symposium on Biomedical Imaging (ISBI), Nice, France, 13–16 April 2021; pp. 989–993. [Google Scholar]
- Kerdegari, H.; Nhat, P.T.H.; McBride, A.; Pisani, L.; Razavi, R.; Thwaites, L.; Yacoub, S.; Gomez, A. B-line Detection in Lung Ultrasound Videos: Cartesian vs Polar Representation. arXiv 2021, arXiv:2107.12291. [Google Scholar]
- Zhao, Z.; Zheng, P.; Xu, S.; Wu, X. Object detection with deep learning: A review. IEEE Trans. Neural Netw. Learn. Syst. 2019, 30, 3212–3232. [Google Scholar] [CrossRef] [PubMed] [Green Version]
- Chen, X.; Yao, L.; Zhang, Y. Residual attention u-net for automated multi-class segmentation of covid-19 chest ct images. arXiv 2020, arXiv:2004.05645. [Google Scholar]
- Gaál, G.; Maga, B.; Lukács, A. Attention u-net based adversarial architectures for chest X-ray lung segmentation. arXiv 2020, arXiv:2003.10304. [Google Scholar]
- Arntfield, R.; VanBerlo, B.; Alaifan, T.; Phelps, N.; White, M.; Chaudhary, R.; Ho, J.; Wu, D. Development of a deep learning classifier to accurately distinguish COVID-19 from look-a-like pathology on lung ultrasound. medRxiv 2020. [Google Scholar] [CrossRef]
- Zhou, B.; Khosla, A.; Lapedriza, A.; Oliva, A.; Torralba, A. Learning deep features for discriminative localization. In Proceedings of the CVPR 2016, Las Vegas, NV, USA, 27–30 June 2016; pp. 2921–2929. [Google Scholar]
- Roy, S.; Menapace, W.; Oei, S.; Luijten, B.; Fini, E.; Saltori, C.; Huijben, I.; Chennakeshava, N.; Mento, F.; Sentelli, A.; et al. Deep learning for classification and localization of covid-19 markers in point-of-care lung ultrasound. IEEE Trans. Med. Imaging 2020, 39, 2676–2687. [Google Scholar] [CrossRef] [PubMed]
- Kulhare, S.; Zheng, X.; Mehanian, C.; Gregory, C.; Zhu, M.; Gregory, K.; Xie, H.; Jones, J.M.; Wilson, B. Ultrasound-based detection of lung abnormalities using single shot detection convolutional neural networks. In Proceedings of the MICCAI-PoCUS, Granada, Spain, 16–20 September 2018; pp. 65–73. [Google Scholar]
- Ouyang, X.; Huo, J.; Xia, L.; Shan, F.; Liu, J.; Mo, Z.; Yan, F.; Ding, Z.; Yang, Q.; Song, B.; et al. Dual-sampling attention network for diagnosis of covid-19 from community acquired pneumonia. IEEE Trans. Med. Imaging 2020, 39, 2595–2605. [Google Scholar] [CrossRef]
- Liu, B.; Gao, X.; He, M.; Lv, F.; Yin, G. Online covid-19 diagnosis with chest ct images: Lesion-attention deep neural networks. medRxiv 2020. [Google Scholar] [CrossRef]
- Zhao, X.; Zhang, P.; Song, F.; Fan, G.; Sun, Y.; Wang, Y.; Tian, Z.; Zhang, L.; Zhang, G. D2A U-Net: Automatic Segmentation of COVID-19 Lesions from CT Slices with Dilated Convolution and Dual Attention Mechanism. arXiv 2021, arXiv:2102.05210. [Google Scholar]
- Zhou, T.; Canu, S.; Ruan, S. An automatic covid-19 ct segmentation network using spatial and channel attention mechanism. arXiv 2020, arXiv:2004.06673. [Google Scholar]
- He, K.; Zhang, X.; Ren, S.; Sun, J. Deep residual learning for image recognition. In Proceedings of the IEEE Conference on Computer Vision and Pattern Recognition, Las Vegas, NV, USA, 27–30 June 2016; pp. 770–778. [Google Scholar]
- Huang, G.; Liu, Z.; Maaten, L. Densely connected convolutional networks. In Proceedings of the IEEE Conference on Computer Vision and Pattern Recognition, Honolulu, HI, USA, 21–26 June 2017; pp. 4700–4708. [Google Scholar]
- Jetley, S.; Lord, N.; Lee, N.; Torr, P. Learn to Pay Attention. In Proceedings of the International Conference on Learning Representations, Vancouver, BC, Canada, 30 April–3 May 2018. [Google Scholar]
- Bahdanau, D.; Cho, K.; Bengio, Y. Neural machine translation by jointly learning to align and translate. arXiv 2014, arXiv:1409.0473. [Google Scholar]
- Riviello, E.D.; Kiviri, W.; Twagirumugabe, T.; Mueller, A.; Banner-Goodspeed, V.M.; Officer, L.; Novack, V.; Mutumwinka, M.; Talmor, D.S.; Fowler, R.A. Hospital incidence and outcomes of the acute respiratory distress syndrome using the kigali modification of the berlin definition. Am. J. Respir. Crit. Care Med. 2016, 193, 52–59. [Google Scholar] [CrossRef] [PubMed]
- Lichtenstein, D.; Meziere, G. Relevance of lung ultrasound in the diagnosis of acute respiratory failure: The blue protocol. Chest 2008, 134, 117–125. [Google Scholar] [CrossRef] [Green Version]
- Volpicelli, G.; Elbarbary, M.; Blaivas, M.; Lichtenstein, D.A.; Mathis, G.; Kirkpatrick, A.W.; Melniker, L.; Gargani, L.; Noble, V.E.; Via, G.; et al. International evidence-based recommendations for point-of-care lung ultrasound. Intensive Care Med. 2012, 38, 577–591. [Google Scholar] [CrossRef] [PubMed] [Green Version]
- Dutta, A.; Zisserman, A. The VIA annotation software for images, audio and video. In Proceedings of the ACM Multimedia, Nice, France, 21–25 October 2019. [Google Scholar]
- Benesty, J.; Chen, J.; Huang, Y.; Cohen, I. Pearson correlation coefficient. In Noise Reduction in Speech Processing; Springer: Berlin/Heidelberg, Germany, 2009; pp. 1–4. [Google Scholar]
- Meng, L.; Zhao, B.; Chang, B.; Huang, G.; Tung, F.; Sigal, L. Interpretable spatio-temporal attention for video action recognition. In Proceedings of the IEEE International Conference on Computer Vision Workshops, Seoul, Korea, 27–28 October 2019. [Google Scholar]
- Gullett, J.; Donnelly, J.P.; Sinert, R.; Hosek, B.; Fuller, D.; Hill, H.; Feldman, I.; Galetto, G.; Auster, M.; Hoffmann, B. Interobserver agreement in the evaluation of B-lines using bedside ultrasound. J. Crit. Care 2015, 30, 1395–1399. [Google Scholar] [CrossRef] [PubMed]


| Index | Operation |
|---|---|
| (1) | Conv (N = 16, K = 3, S = 1, P = 1, BN, Relu) |
| (2) | Conv (N = 8, K = 3, S = 1, P = 1, BN, Relu) |
| (3) | Conv (N = 1, K = 3, S = 1, P = 1, Sigmoid) |
| Resolution | Frame Rate | Video Length | No Patient | Annotation |
|---|---|---|---|---|
| 640 * 480 | 30 | About 5 h in total (avg 5 min per patient) | 60 | Frame-level & line annotation |
| Model | Precision | Recall | F1 |
|---|---|---|---|
| C2D+S+T | 58.1 | 61.9 | 59.9 |
| C3D+S+T | 74.1 | 83.2 | 78.3 |
| C2D+S+LSTM+T | 77.2 | 90.3 | 83.2 |
| IoU | = 0.1 | = 0.2 | = 0.3 |
|---|---|---|---|
| C2D+S+T | 37.7 | 32.4 | 27.6 |
| C3D+S+T | 65.1 | 62.3 | 52.5 |
| C2D+S+LSTM+T | 69.7 | 64.1 | 53.9 |
| Testing | |||||
|---|---|---|---|---|---|
| Length l (s) | 1 | 2 | 3 | 4 | |
| Training | 1 | 83.2 | 83.0 | 82.8 | 82.6 |
| 2 | 81.1 | 83.0 | 82.5 | 82.2 | |
| 3 | 79.7 | 80.1 | 83.6 | 83.8 | |
| 4 | 78.6 | 79.2 | 80.4 | 83.5 | |
| Model | Precision | Recall | F1 |
|---|---|---|---|
| C2D+LSTM | 75.1 | 85.0 | 79.7 |
| C2D+S+LSTM | 75.7 | 86.1 | 80.5 |
| C2D+LSTM+T | 76.1 | 86.8 | 81.0 |
| C2D+S+LSTM+T* | 76.8 | 89.8 | 82.7 |
| C2D+S+LSTM+T | 77.2 | 90.3 | 83.2 |
Publisher’s Note: MDPI stays neutral with regard to jurisdictional claims in published maps and institutional affiliations. |
© 2021 by the authors. Licensee MDPI, Basel, Switzerland. This article is an open access article distributed under the terms and conditions of the Creative Commons Attribution (CC BY) license (https://creativecommons.org/licenses/by/4.0/).
Share and Cite
Kerdegari, H.; Phung, N.T.H.; McBride, A.; Pisani, L.; Nguyen, H.V.; Duong, T.B.; Razavi, R.; Thwaites, L.; Yacoub, S.; Gomez, A.; et al. B-Line Detection and Localization in Lung Ultrasound Videos Using Spatiotemporal Attention. Appl. Sci. 2021, 11, 11697. https://0-doi-org.brum.beds.ac.uk/10.3390/app112411697
Kerdegari H, Phung NTH, McBride A, Pisani L, Nguyen HV, Duong TB, Razavi R, Thwaites L, Yacoub S, Gomez A, et al. B-Line Detection and Localization in Lung Ultrasound Videos Using Spatiotemporal Attention. Applied Sciences. 2021; 11(24):11697. https://0-doi-org.brum.beds.ac.uk/10.3390/app112411697
Chicago/Turabian StyleKerdegari, Hamideh, Nhat Tran Huy Phung, Angela McBride, Luigi Pisani, Hao Van Nguyen, Thuy Bich Duong, Reza Razavi, Louise Thwaites, Sophie Yacoub, Alberto Gomez, and et al. 2021. "B-Line Detection and Localization in Lung Ultrasound Videos Using Spatiotemporal Attention" Applied Sciences 11, no. 24: 11697. https://0-doi-org.brum.beds.ac.uk/10.3390/app112411697