
Experimental Measurement of Sharp THz Absorption Signatures from Nucleic Acid Solutions in Nanofluidic Channels

1
Terapico, LLC, Beavercreek, OH 45431, USA
2
Redondo Optics, Inc., Redondo Beach, CA 90277, USA
*
Author to whom correspondence should be addressed.
Appl. Sci. 2021, 11(24), 11827; https://0-doi-org.brum.beds.ac.uk/10.3390/app112411827
Submission received: 18 October 2021
/
Revised: 28 November 2021
/
Accepted: 3 December 2021
/
Published: 13 December 2021
(This article belongs to the Special Issue Terahertz Sensing)
Abstract
:We report on the room-temperature experimental measurement of THz absorption signatures in aqueous, double-stranded nucleic acid solutions confined to the submicron silica channels on fused quartz substrates using THz frequency-domain (photomixing) spectroscopy. Three sharp (i.e., strong and narrow) signatures, ~10–20 GHz FWHM, are observed in the shortest base pair sample—small interfering, double-stranded (ds) RNA—in the range of 800 GHz to 1.1 THz. Three similar signatures are also observed in a 50-bp dsDNA ladder sample. For a 1-kbp dsDNA ladder sample, the three are still evident, but are broadened and weakened. For a 48.5-kbp sample (λ-DNA), no prominent signatures are observed, but rather a quasi-sinusoidal transmittance spectrum consistent with a substrate etalon effect. The division between sharp signatures and no signatures is consistent with the molecular length being shorter or longer than the persistence length.
1. Introduction
THz radiation remains of interest for biomolecular sensing because, in principle, it can interact resonantly with collective vibrations that involve hundreds or more atomic constituents. It can therefore be more specific to the secondary structure of the biomolecules, compared to the interatomic vibrations or primary structure sensed by traditional Fourier transform IR (FTIR) spectroscopy. In addition, THz is inherently non-ionizing and, like IR spectroscopy, can detect “label free” (i.e., no stains or dyes are required as in fluorescence spectroscopy). Sub-THz vibrational modes in nucleic acid DNA and RNA have been investigated for several decades, going back to seminal theoretical work by Van Zandt [1] and experimental work by Urabe [2], Lindsay [3] (Raman spectroscopy), Wittlin [4] (FTIR), and others. These early papers emphasized the likely existence of sub-THz optically active phonon-like modes in DNA via the hydrogen bonds distributed between the base pairs. Later, the importance of localized vibrational modes was emphasized [5,6,7], and THz signatures in nucleic acids became a contentious topic in experimental studies, especially the difference between solid-state and aqueous samples. The relatively new technique of time-domain spectroscopy (TDS) provided a tool with unprecedented sensitivity in the THz region, but both supportive [8,9] and contradictory [10] results were published. Importantly, sample presentation, concentration, and the role of liquid water became more emphasized. Precise numerical modelling tools, such as molecular dynamics, were exercised to justify the existence of optically active phonon-like modes, but without accounting for the effect of water [11]. However, many researchers continued to believe that the aqueous state would dampen the nucleic acid THz vibrations to the point of poor- or non-observability.
Fortunately, more recent theoretical and experimental research has suggested otherwise. For example, the utilization of ultrafast optical Kerr-effect spectroscopy has indicated that the temporal dynamic effect of water is reduced significantly in aqueous DNA, by roughly two orders of magnitude compared to conventional estimation [12]. The explanation is rather complex, which is not surprising, since it has long been known that the interaction of biomolecules with liquid water is a highly correlated “dance” [13] involving a thin layer of bound water on the surface of the biomolecule in dynamic interaction with the free (or bulk) water around it. Furthermore, the nano-mechanical properties of the double-stranded nucleic acids have become better understood [14]. A key parameter in this regard is the persistence length—the distance over which the molecules behave like rigid structures subject to classical elastic mechanics, and not dominated by thermal fluctuations and collisions. We will return to this topic later in the Discussion section.
The primary aim of this paper is to present experimental evidence that sharp (i.e., strong and narrow) THz absorptive spectral signatures do exist in aqueous nucleic acid samples. We utilize nanofluidic channel technology, which allows the nucleic acid samples to be investigated in very thin (≈500 nm) and small volume profile, thereby reducing the bulk water absorption to a very low level. Our original work on this topic started over ten years ago, but on silicon-based nanofluidic chips [15]. Here, we report on fused quartz-based chips, which have provided better data on aqueous double-stranded nucleic acids in the range of ~17 base pairs (si-RNA) to 48.5 kbp (λ-DNA). The smaller molecule samples in the range of ~20 to ~500 bp show sharp (strong and narrow) absorption signatures, whereas somewhat longer samples (~1 kbp) display weaker and broader signatures, but are reproducible, nonetheless. The longest DNA molecule tested (48.5 kbp) shows no prominent signatures at all.
2. Methods and Materials
2.1. Wideband THz Transmittance Spectroscopy
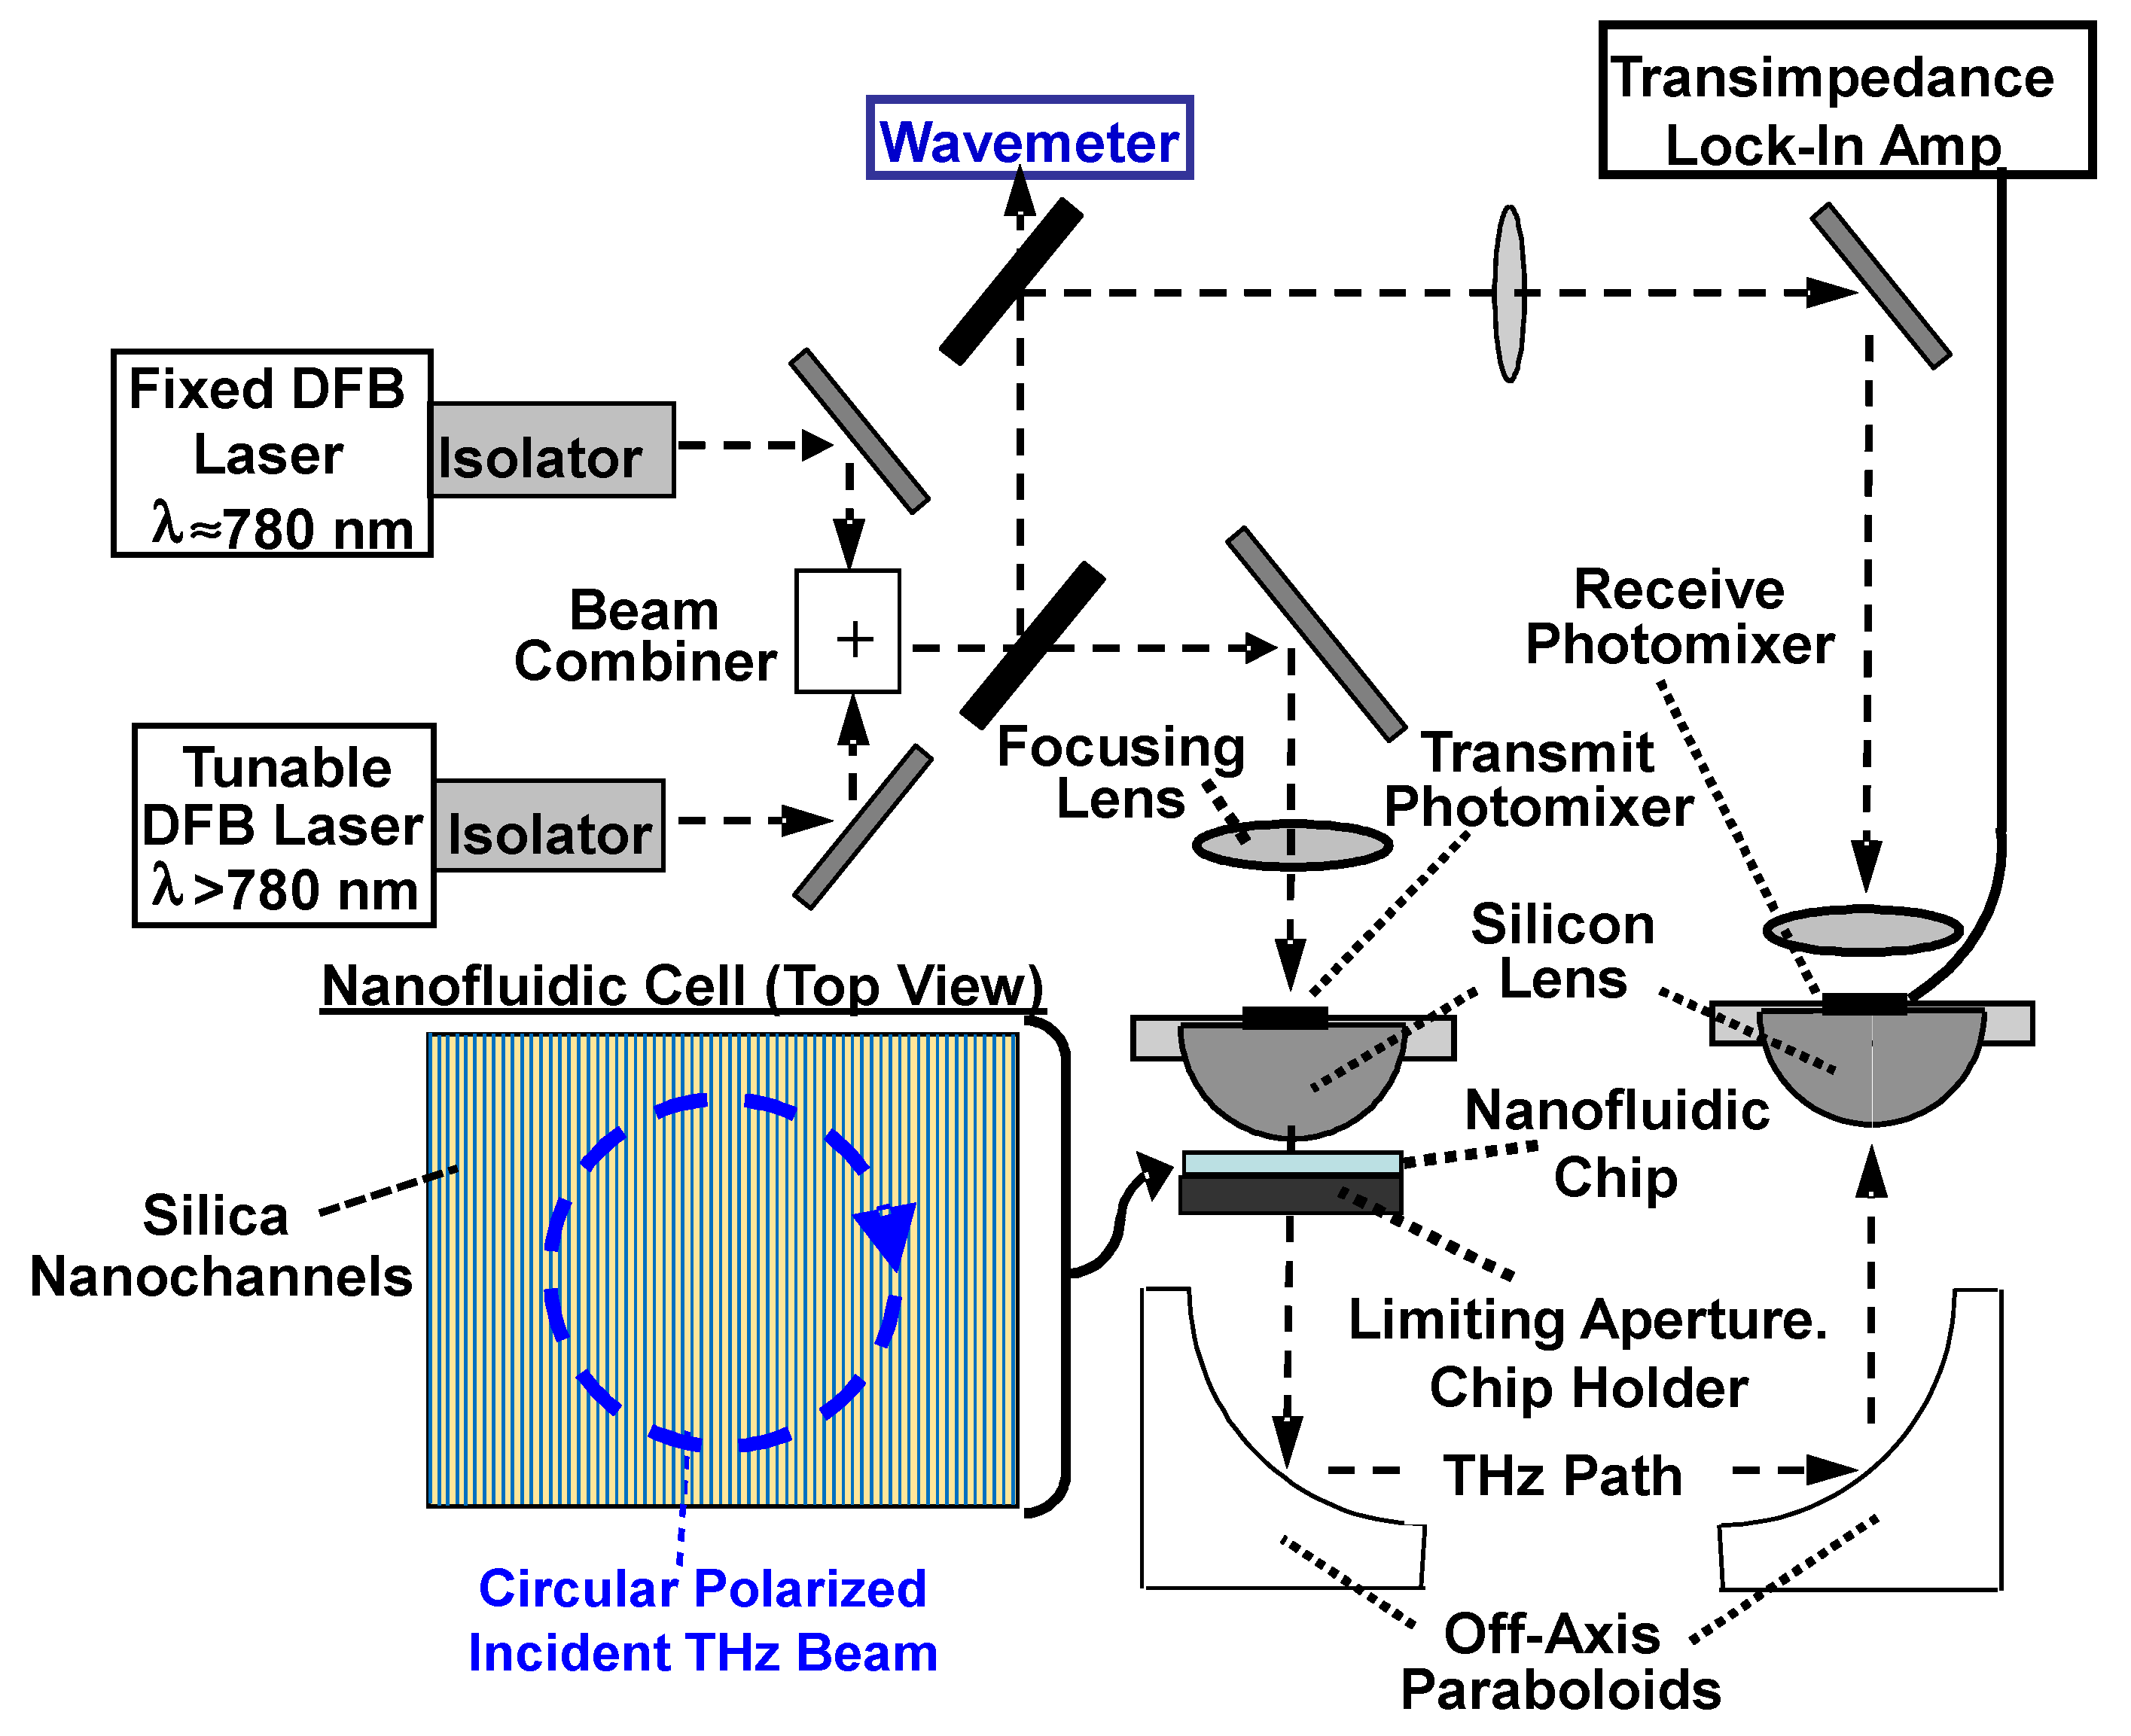
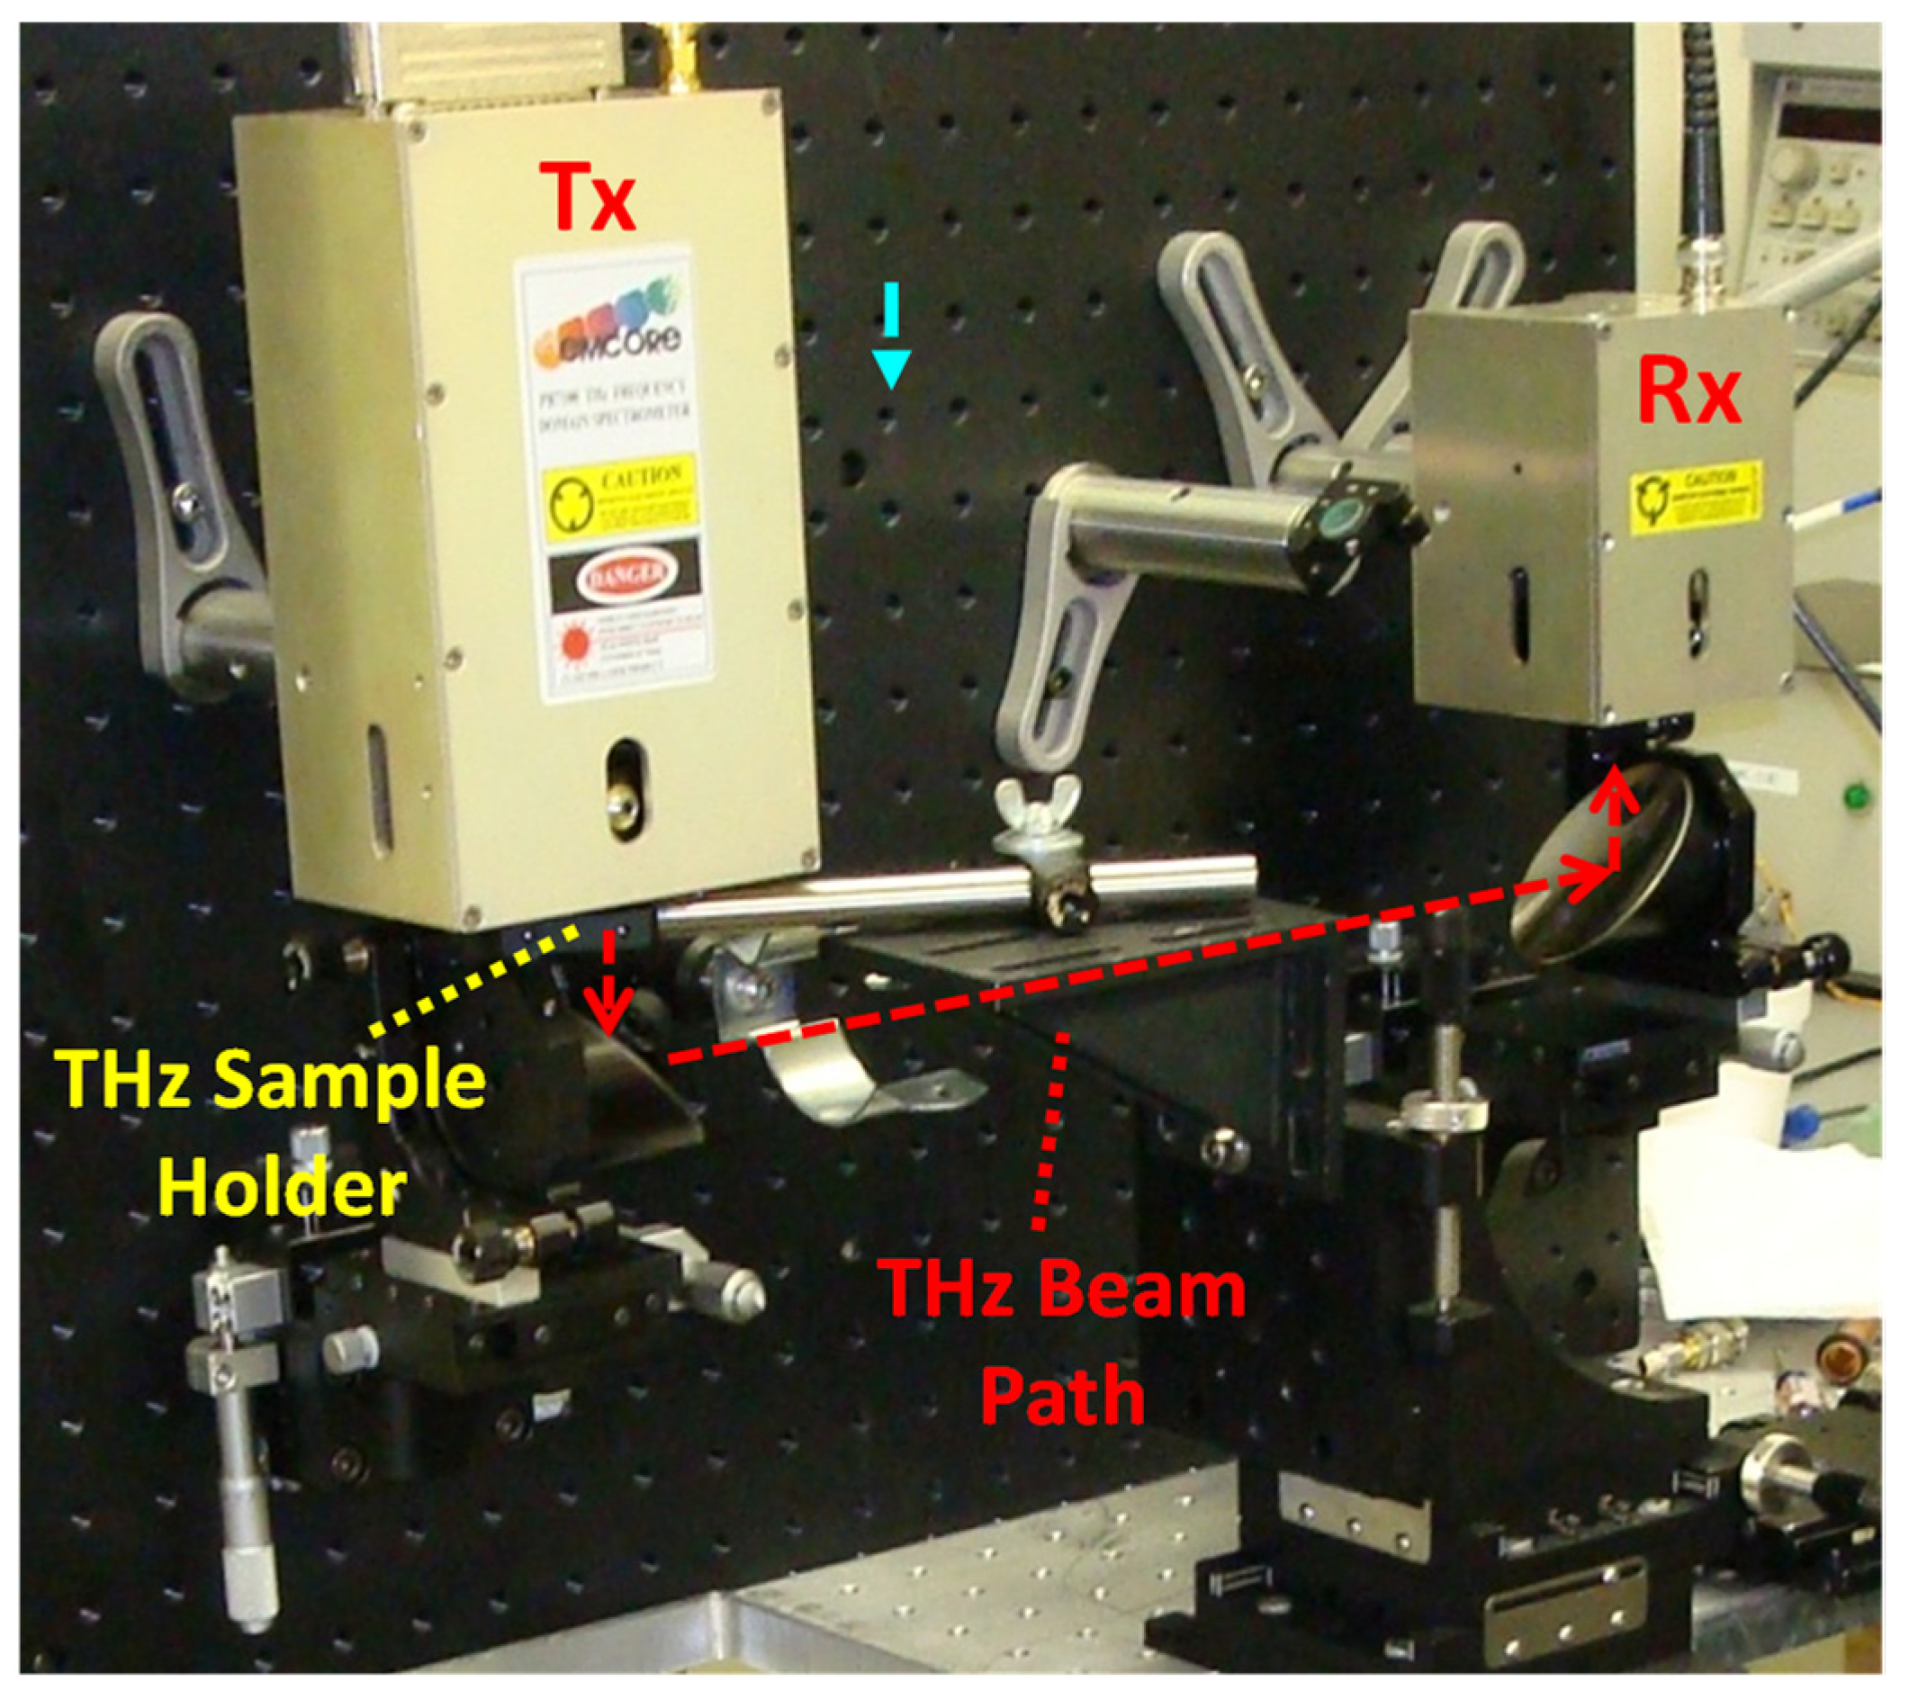
Our THz spectrometer is the coherent, frequency-domain, frequency-scanning photomixing transceiver shown in Figure 1 [16,17,18], consisting of a single frequency tunable transmitter; a tunable receiver mutually coherent to the transmitter; and a free space path in between ≈18 inches long. We modified the traditional all horizontal beam path of the spectroscopic instruments and introduced sections of vertical path. This allowed us to orient nanofluidic chips horizontally to alleviate gravitational effects and facilitate the filling of the nanochannels by capillary action. The nanofluidic chip samples of interest were located at the lens port of the transmit photomixer, as shown in Figure 1, just below a Si (hyperhemispherical) lens. Here, the spot diameter is small (~3 mm diameter), which underfills the active aperture of the chip (≈5 × 5 mm). Careful initial alignment of the chip was required to minimize beam steering with respect to the receiver. Moreover, the THz path was not evacuated, so water vapor lines—notorious in the THz frequency region—are expected to be present and are discussed below. Further details on our THz photomixing spectroscopy and its performance metrics are provided in Appendix A, with a photograph of the actual system in Figure A1.
The THz signatures we searched for are those associated with absorption resonances from the nucleic acid samples of interest. Consistent with and as generally practiced by FTIR spectroscopy, the absorption resonances should correspond to “dips” in the transmittance T vs. frequency. Our frequency range for testing was approximately 500–1000 GHz because sharp (i.e., narrow and strong) signatures were initially found from the smaller nucleic acid samples in this range. The larger nucleic acid samples also displayed signatures, although broader and weaker (see the Results section, below). To obtain the transmittance spectrum T(ν), three separate frequency scans were taken, all in 0.5 GHz steps: (1) a “background” spectrum of the received power vs. frequency, PB(ν); (2) a sample spectrum PS(ν) with the sample placed in the path; and (3) a noise spectrum PN(ν) with the transmitter power blocked (by a metal plate) and averaged over many successive scans. The transmittance was then computed as
T(ν) = [PS(ν) − PN(ν)]/[PB(ν) − PN(ν)].
Our experience with frequency-domain scanning spectroscopy is that this is an accurate technique when the signal-to-noise ratios (SNRs), PS(ν)/PN(ν) and PB(ν)/PN(ν), are at least 2.0 or greater at all frequencies in the scan [17,18].
One key aspect of our spectroscopic technique is frequency resolution. Because the linewidth of the DFB lasers used in the spectrometer is typically 50 MHz or less (see Appendix A), the THz resolution is just the step frequency, provided this is much greater than 50 MHz. Thus, in the present experiments, we set the step frequency to be 0.5 GHz. This is much finer than is typically used in THz spectroscopy (e.g., TDS, FTIR), allowing us to resolve fine signatures that other types of spectroscopy would broaden significantly or miss altogether. Another key aspect is common-mode cancellation, such as water vapor absorption in the open path between the transmitter and receiver. This affects T(ν) through a frequency-dependent factor M(ν) that multiplies both PS(ν) and PB(ν). Hence, provided PS(ν) and PB(ν) are both » PN(ν), M(ν) cancels out in Equation (1) to the first order. The effect of standing waves in the nanofluidic chip etalon is a separate issue and discussed in Section 4.1.
2.2. Nanofluidic Chips
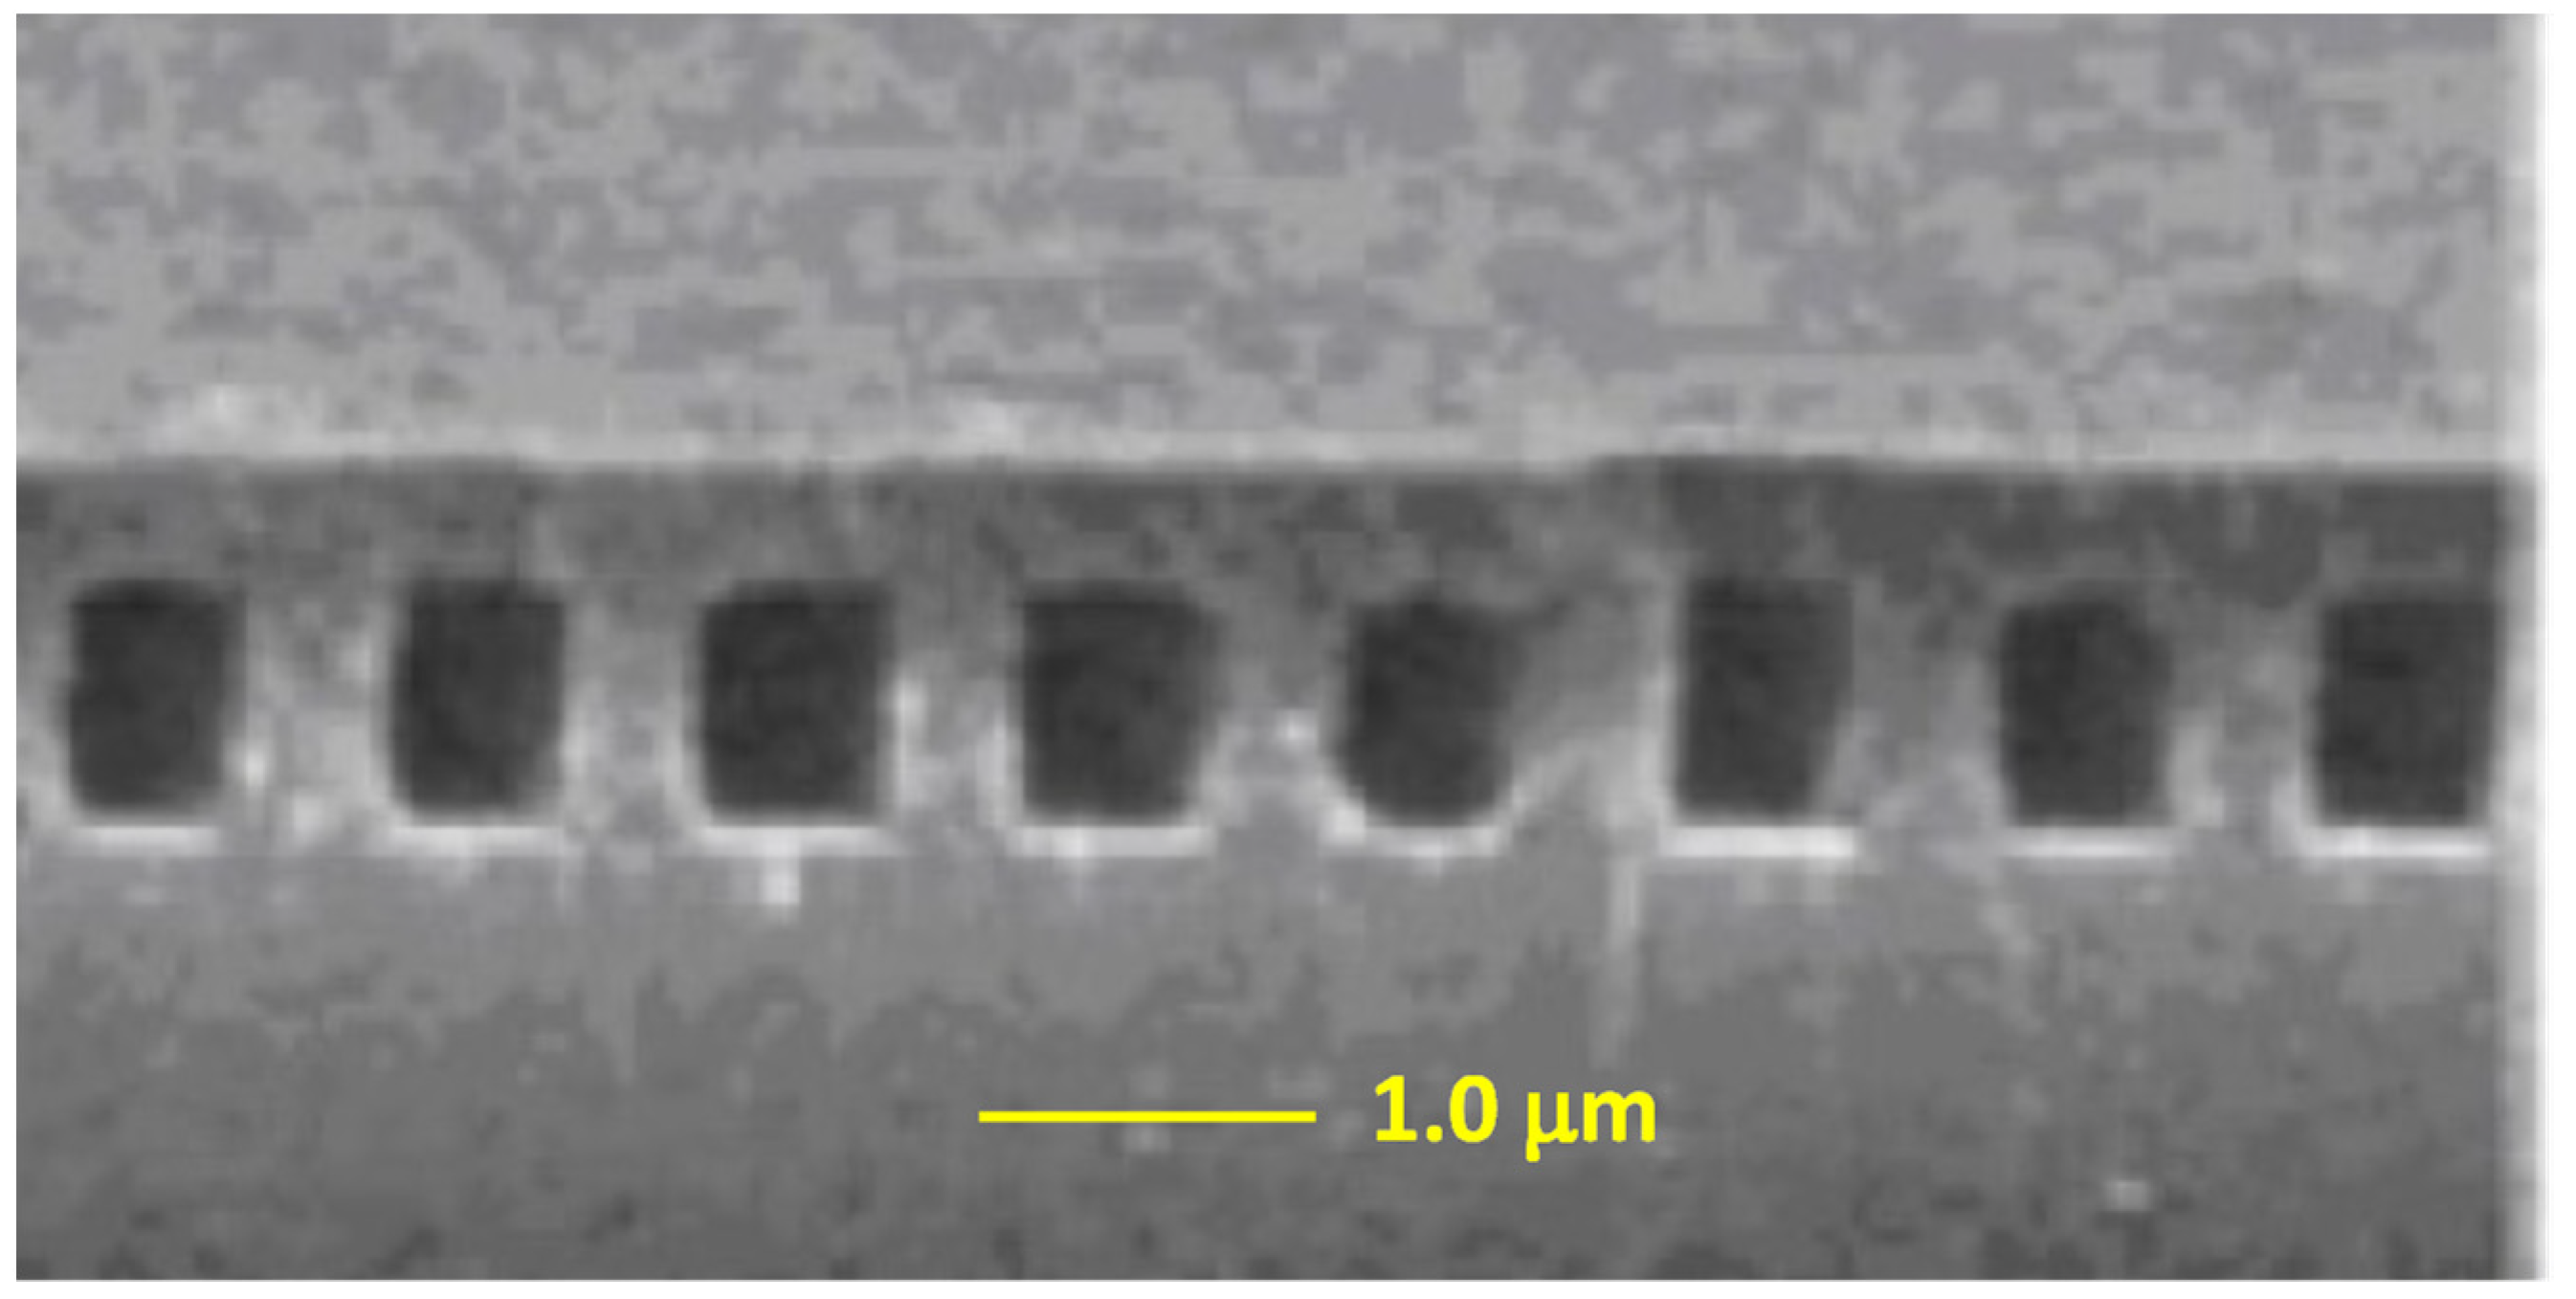
To investigate the absorption signatures in nucleic acid solutions, we utilized a nanoporous silica-on-fused quartz substrate nanochannel technology, as described in Appendix B. An SEM cross-sectional photograph of a representative structure is shown in Figure A2. The substrates were 2 × 2 cm wide by 1 mm thick, but the nanochannel region occupied only the central 5 × 5 mm square. These dimensions were designed to easily accommodate the ~3 mm diameter (1/e2 intensity points) focused THz beam in our spectrometer, so no significant “spill-over” was expected. Because the wavelengths investigated were ~0.5 mm or less, the diffractive effects (from the substrate edges) should be negligible, too. For our particular chips, the nanochannel dimensions were typically 500 nm wide by 600 nm deep, with a period of ≈1.0 μm. For nanochannel dimensions much smaller than this, the capillary flow was usually slow and sporadic, especially for the larger molecule samples tested. This caused a time variation of the THz transmittance that would appear as false signatures when the spectrometer frequency was scanned.
The nanofluidic chips also provided the ability to reduce the effect of substrate standing wave interference and observe the absorption effects primarily of the nucleic acids in solution. This entailed a “pre-wet” step in the sample preparation, whereby the “background” spectrum was the THz transmittance through the nanofluidic chip with its channels filled by a buffer solution of tri-phosphate ethylene-diaminetetraacetic acid (TPE), a common buffer for nucleic acids and compatible with the Tris-HCL ethylenediaminetetraacetic-acid (EDTA) that the samples are delivered in. After measuring the background spectrum PB(ν) with the channels full of buffer, the nucleic acid solution of choice was added to the reservoirs and allowed to flow into the channels for a time of ~20 min before measuring the sample spectrum PS(ν), and subsequently calculating T(ν) via Equation (1).
For this research, we originally used silica nanochannels fabricated on 0.5 mm-thick, high-resistivity silicon chips because of their ease of fabrication and the widespread availability of Si substrates [15]. However, the fluidic flow in the channels could not be observed by simple visible inspection because of the opacity of the Si. Furthermore, there was evidence of standing wave effects in the THz spectrum through the periodic behavior of T(ν), even after nanochannel “pre-wet”. Standing waves occur from multi-pass interference, as occurs in optical etalons, of which the nanofluidic substrate is an example. According to plane-wave propagation theory, they create an oscillating transmittance, having a peak-to-peak separation of Δf ≈ c/(2nd), where n is the refractive index and d is the etalon thickness (substrate + nanochannel layer). The etalon transmittance has a peak-to-trough ratio that increases rapidly with n. High-resistivity Si has a relatively large refractive index n ≈ 3.42 in the sub-THz region, but a very low absorption coefficient (α < 1.0 cm−1) [19]. By contrast, fused quartz has a lower refractive index n ≈ 1.95, but a more significant absorption (α ≈ 2.5–3.0 cm−1) [20]. These lead to an etalon peak separation of Δf ≈ 88 GHz for the Si, and ≈77 GHz for the quartz. As discussed in the Results section below, the strongest absorption signatures measured with our quartz substrate nanofluidic chip are spectrally confined, meaning that they appear in a limited range of frequencies, but either weaken or disappear entirely outside of this range. This is categorically different from the wideband quasi-sinusoidal behavior expected for plane-wave propagation through a low-loss etalon.
2.3. Nucleic Acid Samples
We investigated four different nucleic acid solutions [21], chosen based on the following criteria: they all contained double-stranded RNA or DNA fragments in the range of 17 bp to 48.5 kbp length, all had β helicity, and all were linear, meaning that both ends of each molecule were nominally free and not self-bonded to any other point of the molecule. All nucleic acids showed a tendency to flow freely into our pre-wet nanofluidic channels by capillary action, although this tendency diminished as the length of the fragment increased. The pre-wet step introduced a dilution factor, which we estimated as 50% as approximately equal volumes of pre-wet buffer and nucleic acid sample were always added to the nanochannel reservoir.
A summary of the essential chemical and physical parameters of each nucleic acid sample, such as the concentration and molarity, is provided in Figure 2a. The si-RNA sample contained equal concentrations of 17-, 21-, and 25-bp fragments, the average-length having the 21-mer sequence shown in Figure 2b. The 50-bp DNA sample contained varying concentrations of 17 different fragments between 50 and 1350 bp in length, the average fragment length being 511 bp. The 1-kbp DNA sample contained varying concentrations of 10 different fragments between 500 and 10,000 bp in length, the average fragment length being 3956 bp. Since the λ-DNA sample is homogeneous, the average fragment length is 48.5 kbp—the same as a single molecule. Further details of the samples are provided in Appendix C.
Also listed in Figure 2a is the volume of all nanochannels in the active region, meaning the 5 × 5 mm region that can harbor solution, even if it occurs outside the ≈3 × 3 mm spot size of the THz beam. This was calculated knowing the height, width, and periodicity of the nanochannels, as fabricated on the fused quartz substrate. This enabled a conservative estimate of the number of moles and molecules of each species in the full nanochannels after accounting for the dilution factor of 50%. In addition, although the si-RNA and each of the ladder DNA samples had a different distribution of fragment lengths, each fragment had the identical base pair sequence. For example, each of the three strands in the si-RNA sample all had a common sequence, such as that shown in Figure 2b for the 21-mer strand in the si-RNA.
2.4. Optical Calculations
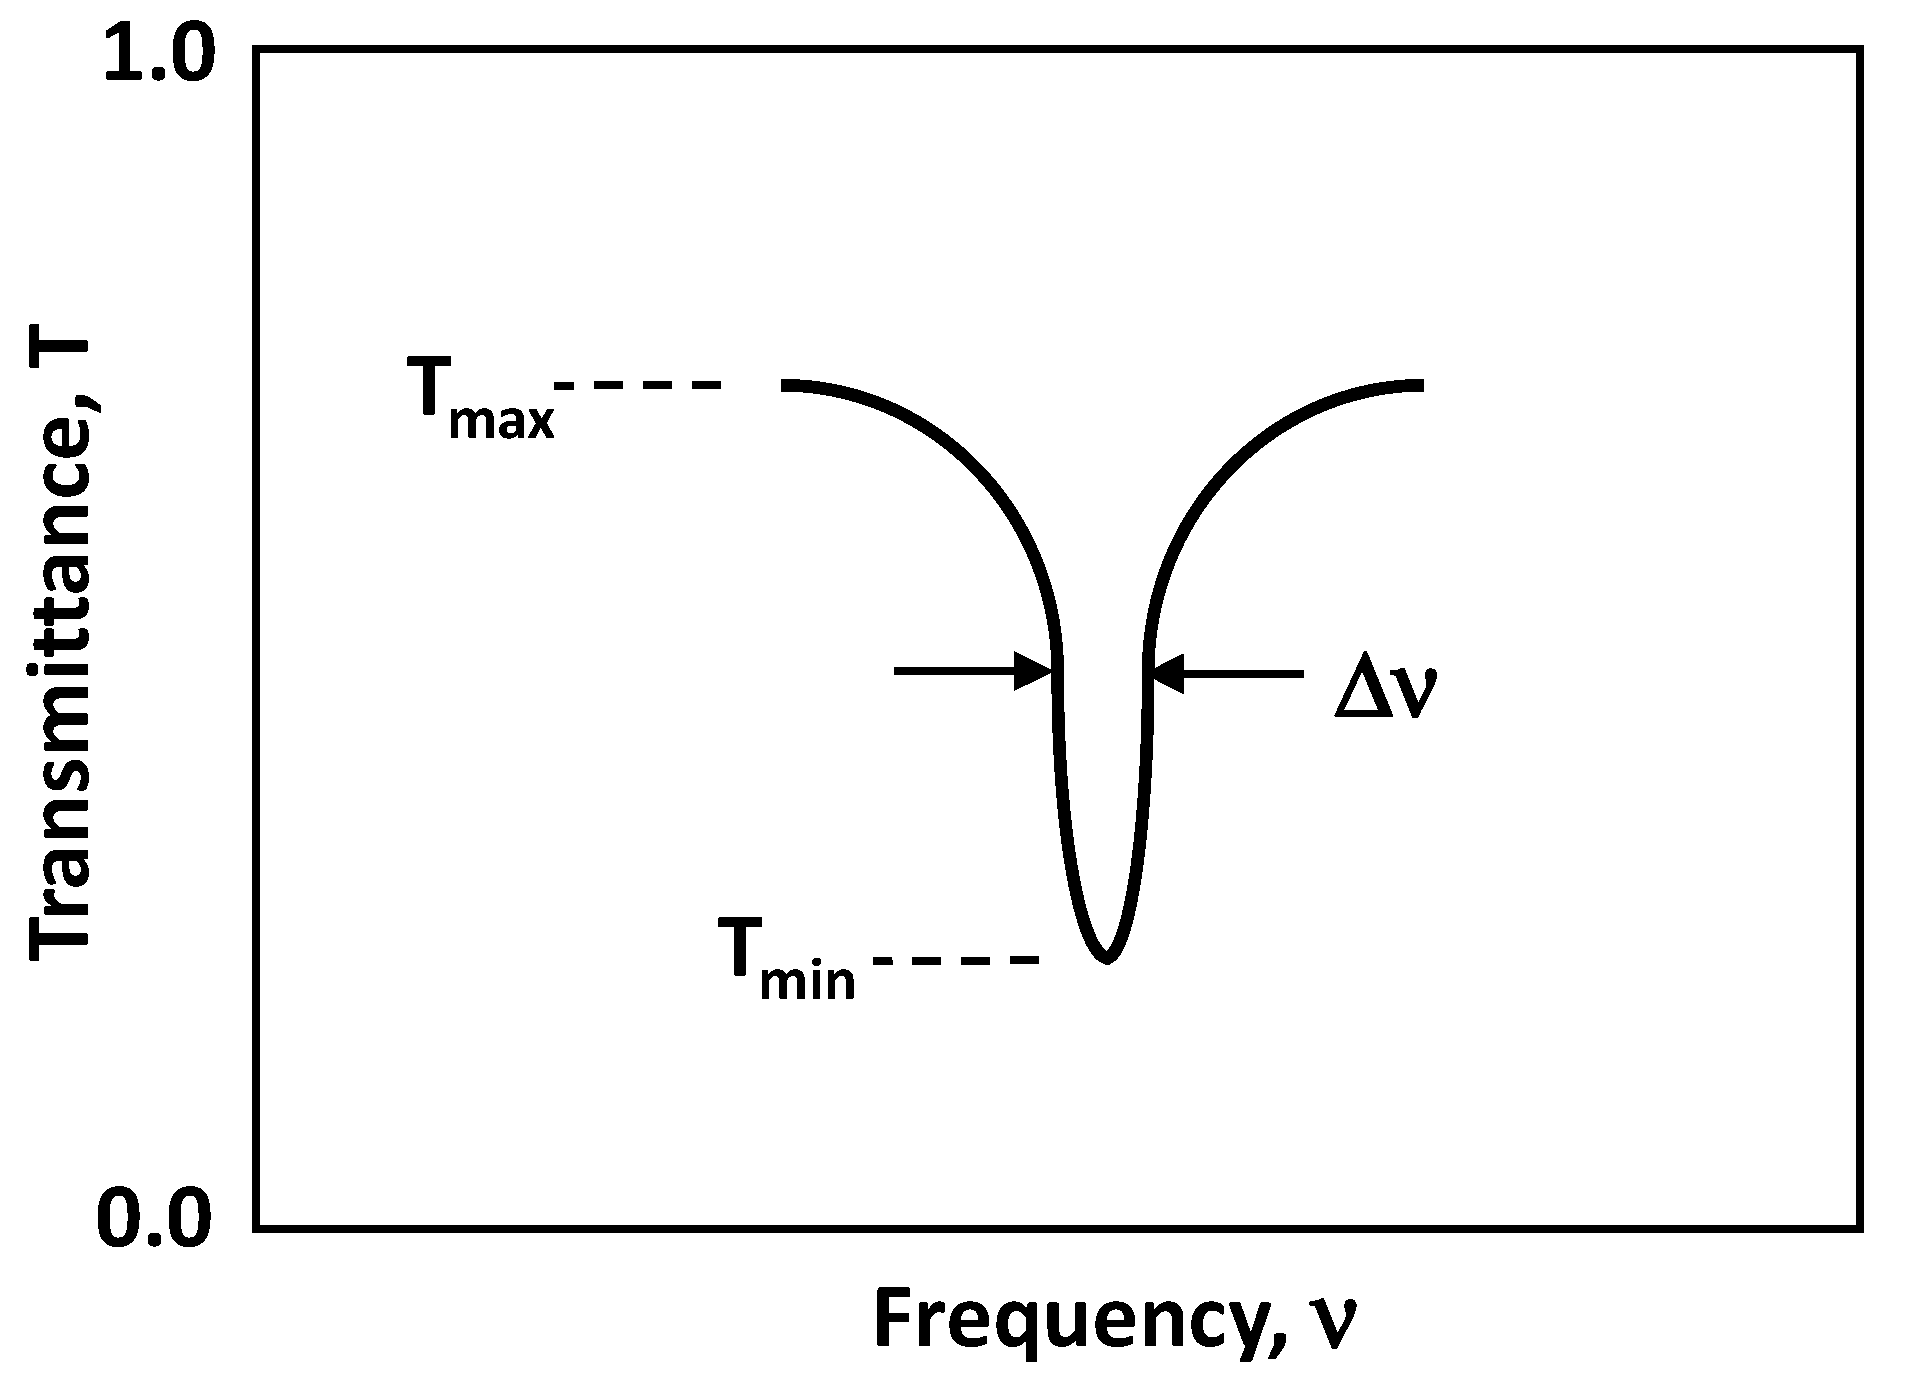
To quantify the strength of the THz signatures, we calculated the signature absorbance AS, the frequency width Δν, and the quality factor QS, all from the experimental transmittance data, and as displayed graphically in Figure 3. As often occurs in the spectroscopy of solid matter, the signature of interest is embedded in broadband attenuation arising from some other mechanism, be it absorption or scattering. Our experience is that all biological samples, liquid or solid, display this behavior. Thus, we calculated AS through the ratio of the minimum Tmin to maximum Tmax transmittance, Tmin measured at the signature center frequency ν0, and Tmax being measured just outside, but not including the broadband attenuation. This leads to the signature absorbance AS ≡ Amin − Amax = −log10[Tmin/Tmax]. By convention, the signature width is defined by the full width at half-maximum (FWHM), Δν, in the present case defined halfway between Tmin and Tmax, as displayed in Figure 3. The signature quality factor is just QS = (ν0/Δν), again following convention.
Because we are concerned with the signatures of biomolecules in aqueous solutions, the effect of liquid (“bulk”) water cannot be ignored. As is well known, it displays a strong absorption in the THz region, with absorption coefficient α well described by the double-Debye model [22]. At room temperature, this model predicts an increasing α with frequency, and between ≈150 and 200 cm−1 from 500 to 1000 GHz—the range of primary interest in the present research. Salinity increases α somewhat, but not dramatically [23], so α = 200 cm−1 is a good rule of thumb in this range. Consistent with electromagnetic wave propagation, the transmittance through our h = 600 nm-height nanochannels should then be given by T = exp(−α∙ h) = 0.988, or an absorbance A = −log10(T) = 5.2 × 10⁻³. As we shall see next, many of the nucleic acid signature absorbances reported here are all much greater than this, making the effect of bulk water absorption insignificant by comparison.
3. Experimental Results
The experimental procedure consisted of first mounting the chip with a precision (dovetail) rail that enabled its precise and repeatable positioning in and out of the beam path of the THz spectrometer. The next step was obtaining the “background” power spectrum, with the chip nanochannels pre-wet by the TPE buffer solution. The pre-wetting was carried out by depositing a ~100-μL drop of buffer in the chip reservoir, and then waiting about 20 min, which was the typical time required for the channels to fill. The filling could be observed visibly by a slight darkening of the channel region under test. Then, the same volume of nucleic acid sample was added to the reservoirs, allowed to disperse, and the THz “sample” power spectrum was measured. Finally, the THz beam was blocked to get the “noise floor” power spectrum, and the transmittance was calculated at each frequency using Equation (1). The measurement was often repeated to check for reproducibility.
3.1. si-RNA and 50-bp Samples
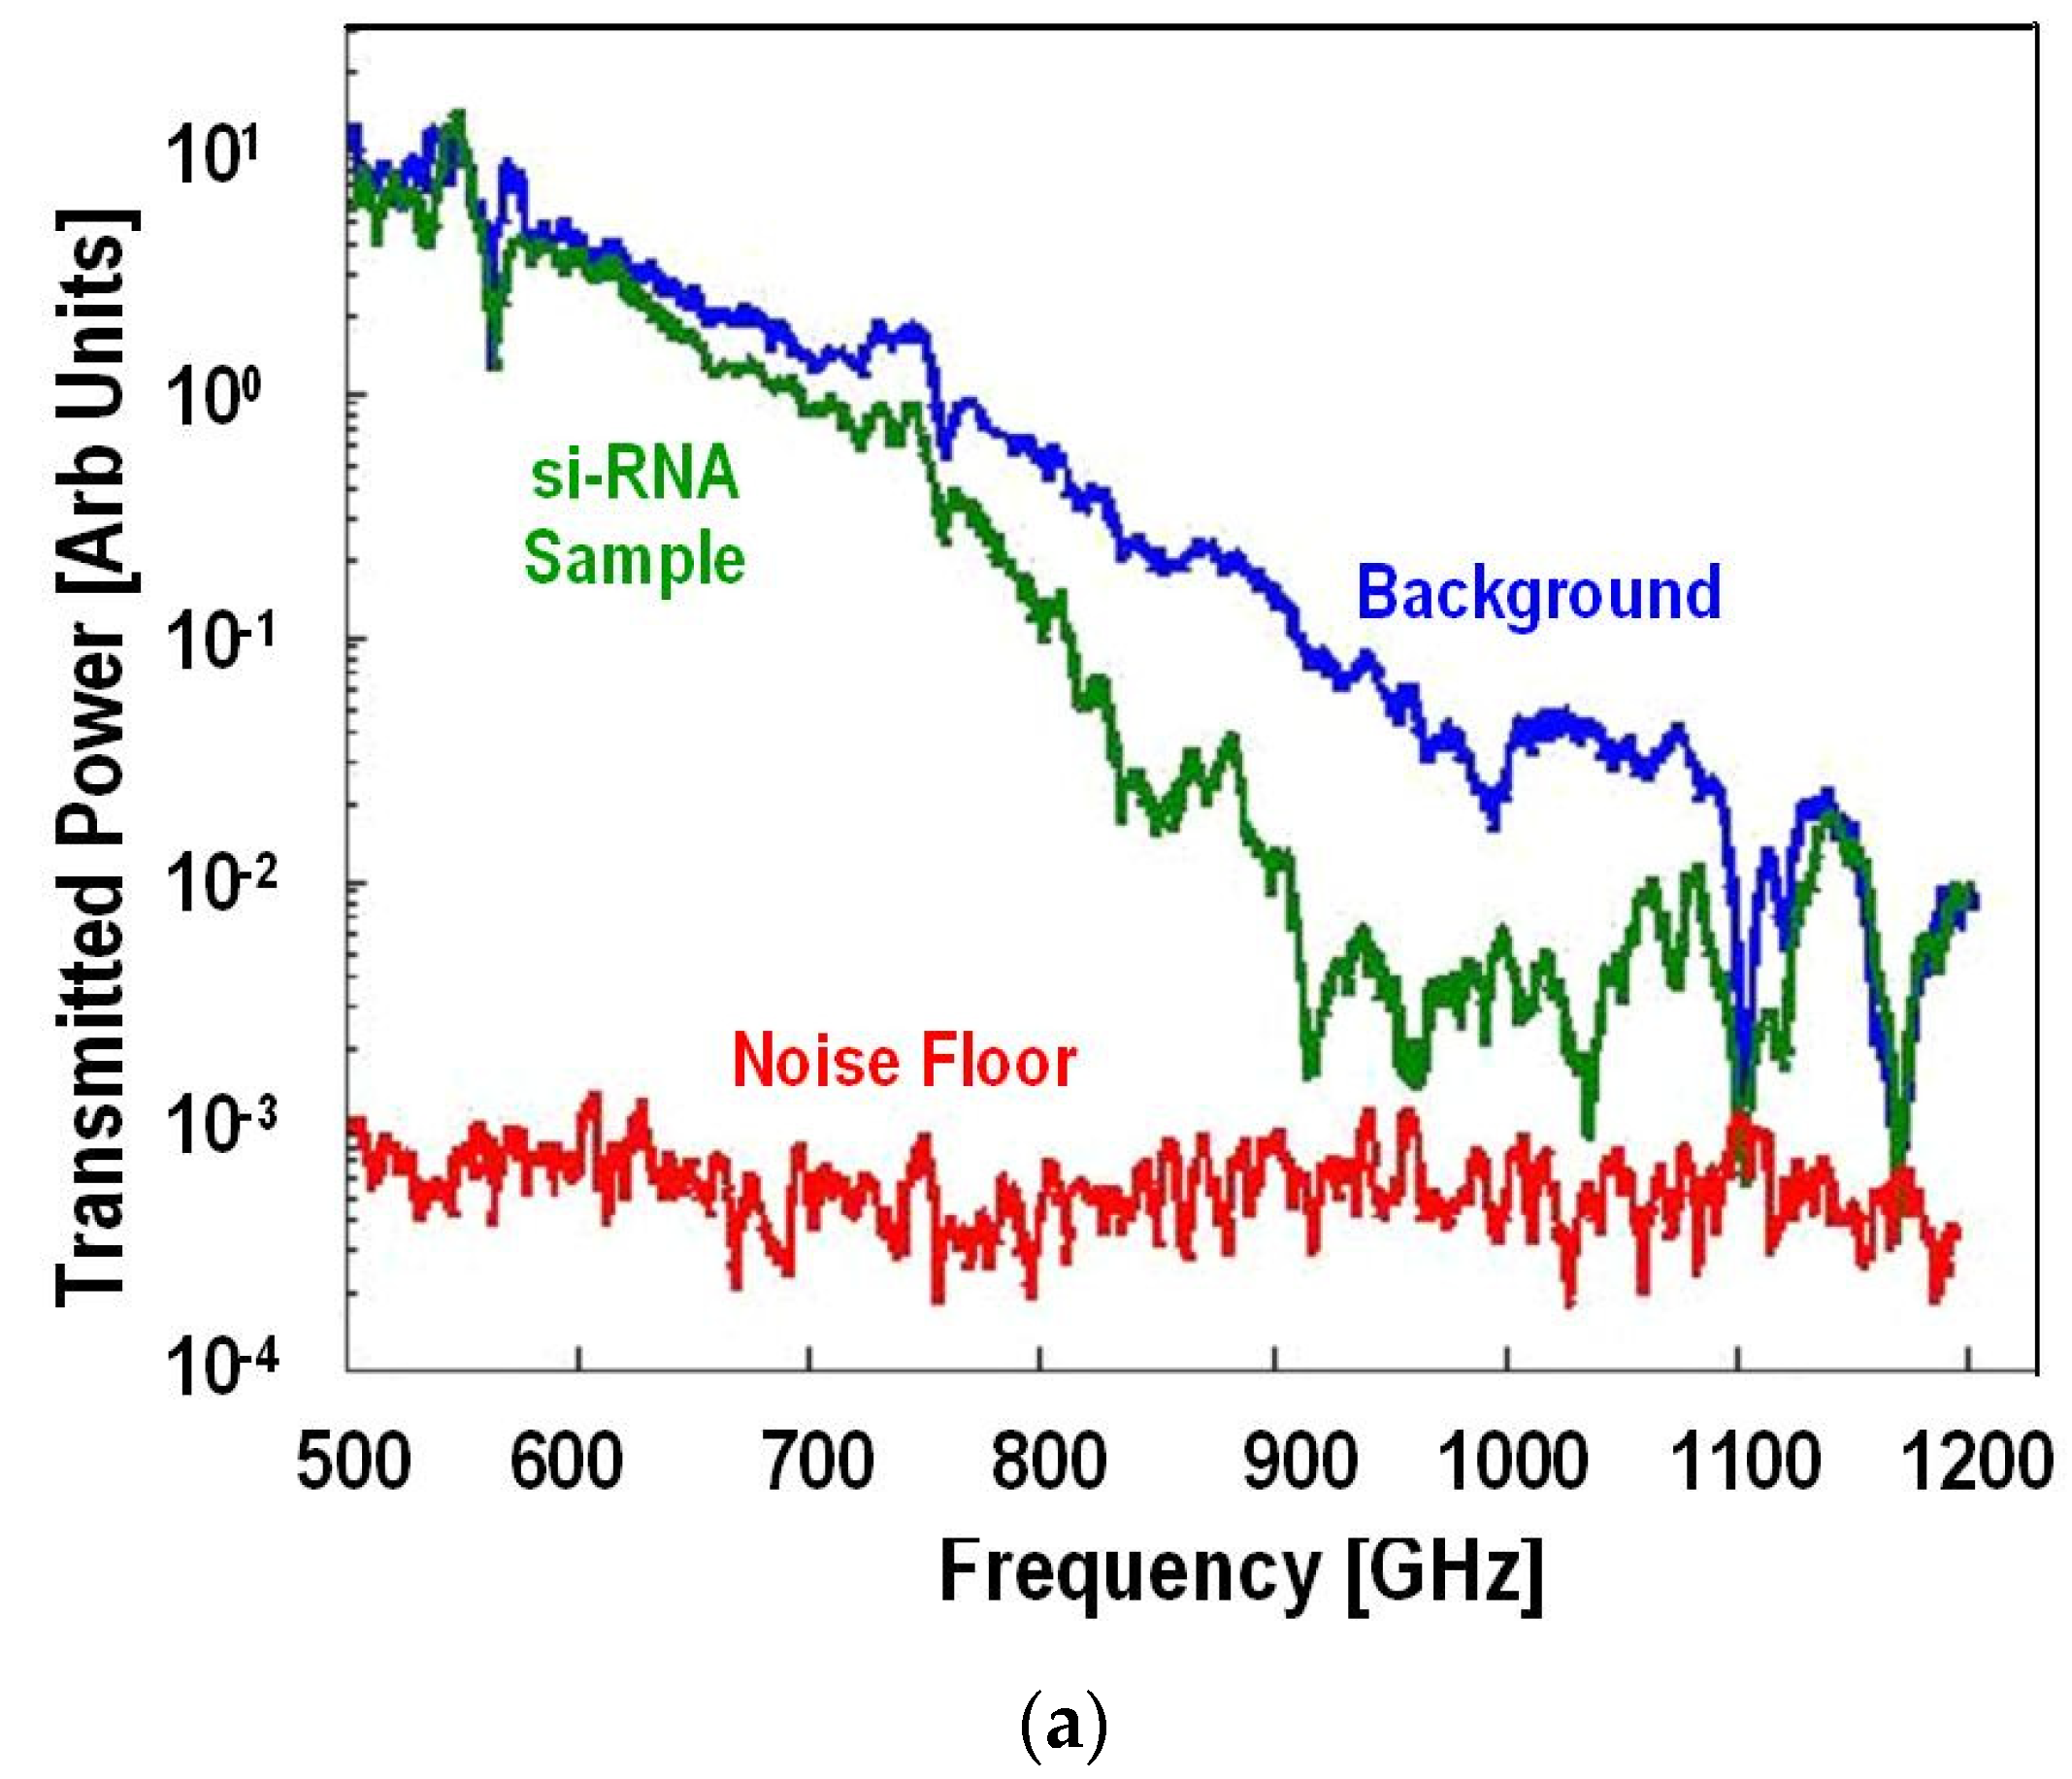
Our first compelling data were obtained with the si-RNA solution described above. The raw experimental results are plotted in Figure 4a in the frequency range 500 to 1200 THz—a band having four strong water vapor lines at 557 and 758 GHz, even stronger lines at 1098 and 1164 GHz, and a relatively weak line around 990 GHz. The top curve is the “background” signal PB through the nanochannels containing buffer solution only, the middle curve is the “sample” signal PS with si-RNA in the channels, and the bottom curve is the noise floor PN obtained by blocking the THz path with a metal plate. There is clearly strong absorption from the si-RNA sample between ~700 and 1050 GHz.
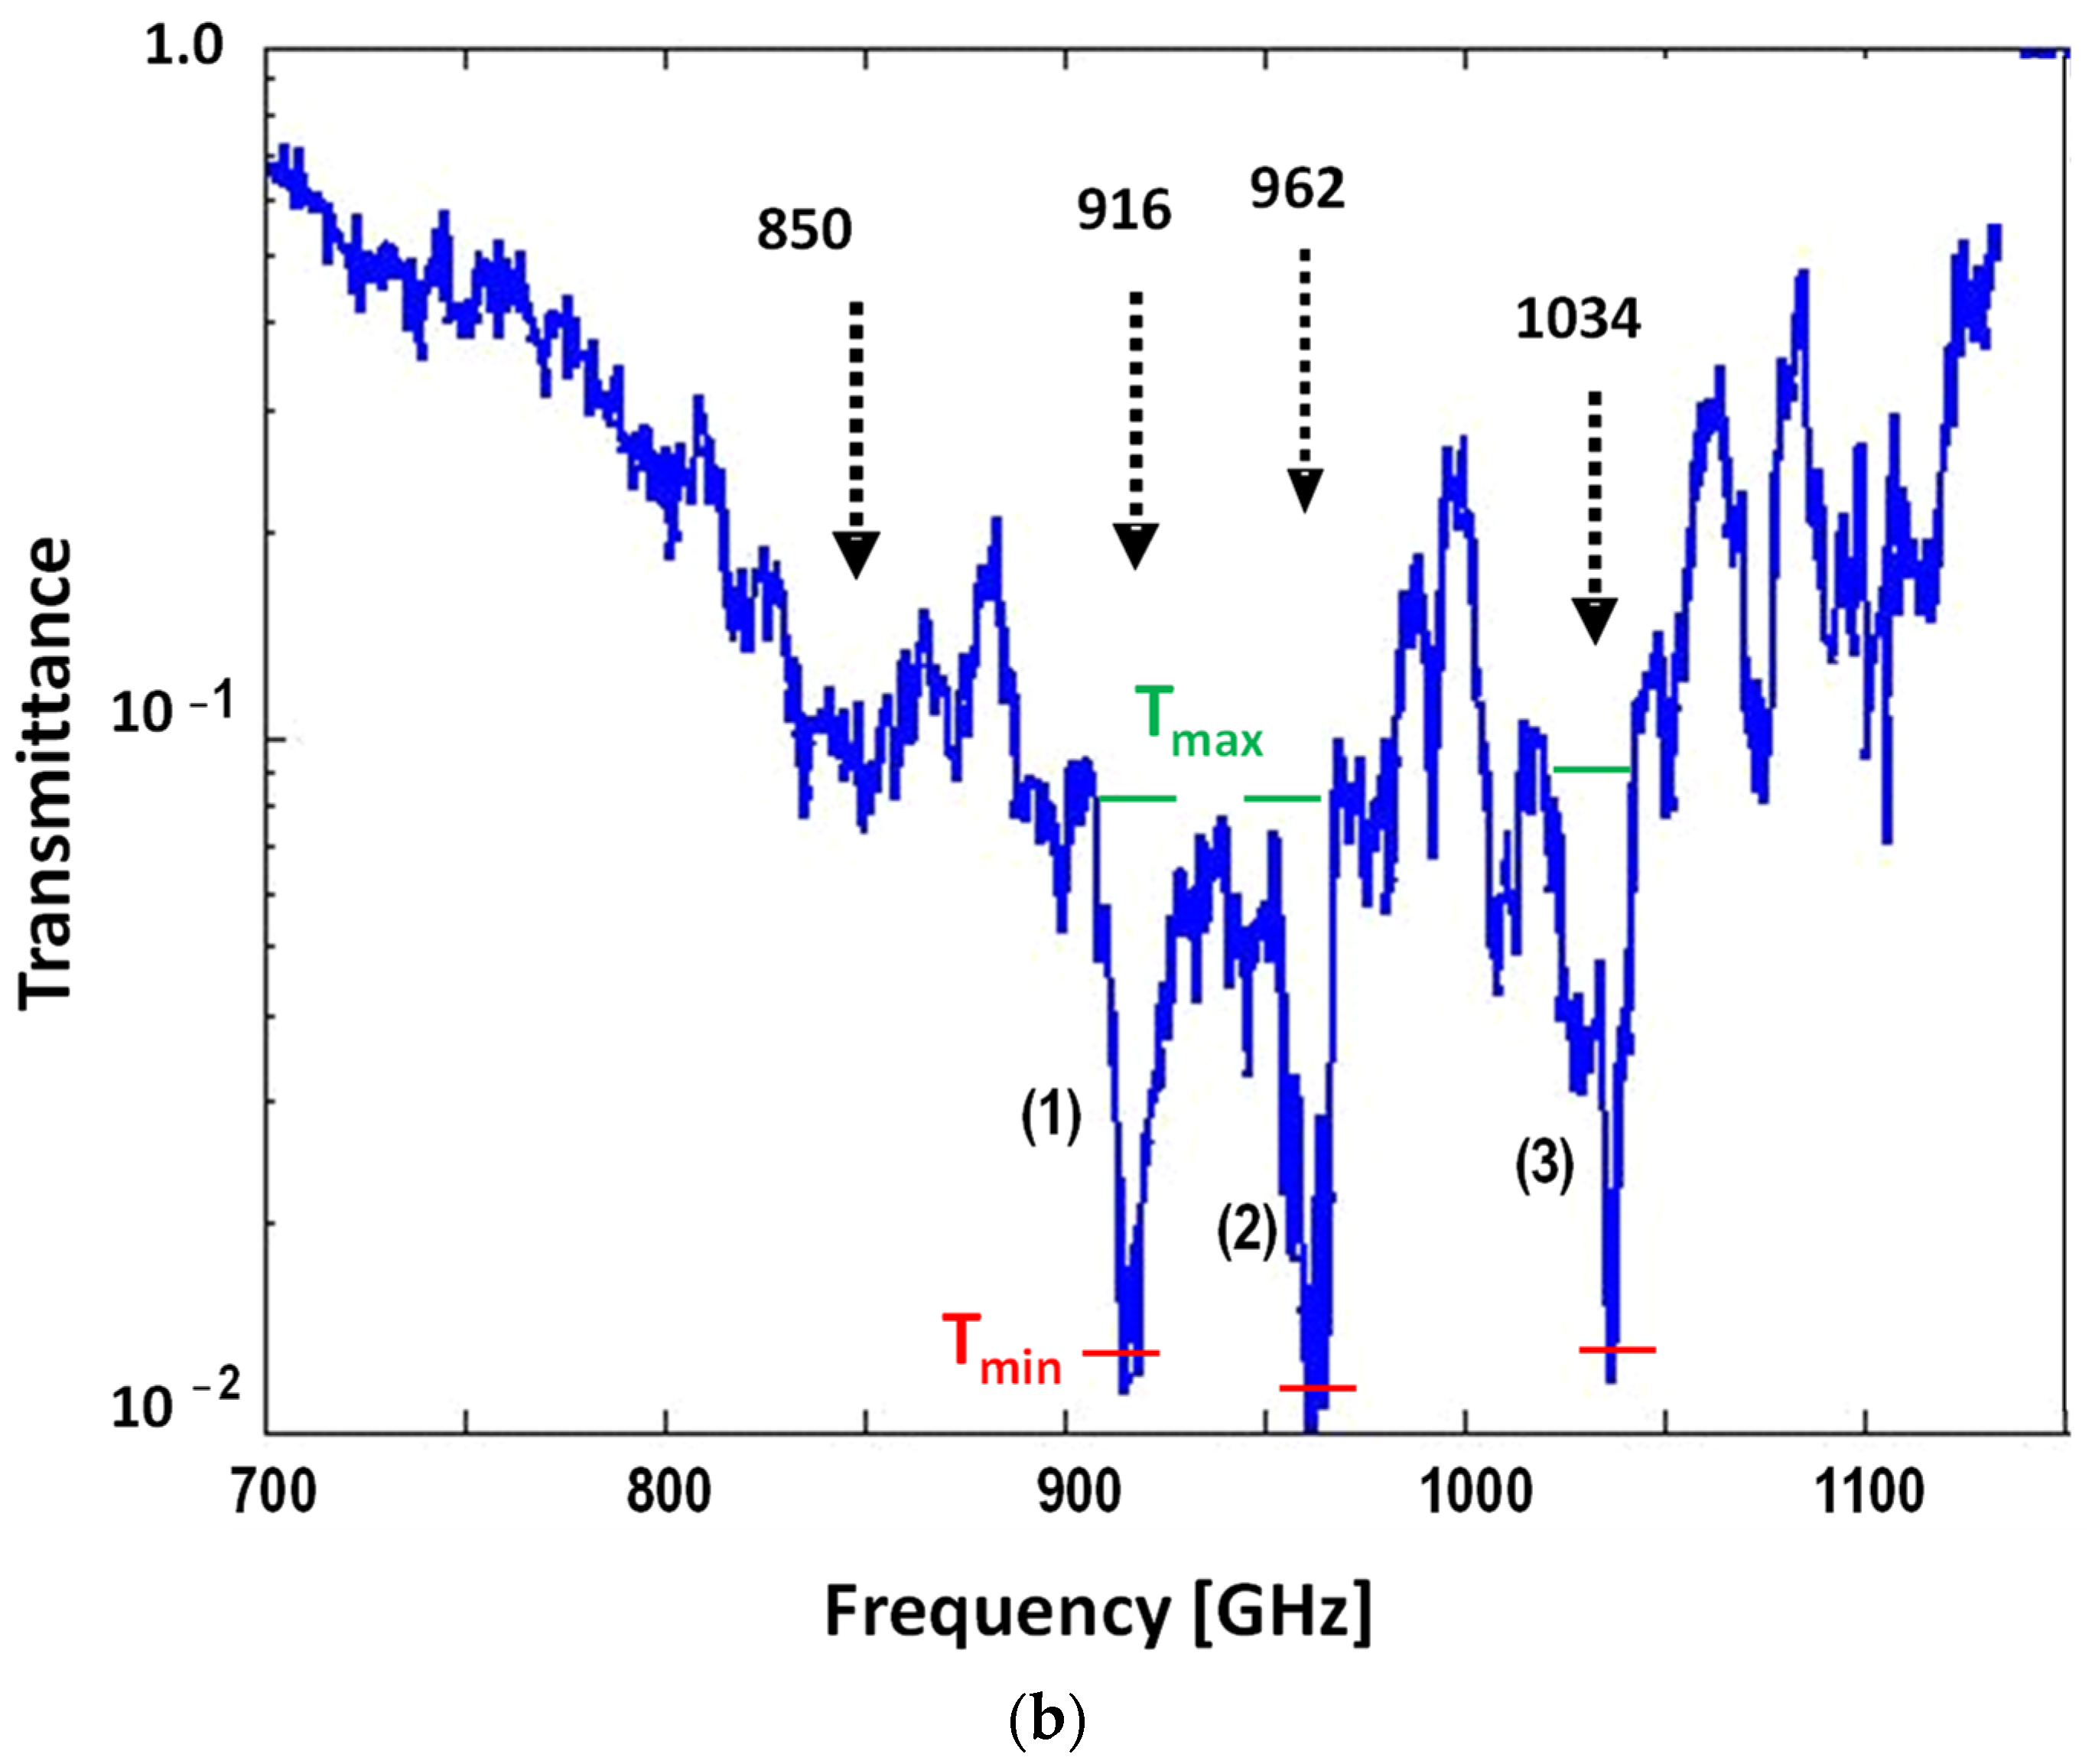
Figure 4b shows the transmittance over this range calculated from Equation (1). The transmittance is a mixture of broadband absorption and three prominent signatures centered at 916, 962, and 1034 GHz, and labeled (1), (2), and (3). There is also a broad and weaker signature between 830 and 875 GHz, and narrow but weaker ones around 1075 and 1100 GHz. The latter two are questionable, since they are convolved with strong water vapor lines, evident from the background transmission in Figure 4a. This drives both PS and PB into the noise floor, which invalidates the use of Equation (1).
From Figure 4b, we can calculate the signature absorbance AS, linewidth, and quality factor for each qualified signature. The required values of Tmin and Tmax are shown in Figure 4b as red and green horizontal lines, respectively. This leads to AS = 0.82, 0.86, and 0.88 for the ν0 = 916, 962, and 1034 GHz signatures, respectively. The corresponding signature frequency widths are Δν = 10, 10, and 12 GHz, with corresponding quality factors of QS = 92, 96, and 86. All these parameters are listed in Table 1. We note that the Δν values are even narrower than the sharpest THz signatures measured in solid-state samples, such as the 23-GHz width of the 530-GHz line in lactose monohydrate [24].
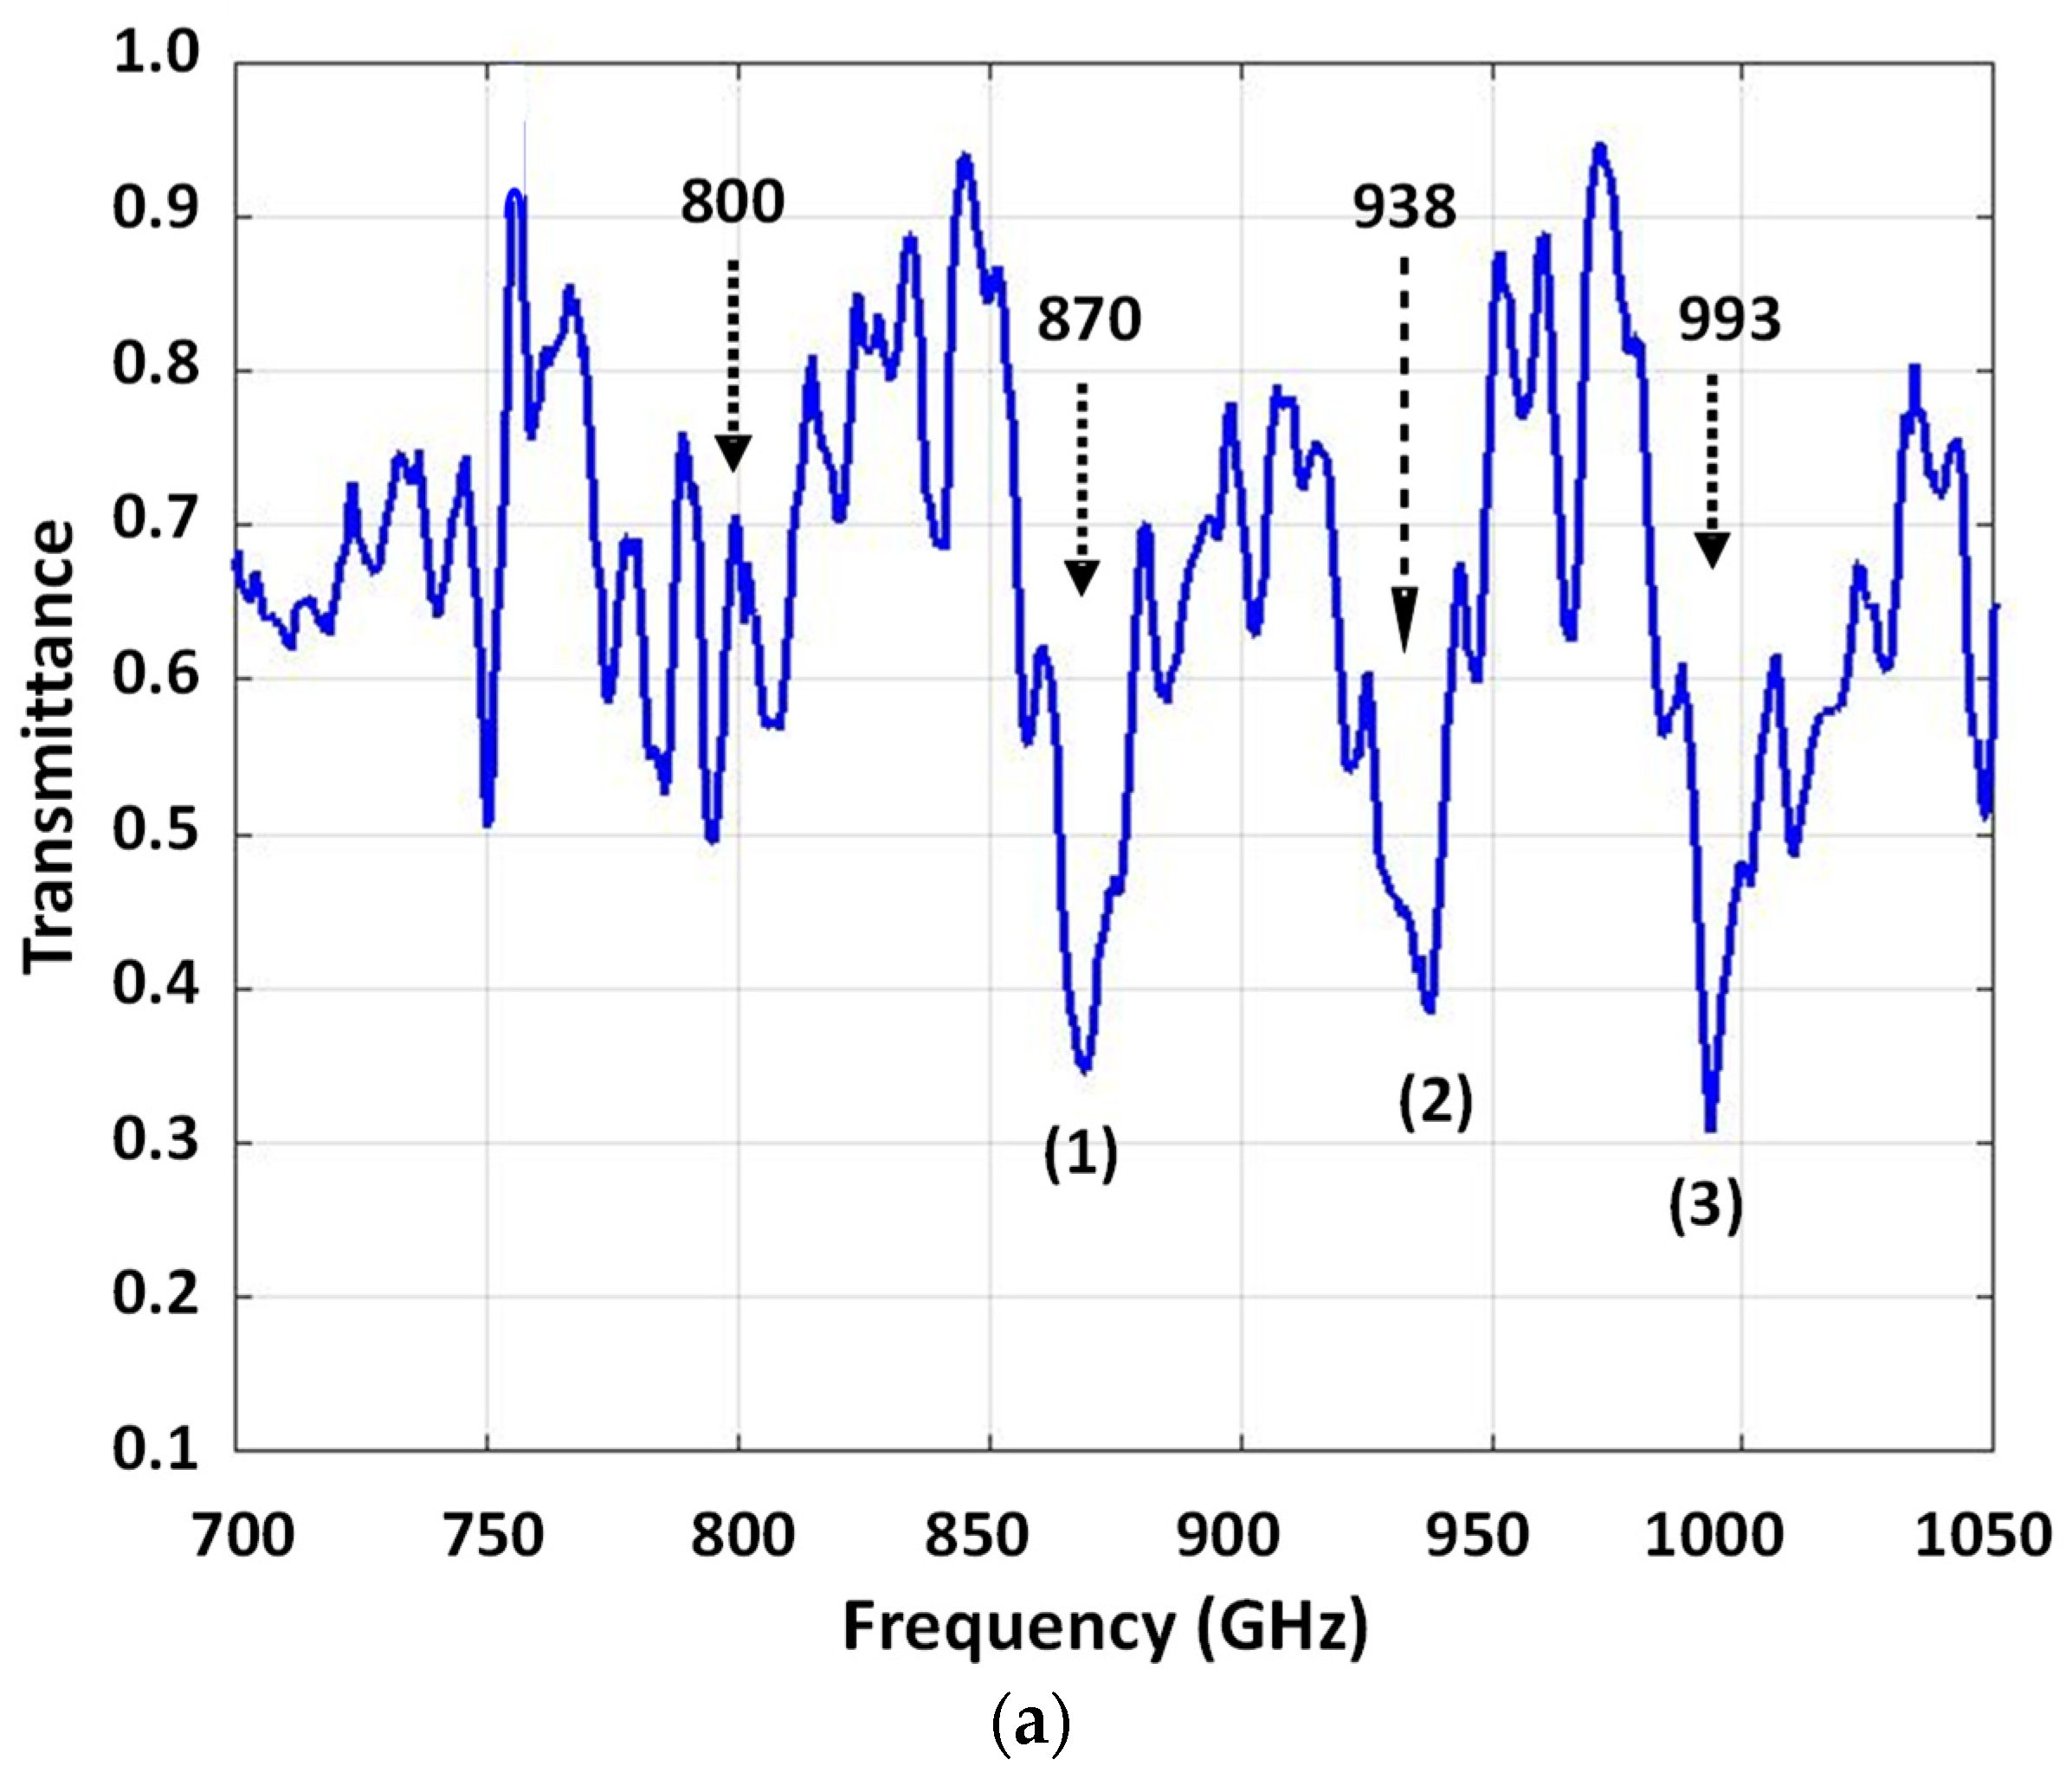
The second sample we investigated was the 50-bp DNA ladder. Like the si-RNA, it displayed no sharp signatures below ~700 GHz, just broadband attenuation, so we restricted the scan from 700–1100 GHz and the transmittance is plotted in Figure 5a. The most obvious effect compared to si-RNA is the much higher transmittance in this frequency range, the broadband average being ~75%. However, three sharp signatures are evident in Figure 5a centered at 870, 938, and 993 GHz, and labelled (1), (2), and (3), respectively, with their spectral parameters listed in Table 1. The 993 GHz signature is the narrowest, displaying a Δν of about 12 GHz, and the other two display Δν ≈ 20 GHz. The signature absorbance of all three is more than 2× below those of the si-RNA sample of Figure 4b, and the Δν is larger, too, such that QS = 58, 59, and 50 for (1), (2), and (3), respectively. All these parameters for the 50-bp DNA are also listed in Table 1.
3.2. 1-kbp and λ-DNA Samples
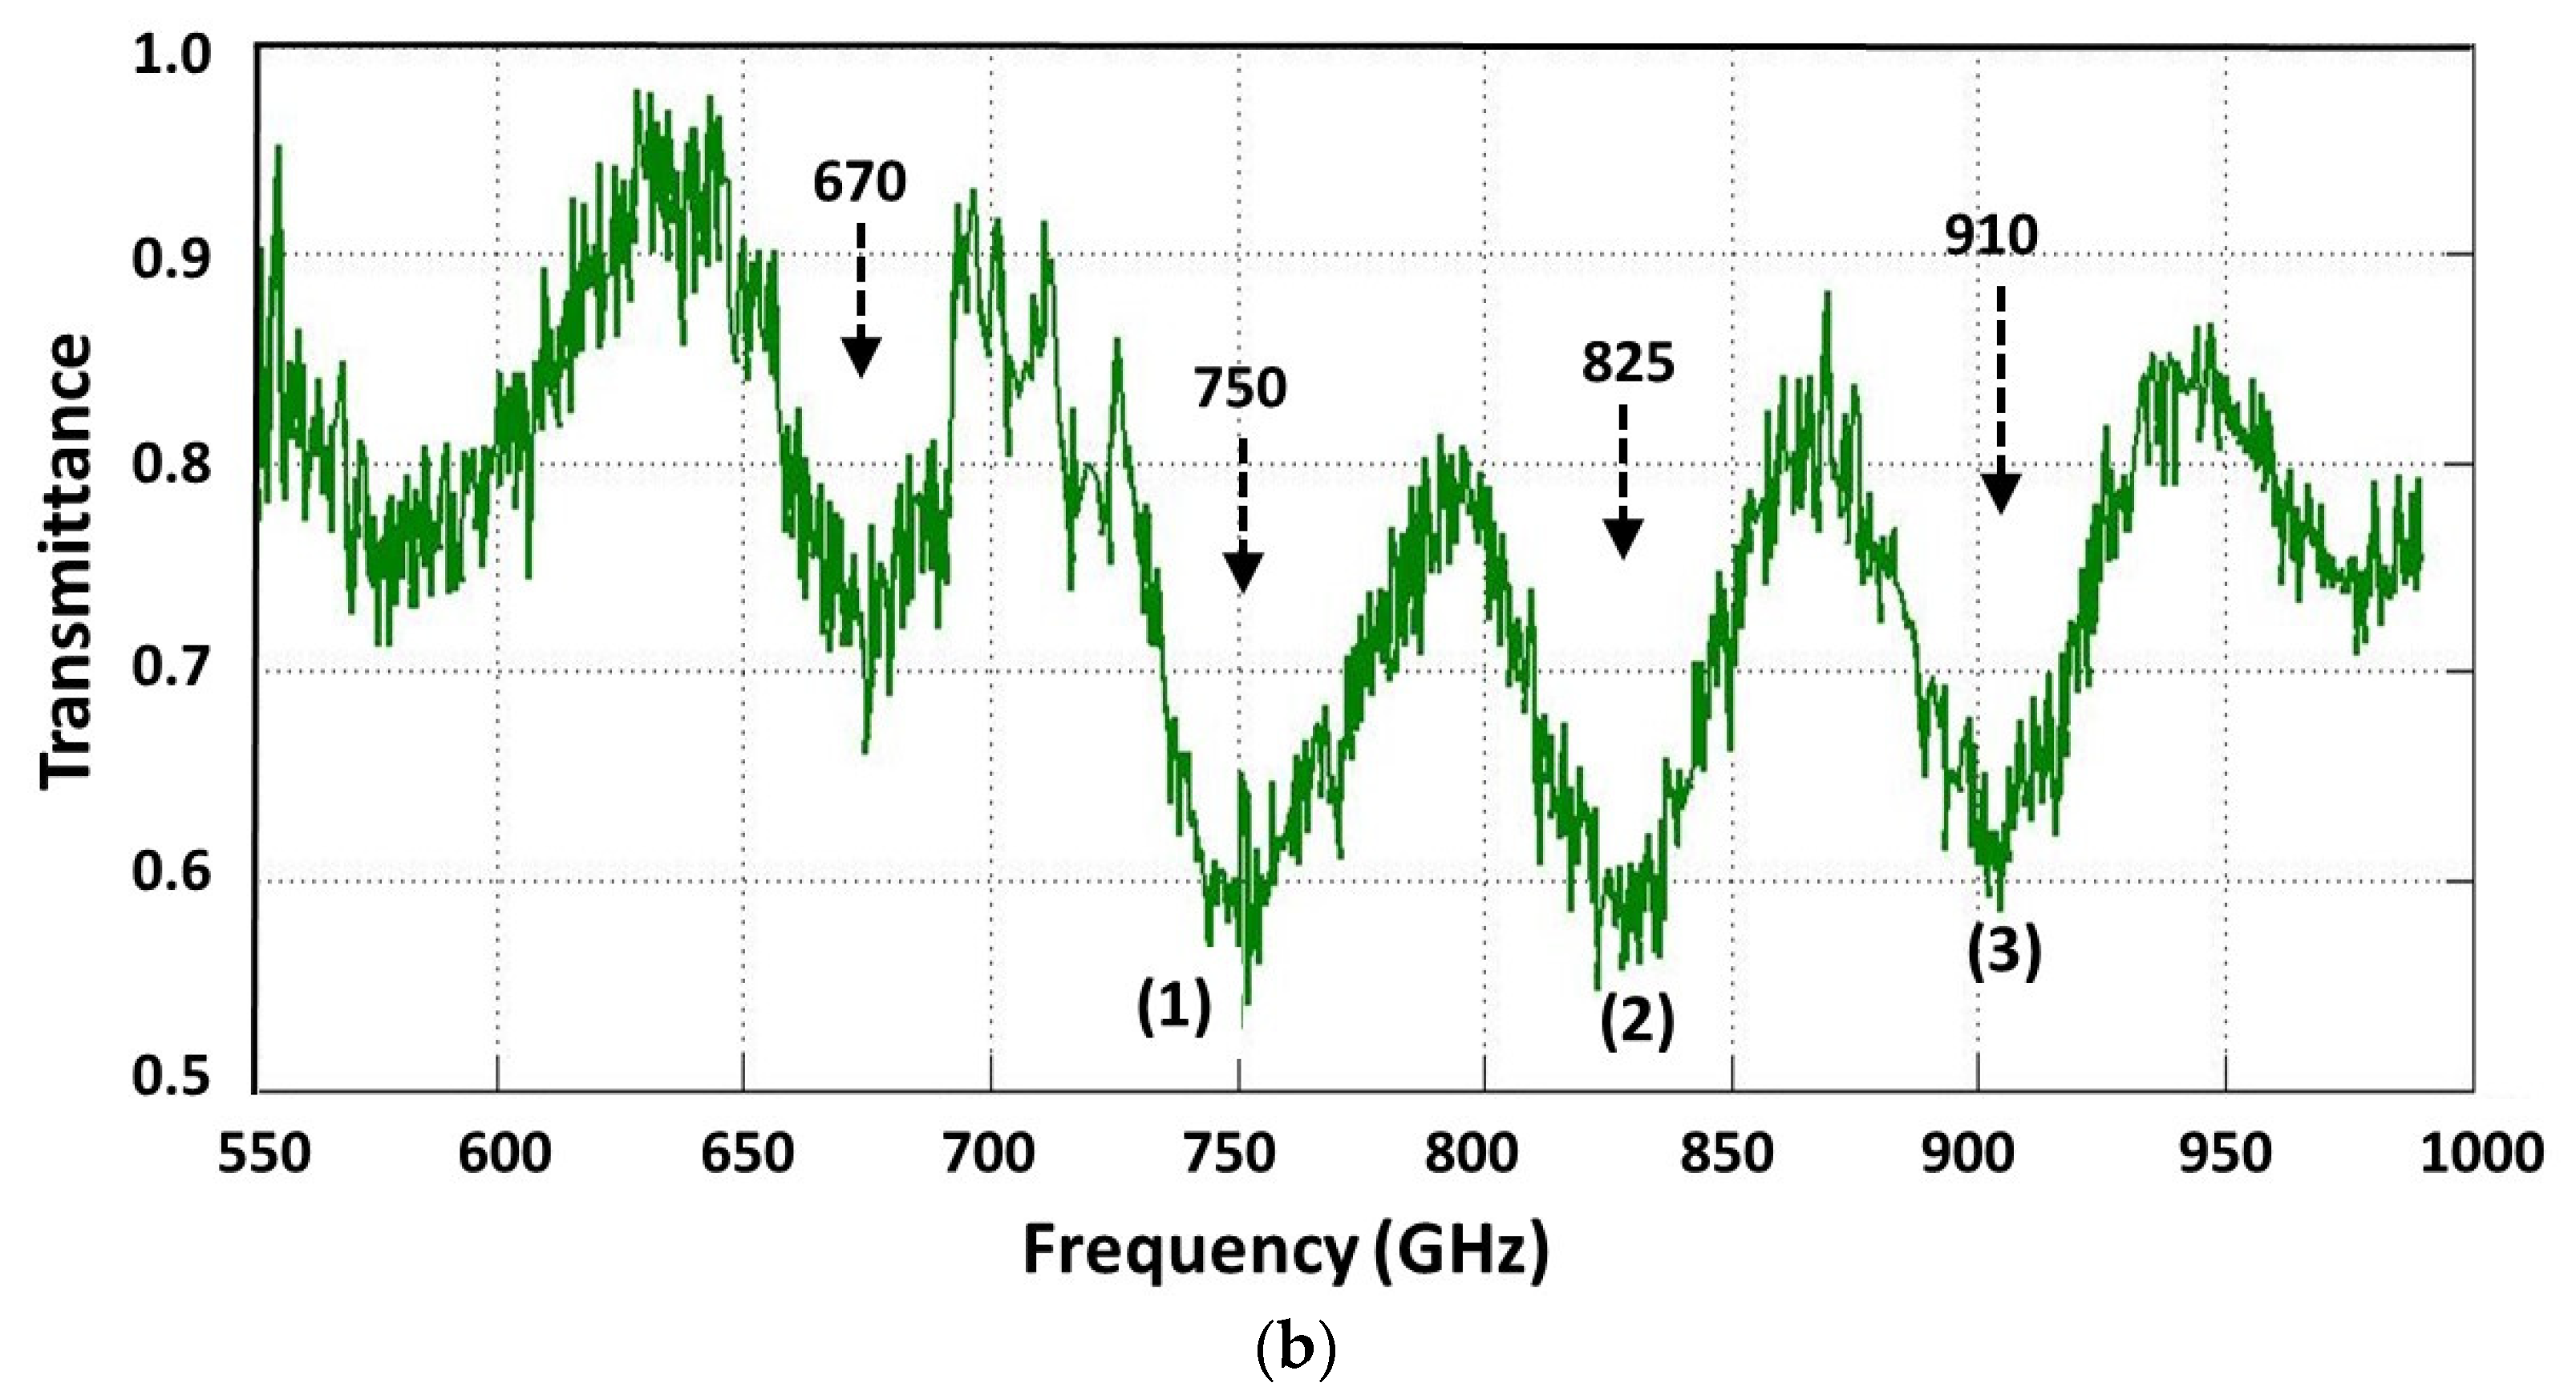
The character of the THz transmittance changed significantly with the measurement of the larger DNA samples: the 1-kbp ladder and λ-DNA. The results for the 1-kbp ladder sample are shown in Figure 5b, and the λ-DNA in Figure 6a over the frequency range 550 to 1000 GHz. Although not as strong as the prominent signatures in the smaller molecule samples, there are still three signatures in Figure 5b significantly deeper than the others, labelled (1), (2), and (3), and centered at frequencies of ν0 = 750, 825, and 910 GHz, respectively. The QS (As) values of these three are 23, 28, and 28 GHz (0.13, 0.12, and 0.12), respectively, as listed along with the other parameters in Table 2.
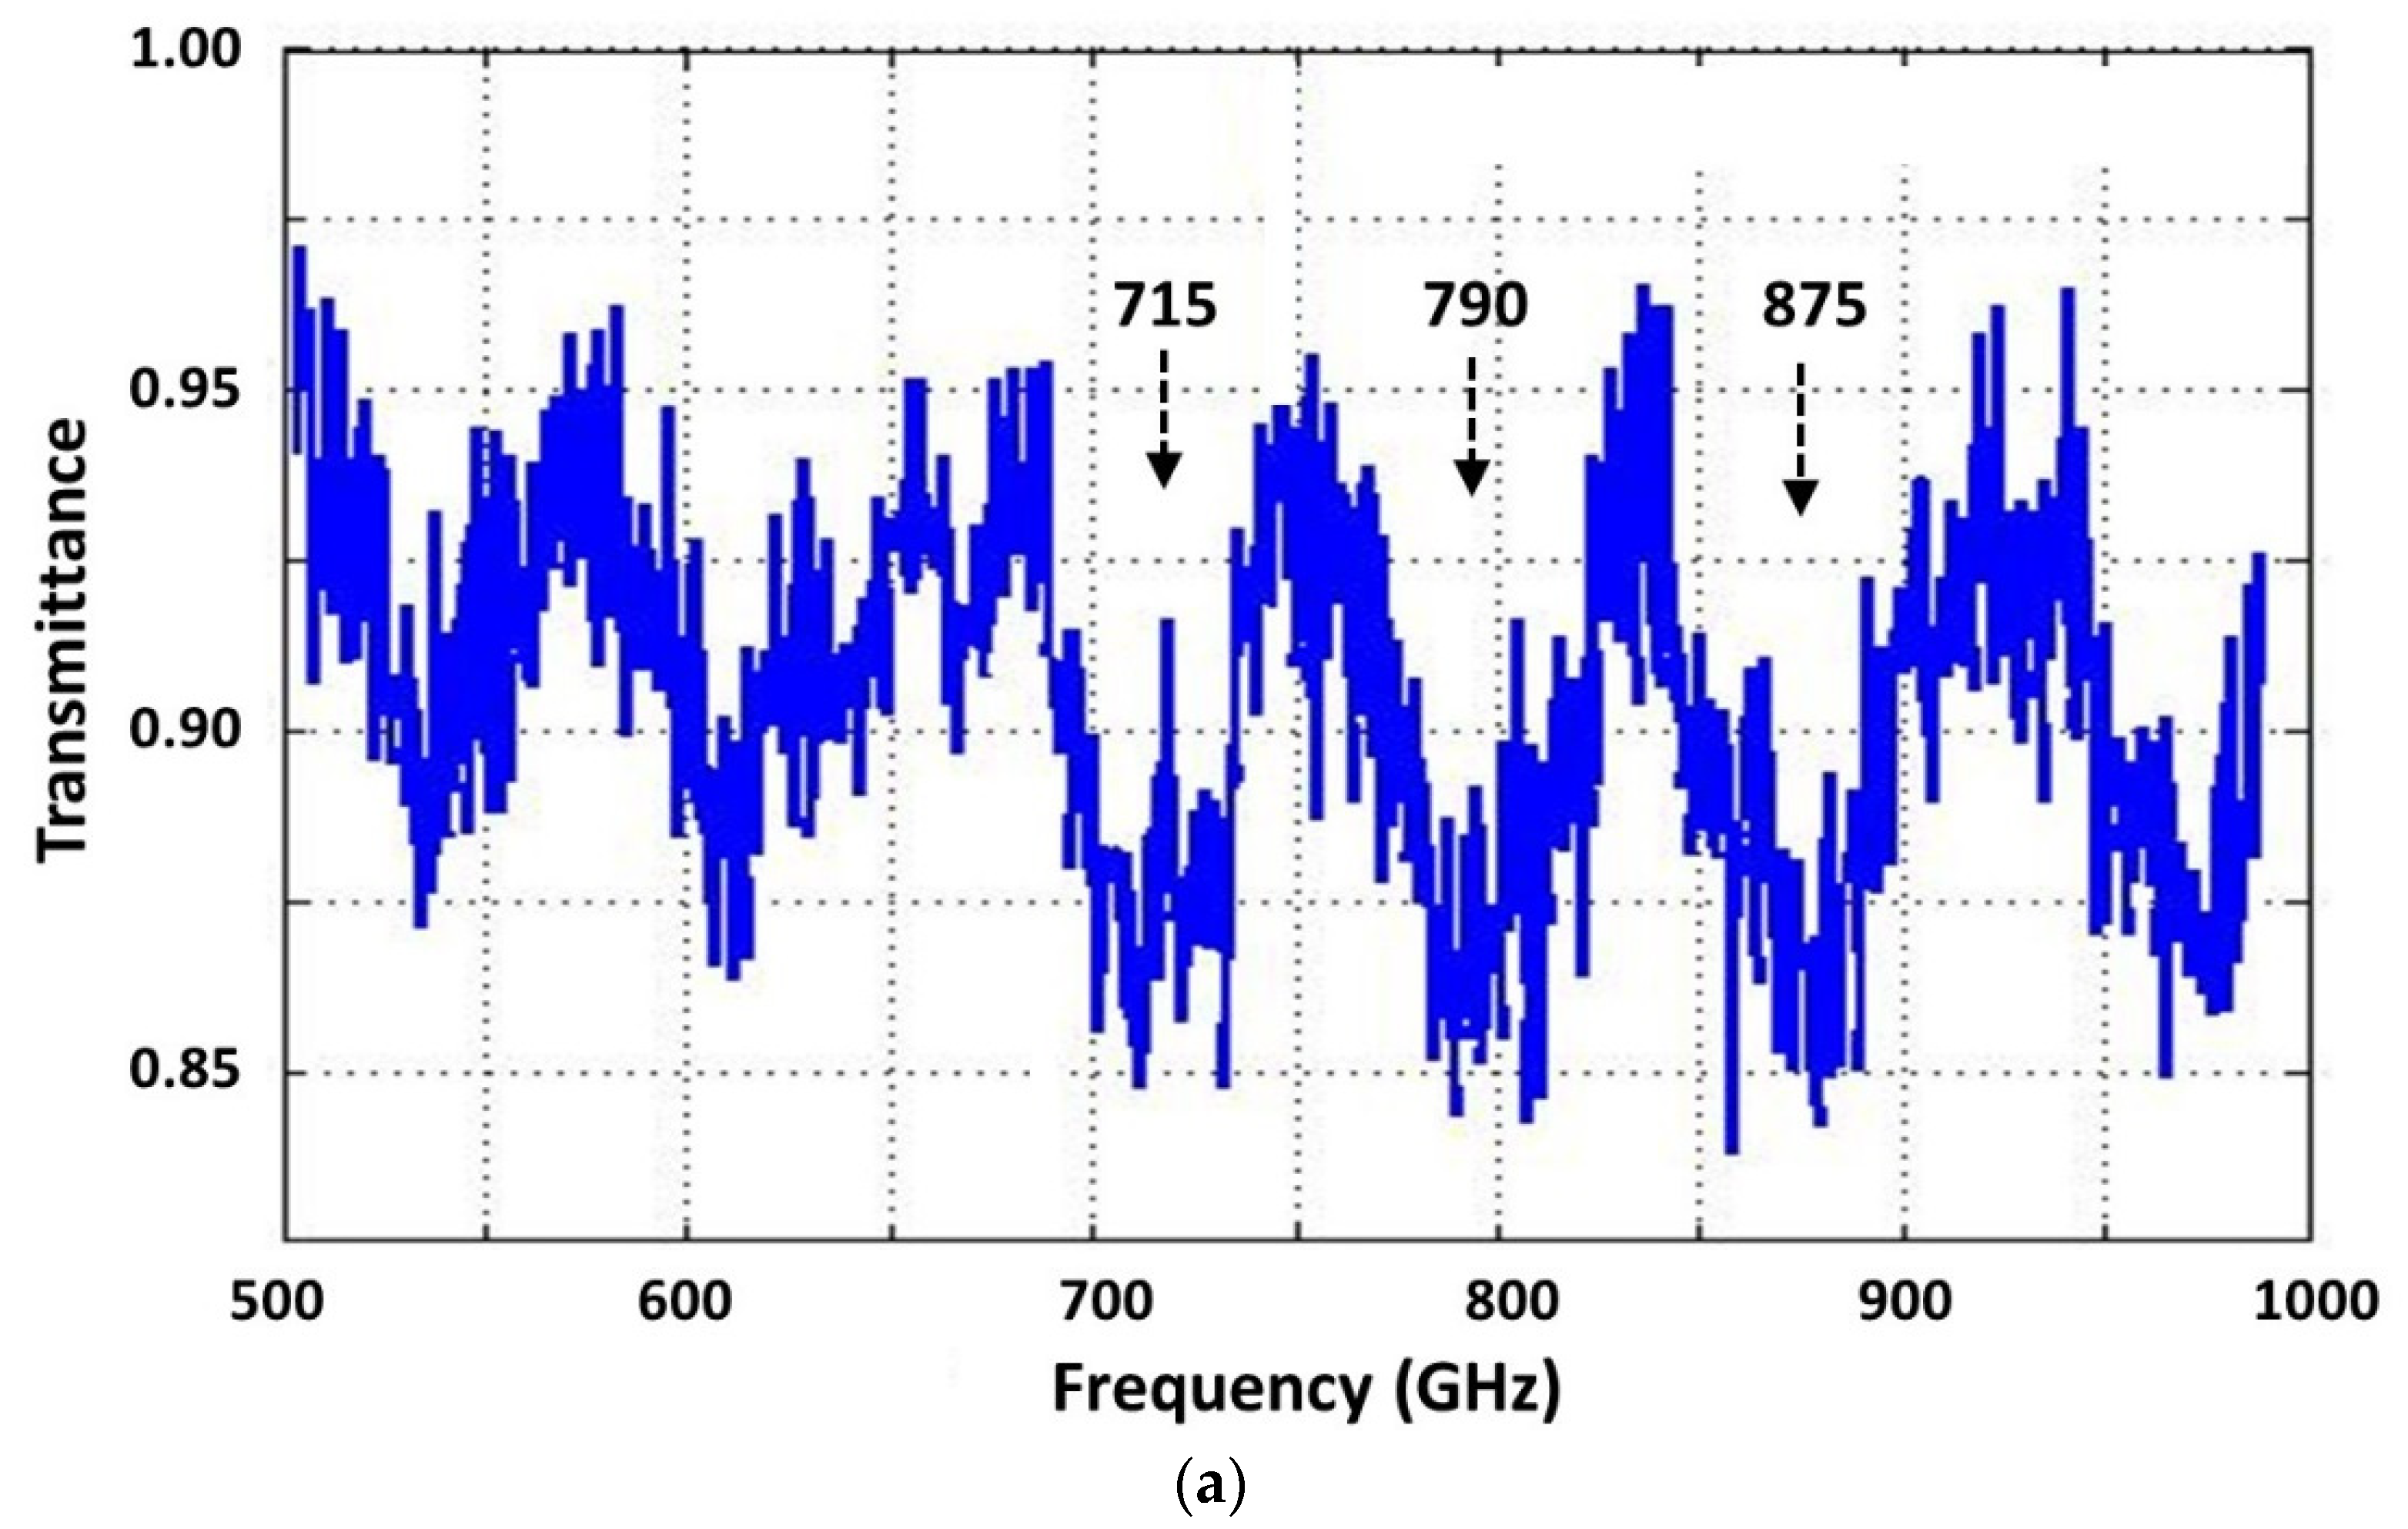
For the λ-DNA of Figure 6a, there are no prominent signatures, but instead a quasi-sinusoidal behavior with a peak-to-trough transmittance difference of only 0.1. The increased noisiness in Figure 6a compared to the previous transmittance plots is mostly attributed to the magnified vertical scale. Because the peak-to-peak frequency separation is comparable to what is expected for longitudinal modes in the fused quartz substrate (etalon), the λ-DNA sample is likely just displaying broadband absorption modulated by an etalon transmittance. Because of this interpretation, there is no listing of signature parameters in Table 1 and Table 2.
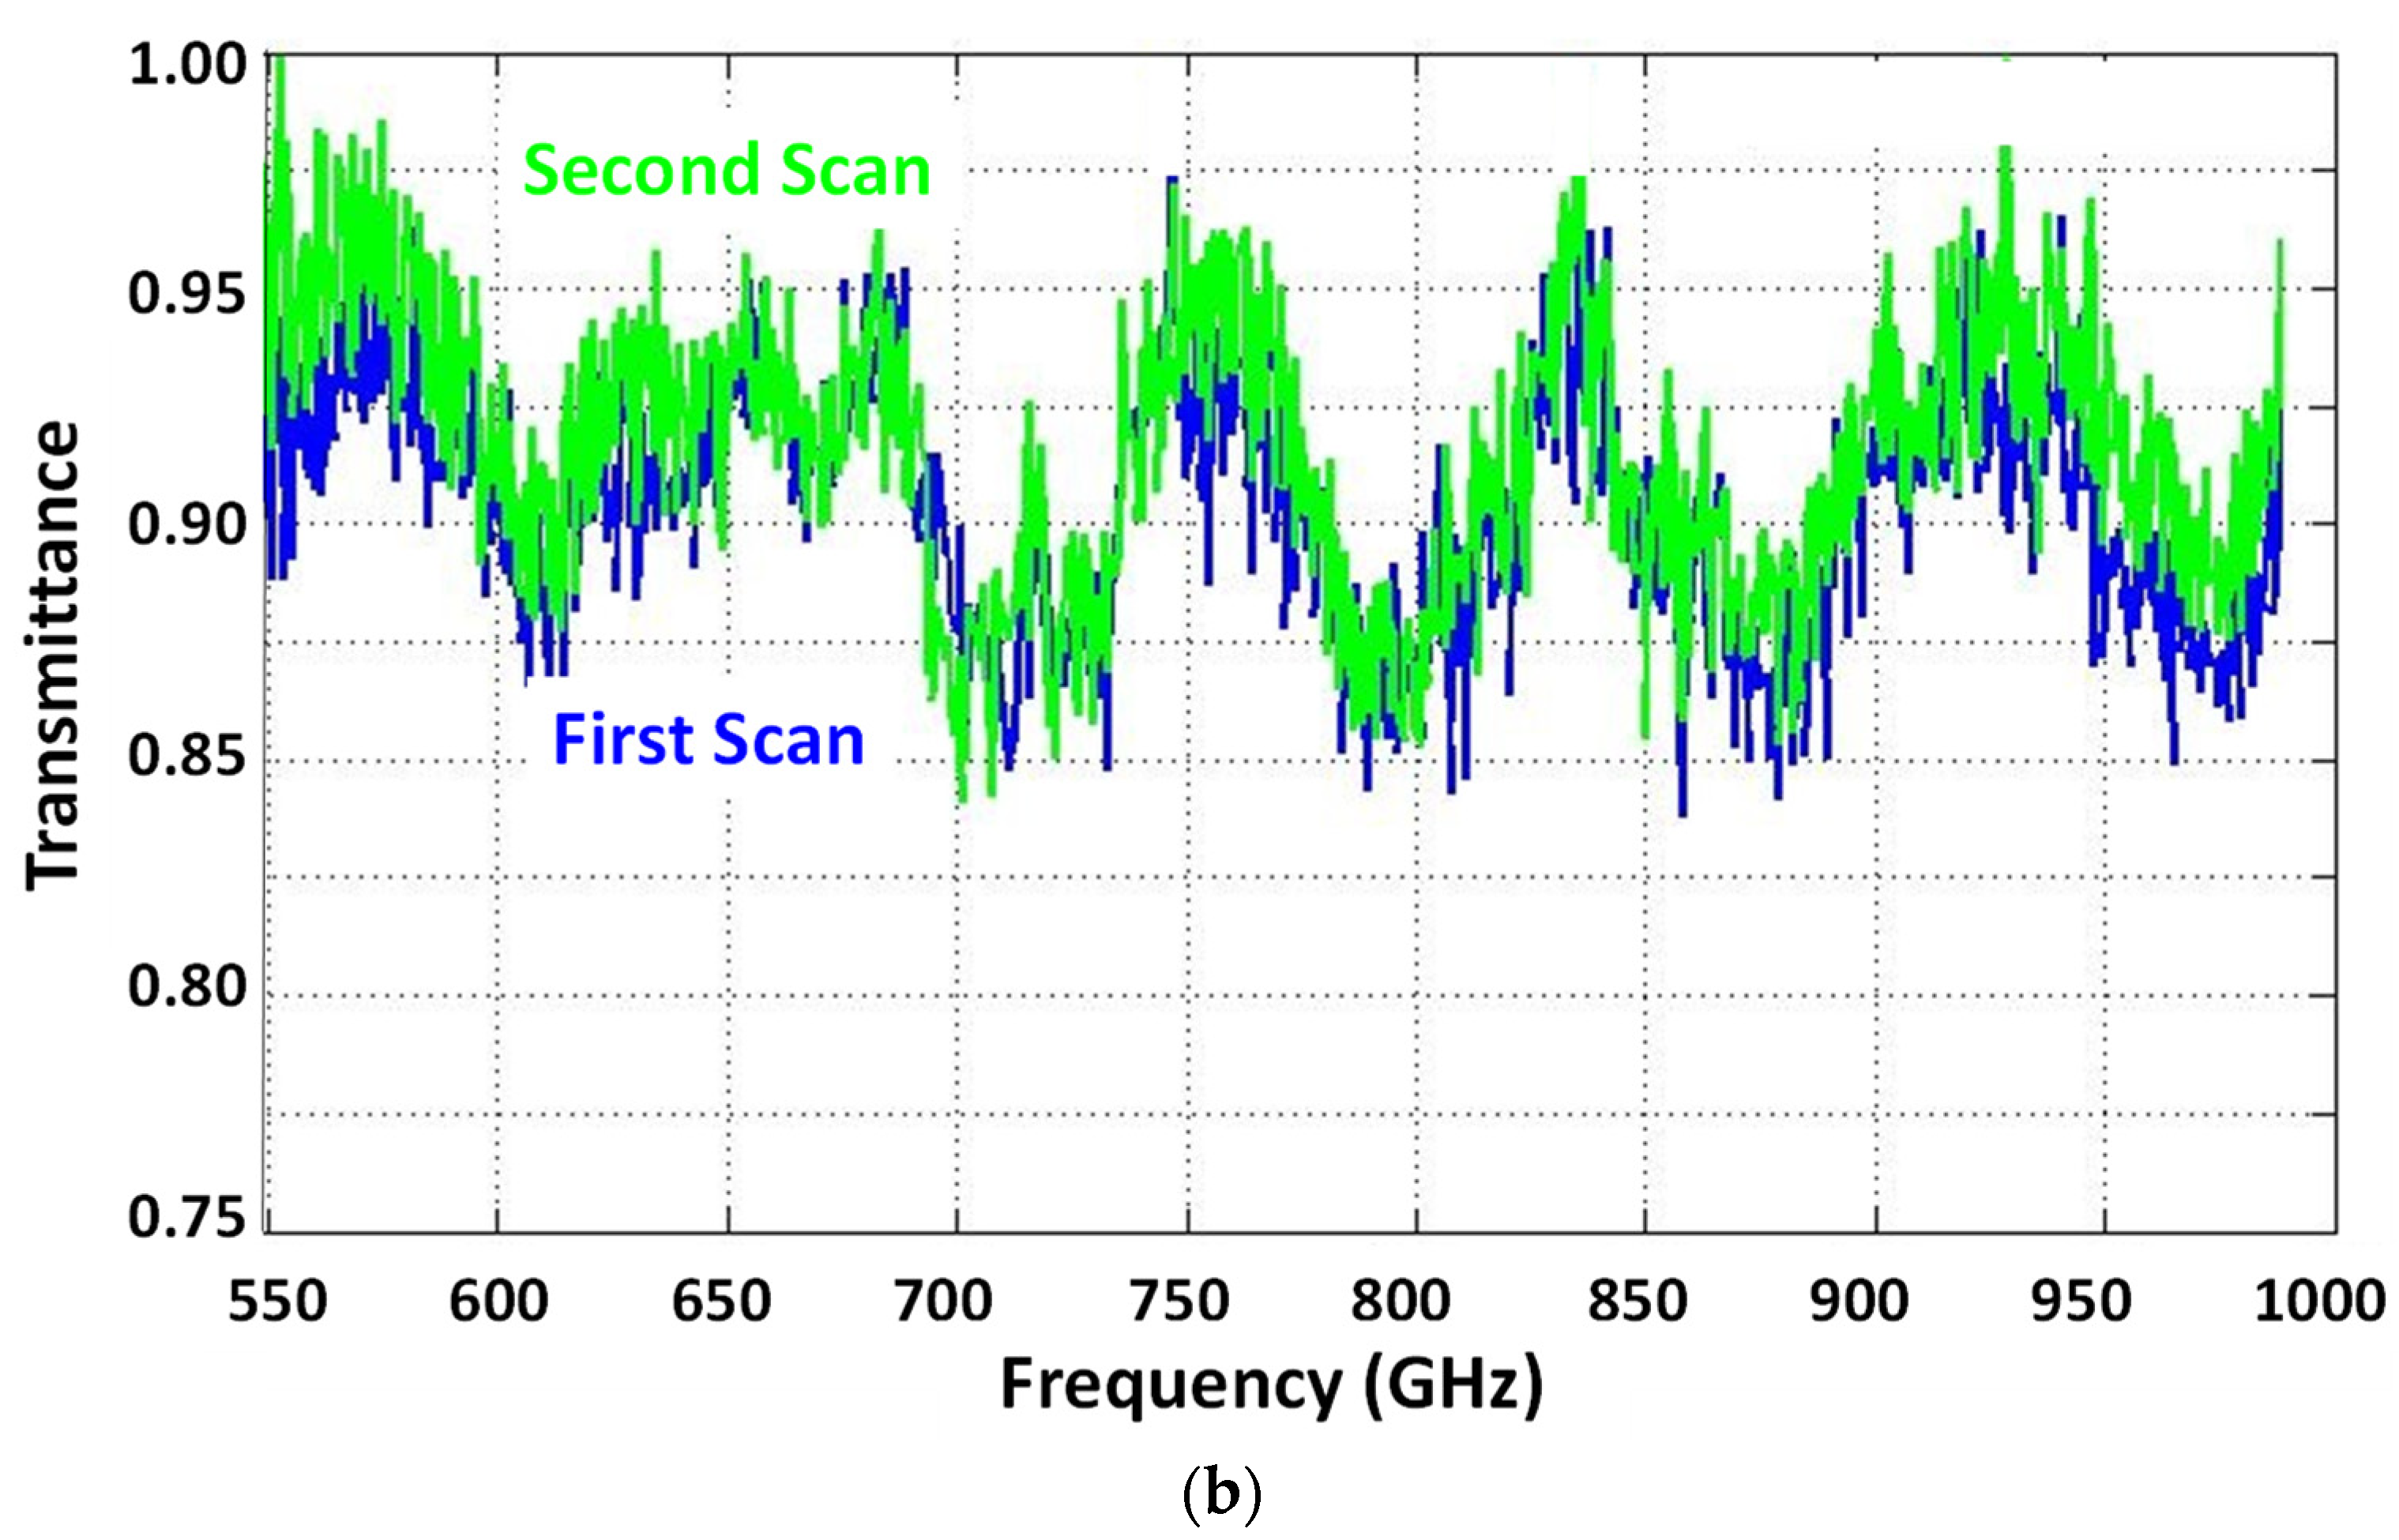
However, since the λ-DNA sample approached the lower limits of the signature strength necessary for confident detection, it also provided an opportunity to study reproducibility. At the signal-to-noise ratios of our spectrometer, reproducibility would mostly be affected by systematic errors, like drift in the THz signal power, or by variation in the nanochannel fluidics. Figure 6b shows the results of two successive transmission scans with the λ-DNA sample. By averaging over frequency, we found that the variation in transmittance was ~5% across this 550–1000 GHz range.
3.3. Optical Cross-Section and Red Shift
Given the absorbance and the molecular concentration ρm, we can estimate the absorption cross-section per molecule, σm, which is a fundamental physical measure of the strength of the absorption (or scattering) at the molecular (or atomic) scale. We apply the Beer-Lambert law for chemical solutions [25]:
where L is the physical path length through the absorbing medium, i is the molecule-type index, and N is the number of molecular types. For the si-RNA, the 17, 21, and 25-bp species all have nominally equal concentrations so that we can write As ≈ [L/ln(10)] ρm <σm>, where from Table 1 ρm = 2.0 × 1014 cm−3 is the total (50% diluted) concentration including all three species, <σm> is the average cross-section, and L ≈ h = 0.6 μm, where h is the height of the nanochannels. With this approximation, we obtain <σm> = 1.9, 2.0, and 2.0 × 10⁴ nm2 for the (1), (2), and (3) signatures, respectively. Although less applicable, we make the same approximation for the 1-kbp-DNA using ρm = 6.2 × 1013 cm−3 for the total (50% diluted) molecular concentration from Table 2. We find <σm> = 9.8, 8.9, and 8.6 × 10³ nm2 for the (1), (2), and (3), respectively.
A subtle but important aspect of the Beer–Lambert expression of (2) is that the cross section can be represented spatially as a disk, similar to the concept of scattering cross-section in atomic physics. Hence, an interesting quantity is the cross-section diameter D = 2∙(σm/π)1/2. This quantity is also entered in Table 1 and Table 2, and it becomes more interesting when compared to the molecular length, Lm. Fortunately, for our linear ds-RNA and -DNA samples, this length is very well known in aqueous solution. Accurate to about 1%, for linear dsDNA, Lm (nm) = 3.3 × (Nbp − 1) and for ds-RNA, Lm (nm) = 2.7 × (Nbp − 1), where Nbp is the number of base pairs in the double strand. Hence, Lm = 5.4 nm for the si-RNA, 168 nm for the 50-bp DNA, and 1305 nm for the 1-kbp DNA, all based on the average Nbp in each sample listed in Figure 2a. Taking the ratio, we get D/Lm = 29.3 for the si-RNA, = 0.25 for the 50-bp DNA, and =8.1 × 10⁻² for the 1-kbp DNA, all calculated for signature (2). Qualitatively, the ratio D/Lm is a measure of the molecular oscillator strength, and in principle can be >> 1.0 for particularly strong absorbers. In the present context, it means that the small nucleic acid molecules are much more effective absorbers than the large ones.
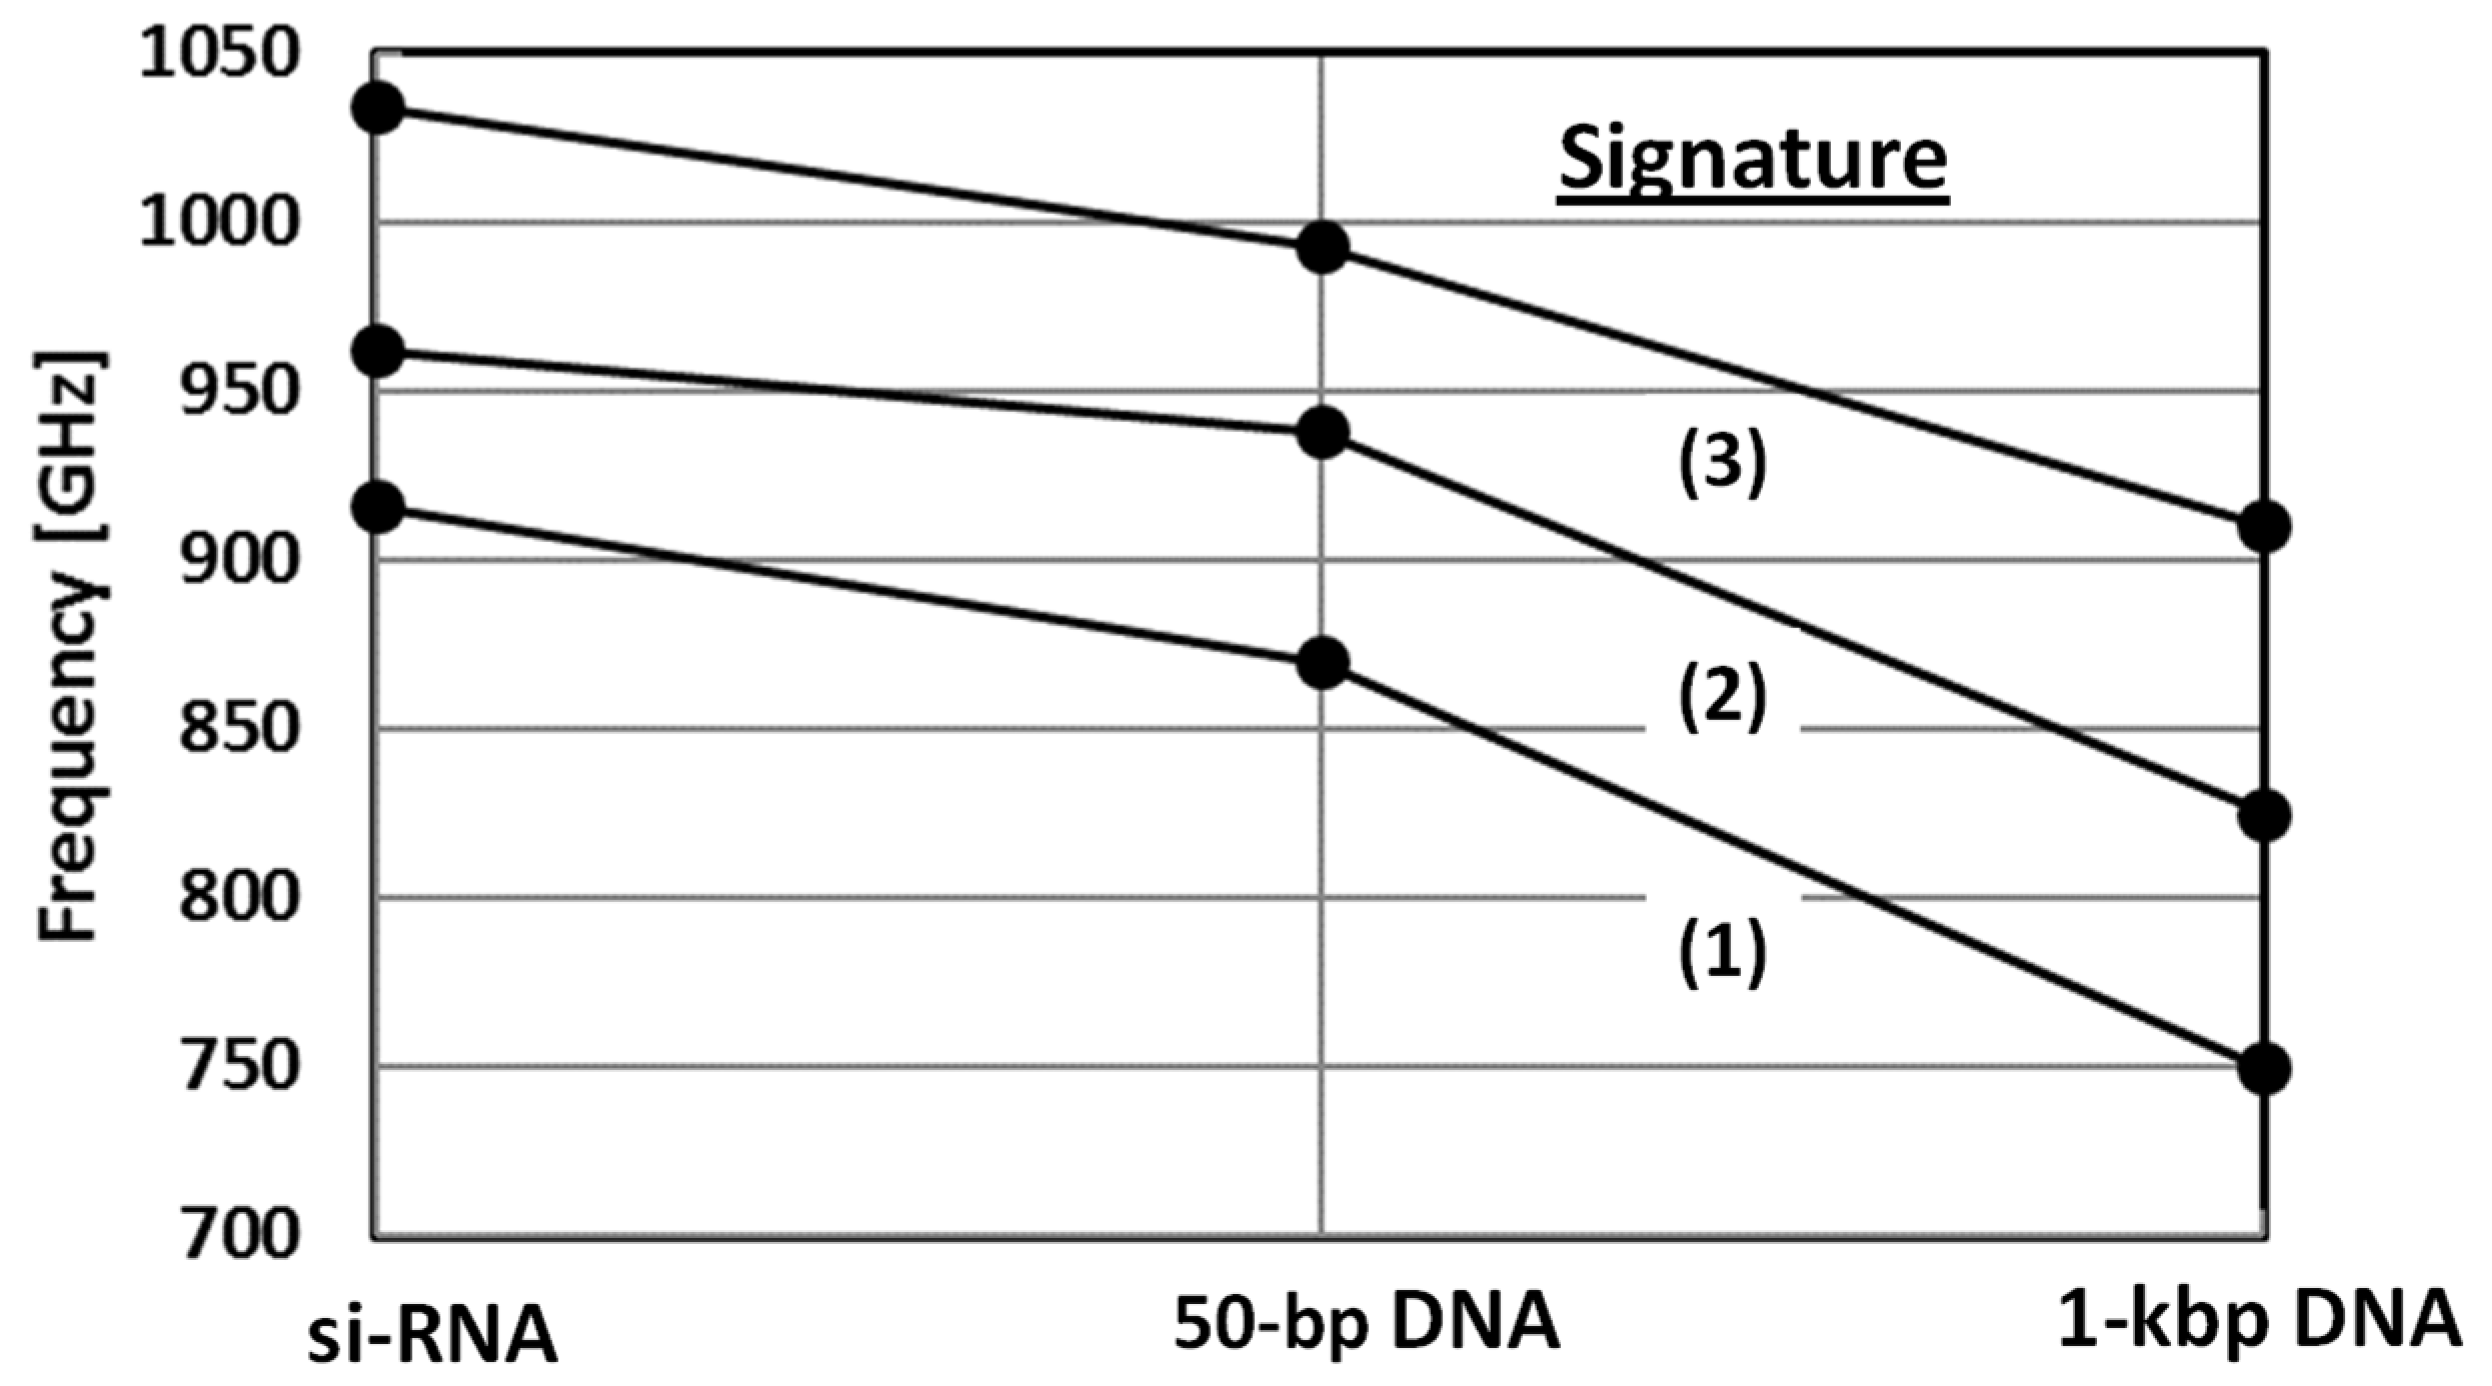
One other interesting aspect of our data is seen by plotting the center frequency for the (1), (2), and (3) signatures vs. sample for the si-RNA, 50-bp DNA, and 1-kbp DNA. As shown in Figure 7, there is a significant decrease in frequency for all three signatures. To the extent that these signatures are associated with the same physical mechanism (see the Discussion below), then this decrease is indicative of a spectroscopic red shift. This is a common effect in damped vibrational oscillators, and even occurs for the simple mass-spring harmonic oscillator of classical mechanics [26].
4. Discussion
4.1. Optical Effects
At first glance, the three prominent absorption signatures of Figure 4 and Figure 5 might appear to be caused by standing wave interference in the substrate etalon, since their peak-to-peak separation is comparable to the plane-wave etalon prediction: Δf ≈ c/(2nd) ≈ 77 GHz for the fused quartz chip. However, on further inspection, we see that the center frequencies are not equally spaced, as one would expect from etalon behavior. In Figure 4 (si-RNA), the separation between signatures (1) and (2) is 46 GHz, and the separation between (2) and (3) is 72 GHz. In Figure 5a (50-bp DNA), the separation between signatures (1) and (2) is 68 GHz, and the separation between (2) and (3) is 55 GHz. In Figure 5b (1-kbp DNA), the separation between signatures (1) and (2) is 75 GHz, and the separation between (2) and (3) is 85 GHz. Furthermore, the precipitous behavior of the signatures in Figure 4 and Figure 5a does not extrapolate to lower or higher frequencies, as one would expect for a strong etalon effect.
This reasoning does not apply to λ-DNA with its quasi-sinusoidal behavior, shown in Figure 6a,b, and its lack of prominent signatures. We reiterate that the background spectrum in Equation (1) (used in the calculation of transmittance) is taken with the nanochannels containing buffer solution, and the sample spectrum is taken with the nucleic acid solution added. Therefore, the transmittance calculation should cancel out the etalon effect, and the undulations of Figure 6 likely arise from weak nucleic acid absorption in the nanochannels comprising the top facet of the etalon. In Figure 6, the uniformity in the peak-to-peak separation and the weakness in amplitude together suggest that the λ-DNA absorption is broadband and lacking in measurable frequency-specific signatures, as displayed especially by the si-RNA and 50-bp DNA samples.
We do not expect high-Q etalon effects in our fused quartz substrates anyway. Because of the moderate refractive index (n ≈ 1.95 at ~1.0 THz), the reflectance at each silica-air interface is only ≈10%. Furthermore, fused silica is somewhat lossy at THz frequencies (α = 2.5–3.0 cm−1 at 1.0 THz; [20]), which dampens the etalon cavity Q, especially compared to the high-resistivity Si substrate in the nanofluidic chip that we studied previously [15]. Hence, we believe it is coincidental that the frequency separations of our three strongest signatures, especially those in Figure 4b and Figure 5a, are comparable to the value expected for the 1 mm-thick fused silica etalon, Δf ≈ 77 GHz.
4.2. Instrumental Effects
A most important result of this research is the identification of narrow absorption signatures in the small nucleic acid samples, siRNA, 50-bp DNA, and 1-kbp DNA. The associated linewidths (FWHM) are surprisingly narrow (10–32 GHz) and represent quality factors in the range of ~20–100. These linewidths are much narrower than have been reported in the literature for aqueous nucleic acids, to the best of our knowledge, and this begs the question: why? Based on our longstanding experience in the THz spectroscopy field, we attribute the observation of such narrow signatures in part to spectral resolution and dynamic range. Most of the reports on nucleic acid signatures have been carried out either by FTIR, THz TDS, Raman sideband spectroscopy, or, more recently, optical Kerr-effect spectroscopy. With all these techniques, there is a spectral resolution limit determined by delay line travel (FTIR and TDS) or pulsed laser sideband noise (Raman and Kerr effects). Without heroic efforts, these generally render a spectral resolution of roughly 0.5 cm−1 (15 GHz) or higher. By contrast, frequency-domain spectroscopy, as utilized in this work, routinely provides a spectral resolution of 1.0 GHz or better (0.5 GHz in our case). So, in the longstanding reports of THz nucleic acid absorptive signatures going back roughly 40 years, there is a possibility that the experiments have been spectroscopically under-resolved.
The second issue is dynamic range, which is related to instrumental SNR in the presence of the sample and all noise effects, random and systematic. Remarkably, many of the THz spectroscopy results do not report this metric, nor do they report an instrumental noise floor spectrum. So, even if a narrow signature were present and the instrument was configured to have suitable spectral resolution, the poor SNR would not allow a positive result.
4.3. Possible Biophysical Mechanism
Nucleic acids have one key attribute which is mechanical stiffness, with DNA having similar elastic moduli to even the stiffer artificial polymers. A well-known measure of this stiffness is the persistence length—the distance over which the molecule maintains elastic integrity, even in aqueous solution. Going back decades, the persistence length has been an important metric in polymer science, and in recent years has been measured to be ≈50 nm (150 bp) in β-helicity dsDNA [14,27], and ≈64 nm (237 bp) in β-helicity dsRNA [28,29]. With 17–25 bp length, our si-RNA sample is entirely within this range, and three of the 50 bp sample strands are within this range, too. However, none of the 1-kbp DNA strands are, and certainly not the λ-DNA sample (48.5 kbp).
On this basis, short strands of dsDNA or dsRNA can be thought of as stiff nanorods with three primary degrees of freedom: (1) compressional, (2) torsional (i.e., twisting), and (3) bending, each providing normal modes and natural resonant frequencies [30]. The compressional motion requires the highest force, so is thought to entail the highest resonant frequencies. Torsional and bending motions require much less force (or torque) and, hence, can display lower resonant frequencies, conceivably in the THz frequency range or lower, but still have high mechanical Q. Furthermore, a coupling between the torsional and bending motions has been identified, leading to the so-called Marko–Siggia model [31]. Although this model has been embellished several times in more recent years, the possibility of three normal modes remains. It also provides a plausible explanation for why, in the present work, we have seen three sharp signatures in the shorter nucleic samples.
Of course, there is also the question of optical activity, since strong interaction with electromagnetic waves always requires polarity in the absorbing species. One source of polarity is the well-known sequence of polar hydrogen bonds between every base pair in the double strand. Another possibility is the following. At the physiologic, slightly basic pH levels of the present samples (7.2 for the si-RNA, 8.0 for the others), the phosphate groups in the backbone of every nucleic acid donate one proton to the aqueous solution, creating a sequence of single negative charges down each strand. When combined with a positive charge from a bound water layer, there will be a high degree of polarity because, like the hydrogen bond sequence, there will be at least one dipole per base pair in the molecule.
There is also the issue of the remaining (weak) signatures that we observed in the larger sample, 1-kbp DNA. Historically, it is tempting to attribute these to the optically active phonon-like modes that have been discussed for decades, as described in the Introduction. However, their proximity in frequency to the sharp resonances of the smaller molecule samples suggests another possibility, which is coupled elastic modes. According to the “worm-like chain” model of polymer physics [32], the stiff sections of DNA or RNA approximately one persistence length long are loosely connected. In other words, the nano-mechanical resonators are coupled resonators, and from the principles of classical mechanics will yield more resonant modes with different frequencies than the uncoupled ones, including lower frequencies. However, by draining vibrational energy from the persistence length sections, the coupled modes should also be more heavily damped and thus have a lower Q, as we have seen experimentally. The higher damping may also explain the red-shift with increasing molecular length, as plotted in Figure 7.
4.4. Nanochannel Effect
But how can such sharp signatures occur at all, at room temperature and in the aqueous state? Conventional wisdom would suggest that vibrational resonances should be overdamped under such conditions, making the quality factor low and the observability of such resonances difficult, if not impossible. Independent of the detailed vibrational mechanism, the nanochannels may be providing an enhancement of the THz signatures, as evidenced by the large ratio of cross-sectional diameter to molecular length for the si-RNA sample summarized in Table 1. We hypothesize that some degree of enhancement is occurring by adsorption and maybe unfolding of the molecules onto the walls of the nanochannels. This should immobilize the molecules to a significant extent, thereby suppressing their random motion and collisional damping compared to bulk aqueous solution. However, the molecules cannot be desiccated, or they would lack the polarity needed to display strong optical absorption. This may also explain why nucleic acids, both in bulk aqueous and fully desiccated (solid-state) samples, have not displayed the sharp resonances reported here. It is a delicate balance that needs to be explored further, so for now, we simply leave it as a hypothesis.
5. Summary
We have presented what may be the sharpest absorption signatures of aqueous nucleic acid samples ever reported in the THz region at room temperature. The nucleic acid samples were tested after filling the nanochannels by osmosis, and then measuring the transmittance in the range of ~500 to 1000 GHz with a 0.5 GHz resolution using a scanning, frequency-domain THz spectrometer. Because the nanofluidic chip is fabricated on a fused quartz substrate, which has small refractive index but moderate THz attenuation, the standing wave effects should be weak, and are further mitigated by using as a “background” scan the chip with nanochannels filled by nucleic acid buffer solution only. We measured three prominent signatures from small interfering RNA, each providing strong absorbance (0.8–0.9) and narrow signature width (10–12 GHz). A 50-bp DNA (ladder) sample displayed three similar signatures with somewhat weaker absorbance (0.28–0.38) and broader frequency width (15–20 GHz). In a 1-kbp DNA (ladder) sample, signatures existed, but they were weaker and broader than the first two samples, and in the λ-DNA (48.5 kbp) samples, sharp signatures were non-existent. The sharp signatures in the smaller molecule samples can be attributed to the nano-mechanical vibrational resonance associated with bending, twisting, or a hybrid between them. This is possible in the smaller molecules because they were shorter than the persistence length of ≈50 nm (150 bp) in dsDNA and ≈64 nm (237 bp) in dsRNA under physiological conditions.
Author Contributions
Conceptualization, E.A.M. and E.R.B.; experiments, E.R.B. and E.A.M.; calculations and analysis, E.R.B. All authors have read and agreed to the published version of the manuscript.
Funding
This research was funded by the U.S. Army Research Office under Contract W911F-11-C-0080, and by the National Science Foundation under Award 1344263.
Institutional Review Board Statement
Not Applicable.
Acknowledgments
The authors acknowledge S. J. Brueck from the Center of High Technology Materials at the University of New Mexico for providing the nanofluidic chips used in this work.
Conflicts of Interest
The authors declare no conflict of interest.
Appendix A. Frequency-Domain Photomixing Spectrometer
Like TDS, frequency-domain photomixing utilizes ultrafast photoconductive emitters and detectors, but is driven by single frequency temperature-tunable distributed feedback (DFB) semiconductor lasers rather than mode-locked lasers. The photomixer provides a tunable difference frequency output from below 100 GHz to ~1.5 THz, with an instantaneous linewidth of ~50 MHz or better [18,33]. The difference frequency can be monitored accurate to ~100 MHz using a commercial wavemeter, such as the one shown in Figure 1. The photomixers are fabricated at the center of a compact planar square-spiral antenna, which radiates a primarily circular polarized beam above ~200 GHz. Including antenna impedance effects, the bandwidth of each photomixer is roughly 1.0 THz. One photomixer acts as the transmitter (Tx) and the other acts as the receiver (Rx), as shown in the photograph of Figure A1. The radiation from the transmit photomixer is coupled from the antenna to free space through a high-resistivity silicon hyperhemispherical lens. The THz beam is then collimated using an aspherical optic, an off-axis paraboloid. The reverse process occurs between free space and the receive photomixer.
The nanofluidic chip is located immediately below the transmit photomixer coupling lens (a silicone hyperhemisphere) where the spot diameter is small (~3 mm diameter), as determined by the photomixer spiral antenna and the thickness of the lens. Assuming an average power of 1.0 μW and an instantaneous linewidth of 50 MHz, the THz beam at this point has a spatial intensity of ~1.4 × 10⁻⁵ W/cm2, and the power spectral intensity is ~0.7 × 10⁻³ W/cm2-GHz. We have found the latter quantity to be a good performance metric for THz sources in high-resolution spectroscopy.
Figure A1.
THz photomixing spectrometer with a nanofluidic chip in the beam path.

Because the lasers driving the transmit and receive photomixers are both single frequency and coherent, the THz beam at the receive photomixer is mixed down in frequency by quasi-homodyne conversion. A simple amplitude modulation of the bias voltage on the transmit photomixer then allows for DC offset and straightforward synchronous detection of the receiver output using a lock-in amplifier, the same benefits as traditional homodyne transceivers. With no samples in the THz path, this spectrometer can produce a high dynamic range, up to 70–80 dB at 100 GHz and 40–50 dB at 1.0 THz. This assumes good alignment of the THz beam between the transmitter and receiver, which is non-trivial when there are substrate-based samples located in the beam path, since such samples can steer the beam. The stated dynamic range values can be achieved without evacuation of the free space portion of the spectrometer so that water vapor absorption lines do appear, especially when the ambient humidity is high. Unless one of these water vapor lines coincides with a signature from the sample of interest, this does not pose a big problem. On the contrary, because the water vapor lines are highly resolved, their known shape and strength is sometimes used to monitor the absolute frequency and dynamic range of the instrument.
An important practical aspect of our photomixing spectrometer is scan time. Because the DFB laser frequencies are temperature tuned, and because the temperature is set by thermoelectric modules, significant time is required for each sample frequency point. For the 0.5 GHz steps in the present experiments, that time is about 1 s per point, so that a 500 GHz scan takes about 20 min. This is why it is important to establish a fluidic steady state in the nanochannels prior to starting the THz frequency scans.
Appendix B. Nanochannel Technology
The motivation for nanofluidic sample presentation goes back to pioneering demonstrations of electrokinetic insertion, uncoiling, and transport of DNA in nanochannels and nanochannel arrays [34,35,36]. The use of nanochannels with negatively charged (i.e., hydrophilic) surfaces, such as silica, is especially advantageous because it overcomes the tendency for the negatively charged nucleic acid molecules to adsorb, and because of the ease with which electro-osmotic flows can be generated. Our innovative nanochannel technology was originally developed at U. New Mexico. A cross-sectional SEM of a fully fabricated array is shown in Figure A2. The nanochannels can be designed to have uniform dimensions across a given chip with widths between 50 and 600 nm, depth between 50 and 600 nm, and pitch typically between 500 and 1500 nm. They were fabricated using a customized process that consisted of the following steps: (1) definition of the submicrometer channel pattern in photoresist using interferometric lithography on fused quartz substrates; (2) spin coating and self-assembly of colloidal silica nanoparticles (multiple coats) on the patterned photoresist; and (3) high-temperature calcination to sinter the nanoparticles and remove the photoresist. Further details on this unique nanofabrication process and observation of DNA motion in nanochannels with fluorescent labeled DNA can be found in references [37,38].
Figure A2.
Cross-sectional SEM of nanochannels after spin deposition of silica nanoparticles and high-temperature calcination to remove the photoresist. The yellow line indicates 1.0 μm length.
Figure A2.
Cross-sectional SEM of nanochannels after spin deposition of silica nanoparticles and high-temperature calcination to remove the photoresist. The yellow line indicates 1.0 μm length.

Appendix C. Nucleic Acid Solutions
The first sample was small interfering (si) RNA containing three fragments of length 17, 21, and 25 base pairs with 2-base, 3′ overhangs on each end [21]. Including the overhangs, the molecular weight of the three fragments was 10,789, 13,369, and 15,941 Da. Assuming equal occurrence of each fragment, the total mass concentration of RNA was 9.0 μg/mL, which corresponds to a molarity of 6.7 × 10⁻¹⁰ mol/mL. The solvent consisted of a 5% glycerol, 1 mM EDTA buffer solution with a pH = 7.2. From a biological standpoint, si-RNA has attracted much interest because of its involvement in RNAi pathways, where it interferes with the expression of specific genes [39]. As such, it could play a key role in gene therapy [40]. It has also been found to be a potent inhibitor of influenza virus replication in embryonated chicken eggs and promises to help prevent and treat influenza virus infections in humans [41]. It has also been found to counteract the Human Immunodeficiency Virus (HIV) [42].
The second sample was a 50-bp DNA ladder containing a distribution of 17 fragments of length 50, 100, 150, 200, 250, 300, 350, 400, 450, 500, 550, 600, 650, 700, 766, 916, and 1350 bp, with the 200 and 1350 bp being slightly predominant (to enhance the intensity for electrophoresis applications). Taking a weighted average amongst all fragments, the total mass concentration of DNA was ≈1.0 × 10⁻³ gm/mL, which corresponds to an average molarity of 3.2 × 10⁻⁹ mol/mL. The third sample was a 1-kpb DNA ladder containing a distribution of 10 strands of length 0.5, 1.0, 1.5, 2.0, 3.0, 4.0, 5.0, 6.0 8.0, and 10.0 kbp, with the 3.0-kbp sample being slightly predominant. Again, taking a weighted average the total mass concentration of DNA was 0.5 × 10⁻³ gm/mL, which corresponds to an average molarity of 2.1 × 10⁻¹⁰ mol/mL. Both the 50-bp and 1-kbp samples came in a buffer solution of 10 mM Tris-HCL and 1 mM EDTA with a pH of 8.0.
The largest nucleic acid specimen we investigated was lambda DNA—the phage for the Escherichia coli bacterium. It consists of 48,502 base pairs [43] and is one of the best understood of all naturally occurring and physiologically relevant DNA species. Lambda DNA did not flow as readily into the submicron channels as the smaller species, so a longer waiting time (roughly 20 min) was taken to allow their full penetration. However, all four samples tested are considered biologically relevant. Like the 50-bp and 1-kbp DNA samples, the lambda DNA was obtained commercially, and dissolved in EDTA buffer solution at a pH of 8.0.
References
- Kohli, M.; Mei, W.N.; Van Zandt, L.L.; Prohofsky, E.W. Calculated Microwave Absorption by Double-Helical DNA. ACS Symp. Ser. 1981, 7, 101–106. [Google Scholar] [CrossRef]
- Urabe, H.; Tominaga, Y.; Kubota, K. Experimental evidence of collective vibrations in DNA double-helix (Raman spectroscopy). J. Chem. Phys. 1983, 78, 5937. [Google Scholar] [CrossRef]
- Lindsay, S.M.; Powell, J.W.; Rupprecht, A. Observation of Low-Lying Raman Bands in DNA by Tandem Interferometry. Phys. Rev. Lett. 1984, 53, 1853–1855. [Google Scholar] [CrossRef]
- Wittlin, A.; Genzel, L.; Kremer, F.; Häseler, S.; Poglitsch, A.; Rupprecht, A. Far-infrared spectroscopy on oriented films of dry and hydrated DNA. Phys. Rev. A 1986, 34, 493–500. [Google Scholar] [CrossRef]
- Van Zandt, L.L.; Saxena, V.K. Vibrational Local Modes in DNA Polymer. J. Biomol. Struct. Dyn. 1994, 11, 1149–1159. [Google Scholar] [CrossRef]
- Woolard, D.L.; Koscica, T.; Rhodes, D.L.; Cui, H.L.; Pastore, R.A.; Jensen, J.O.; Loerop, W.R.; Jacobsen, R.H.; Mittleman, D.; Nuss, M.C.; et al. Millimeter Wave-induced Vibrational Modes in DNA as a Possible Alternative to Animal Tests to Probe for Carcinogenic Mutations. J. Appl. Toxicol. 1997, 17, 243–246. [Google Scholar] [CrossRef]
- Globus, T.R.; Woolard, D.L.; Khromova, T.; Crowe, T.W.; Bykhovskaia, M.; Gelmont, B.L.; Hesler, J.; Samuels, A.C. THz Spectroscopy of Biological Molecules. J. Biol. Phys. 2003, 29, 89. [Google Scholar] [CrossRef]
- Markelz, A.G.; Roitberg, A.; Heilweil, E.J. Pulsed Terahertz Spectroscopy of DNA, Bovine Serum Albumin, and Collagen between 0.1 and 2.0 THz. Chem. Phys. Lett. 2000, 320, 42. [Google Scholar] [CrossRef]
- Brucherseifer, M.; Nagel, M.; Bolívar, P.H.; Kurz, H.; Bosserhoff, A.-K.; Büttner, R. Label-free probing of the binding state of DNA by time-domain terahertz sensing. Appl. Phys. Lett. 2000, 77, 4049–4051. [Google Scholar] [CrossRef] [Green Version]
- Fischer, B.M.; Hoffmann, M.; Helm, H.; Wilk, R.; Rutz, F.; Kleine-Ostmann, T.; Koch, M.; Jepsen, P.U. Terahertz time-domain spectroscopy and imaging of artificial RNA. Opt. Express 2005, 13, 5205–5215. [Google Scholar] [CrossRef] [Green Version]
- Li, X.; Globus, T.; Gelmont, B.; Salay, L.C.; Bykhovski, A. Terahertz Absorption of DNA Decamer Duplex. J. Phys. Chem. A 2008, 112, 12090–12096. [Google Scholar] [CrossRef]
- Jiménez, M.G.; Ramakrishnan, G.; Harwood, T.; Lapthorn, A.; Kelly, S.; Ellis, T.H.E.M.; Wynne, M.G.-J.G.R.A.J.L.K. Observation of coherent delocalized phonon-like modes in DNA under physiological conditions. Nat. Commun. 2016, 7, 11799. [Google Scholar] [CrossRef] [Green Version]
- Born, B.; Havenith, M. Terahertz dance of proteins and sugars with water. J. Infrared Millim. Terahertz Waves 2009, 30, 1245. [Google Scholar] [CrossRef]
- Gross, P.; Laurens, N.; Oddershede, L.B.; Bockelmann, U.; Peterman, E.; Wuite, G.J.L. Quantifying how DNA stretches, melts and changes twist under tension. Nat. Phys. 2011, 7, 731–736. [Google Scholar] [CrossRef]
- Brown, E.R.; Mendoza, E.A.; Xia, D.; Brueck, S.R.J. Narrow THz Spectral Signatures through DNA and RNA in Nanofluidic Channels. IEEE Sens. J. 2010, 10, 755. [Google Scholar] [CrossRef]
- Verghese, S.; McIntosh, K.A.; Calawa, S.; DiNatale, W.F.; Duerr, E.K.; Molvar, K.A. Generation and detection of coherent terahertz waves using two photomixers. Appl. Phys. Lett. 1998, 73, 3824–3826. [Google Scholar] [CrossRef] [Green Version]
- Bjarnason, J.E.; Brown, E.R. Sensitivity measurement and analysis of an ErAs:GaAs coherent photomixing transceiver. Appl. Phys. Lett. 2005, 87, 134105. [Google Scholar] [CrossRef]
- Demers, J.R.; Logan, J.R.T.; Bergeron, N.J.; Brown, E.R. A coherent frequency-domain THz spectrometer with a signal-to-noise ratio of 60 dB at 1 THz. In Proceedings of the SPIE Defense and Security Symposium 2008, Orlando, FL, USA, 16–20 March 2008; Volume 6949, p. 694909. [Google Scholar]
- Bolívar, P.H.; Brucherseifer, M.; Rivas, J.G.; Gonzalo, R.; Ederra, I.; Reynolds, A.L.; Holker, M.; De Maagt, P. Measurement of the dielectric constant and loss tangent of high dielectric-constant materials at terahertz frequencies. IEEE Trans. Microw. Theory Tech. 2003, 51, 1062–1066. [Google Scholar] [CrossRef] [Green Version]
- Naftaly, M.; Gregory, A. Terahertz and Microwave Optical Properties of single crystal and vitreious silica and the behavior of the boson peak. Appl. Sci. 2021, 11, 6733. [Google Scholar] [CrossRef]
- Purchased from New England Biolabs, Inc., Ipswich, MA, USA. Available online: www.neb.com/products/markers-and-ladders. (accessed on 18 October 2021).
- Liebe, H.J.; Hufford, G.A.; Manabe, T. A model for the complex permittivity of water at frequencies below 1 THz. Int. J. Infr. Millim. Waves 1991, 12, 659. [Google Scholar] [CrossRef]
- Xu, J.; Plaxco, K.; Allen, S.J.; Bjarnason, J.E.; Brown, E.R. 0.15–3.72 THz absorption of aqueous salts and saline solutions. Appl. Phys. Lett. 2007, 90, 31908. [Google Scholar] [CrossRef] [Green Version]
- Brown, E.R.; Bjarnason, J.E.; Fedor, A.M.; Korter, T.M. On the strong and narrow absorption signature in lactose at 0.53 THz. Appl. Phys. Lett. 2007, 90, 061908. [Google Scholar] [CrossRef]
- IUPAC. Compendium of Chemical Terminology, 2nd ed.; the “Gold Book”; McNaught, A.D., Wilkinson, A., Eds.; Blackwell Scientific Publications: Oxford, UK, 1997. [Google Scholar]
- Marion, J.B. Classical Dynamics of Particles and Systems; Academic: New York, NY, USA, 1965. [Google Scholar]
- Manning, G.S. The Persistence Length of DNA Is Reached from the Persistence Length of Its Null Isomer through an Internal Electrostatic Stretching Force. Biophys. J. 2006, 91, 3607–3616. [Google Scholar] [CrossRef] [Green Version]
- Abels, J.; Moreno-Herrero, F.; van der Heijden, T.; Dekker, C.; Dekker, N. Single-Molecule Measurements of the Persistence Length of Double-Stranded RNA. Biophys. J. 2005, 88, 2737–2744. [Google Scholar] [CrossRef] [Green Version]
- Hayashi, K.; Chaya, H.; Fukushima, S.; Watanabe, S.; Takemoto, H.; Osada, K.; Nishiyama, N.; Miyata, K.; Kataoka, K. Influence of RNA Strand Rigidity on Polyion Complex Formation with Block Catiomers. Macromol. Rapid Commun. 2016, 37, 486–493. [Google Scholar] [CrossRef]
- Barkley, M.D.; Zimm, B.H. Theory of twisting and bending of chain macromolecules; analysis of the fluorescence depolarization of DNA. J. Chem. Phys. 1979, 70, 2991–3007. [Google Scholar] [CrossRef]
- Marko, J.F.; Siggia, E.D. Bending and twisting elasticity of DNA. Macromolecules 1994, 27, 981–988. [Google Scholar] [CrossRef]
- Smith, S.B.; Cui, Y.; Bustamante, C. Overstretching B-DNA: The elastic response of individual double-stranded and single-stranded DNA molecules. Science 1996, 271, 795–799. [Google Scholar] [CrossRef] [Green Version]
- Brown, E.R.; Bjarnason, J.; Chan, T.L.J.; Driscoll, D.C.; Hanson, M.; Gossard, A.C. Room temperature, THz photomixing sweep oscillator and its application to spectroscopic transmission through organic materials. Rev. Sci. Instrum. 2004, 75, 5333–5342. [Google Scholar] [CrossRef]
- Foquet, M.; Korlach, J.; Zipfel, W.; Webb, W.W.; Craighead, H.G. DNA Fragment Sizing by Single Molecule Detection in Submicrometer-Sized Closed Fluidic Channels. Anal. Chem. 2002, 74, 1415–1422. [Google Scholar] [CrossRef]
- Han, J.; Craighead, H.G. Separation of Long DNA Molecules in a Microfabricated Entropic Trap Array. Science 2000, 288, 1026–1029. [Google Scholar] [CrossRef] [PubMed]
- Reisner, W.; Morton, K.J.; Riehn, R.; Wang, Y.M.; Yu, Z.; Rosen, M.; Sturm, J.C.; Chou, S.Y.; Frey, E.; Austin, R.H. Statics and Dynamics of Single DNA Molecules Confined in Nanochannels. Phys. Rev. Lett. 2005, 94, 196101. [Google Scholar] [CrossRef] [Green Version]
- Xia, D.; Brueck, S.R.J. Fabrication of enclosed nanochannels using silica nanoparticles. J. Vac. Sci. Technol. B Microelectron. Nanometer Struct. 2005, 23, 2694. [Google Scholar] [CrossRef]
- Xia, D.; Gamble, T.C.; Mendoza, E.A.; Koch, S.J.; He, X.; Lopez, G.P.; Brueck, S.R.J. DNA Transport in Hierarchically-Structured Colloidal-Nanoparticle Porous-Wall Nanochannels. Nano Lett. 2008, 8, 1610–1618. [Google Scholar] [CrossRef]
- Elbashir, S.M.; Harborth, J.; Lendeckel, W.; Yalcin, A.; Weber, K.; Tuschl, T. Duplexes of 21-nucleotide RNAs mediate RNA interference in cultured mammalian cells. Nat. Cell Biol. 2001, 411, 494–498. [Google Scholar] [CrossRef]
- Alekseev, O.M.; Richardson, R.T.; O’Rand, M.G. Analysis of gene expression profiles in HeLa cells in response to over expression or siRNA-mediated depletion of NASP. Reprod. Biol. Endocrinol. 2009, 7, 194391. [Google Scholar] [CrossRef] [PubMed] [Green Version]
- Ge, Q.; Eisen, H.N.; Chen, J. Use of siRNAs to prevent and treat influenza virus infection. Virus Res. 2004, 102, 37–42. [Google Scholar] [CrossRef]
- Kumar, P.; Ban, H.-S.; Kim, S.-S.; Wu, H.; Pearson, T.; Greiner, D.L.; Laouar, A.; Yao, J.; Haridas, V.; Habiro, K.; et al. T Cell-Specific siRNA Delivery Suppresses HIV-1 Infection in Humanized Mice. Cell 2008, 134, 577–586. [Google Scholar] [CrossRef] [PubMed] [Green Version]
- Sanger, F.; Coulson, A.R.; Hong, G.F.; Hill, D.F.; Petersen, G.B. Nucleotide sequence of bacteriophage λ DNA. J. Mol. Biol. 1982, 162, 729–773. [Google Scholar] [CrossRef]
Figure 1.
THz photomixing spectrometer with nanofluidic chip in the beam path. The chip dimensions are 5 × 5 mm and the THz beam has a 3 mm diameter, so underfills the chip. The nanochannels are not shown to scale, as there are approximately 5000 parallel nanochannels per chip.
Figure 1.
THz photomixing spectrometer with nanofluidic chip in the beam path. The chip dimensions are 5 × 5 mm and the THz beam has a 3 mm diameter, so underfills the chip. The nanochannels are not shown to scale, as there are approximately 5000 parallel nanochannels per chip.

Figure 2.
(a) Essential chemical and physical properties of four nucleic acid solutions, as provided by New England Biolabs, Inc., Ipswich, MA, USA, and after 50% dilution in the nanochannels. (b) Exact base sequence of the 21-mer fragments of the si-RNA sample including 5′ overhangs on opposite ends (A, C, G, and U stand for adenine, cytosine, guanine, and uracil, respectively).

Figure 3.
Characteristic of the THz absorption signatures evaluated in this work.

Figure 4.
(a) Power spectra for background, sample, and noise floor for si-RNA solution in the nanochannel cell. (b) Transmittance using the raw data in (a) and computation with Equation (1). The prominent three signatures are labelled (1), (2), and (3).
Figure 4.
(a) Power spectra for background, sample, and noise floor for si-RNA solution in the nanochannel cell. (b) Transmittance using the raw data in (a) and computation with Equation (1). The prominent three signatures are labelled (1), (2), and (3).


Figure 5.
(a) Transmittance spectrum for the 50-bp DNA sample between 700 and 1050 GHz. (b) Transmittance for the 1-kbp DNA sample between 550 and 1000 GHz.
Figure 5.
(a) Transmittance spectrum for the 50-bp DNA sample between 700 and 1050 GHz. (b) Transmittance for the 1-kbp DNA sample between 550 and 1000 GHz.


Figure 6.
(a) Transmittance spectrum for the λ-DNA sample between 500 and 1000 GHz. (b) Repeat measurement of same λ-DNA sample to check for reproducibility.
Figure 6.
(a) Transmittance spectrum for the λ-DNA sample between 500 and 1000 GHz. (b) Repeat measurement of same λ-DNA sample to check for reproducibility.


Figure 7.
Center frequency of three prominent signatures vs. sample type. Note that the horizontal axis is not proportionate.
Figure 7.
Center frequency of three prominent signatures vs. sample type. Note that the horizontal axis is not proportionate.


Table 1.
Spectroscopic and optical parameters for three prominent absorption signatures in si-RNA and 50-bp DNA samples.
Table 1.
Spectroscopic and optical parameters for three prominent absorption signatures in si-RNA and 50-bp DNA samples.
| Sample | si RNA | 50-bp DNA | ||||
|---|---|---|---|---|---|---|
| Signature | (1) | (2) | (3) | (1) | (2) | (3) |
| Center Freq (GHz), ν0 | 916 | 962 | 1034 | 870 | 938 | 993 |
| FWHM (GHz), Δν | 10 | 10 | 12 | 15 | 16 | 20 |
| Quality Factor, QS | 92 | 96 | 86 | 58 | 59 | 50 |
| Tmin | 0.012 | 0.011 | 0.012 | 0.35 | 0.39 | 0.31 |
| Tmax | 0.080 | 0.080 | 0.090 | 0.75 | 0.75 | 0.75 |
| Signature Absorbance, As | 0.82 | 0.86 | 0.88 | 0.33 | 0.28 | 0.38 |
| Molecule/cm3 (diluted), ρm | 2.0 × 10¹⁴ | 2.0 × 10¹⁴ | 2.0 × 10¹⁴ | 9.6 × 10¹⁴ | 9.6 × 10¹⁴ | 9.6 × 10¹⁴ |
| Molecular Cross Sec (nm2) | 1.9 × 10⁴ | 2.0 × 10⁴ | 2.0 × 10⁴ | 1.6 × 10³ | 1.4 × 10³ | 1.8 × 10³ |
| Cross-Sec Diam, D (nm) | 154 | 158 | 159 | 45 | 42 | 48 |
| D/Molecular Length | 28.5 | 29.3 | 29.4 | 0.27 | 0.25 | 0.29 |
Table 2.
Spectroscopic and optical parameters for three prominent absorption signatures in 1-kbp DNA sample.
Table 2.
Spectroscopic and optical parameters for three prominent absorption signatures in 1-kbp DNA sample.
| Sample | 1-kbp DNA | ||
|---|---|---|---|
| Signature | (1) | (2) | (3) |
| Center Freq (GHz), ν0 | 750 | 825 | 910 |
| FWHM (GHz), Δν | 32 | 30 | 32 |
| Quality Factor, QS | 23 | 28 | 28 |
| Tmin | 0.59 | 0.6 | 0.62 |
| Tmax | 0.8 | 0.79 | 0.81 |
| Signature Absorbance, As | 0.13 | 0.12 | 0.12 |
| Molecule/cm3 (diluted), ρm | 6.2 × 10¹³ | 6.2 × 10¹³ | 6.2 × 10¹³ |
| Molecular Cross Sec (nm2) | 9.8 × 10³ | 8.9 × 10³ | 8.6 × 10³ |
| Cross-Sec Diam, D (nm) | 112 | 106 | 105 |
| D/Molecular Length | 0.086 | 0.081 | 0.080 |
Publisher’s Note: MDPI stays neutral with regard to jurisdictional claims in published maps and institutional affiliations. |
© 2021 by the authors. Licensee MDPI, Basel, Switzerland. This article is an open access article distributed under the terms and conditions of the Creative Commons Attribution (CC BY) license (https://creativecommons.org/licenses/by/4.0/).
Share and Cite
MDPI and ACS Style
Brown, E.R.; Mendoza, E.A. Experimental Measurement of Sharp THz Absorption Signatures from Nucleic Acid Solutions in Nanofluidic Channels. Appl. Sci. 2021, 11, 11827. https://0-doi-org.brum.beds.ac.uk/10.3390/app112411827
AMA Style
Brown ER, Mendoza EA. Experimental Measurement of Sharp THz Absorption Signatures from Nucleic Acid Solutions in Nanofluidic Channels. Applied Sciences. 2021; 11(24):11827. https://0-doi-org.brum.beds.ac.uk/10.3390/app112411827
Chicago/Turabian StyleBrown, Elliott R., and Edgar A. Mendoza. 2021. "Experimental Measurement of Sharp THz Absorption Signatures from Nucleic Acid Solutions in Nanofluidic Channels" Applied Sciences 11, no. 24: 11827. https://0-doi-org.brum.beds.ac.uk/10.3390/app112411827
Note that from the first issue of 2016, this journal uses article numbers instead of page numbers. See further details here.