Article

Greenhouse Gas Impact of Algal Bio-Crude Production for a Range of CO2 Supply Scenarios

1
Department of Hydro and Renewable Energy, Indian Institute of Technology-Roorkee, Roorkee 247667, Uttarakhand, India
2
School of Industrial and Systems Engineering, Georgia Institute of Technology, Atlanta, GA 30332, USA
3
Algenol Biotech, 16121 Lee Road, Suite 110, Fort Myers, FL 33912, USA
4
Hendrix Engineering Solutions, Inc., 136 B Marketplace Circle PMB 164, Calera, AL 35040, USA
5
School of Chemical and Biomolecular Engineering, Georgia Institute of Technology, Atlanta, GA 30332, USA
*
Author to whom correspondence should be addressed.
Submission received: 15 October 2021 / Revised: 17 November 2021 / Accepted: 17 November 2021 / Published: 15 December 2021
(This article belongs to the Special Issue Advances in Algal Biomass Applications)

Abstract

:
Refined bio-crude production from hydrothermal liquefaction of algae holds the potential to replace fossil-based conventional liquid fuels. The microalgae act as natural carbon sequestrators by consuming CO2. However, this absorbed CO2 is released to the atmosphere during the combustion of the bio-crude. Thus, the life-cycle greenhouse gas (GHG) emissions of refined bio-crude are linked to the production and supply of the materials involved and the process energy demands. One prominent raw material is CO2, which is the main source of carbon for algae and the subsequent products. The emissions associated with the supply of CO2 can have a considerable impact on the sustainability of the algae-based refined bio-crude production process. Furthermore, the diurnal algae growth cycle complicates the CO2 supply scenarios. Traditionally, studies have relied on CO2 supplied from existing power plants. However, there is potential for building natural gas or biomass-based power plants with the primary aim of supplying CO2 to the biorefinery. Alternately, a direct air capture (DAC) process can extract CO2 directly from the air. The life-cycle GHG emissions associated with the production of refined bio-crude through hydrothermal liquefaction of algae are presented in this study. Different CO2 supply scenarios, including existing fossil fuel power plants and purpose-built CO2 sources, are compared. The integration of the CO2 sources with the algal biorefinery is also presented. The CO2 supply from biomass-based power plants has the highest potential for GHG reduction, with a GHG footprint of −57 g CO2 eq./MJ refined bio-crude. The CO2 supply from the DAC process has a GHG footprint of 49 CO2 eq./MJ refined bio-crude, which is very similar to the scenario that considers the supply of CO2 from an existing conventional natural gas-based plant and takes credit for the carbon utilization.

1. Introduction

The sustainable production of advanced biofuels from algal biomass faces several challenges. These include algae productivity, the sustainable supply of carbon dioxide (CO2), and the use of fossil-based energy in algal conversion processes [1,2,3]. Among these, the sustainable supply of CO2 is often overlooked, or it is assumed that CO2 would be readily available at the algal biorefinery site without any substantial emissions associated with the supply of CO2. Patel et al. [4] developed a cradle-to-gate attributional life cycle assessment (LCA) for algal biofuel production through the hydrothermal liquefaction (HTL) route for five different locations, namely, Brazil, UK, Spain, China, and Australia. The study predicted significant savings in greenhouse gas (GHG) emissions associated with algal biofuels; these savings depended strongly upon the energy mix of the country, and the source of supply of CO2 was omitted. Sun et al. [5] have performed LCA of biofuels production from microalgae through different conversion routes. The CO2 sourced from industrial flue gases is not considered within the system boundary. A majority of studies have failed to integrate CO2 delivery while assessing the sustainability of an algal biorefinery. Few studies consider losses from the CO2 injection system. Rickman et al. [6] have highlighted the excessive energy requirements for long-distance CO2 delivery from power plants. Somers and Quinn [6] have reported the global warming potential (GWP) for bio-crude production from different CO2 supply routes. A recent study by Porcelli et al. [7] has compared the production of microalgae for non-energy purposes from two different CO2 sources. Cheng et al. [8] have quantified the GHG emissions from hydrothermal treatment of algae utilizing CO2 from the conversion of biomass feedstocks. They have considered the CO2 production process within the LCA system boundary. Additionally, these studies do not incorporate the diurnal requirement of CO2 for algae growth. The algae growth is expected to take place during the daytime, and the CO2 source needs to be synchronized with the algae growth cycles.
A variety of CO2 supply strategies have been proposed [9,10]. Most of the predicted CO2 supply chains are linked to power plants, both new and existing. Alternately, there are several direct air capture (DAC) technologies to extract CO2 directly from the air, which may then be utilized by any CO2 utilization process [11,12,13]; as yet there has been no linking of DAC with an algae-based biofuel production process. Another novel integration is the use of biomass feedstock for supplying CO2 to the biorefinery. The sourcing of CO2 from a renewable and biogenic source has the potential for rendering the whole process carbon negative. A recent simulation study by Somers and Quinn [14] points out the necessity of integrating the algae HTL with upstream and downstream processing streams.
To overcome the above mentioned challenges, the present study focusses on HTL of algae to produce refined bio-crude, integrating upstream CO2 supply with downstream hydro-treating and hydro-cracking of bio-crude. GHG emissions are quantified for an envisioned 2000 acre algae growth facility to be located in southwest Florida, US. The algae feedstock is produced in photo-bioreactors (PBRs), utilizing a process and design developed by Algenol Biotech [15,16]. The HTL-oil can potentially be fed into conventional crude refineries after hydro-treating, which would remove excess oxygen and nitrogen in the bio-crude. The HTL process also results in an aqueous phase. Subsequent catalytic hydrothermal gasification (CHG) of the aqueous phase is carried out to produce fuel-gas, which can be used to meet the energy requirement of the HTL and the CHG reactors. The CO2 produced from fuel-gas combustion can be recycled back to the PBRs. The study integrates the energy sources and sinks that are available in the CO2 supply scenario, algae production, and bio-crude production and refining. The mass and energy balances from the ASPEN Plus® simulation are used to quantify the GHG emissions for the production of refined bio-crude utilizing an LCA framework.
The research gap is addressed in this study to evaluate a range of CO2 supply scenarios and the diurnal CO2 requirement, to fully characterize the life-cycle greenhouse gas emissions for algal biocrude production. Novel integration of the DAC and the biomass gasification process with the biocrude production has also been presented. Furthermore, there has been no previous study highlighting the sustainability of the selected algal strain.

2. Methodology

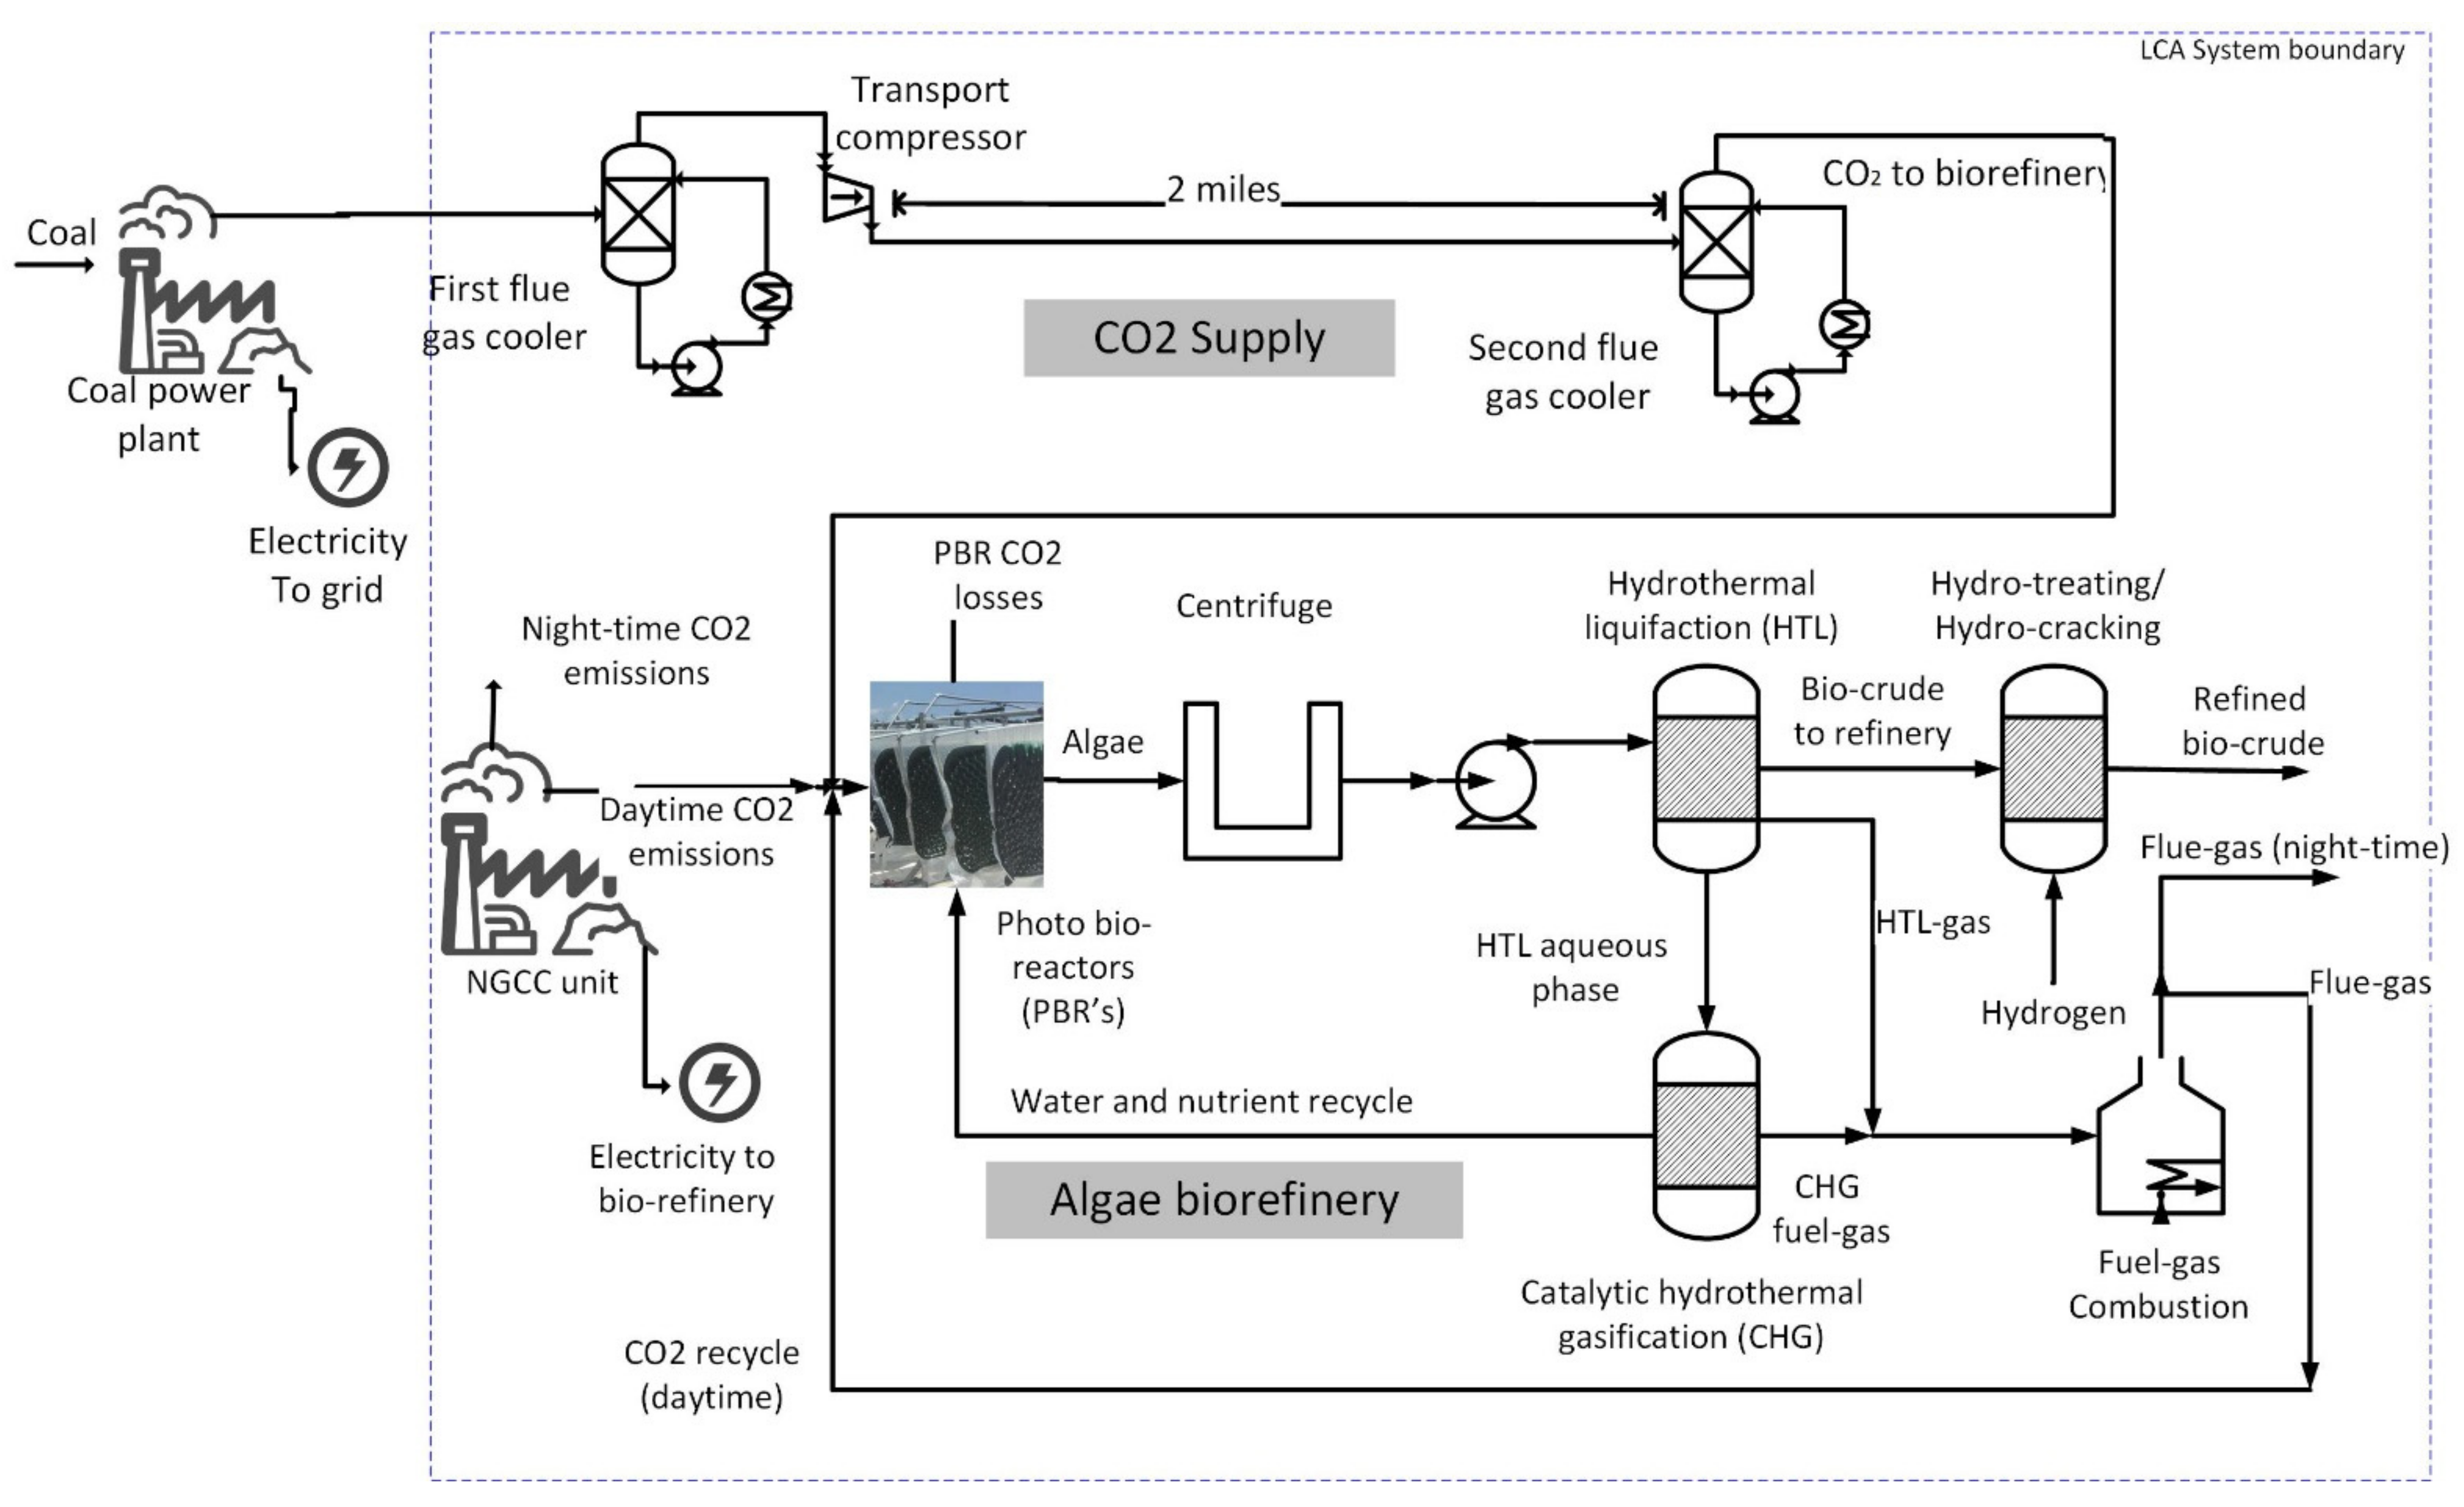
2.1. Process Flowsheet

The algae production, CO2 production and delivery, HTL reactor, CHG reactor, and hydro-treating is modeled in ASPEN Plus® simulation software. The software platform has been used in previous studies to model similar algal growth processes [17,18]. The Redlich Kwong Soave (RKS) thermodynamic model has been utilized to estimate the thermodynamic properties of the different compounds modeled in the flowsheet. The algae production is modeled utilizing a methodology reported by NREL [17]. The model was validated against data reported by NREL, and, subsequently, the model was updated to incorporate the selected Algenol algae strain [16]. The algae are assumed to be grown in PBRs with a productivity of 25 g/m2/day [15] in a 2000 acre algae growth facility [19]. The CO2 utilization efficiency of the PBRs is assumed to be 85% with the remaining 15% released back to the atmosphere in a gas purge. The harvested algae is used for the production of bio-crude through HTL occurring at 350 °C and 200 bar [15]. The HTL process leads to three components, namely the bio-crude, the aqueous phase, and the fuel-gas. The aqueous phase is subjected to CHG, leading to the production of syngas rich in methane. The syngas from the CHG and fuel gas from the HTL unit is combusted to provide the energy required for the operation of both the HTL and CHG units, thus making the thermo-chemical conversion process self-sufficient in terms of its heating requirement. The CO2 produced from the combustion of these gases is recycled back to the PBRs. The only energy input to the HTL and CHG process is the electricity requirement by the different pumps used for pumping the algae slurry and the aqueous phase.
The HTL and the CHG processes were simulated by updating the models proposed by PNNL [18]. The simulation incorporates separate day and night operations as well as recycling of CO2, water, and nutrients. The separate day and night operations are needed to reconcile the daytime algae production limited by sunshine and the continuous day/night operation of the HTL and the CHG units. The HTL and CHG reactors are assumed to operate for 24 h/day, whereas the algae production is considered to occur for 12 h/day. Thus, the HTL units utilize half of the algae produced during the daytime, and half of it is utilized during night-time. The CO2 recycle from syngas combustion takes place during the algae growth phase during the daytime. During night-time operations of the HTL and the CHG units, the CO2 is vented to the atmosphere. The water recycle from the CHG unit, however, is assumed to take place continuously.
The bio-crude produced from the HTL process needs to be upgraded to be utilized as a substitute to either gasoline range or diesel range fuels. This upgrading is accomplished by the hydrotreating and the hydrocracking processes. The study assumes that the hydrotreating and hydrocracking would be accomplished at a conventional crude refinery, and no separate infrastructure would be built for these catalytic conversion processes. The hydrogen utilized for these processes would be supplied through the steam methane reforming process at the conventional crude refinery [20]. A transportation distance of 100 km has been chosen to account for the transportation of bio-crude to the refinery and the transport of the diesel and gasoline range biofuels to the market. A mass balance for all scenarios along with the assumptions undertaken are presented in the Supplementary Information.
For the supply of CO2, the following five different supply scenarios are considered:
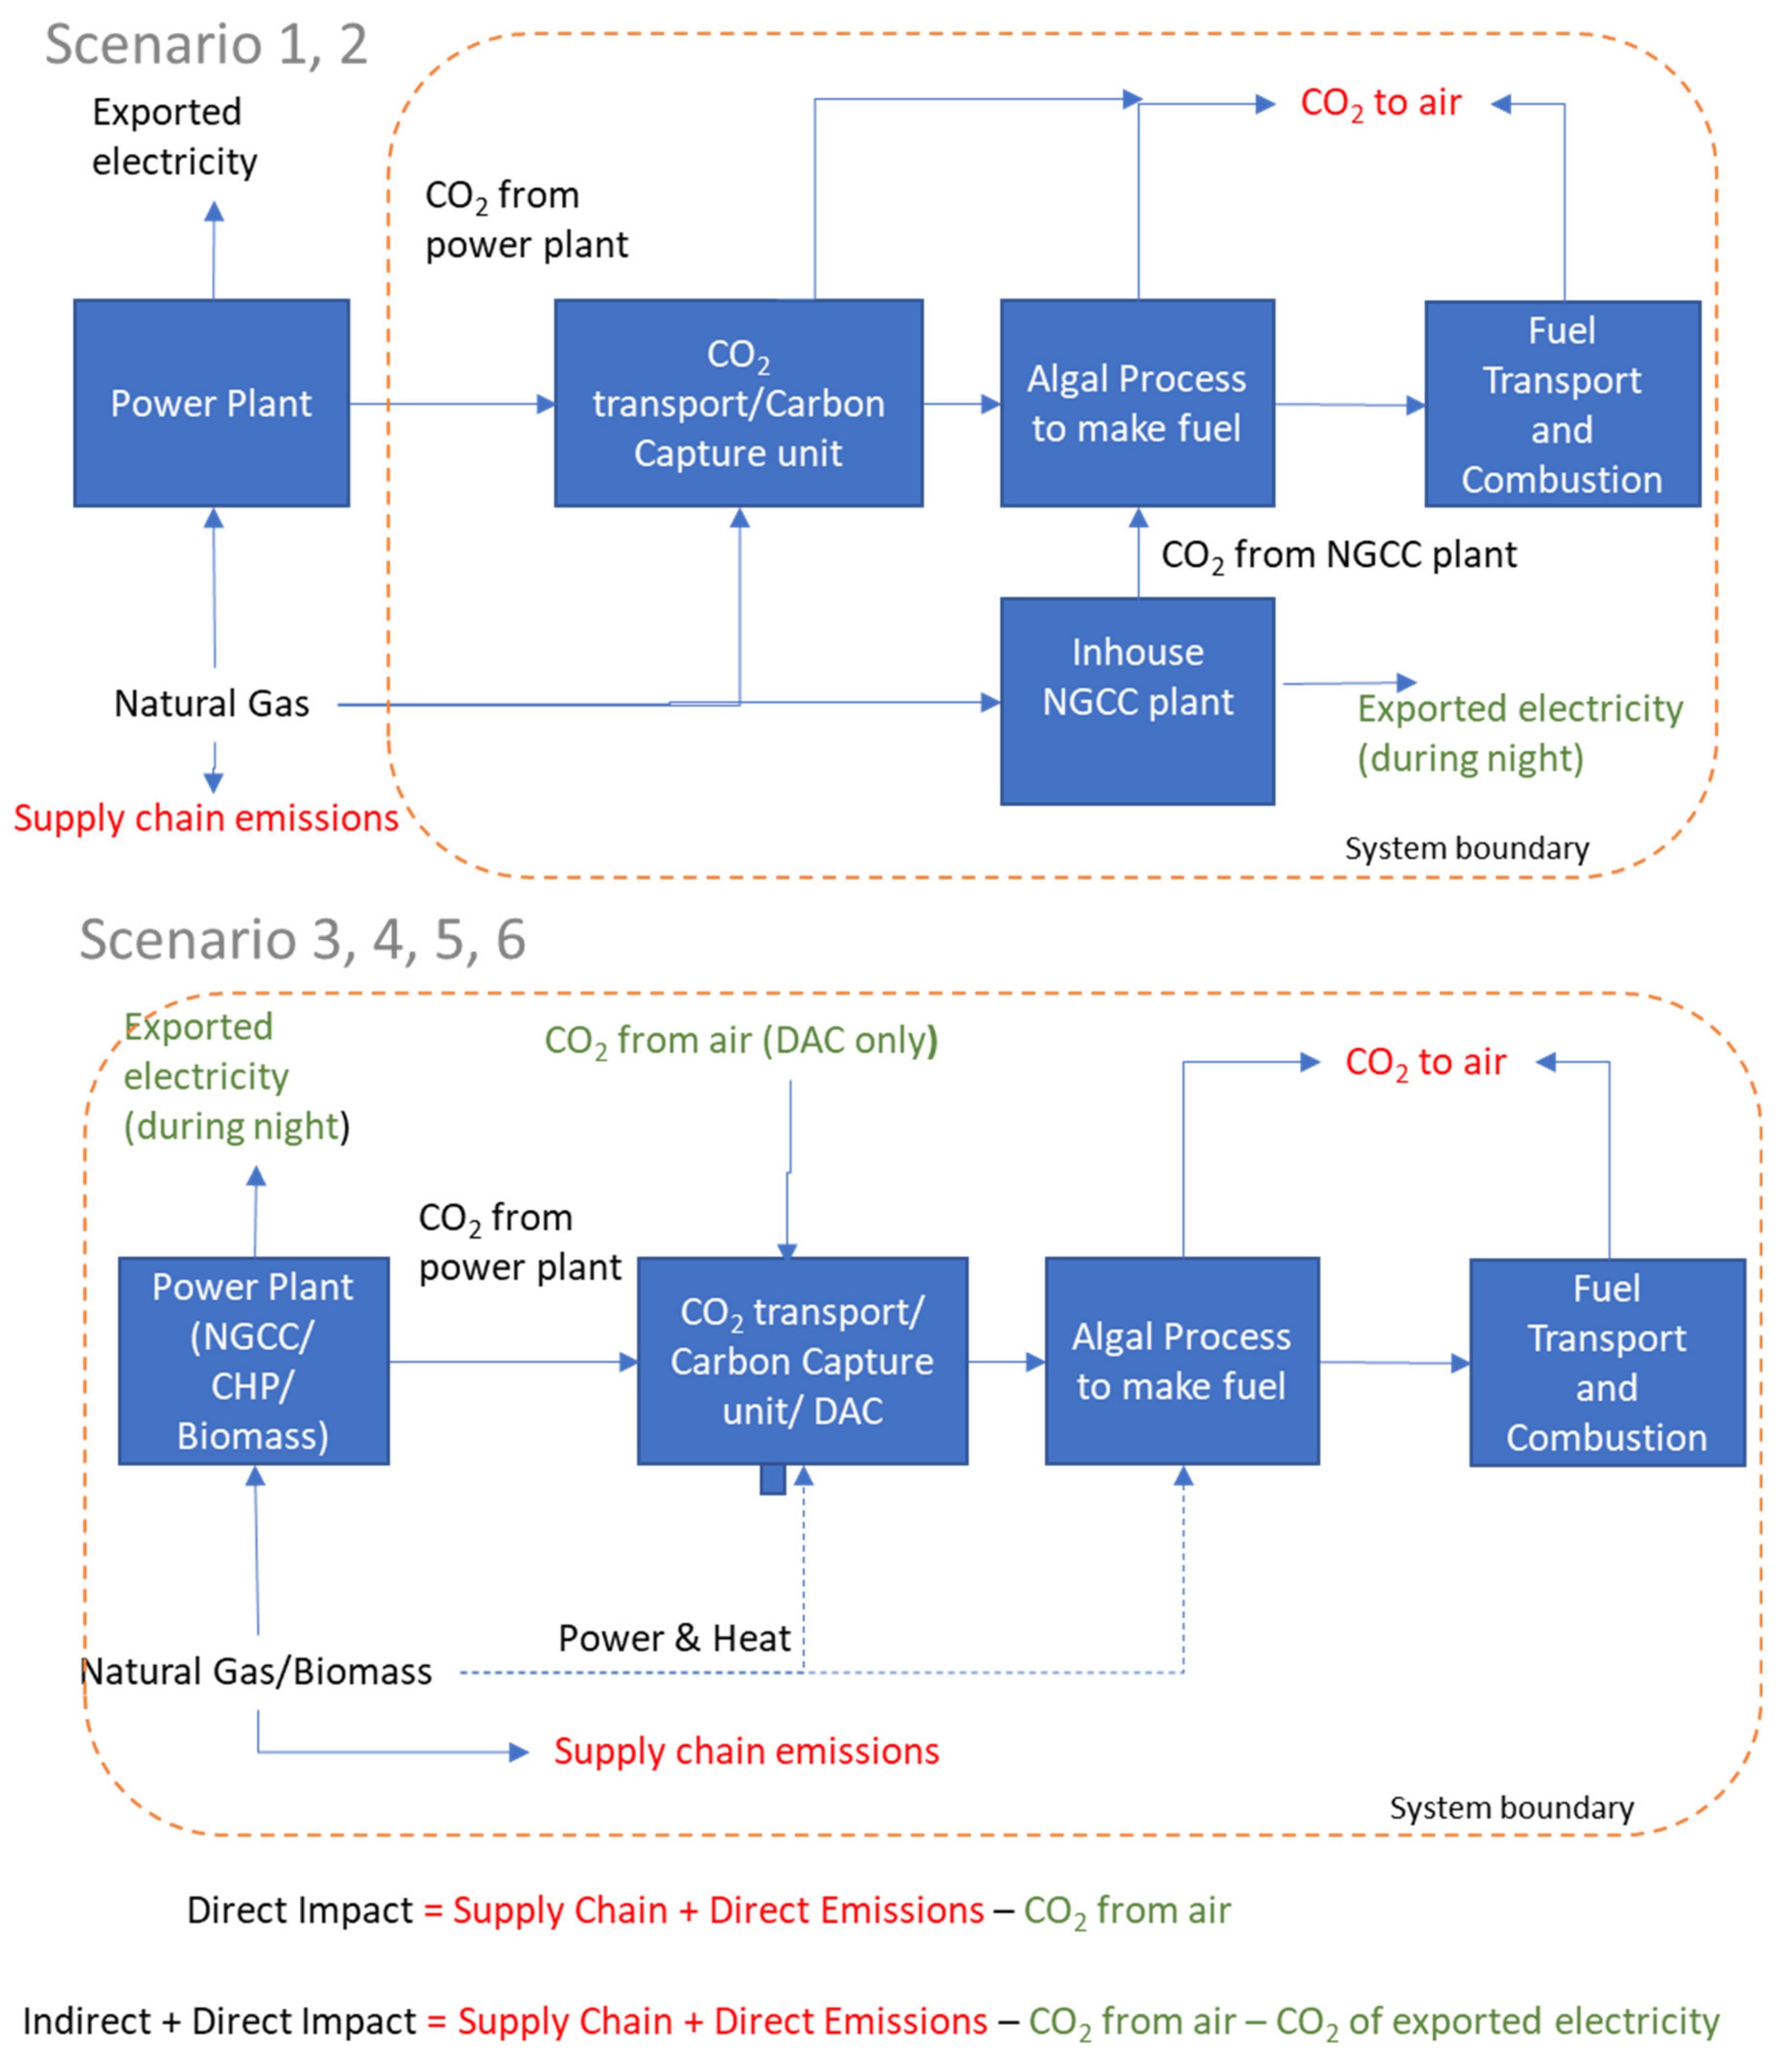
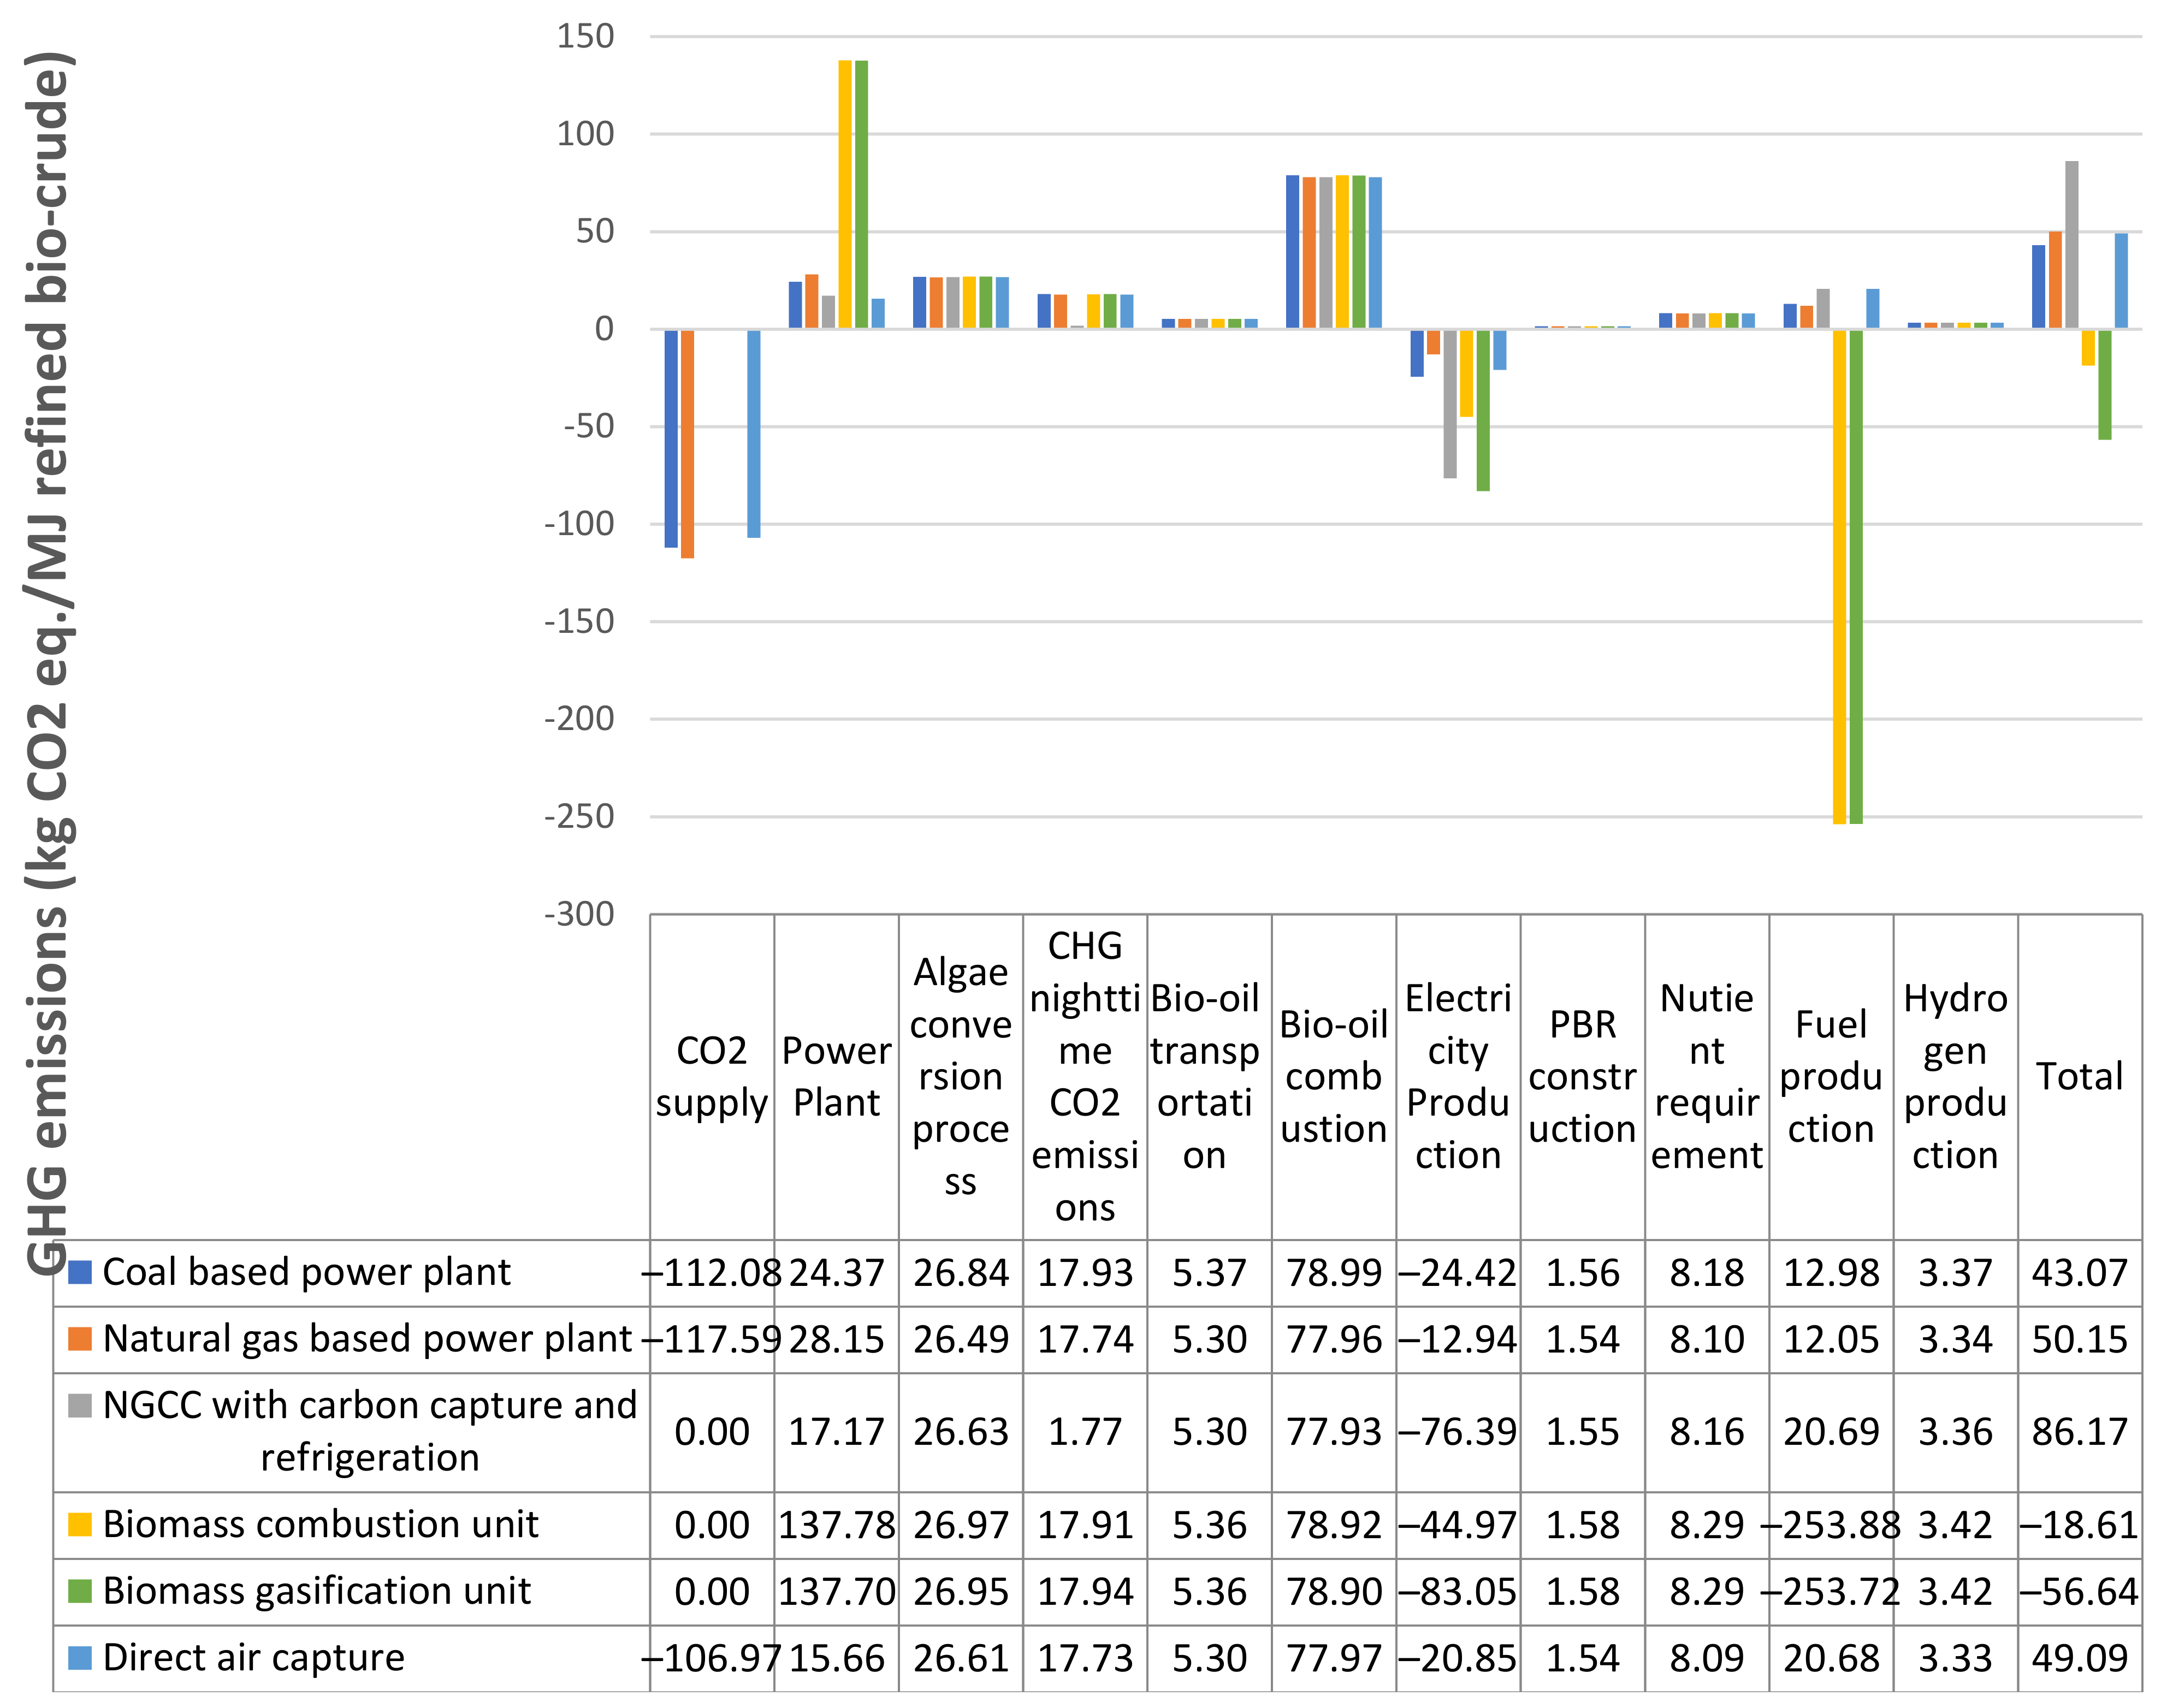
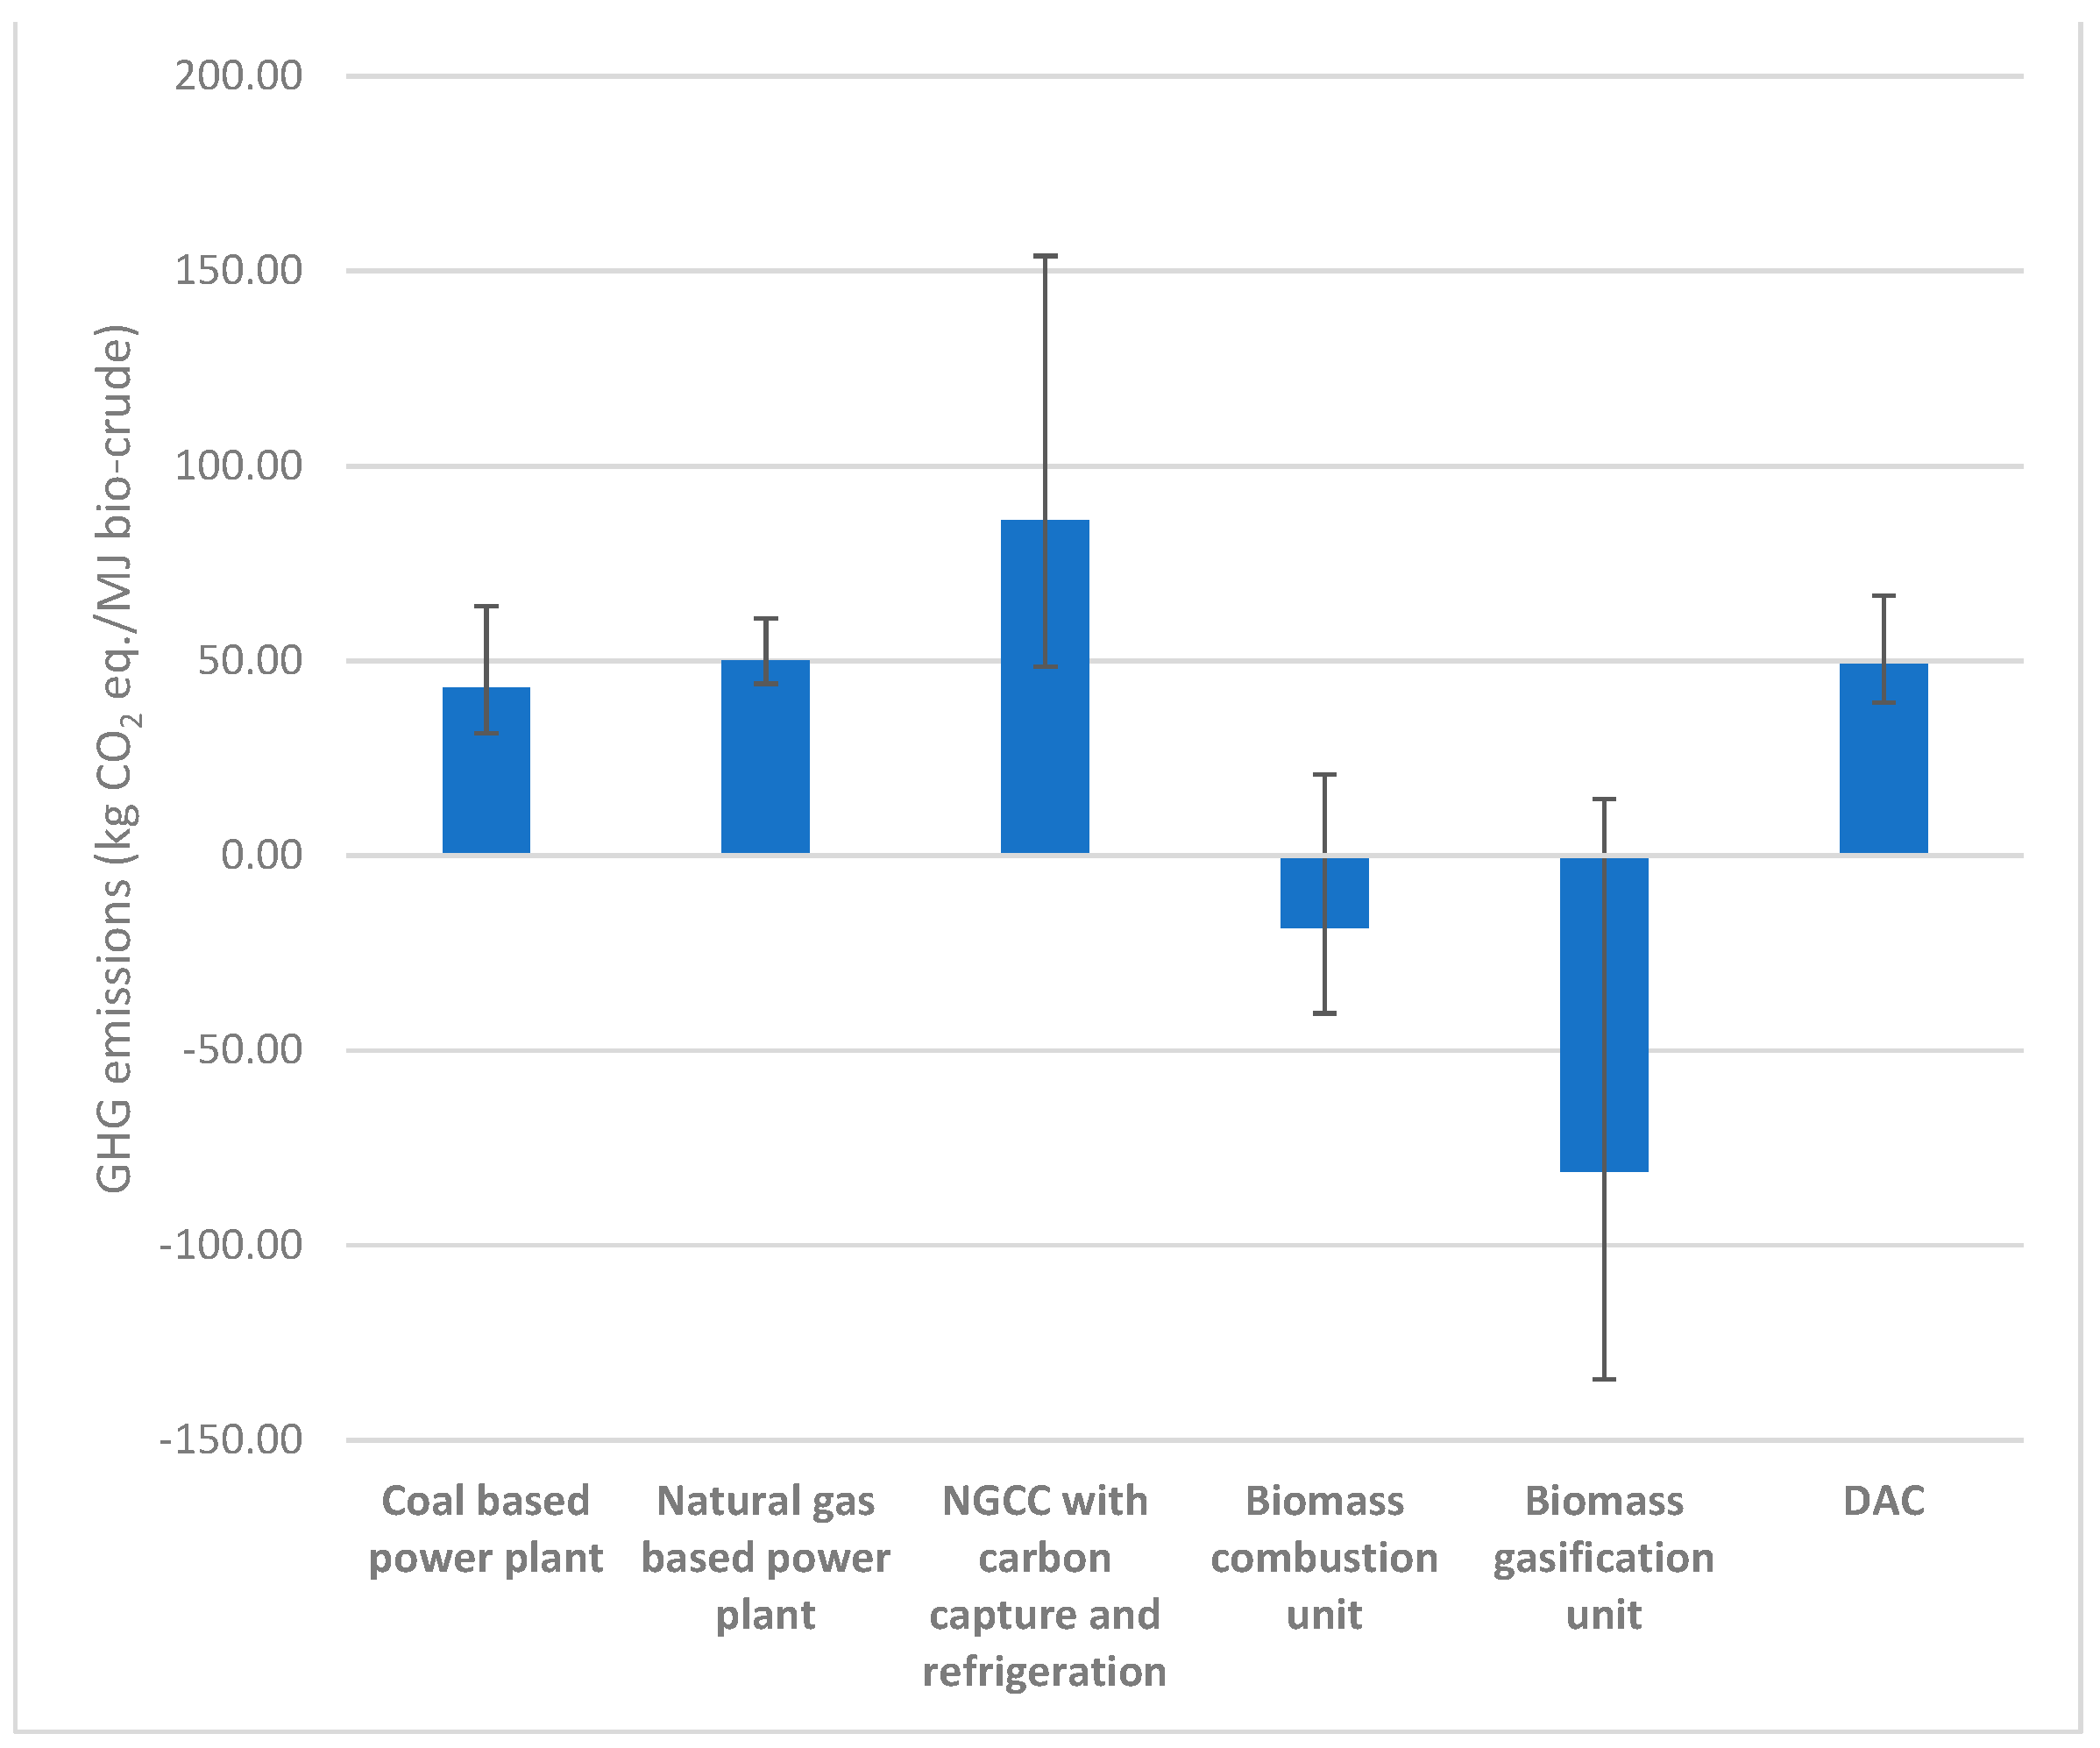
  • Scenario 1: CO2 from a coal-based power plant
  • Scenario 2: CO2 from a natural gas-based power plant
  • Scenario 3: CO2 from an NGCC unit with carbon capture and refrigeration
  • Scenario 4: CO2 from a biomass combustion plant
  • Scenario 5: CO2 from a biomass gasification plant
  • Scenario 6: CO2 from DAC
These CO2 supply scenarios have been extensively discussed by the authors in previous publications [10,21] and are briefly described in the Supplementary Information. The process flowsheet for the base-case scenario is presented in Figure 1. Table 1 shows the carbon dioxide source systems considered and the corresponding assumptions.

2.2. Electricity Production and Night-Time Emissions

In scenarios 1 and 2, the electricity requirement of the biorefinery is met through a relatively small onsite NGCC plant. This NGCC plant is sized according to the electricity requirement of the biorefinery as well as that of the CO2 compression and scrubbing units. The daytime CO2 emissions from the NGCC plant in scenarios 1 and 2, combined with CO2 from off-site power plant flue gas, are utilized for algal growth. The night-time emissions, however, are vented to the atmosphere. The extra electricity from the onsite NGCC plant during the night is exported to the grid. This is different from scenarios 3, 4, and 5, where the NGCC plant and the biomass combustion/gasification unit, respectively, are sized based on the CO2 requirement of the biorefinery. Thus, scenarios 3, 4, and 5 produce more electricity than is required by the biorefinery, and this extra electricity is exported to the grid. The exported electricity is larger during night-time operation. The night-time emissions are captured and refrigerated for scenario 3. The night-time CO2 emissions for scenarios 4 and 5 are vented to the atmosphere, as they come from a biogenic source. In scenario 6, a CHP unit producing both electricity and steam is proposed. The CHP system is sized to meet the heat and electricity demands of both the DAC unit and the biorefinery. A significant part of the CO2 emissions from the CHP unit are captured by the DAC system during daytime operations. The night-time emissions, however, would be vented to the atmosphere. Additionally, the night-time extra electricity production would be exported to the grid. In reality, there would be a provision to ramp down the power plants due to reduced electricity requirements. However, this option is not considered in the present study.

2.3. Greenhouse Gas (GHG) Emissions

A LCA approach has been adopted to quantify the GHG emissions from the different CO2 supply scenarios leading to the production of refined bio-crude, with 1 MJ of refined bio-crude production as the functional unit. The cradle-to-grave system boundary spans from the production of CO2 and algae, to the consumption of refined bio-crude. For scenarios 1 and 2 the system boundary does not include the CO2 production source, namely, the off-site coal and natural gas-based powerplant, because it is assumed that since the CO2 emissions from the powerplant would otherwise have been emitted to the atmosphere and, since no electricity from the powerplant is being used, utilization of these emissions is, in effect, the same as taking CO2 from the atmosphere. The CO2 supply capture and transportation processes, however, are within the system boundary. The NGCC plant, biomass combustion/gasification plant, and the DAC plant in scenarios 3, 4, 5 and 6, would be built explicitly for providing CO2 to the biorefinery and, thus, they are included within the system boundary (Figure 2).
The life cycle inventory data have been derived from ASPEN Plus simulations as well as other literature, including the ecoinvent databases [20]. The ASPEN Plus flowsheets were utilized to model the mass and energy balance for the different unit processes used in simulating the different scenarios. Electricity production and consumption, as well as different recycle streams, are part of the ASPEN Plus simulations. The life cycle assessment calculations were conducted utilizing an MS Excel-based framework utilizing matrix algebra [22]. A 100-year time horizon is used to calculate the global warming potentials [23].
Grid average electricity emissions of 500 g CO2 eq./kWh electricity are used to estimate the emissions related to the import and export of electricity. The emission associated with the supply and leaks of natural gas is taken to be 14 g CO2 eq./MJ of natural gas utilized [24]. These emissions account for the entire natural gas supply chain, including production, processing, transmission, storage, and distribution. The emissions related to the growth and supply chain of biomass feedstock are adopted from the work of Arora et al. [10]. The biomass feedstocks (southeastern pine plantations) are grown in the US state of Florida with an 11-year harvesting cycle, representing thinnings from timber stands. A methodology proposed by Guest et al. [25] is used to estimate the climate impact of the 11-year time-lag for biomass re-growth. The utilization of potassium hydroxide and calcium carbonate in the DAC process has been estimated based on data reported by Liu et al. [26].

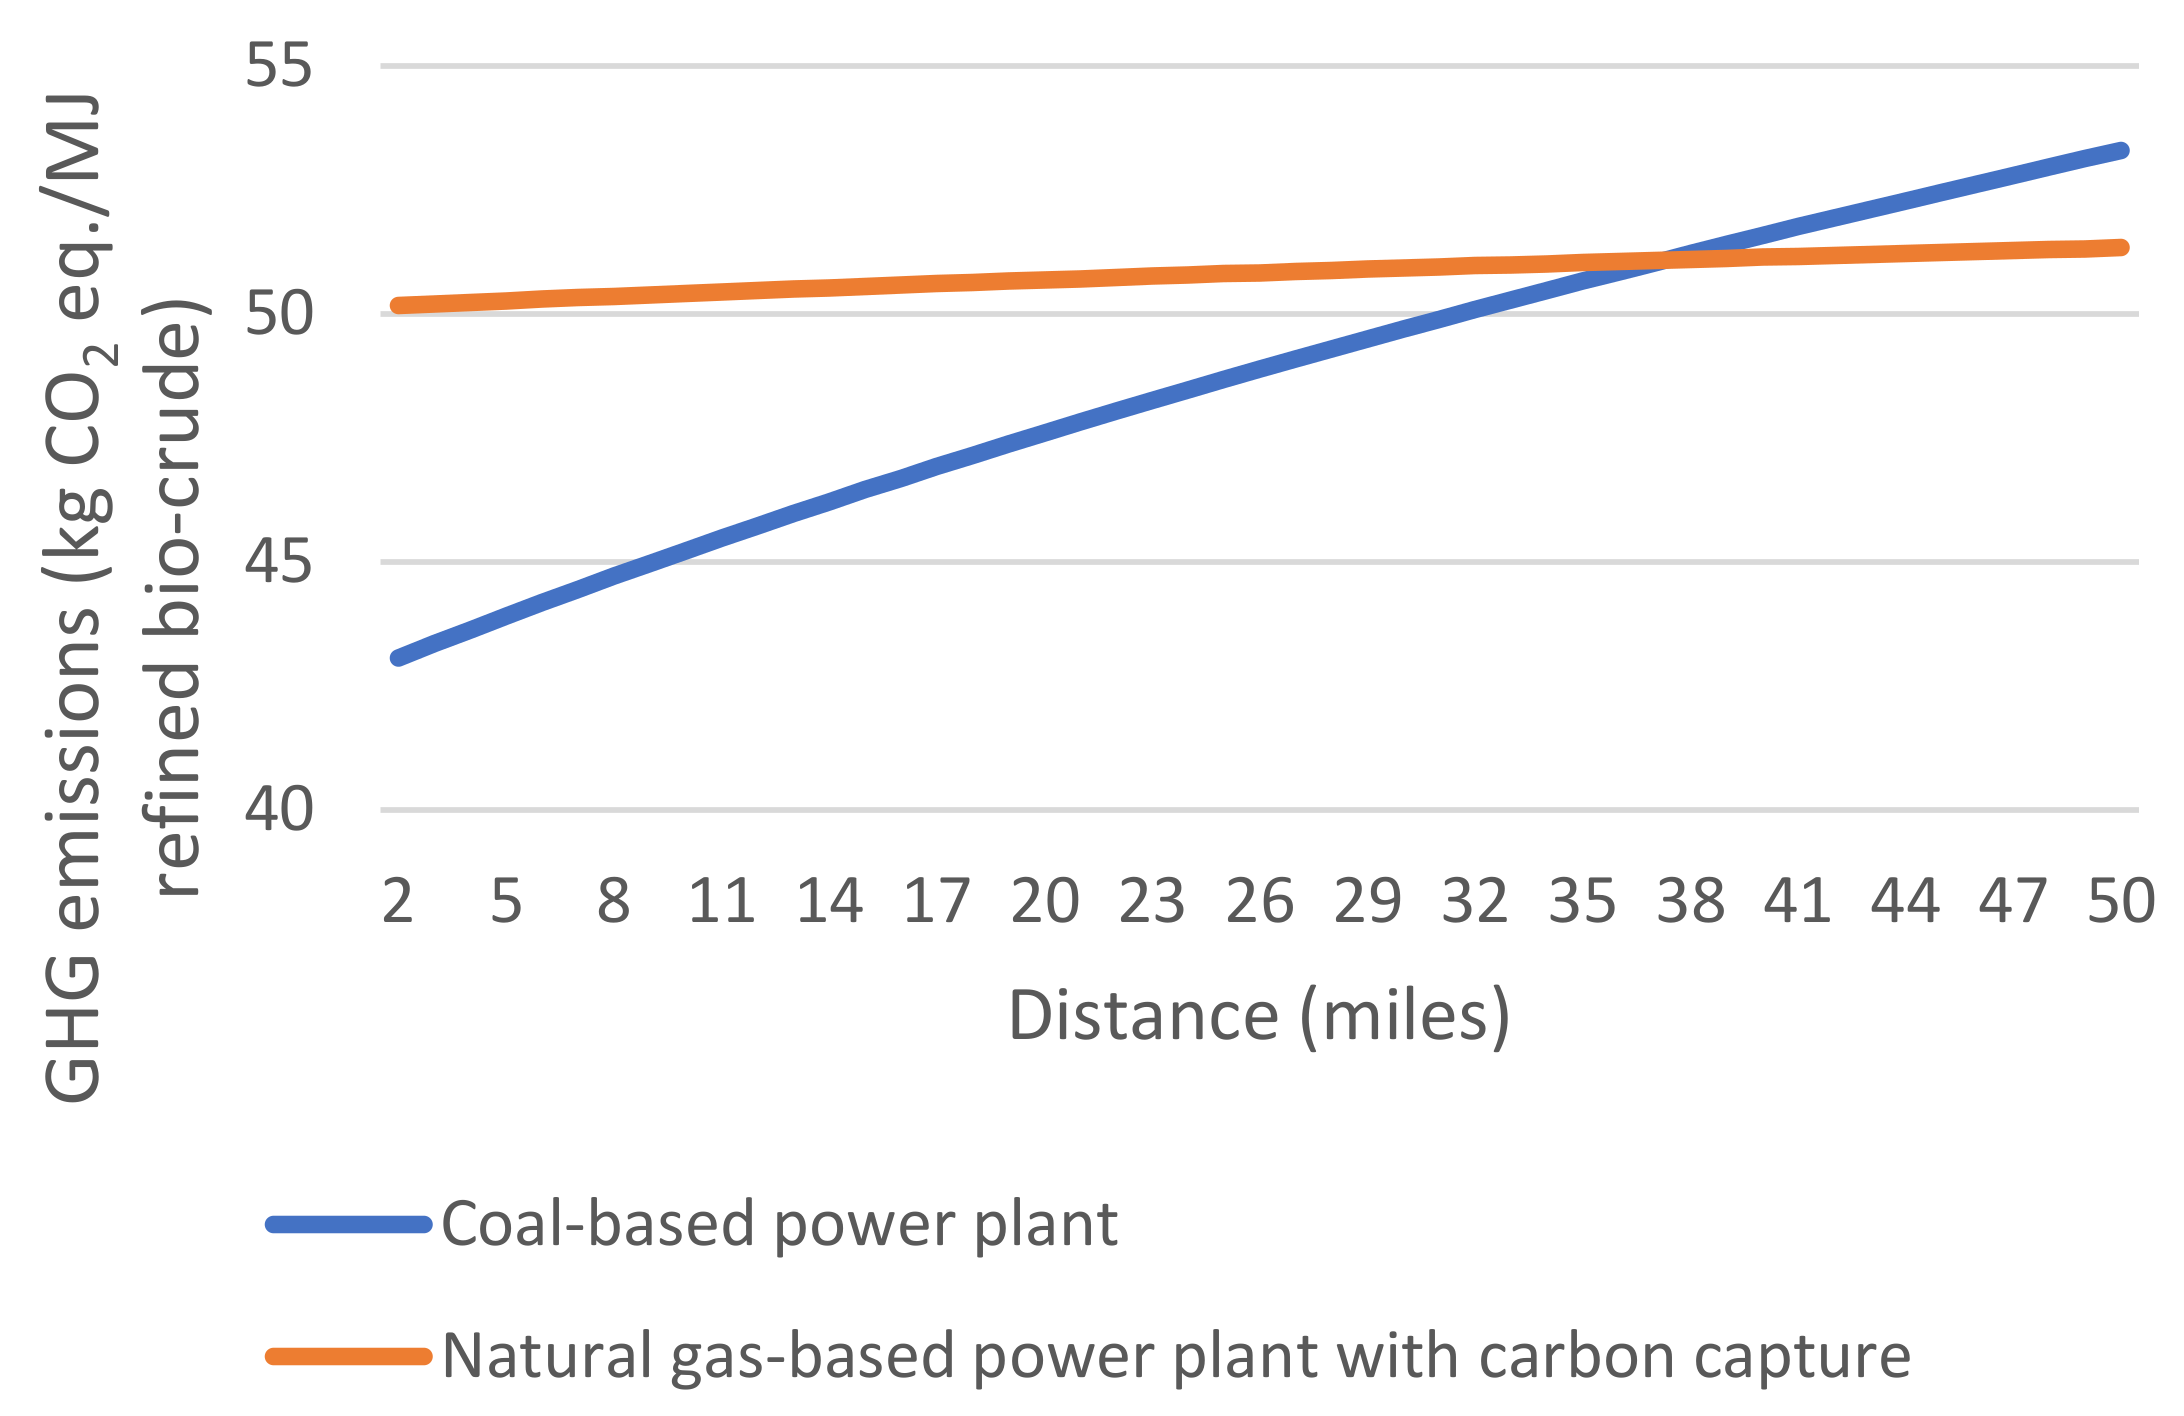
3. Results and Discussion

The life-cycle greenhouse gas emissions for production of algal biocrude are 43, 50, 86, −19, −57, and 49 g CO2 eq./MJ for CO2 sourced from coal, natural gas, on-site purpose-built natural gas combined cycle, biomass combustion, biomass gasification, and direct air capture, respectively. The contributions to the GHG emissions for the six different scenarios described above are presented in Figure 3. The CO2 supply refers to the avoided emission of CO2 to the atmosphere, which would have been released to the atmosphere in the absence of the biorefinery. The algae conversion process refers to algae production and the HTL, CHG, hydrotreating, and hydrocracking conversion processes. The majority of emissions under this category are due to the CO2 losses from the PBRs during the growth of algae. The PBRs are assumed to have a CO2 utilization efficiency of 85% [15]. The CHG night-time emissions refer to the emissions from the combustion of fuel gases from the HTL and the CHG processes, which are used to provide the necessary heat for the HTL and the CHG reactors. The daytime emissions are recycled to the PBRs. Bio-oil transportation refers to the transportation of the bio-crude to the refinery as well as the transportation of the refined bio-crude to the end-user. The emissions from the combustion of refined bio-crude at the end-use are represented by bio-oil combustion. Both the scenarios result in the production of excess electricity, which is exported to the grid at grid average emissions. The emissions associated with the construction of PBRs are also shown in Figure 3. The nitrogen and phosphorous-based fertilizers utilized during the algae growth process are the major nutrients considered in the present study. Hydrogen is produced through the traditional steam reforming process and utilized during the hydrotreating and hydrocracking of bio-crude.
Sourcing CO2 from a biomass-based plant is expected to yield the best results in terms of life-cycle GHG emissions and renders the bio-crude production process carbon negative. The biomass-based CO2 supply scenario benefits from the carbon intake during biomass growth as well as the export of the excess electricity produced. The gasification process being more efficient than the biomass combustion process could significantly increase the production and export of electricity. This makes biomass gasification the lowest emission pathway for CO2 delivery from the viewpoint of carbon footprint. However, the economic considerations of gasification as compared to combustion must also be considered.
The conventional power plant-based scenarios, namely, scenarios 1 and 2, have life-cycle GHG emissions of 43 g CO2 eq./MJ refined bio-crude and 50 g CO2 eq./MJ refined bio-crude, respectively. The energy requirement of scenario 2 is slightly lower as compared to scenario 1. The reason for this lower energy requirement is the production of pressurized CO2 from the carbon capture unit. This, in turn, would reduce the compression energy required from the transportation of CO2 over 2 miles. Additionally, a higher capacity NGCC plant would be required in scenario 1 to meet this demand. Consequently, scenario 1 would have a higher amount of electricity exported during the night. Other emissions are similar for scenarios 1 and 2.
The life-cycle GHG emissions are expected to be the highest for scenario 3 where the CO2 is sourced from a purpose-built NGCC plant. Alternately, in scenarios 1 and 2, the CO2 production is deemed to be equal to sequestrating CO2 from the atmosphere. In the case of the conventional power plants (scenarios 1 and 2), all the CO2 emissions are allocated to electricity production. This assumption is based on the fact that, in the absence of the biorefinery, all the emissions would end up in the atmosphere. However, the power plant in scenario 3 would be built for supplying CO2 and energy to the biorefinery, and natural gas would be sourced for this purpose. The excess electricity produced from the NGCC unit is exported to the grid, assuming grid average GHG emissions of 500 g CO2 eq./kWh as a credit.
The GHG emissions associated with scenario 6 are 49 g CO2 eq./MJ refined bio-crude. This scenario has slightly higher energy requirements as compared to fossil fuel based scenarios (scenario 1 and 2), due to additional natural gas utilization in the DAC plant for the calciner as well as production of steam in the CHP unit. The powerplants assumed in scenarios 1 and 2 have all their emissions allocated to electricity production, and the emissions would end up in the atmosphere in the absence of the biorefinery. However, this is different for scenario 6, where the DAC plant is specifically built to supply the CO2 and energy to the biorefinery. The excess electricity produced from the DAC unit is exported to the grid, assuming grid average GHG emissions of 500 g CO2 eq./kWh. While scenario 1 captures emissions which would have normally been vented to the atmosphere, scenario 6 captures CO2 directly from the air as well as from the combustion of natural gas in the CHP and calciner. Thus, the overall life-cycle emissions for 1 MJ of refined bio-crude production are lower when sourcing the CO2 from a conventional coal plant when compared to a new DAC unit.
A sensitivity analysis of different scenarios was also performed. The distance between the biorefinery and the conventional fossil-based power plants does affect the life cycle GHG emissions for the refined bio-crude production. The sensitivity assumes a pressure drop of 0.055 bar for each mile. The increase in the GHG emissions with increasing distance is presented in Figure 4. Scenario 1 is more sensitive to the transportation distance as compared to scenario 2. This is because scenario 2 employs carbon capture. The regenerator of the carbon capture unit operates at elevated pressures, and the flowrate is significantly smaller once the nitrogen and other gases are removed. The increased distance between biorefinery and the power plant can also add a considerable economic burden.
The emissions from the production of refined bio-crude are sensitive to the GHG footprint of the grid to which electricity is exported. To better understand this variation, a sensitivity analysis is performed by varying the grid-average emissions from 50 to 750 g CO2 eq./kWh electricity. The results, shown in Figure 5 are that scenarios 3 and 5 are most sensitive to the grid electricity GHG footprint, whereas scenario 2 is the least sensitive. This is because scenarios 3 and 5 derive the maximum benefit from the export of electricity. The results highlight the need for performing a techno-economic analysis to gain a better understanding of both scenarios. If boreal biomass with a biomass growth cycle of 75 years is considered, the GHG footprint of refined bio-crude production would be 51.5 g CO2 eq./MJ refined bio-crude, which is very close to the GHG footprint of bio-crude produced from fossil-based CO2 sources as well as the DAC process. The primary reason for this is the GHG footprint of 0.58 kg CO2 eq./kg biomass for boreal biomass as compared to the GHG emissions of 0.138 kg CO2 eq./kg biomass for 11-year pine plantation thinnings. Thus, not all biomass feedstocks would provide similar GHG emissions benefits. Furthermore, the utilization of relatively efficient processes such as biomass gasification must be studied.
In previous work, [10] we evaluated the CO2 emissions of different CO2 sources. The results of that study, with biomass sourcing providing the lowest emissions and purpose-built natural gas sourcing providing the highest emissions, are reflected in the results here. In other previous work [21] we evaluated the life-cycle greenhouse gas emissions for ethanol produced in a similar process, for different CO2 sources; that study had similar findings: biomass is the lowest carbon CO2 source, existing fossil fuel power plants are an intermediate source, and purpose built natural gas power plants provide the highest fuel emissions. The process modeled here for direct air capture is a current-technology high emitting scenario powered by fossil fuel; more energy-efficient systems that use low-carbon energy sources have the potential to significantly lower the greenhouse gas emissions.

4. Conclusions

Sourcing CO2 from a biomass-based plant makes the bio-crude production process carbon negative. Delivery of CO2 from an existing coal based plant (scenario 1) has a better GHG footprint (43 g CO2 eq./MJ refined bio-crude) when compared to a purpose-built DAC system (49 g CO2 eq./MJ refined bio-crude). This scenario, however, limits the choice of location to the vicinity of existing powerplants. Building a new natural gas-based plant (scenario 3) for supplying CO2 to the biorefinery results in higher emissions compared to sourcing of CO2 from existing fossil fuels plants and is not recommended. The greenhouse gas emissions are very sensitive to the grid electricity carbon footprint. A techno-economic analysis for the six scenarios would provide additional information on the trade-offs. This study highlights the importance of CO2 sources for the sustainability of algal biorefineries.

Supplementary Materials

The following are available online at https://0-www-mdpi-com.brum.beds.ac.uk/article/10.3390/app112411931/s1. Figure S1: CO2 from a coal-based power plant; Table S1: Mass balance: CO2 from a coal-based power plant; Figure S2: CO2 from a natural gas-based power plant; Table S2:Mass balance: CO2 from a natural gas-based power plant; Figure S3: CO2 from an NGCC unit with carbon capture and refrigeration; Table S3: Mass balance: CO2 from an NGCC unit with carbon capture and refrigeration; Figure S4: CO2 from a biomass combustion plant; Table S4: Mass balance: CO2 from a biomass combustion plant; Figure S5: CO2 from a biomass gasification plant; Table S5: Mass balance: CO2 from a biomass gasification plant; Figure S6: CO2 from DAC; Table S6: Mass balance: CO2 from DAC.

Author Contributions

Conceptualization, P.A., R.R.C., M.J.R., V.M.T. and Y.Y.; Investigation, P.A.; Methodology, H.H. and V.M.T.; Software, P.A. and Y.Y.; Writing—original draft, P.A.; Writing—review & editing, R.R.C., M.J.R., V.M.T. and Y.Y. All authors have read and agreed to the published version of the manuscript.

Funding

This research was supported by the U.S. Department of Energy’s Office of Energy Efficiency and Renewable Energy (EERE) under the Bioenergy Technologies Office Award Number DE-EE0007690.

Institutional Review Board Statement

Not applicable.

Informed Consent Statement

Not applicable.

Data Availability Statement

A mass balance for all scenarios along with the assumptions undertaken are presented in the supplementary information.

Acknowledgments

This material is based upon work supported by the U.S. Department of Energy’s Office of Energy Efficiency and Renewable Energy (EERE) under the Bioenergy Technologies Office Award Number DE-EE0007690.

Conflicts of Interest

The authors declare no conflict of interest.

Disclaimer

This report was prepared as an account of work sponsored by an agency of the United States Government. Neither the United States Government nor any agency thereof, nor any of their employees, makes any warranty, express or implied, or assumes any legal liability or responsibility for the accuracy, completeness, or usefulness of any information, apparatus, product, or process disclosed, or represents that its use would not infringe privately owned rights. Reference herein to any specific commercial product, process, or service by trade name, trademark, manufacturer, or otherwise does not necessarily constitute or imply its endorsement, recommendation, or favoring by the United States Government or any agency thereof. The views and opinions of authors expressed herein do not necessarily state or reflect those of the United States Government or any agency thereof.

References

  1. Pérez-López, P.; de Vree, J.H.; Feijoo, G.; Bosma, R.; Barbosa, M.J.; Moreira, M.T.; Wijffels, R.H.; van Boxtel, A.J.B.; Kleinegris, D.M.M. Comparative life cycle assessment of real pilot reactors for microalgae cultivation in different seasons. Appl. Energy 2017, 205, 1151–1164. [Google Scholar] [CrossRef] [Green Version]
  2. Ubando, A.T.; Rivera, D.R.T.; Chen, W.H.; Culaba, A.B. A comprehensive review of life cycle assessment (LCA) of microalgal and lignocellulosic bioenergy products from thermochemical processes. Bioresour. Technol. 2019, 291, 121837. [Google Scholar] [CrossRef] [PubMed]
  3. Mu, D.; Ruan, R.; Addy, M.; Mack, S.; Chen, P.; Zhou, Y. Life cycle assessment and nutrient analysis of various processing pathways in algal biofuel production. Bioresour. Technol. 2017, 230, 33–42. [Google Scholar] [CrossRef] [PubMed]
  4. Patel, B.; Guo, M.; Shah, N.; Hellgardt, K. Environmental profile of algal Hydrothermal Liquefaction—A country specific case study. Algal Res. 2016, 16, 127–140. [Google Scholar] [CrossRef]
  5. Sun, C.H.; Fu, Q.; Liao, Q.; Xia, A.; Huang, Y.; Zhu, X.; Reungsang, A.; Chang, H.X. Life-cycle assessment of biofuel production from microalgae via various bioenergy conversion systems. Energy 2019, 171, 1033–1045. [Google Scholar] [CrossRef]
  6. Rickman, M.; Pellegrino, J.; Hock, J.; Shaw, S.; Freeman, B. Life-cycle and techno-economic analysis of utility-connected algae systems. Algal Res. 2013, 2, 59–65. [Google Scholar] [CrossRef]
  7. Porcelli, R.; Dotto, F.; Pezzolesi, L.; Marazza, D.; Greggio, N.; Righi, S. Comparative life cycle assessment of microalgae cultivation for non-energy purposes using different carbon dioxide sources. Sci. Total Environ. 2020, 721, 137714. [Google Scholar] [CrossRef] [PubMed]
  8. Cheng, F.; Porter, M.D.; Colosi, L.M. Is hydrothermal treatment coupled with carbon capture and storage an energy-producing negative emissions technology? Energy Convers. Manag. 2020, 203, 112252. [Google Scholar] [CrossRef]
  9. Somers, M.D.; Quinn, J.C. Sustainability of carbon delivery to an algal biorefinery: A techno-economic and life-cycle assessment. J. CO2 Util. 2019, 30, 193–204. [Google Scholar] [CrossRef]
  10. Arora, P.; Chance, R.; Hendrix, H.; Realff, M.; Thomas, V.M.; Yuan, Y. Life Cycle Greenhouse Gas Emissions of Different CO2 Supply Options for an Algal Biorefinery. J. CO2 Util. 2020, 40, 101213. [Google Scholar] [CrossRef]
  11. Keith, D.W.; Holmes, G.; St. Angelo, D.; Heidel, K. A Process for Capturing CO2 from the Atmosphere. Joule 2018, 2, 1573–1594. [Google Scholar] [CrossRef] [Green Version]
  12. Sanz-Pérez, E.S.; Murdock, C.R.; Didas, S.A.; Jones, C.W. Direct Capture of CO2 from Ambient Air. Chem. Rev. 2016, 116, 11840–11876. [Google Scholar] [CrossRef] [PubMed]
  13. McQueen, N.; Gomes, K.V.; McCormick, C.; Blumanthal, K.; Pisciotta, M.; Wilcox, J. A review of direct air capture (DAC): Scaling up commercial technologies and innovating for the future. Prog. Energy 2021, 3, 032001. [Google Scholar] [CrossRef]
  14. Chen, P.H.; Quinn, J.C. Microalgae to biofuels through hydrothermal liquefaction: Open-source techno-economic analysis and life cycle assessment. Appl. Energy 2021, 289, 116613. [Google Scholar] [CrossRef]
  15. Chance, R.; Roessler, P. Production of Biocrude in an Advanced Photobioreactor-Based Biorefinery; DOE Bioenergy Technologies Office (BETO): Washington, DC, USA, 2019. [Google Scholar]
  16. Staser, J. 2019 Project Peer Review; DOE Bioenergy Technologies Office (BETO): Washington, DC, USA, 2019; pp. 1–19. [Google Scholar]
  17. Davis, R.; Markham, J.; Kinchin, C.; Grundl, N.; Tan, E.; Humbird, D. Process Design and Economics for the Production of Algal Biomass: Algal Biomass Production in Open Pond Systems and Processing through Dewatering for Downstream Conversion; The National Renewable Energy Laboratory (NREL): Golden, CO, USA, 2016. [Google Scholar] [CrossRef] [Green Version]
  18. Jones, S.B.; Zhu, Y.; Anderson, D.; Hallen, R.T.; Elliott, D.C. Process Design and Economics for the Conversion of Algal Biomass to Hydrocarbons: Whole Algae Hydrothermal Liquefaction and Upgrading; Pacific Northwest National Laboratory (PNNL): Richland, WA, USA, 2014. [Google Scholar]
  19. Legere, E. Algenol Integrated Pilot-Scale Biorefinery Public Version Final Report; Algenol: Fort Myers, FL, USA, 2017. [Google Scholar]
  20. ecoInvent Data Quality Guideline for the Ecoinvent Database V 3.0; The ecoinvent Centre: St. Gallen, Switzerland, 2009; Volume 3.
  21. Arora, P.; Chance, R.; Fishbeck, T.; Hendrix, H.; Realff, M.; Thomas, V.M.; Yuan, Y. Lifecycle Greenhouse Gas Emissions for an Ethanol Production Process Based on Genetically Modified Cyanobacteria: CO2 Sourcing Options. Biofuels Bioprod. Bioprocess. 2020, 14, 1324–1334. [Google Scholar] [CrossRef]
  22. Heijungs, R.; Suh, S. The Computational Structure of Life Cycle Assessment Eco-Efficiency in Industry and Science; Springer: Dordrecht, The Netherlands, 2002; ISBN 9781402006722. [Google Scholar]
  23. IPCC Working Group 1. Summary for Policymakers. In Climate Change 2013: The Physical Science Basis. Contribution of Working Group I to the Fifth Assessment Report of the Intergovernmental Panel on Climate Change; Cambridge University Press: Cambridge, UK, 2013; p. 78. ISBN 9781107661820. [Google Scholar]
  24. Balcombe, P.; Anderson, K.; Speirs, J.; Brandon, N.; Hawkes, A. The Natural Gas Supply Chain: The Importance of Methane and Carbon Dioxide Emissions. ACS Sustain. Chem. Eng. 2017, 5, 3–20. [Google Scholar] [CrossRef]
  25. Guest, G.; Cherubini, F.; Strømman, A.H. Global Warming Potential of Carbon Dioxide Emissions from Biomass Stored in the Anthroposphere and Used for Bioenergy at End of Life. J. Ind. Ecol. 2013, 17, 20–30. [Google Scholar] [CrossRef]
  26. Liu, C.M.; Sandhu, N.K.; McCoy, S.T.; Bergerson, J.A. A life cycle assessment of greenhouse gas emissions from direct air capture and Fischer-Tropsch fuel production. Sustain. Energy Fuels 2020, 4, 3129–3142. [Google Scholar] [CrossRef] [Green Version]
Figure 1. Process flowsheet for refined bio-crude production from algae in base-case scenario.
Applsci 11 11931 g001
Figure 2. LCA assumptions and system boundary.
Applsci 11 11931 g002
Figure 3. GHG emissions results (kg CO2 eq.) for 1 MJ of refined bio-crude production for different CO2 supply scenarios.
Applsci 11 11931 g003
Figure 4. Sensitivity of power plant based CO2 supply with increasing distance from the biorefinery.
Applsci 11 11931 g004
Figure 5. GHG emissions sensitivity analysis.
Applsci 11 11931 g005
Table 1. Systems considered for providing CO2 to biorefinery.
ScenarioCO2 SourceTransport Distance (mi)Infrastructure RequiredExcess Electricity
1Coal based power plant2Pipelinemostly at night
2Natural gas power plant2CO2 capture facility, natural gas boiler, pipelinemostly at night
3NGCC plant with carbon capture and refrigeration0CO2 capture facility, natural gas boiler, refrigeration system, pipelineday and night
4Biomass combustion plant0Pipelineday and night
5Biomass gasification plant0Pipelineday and night
6Direct air capture plant0Pipelineday and night
Publisher’s Note: MDPI stays neutral with regard to jurisdictional claims in published maps and institutional affiliations.

