Article

A Numerical Analysis of the Influence of Nozzle Geometric Structure on Spontaneous Steam Condensation and Irreversibility in the Steam Ejector Nozzle

1
School of Mechanical Engineering and Automation, Northeastern University, Shenyang 110819, China
2
School of Engineering, RMIT University, Mill Park, VIC 3083, Australia
*
Author to whom correspondence should be addressed.
Submission received: 10 November 2021 / Revised: 28 November 2021 / Accepted: 13 December 2021 / Published: 15 December 2021
(This article belongs to the Special Issue Flow and Heat Transfer Research in Multiphase Flow and Porous Media)

Abstract

:
The spontaneous condensation of wet steam often occurs in the steam ejector nozzle, this deteriorates the performance of the steam ejector. In this paper, we take changing the geometric parameters of the nozzle as the focus of our research and construct an internal connection between steam’s condensation behavior and the nozzle’s throat radius, the nozzle’s divergent section expansion angle, and the nozzle’s divergent section length. Our numerical simulation results indicate that an increase in the throat diameter and reduction of the divergent section’s expansion angle can inhibit steam condensation behavior, to a certain extent. In particular, the steam condensation behavior will disappear at a 0° expansion angle, but it is not affected by the change in the divergent section’s length. In addition, the irreversibility that is seen under different changes to the nozzle’s structure parameters was investigated and the results show that the entropy generation that is caused by a phase change accounts for a much higher proportion of the total entropy generation than heat transport and viscous dissipation do. This indicates that steam’s condensation behavior makes a large amount of irreversible energy, resulting in energy waste and reducing the performance of the nozzle. Therefore, this study can provide a theoretical reference for suppressing the spontaneous condensation behavior of steam by changing the nozzle’s geometry.

1. Introduction

The steam ejector is a simple energy conversion device that is widely used in many industrial fields, such as power generation [1], refrigeration [2], the desalination of seawater [3], fuel cell applications [4], and steam generation systems [5]. As depicted in Figure 1, the steam ejector can convert a higher-pressure primary fluid and a lower-pressure secondary fluid into a mixed fluid of higher-pressure energy and then realize the vacuum effect in the mixing chamber. The nozzle of the steam ejector plays a key role in the above-mentioned process. Its function is to convert the higher-pressure energy of the primary fluid into greater kinetic energy, thereby providing a source of power for the operation of the entire steam ejector system. Therefore, the nozzle directly affects the efficiency of the entire steam ejector system.
The nozzle’s geometric structure has a great influence on the performance of the steam ejector and this has been confirmed by many researchers. Six nozzles with different throat diameters were used in a 1 kW steam ejector cooling capacity experimental system that was constructed by Ruangtrakoon et al. [6,7] and it was found that the geometries of the primary nozzle had strong effects on the steam ejector’s performance. Yang et al. [8] investigated the effects of nozzles with conical, oval, square, rectangular, and cross-shaped exit sections on a steam ejector’s performance by using the CFD method. They discovered that the steam ejector with the nozzle that had a cross-shaped exit section could achieve the largest entrainment ratio. Fu et al. [9] numerically investigated the effects of the primary nozzle’s outlet diameter on the performance of steam ejectors, the CFD results illustrated that the entrainment ratio initially increased sharply with the growth of the nozzle’s outlet diameter and then it would reduce when the diameter exceeded a certain value. The influence of the throat area ratio between the nozzle and the ejector on the efficiencies in the MED-TVC desalination system was also investigated by Liu et al. [3] and they noted that the mixing efficiency between the primary and secondary fluids and the entrainment ratio of the steam ejector could be improved by adjusting the throat area ratio between the nozzle and the ejector. Other key geometric parameters such as the nozzle’s exit position and the nozzle’s outlet diameter were optimized by Wu et al. [10] by using the CFD method. This research revealed that the nozzle outlet diameter was the most sensitive influencing factor for the performance of the steam ejector.
Apart from the nozzle’s geometric structure, the spontaneous condensation behavior of the steam that is in the nozzle also affects the performance of the steam ejector and this is a variable which attracts the attention of many researchers. Moore et al. [11] measured the pressure distribution within the nozzle’s condensation zone by conducting a wet-steam tunnel experiment as early as 1973. Subsequently, Moses and Stein [12] documented the homogeneous nucleation and growth of steam droplets using static pressure and laser light scattering methods. Gyarmathy [13] experimentally studied the nucleation characteristics of high-pressure saturated steam and determined the Wilson lines and the droplet size and number count that are present in Laval nozzles. Meanwhile, the influence of the Wilson point position was first theoretically explained in Wilson’s early experiments [14]. Bakhtar and Mohammadi Tochai [15] derived a set of numerical algorithms to be used for solving two-dimensional steam two-phase flows in a nozzle. The fundamental equations of gas–droplet multiphase flows were proposed by Young for the calculation of the non-equilibrium condensation of wet steam in nozzles and turbine cascades [16,17,18].
With the help of a CFD simulation, X. Wang et al. [19] predicted the flow characteristics of a wet steam flow in a nozzle and demonstrated that the steam’s condensation behavior could depress the efficiency of the nozzle and reduce the pumping performance of the steam ejector. Moreover, they also studied the effect of primary steam superheating on the steam condensation in a nozzle and the performance of the steam ejector [20]. Sharifi et al. [21,22] numerically studied wet steam flow in the nozzle of a steam ejector and found that the steam’s condensation behavior reduced the maximum value of the flow Mach number but improved the compression ratio and entrainment ratio of the steam ejector. In order to improve the accuracy of their numerical calculations, Ding et al. [23] implanted a set of codes based on Young’s classical nucleation rate and droplet growth rate into the CFD solver and found that it could finely predict the position of the Wilson point and the wet steam flow properties in a nozzle. Similarly, Abadi et al. developed in-house CFD code that was based on a two-fluid model in order to numerically study the supersonic flow of wet steam with a non-equilibrium phase change in a high-pressure nozzle [24] and high-pressure thermo-compressor [25]. A condensing steam flow mode with droplet size distribution in a Laval nozzle was also implemented into in-house CFD code by Wroblewski and Dykas [26]. A piece of Euler–Euler two-phase flow model code that was optimized by Yang et al. was validated to be able to capture the complicated condensation characteristics of water vapor in the Laval nozzle [27]. These researchers also found that wet steam flow in a nozzle would reduce the performance of the steam ejector more than dry steam. This was reflected in the entrainment ratio that decreased from a score of 0.6973 (which was obtained by the dry steam model) to 0.6242 (which was obtained by the wet steam model) under the given operation condition [28]. Using the multi-objective genetic algorithm method that is based on the modified condensation model, Zhang et al. [29] optimized the primary nozzle of a steam ejector in order to improve its entrainment ratio.
With regard to the aforementioned investigations into steam condensation in the nozzle of a steam ejector, these researchers have only paid attention to the impact of the spontaneous condensation behavior of steam on the inner flow and performance of the steam ejector and the optimization of numerical algorithms in order to improve the accuracy of CFD simulations. However, there are few studies on the influence of a nozzle’s geometric structure on its internal steam condensation behavior. Ariafar et al. [30] numerically investigated the wet steam flow in nozzles with area ratios of 11, 18 and 25. They observed that all of the nozzles’ static pressures that were obtained by the wet steam model were higher than those for the ideal gas model, while no significant difference existed in the nozzles’ momentum. C. Wang et al. [31] also increased the area ratio of the nozzle and found that it reduced the steam condensation’s intensity and nozzle’s pressure, but increased the liquid mass fraction.
In this article, a wet steam model with entropy generation rates that are relevant to three different mechanisms (viscous dissipation, heat transport, and phase change) was innovatively established in order to numerically study the behavior of wet steam condensation in a nozzle. Apart from the nozzles’ throat radii, the effects of the divergent section expansion angle and divergent section length of the nozzle on the spontaneous condensation of steam were investigated. Importantly, the distributions of the entropy generation areas in the nozzles with different geometric structures were visualized for the first time. Finally, the relationships between the nozzle’s mass flow rate, total entropy production and the liquid mass fraction of the nozzle for three types of geometric structures were established.

2. Mathematical Models Description

2.1. Governing Equation

The internal steam flow of a nozzle is governed by the compressible steady-state axisymmetric form of the fluid flow conservation equation. The Navier–Stokes equations are more suitable for variable density flows [32]. The total energy equation, including viscous dissipation, was considered and coupled with the gas law. The governing equations of continuity, momentum, and energy can be written as follows:
The continuity equation:
ρ t + x i ( ρ u i ) = 0
The momentum equation:
t ( ρ u i ) + x j ( ρ u i u j ) = P x i + τ i j x j
The energy equation:
t ( ρ E ) + x j ( u j ( ρ E + P ) ) = x j ( α e f f T x j ) + x j ( u i τ i j )
ρ = P R T
τ i j = μ e f f ( u i x j + u j x i ) 2 3 μ e f f u k x k δ i j
where ui, uj, uk are components of the velocity, τij is the stress tensor of the fluid, E is the fluid energy, αeff is the effective thermal conductivity, μeff is the effective viscosity of the fluid, and δij is the unit tensor.

2.2. Turbulence Modeling

The k-ω SST turbulence model was adopted in this study based on its higher prediction accuracy for global and local flow phenomena, which has been confirmed by many researchers [33,34,35,36]. It can be described as below [37]:
x i ρ k u i = x j ( Γ k k x j ) + G k Y k + S k
x j ρ ω u j = x j ( Γ ω ω x j ) + G ω Y ω + D ω + S ω
where k is the turbulent kinetic energy and ω is the specific dissipation rate. Definitions of the terms G, Y, S, and D can be found in Ref. [37].

2.3. Wet Steam Flow Transport Equation

2.3.1. Liquid Phase Mass Fraction Transport Equation

The transport equation governing the mass fraction of the condensed liquid phase is written as [38]:
( β ρ ) t + x i ( ρ β u i ) + x j ( ρ β u j ) = Γ
where Γ is the mass generation rate due to condensation and evaporation, which is correlated to the nucleation rate I (the number of new droplets per unit volume per second) and the growth or demise of these droplets [38]:
Γ = 4 3 π ρ l I r * 3 + 4 π ρ l η r ¯ 2 r ¯ t
where r* is the critical droplet radius, above which the droplet will grow and below which the droplet will evaporate. This can be written as [17]:
r * = 2 σ ρ l R T ln ( s )
In the above expression, s is defined as the ratio of the steam pressure to the saturation pressure corresponding to steam temperature:
s = P P s a t ( T )

2.3.2. Nucleation Rate Equation

In this study, the classical theory of nucleation that is based on the homogeneous nucleation theory was used to calculate the number of liquid droplets; it is written as below [17]:
I = q c ( 1 + θ ) ρ v 2 ρ l 2 σ M 3 π exp 4 π r * 2 σ 3 K b T
where θ is a non-isothermal correction factor, which is given by [17]:
θ = 2 ( γ 1 ) ( γ + 1 ) ( h l v R T ) ( h l v R T 0.5 )
where γ is the ratio of the specific heats and it is taken as 1.32.
The wet steam’s density can be determined from the vapor density ρ v and liquid phase mass fraction β . This equation is written as:
ρ = ρ v 1 β

2.3.3. Droplet Growth Rate

The size of the droplets is affected by two mechanisms: the transfer of mass from the vapor to the droplets and the transfer of heat from the droplets to the vapor in the form of latent heat [38]. This can be written as:
r ¯ t = P h l v ρ l 2 π R T γ + 1 2 γ c p ( T d T )

2.3.4. Droplet Density Transport Equation

The density of the droplets’ transport equation was obtained from Ref. [37] and is described as
( ρ η ) t + x i ( ρ η u i ) + x j ( ρ η u j ) = ρ I
where η is the number of droplets per unit volume. This can be expressed as:
η = β ( 1 β ) V d ( ρ l / ρ v )
In this equation, Vd is the average droplet volume, which is defined as:
V d = 4 3 π r ¯ 3

2.3.5. Equation of State

The wet steam equation of state, which relates the pressure to the vapor density and temperature, is given by [16]:
P = ρ v R T ( 1 + B ρ v + C ρ v 2 )
where B and C are the second and third viral coefficients, respectively, and are functions of temperature.
Besides this equation, the wet steam isobaric specific heat capacity Cp, specific enthalpy h, and specific entropy s are described as below [17], respectively:
C p = C p 0 ( T ) + R ( 1 α v T ) ( B T d B d T ) T 2 d 2 B d T 2 ) ρ v + ( 1 2 α v T ) C + α v T 2 d C d T T 2 d 2 C d T 2 / 2 ρ v 2
h = h 0 ( T ) + R T ( B T d B d T ) ρ v + ( C T d C d T / 2 ) ρ v 2
s = s 0 ( T ) + R ln ρ v + ( B + T d B d T ) ρ v + ( C + T d C d T / 2 ) ρ v 2
where Cp0, h0, s0 are the standard state isobaric specific heat capacity, enthalpy, and entropy, respectively.

2.4. Entropy Generation Rate

In this article, the total entropy generation rate of a wet steam flow is defined as:
S g e n = S g e n , μ + S g e n , h + S g e n , l
The entropy generation rates of viscous dissipation Sgen,μ and convection heat transfer Sgen,h are used and described as the sum of the part of the total amount of entropy that is generated by the mean gradients component and the other part that is generated by the fluctuating component [38]:
S g e n , μ = S g e n , μ m e a n + S g e n , μ f l u c
S g e n , h = S g e n , h m e a n + S g e n , h f l u c
where Sgen,μ is the entropy generation rate that is produced by viscous dissipation and the Sgen,h originated from the heat transfer. The entropy generation rates of the mean gradients are given as:
s g e n , h m e a n = k T 2 T x 2 + T y 2 + T z 2
s g e n , μ m e a n = μ T 2 u i x 2 + u j y 2 + u z z 2 + u i y + u j x 2 + u i z + u z x 2 + u j z + u z y 2
and the fluctuating ones are written as:
s g e n , h f l u c = α T α s g e n , h m e a n
  S g e n , μ f l u c = ρ ε T
Besides this, the phase change generation rate can be expressed as [39]:
S g e n , l = Γ h l v ( 1 T v 1 T l )

3. Numerical Modeling

3.1. The Dimensions of the Nozzle and Numerical Solution Settings

In this study, the nozzle B from the works of Moore et al. [11] was selected as the original structure (see Table 1) that was used in order to investigate the effects of the throat radius, expansion angle of the divergent section, and length of the divergent section on the steam’s spontaneous condensation. The structures of the nozzles with different throat radii, expansion angles, and divergent section lengths are shown in Figure 2; all the geometric parameters are summarized in Table 1.
In terms of the numerical solution settings, the commercial software Ansys Fluent 15.0, with an implicit density-based solver, was used to solve the flow-governing equations and the wet steam model was selected. The conservation Equations (1)–(5) for the vapor phase were directly solved in the Fluent solver, while the governing Equations (6)–(22) for the liquid phase and the phase change were performed when the wet steam model was called in the solver. The Equations (23)–(30) were implanted into the Fluent solver by UDS and UDF functions and then the entropy generation rate and entropy production rate (the volume integrals for the entropy generation rate) could be solved in every cell of the computational domain and displayed in the post-processing stage. The k-ω SST turbulence model was used. This model did not need the wall function to be set based on its special algorithm [32].
To save computing costs and time, a 2D axisymmetric geometry was adopted instead of a 3D geometry. It has been proven that there is no obvious difference between the two calculation results [40]. The nozzle inlet and outlet were set to the pressure inlet and outlet, respectively. The wall was set to adiabatic and no-slip. All the initial boundary conditions, boundary condition settings, and properties of the working fluid are listed in Table 2, Table 3 and Table 4, respectively. The second-order upwind scheme was selected for all of the convection terms and central difference discretization was selected for the diffusion terms. The mass flow rate difference between the inlet and outlet and all of the calculated residuals needed to be less than 10−6 in order to ensure iteration convergence.

3.2. Grid Independence and Validation of the Numerical Approach

The structured grid of nozzle B is presented in Figure 3. To verify the grid’s independence, three grid levels were selected; a coarse level with 10k cells, a medium-level with 20k cells, and fine level with 41k cells. As illustrated in Figure 4, the droplet nucleation rates of the three grid levels are depicted under the initial boundary condition of nozzle B in Table 2 with the original structure of nozzle B. This reveals that there is a good level of consistency between the medium and fine grid levels. Considering the computational cost and efficiency, the medium-level grid was adopted. In order to further improve the calculations’ accuracy, we refined the medium-level mesh in the near-wall area and the region with large pressure gradient variation, as shown in the partially enlarged views in Figure 3. Finally, the grids with 26,784 cells were used to complete the following numerical simulation. Simultaneously, the wall Y plus value was also controlled at around 1 (see Figure 3).
To identify the simulation’s accuracy, the axial static pressure distributions of three nozzles from an experiment that was carried about by Moore et al. [11] under their corresponding boundary conditions (see Table 2) and geometric structures (see Figure 5d) were used, as illustrated in Figure 5. It was found that the CFD results are in close agreement with the present experiment’s data. In particular, the wet steam model can accurately predict the onset position and the peak of the condensation shock. Moreover, the average relative error between the simulation result and the experiment value was also calculated and is shown in Figure 5. The average relative error can be obtained by Equation (31):
Average   relative   error   ( % )   = 1 n n = 1 n ( E x p v a l u e C F D r e s u l t ) / E x p v a l u e
Among these three nozzles, the biggest average relative error (2.55) and maximum relative error (4.43) were both generated in nozzle C (see Figure 5c). While the smallest average relative error and maximum relative error were 1.77 in nozzle B (see Figure 5b) and 3.96 in nozzle A (see Figure 5a), respectively. This shows that these errors are acceptable and that the wet steam model can fully predict the internal flow process and illustrate the steam condensation phenomenon in a nozzle.

4. Results and Discussion

4.1. The Influence of Nozzle Geometry on Internal Steam Condensation

4.1.1. Nozzle Throat Radius

As steam flows through a nozzle, it expands rapidly and is accompanied by spontaneous condensation. In the flow process of wet steam’s spontaneous condensation, the free energy barrier of the molecules does not cause the steam molecules to aggregate and condense immediately, which results in the steam continuing to expand beyond the saturation line and deviating from the equilibrium state. Take a nozzle with the throat radius of 0.05 m as an example, as the steam flows from the convergent section to the divergent section, the temperature falls rapidly in the convergent section but a significant temperature step occurs upstream of the divergent section (see Figure 6a). This can be attributed to the release of the latent heat that has been generated by the steam condensing. At the same time, this latent heat heats the surrounding steam and causes an abrupt increase in pressure (Figure 6b) and the Mach number (Figure 6c) at the same position as the temperature step; this is an effect that is known as the condensation shock. The steam saturation ratio that is described by Equation (11) reflects the transition of the steam from the equilibrium state (Sr = 1) to the non-equilibrium state (Sr 1). As shown in Figure 6d, the saturation ratio remained almost at 1 in the convergent section, while it suddenly increased to the peak value at the position of condensation shock and then rapidly dropped to 1 in the divergent section. As a result of this, massive droplet cores were formed in the condensation shock position when the saturation ratio was big enough to make the steam molecules overcome their intermolecular rejection of coming together. The droplets’ nucleation ratio, in Figure 6e, reflects the fact that the massive droplet cores were generated in the condensation shock region and that, after crossing this condensation shock wave, there was no droplet core appearing in the divergent section. After the droplets’ nucleation ratio dropped from the peak value of approximately log1022.5 to zero, the number of droplets per unit volume was kept constant in the divergent section, as illustrated in Figure 6f.
Moreover, the liquid mass fraction started to rise until it reached its maximum at the nozzle outlet in the divergent section, as depicted in Figure 6g. It is worth noting that the curve of the liquid mass fraction can be divided into two parts: the rapid nucleation zone with slope 1 and the droplet growth zone with slope 2, as presented by the schematic diagram in Figure 6g. Obviously, slope 1 is larger than slope 2. In the rapid nucleation zone, the reason for the steepness of slope 1 of the liquid mass fraction curve is that the massive droplets nucleated, which resulted in the liquid mass fraction (Figure 6g) and droplets’ average radius (Figure 6h) increasing sharply in this zone. However, in the droplet growth zone, the droplets’ nucleation ratio (Figure 6e) was zero and the droplets per unit volume (Figure 6f) also trended to a constant, which led to those steam molecules that were present in a free state condensing gradually on the droplet cores. Since the droplet growth process was much slower than the nucleation process, this made slope 2 of the liquid mass fraction curve smaller than slope 1. It is also not hard to infer that the average droplet radius grows much slower in the droplet growth zone than it does in the rapid nucleation zone, as shown in Figure 6h.
In general, the wet steam condensation phenomenon under other throat radii has similar characteristics to that which is found under the throat radius of 0.05 m, as shown in Figure 6. However, as the throat radius increased from 0.025 to 0.05 m, there were some differences in the following aspects: The peak position of the condensation shock moved further downstream, as illustrated in Figure 6c. The intensity of the condensation shock was also strengthened, which was reflected in the pressure step change (see Figure 6b). In addition, Figure 6d and e show that the saturation ratio (which was larger than 1) and the droplet nucleation ratio (which was larger than 0) were both enlarged along the axis; meanwhile, the peak values of these two parameter curves decreased with the increase of the throat radius. As seen from Figure 6g, the liquid mass fraction in the divergent section under the throat radius of 0.05m was smaller than that of the others, which can contribute to this radius resulting in the least number of droplets per unit volume (see Figure 6f), although an average droplet radius of 0.0175 μ m can be acquired under the throat radius of 0.05 m.

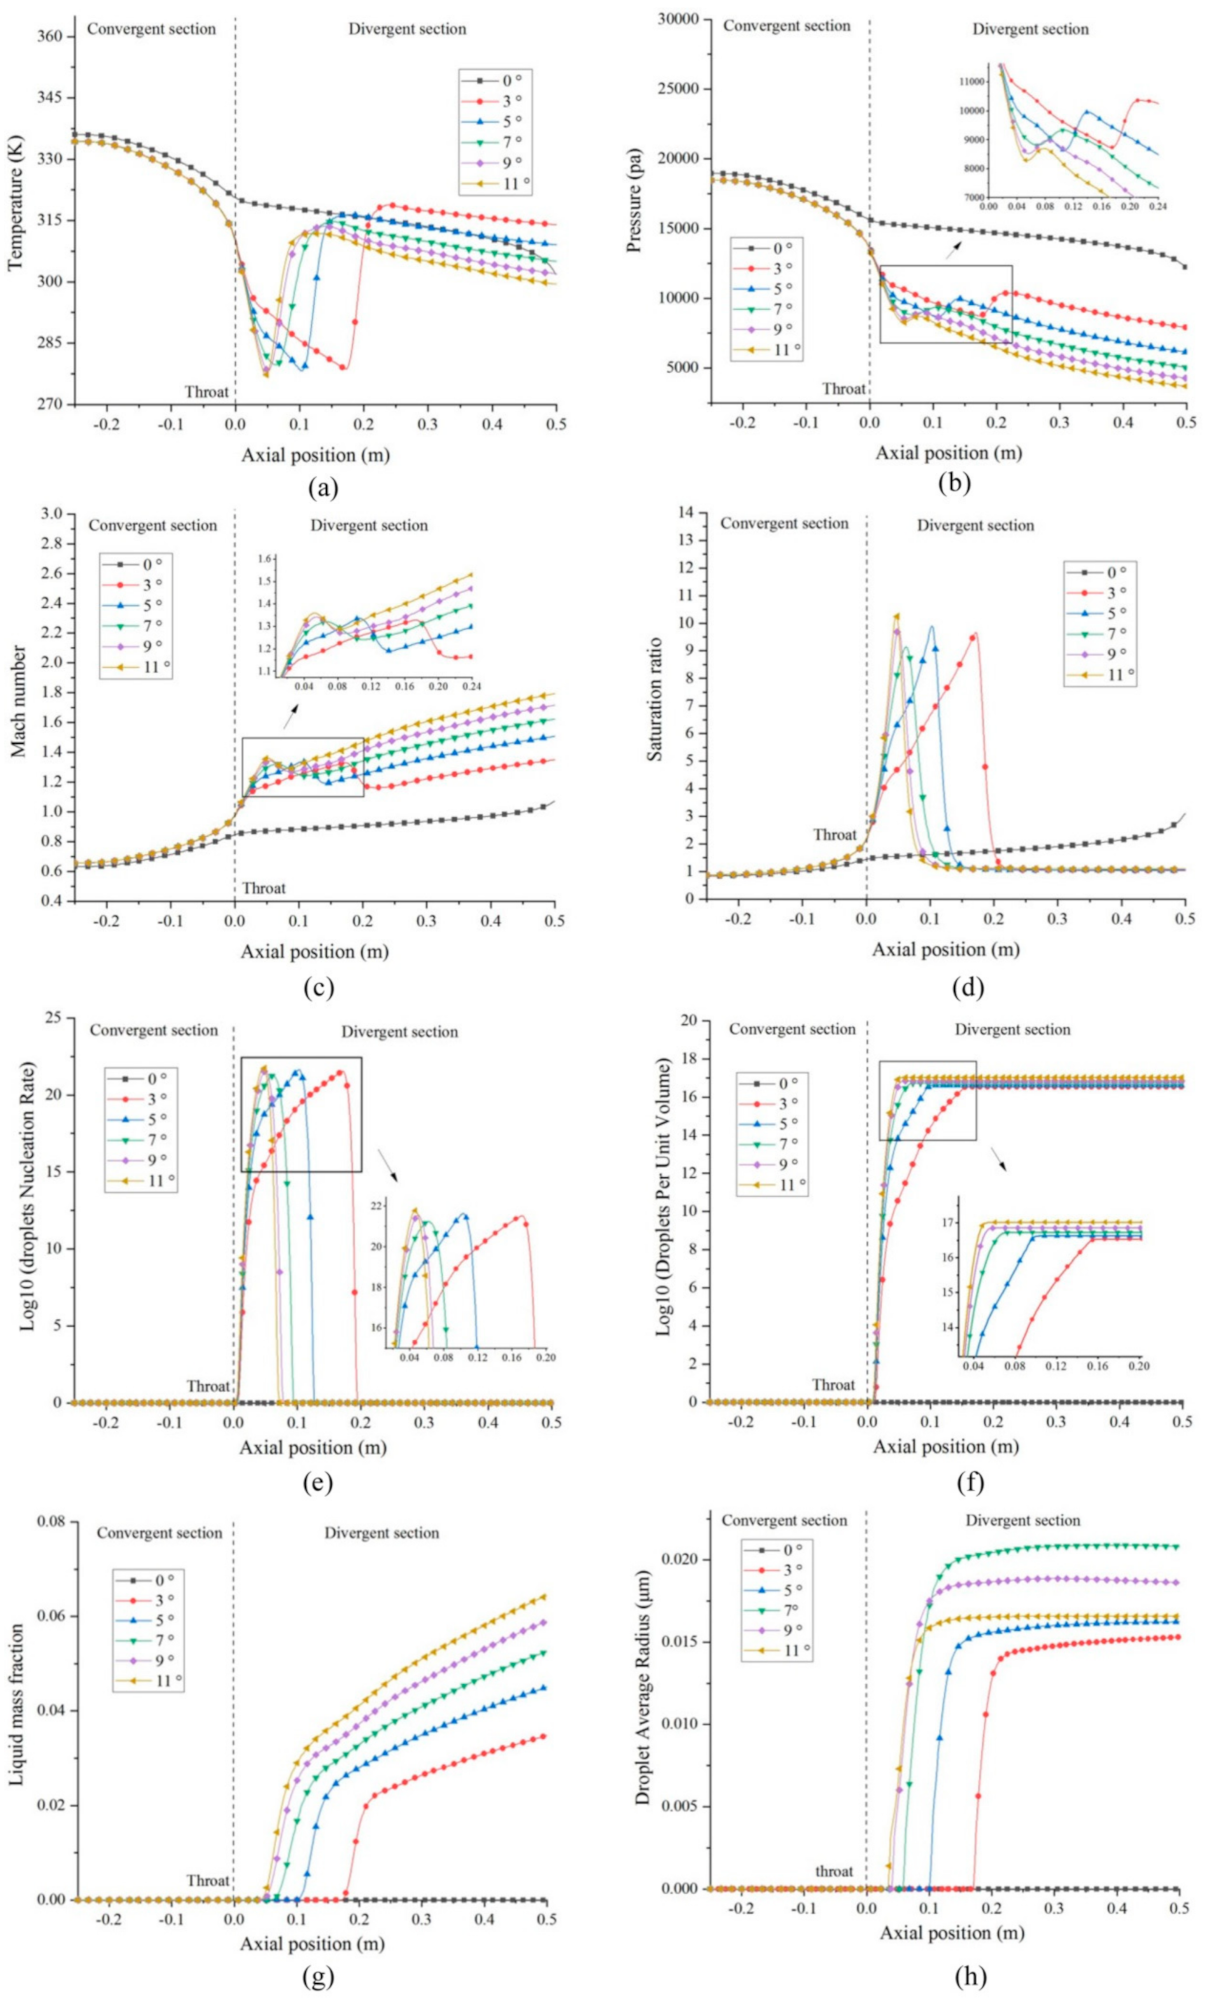
4.1.2. Expansion Angle of the Nozzle’s Divergent Section

As shown in Figure 7, when the expansion angle of the nozzle’s divergent section changes from 0° to 11°, the steam parameters in the nozzle also change to varying degrees. Except for the nozzle with a 0° expansion angle, the steam parameters of the nozzles with other expansion angles had the same changing trends along the axis: continued expansion as the steam passed through the nozzle, a rapid drop in the temperature in the nozzle’s convergent section, and the sudden appearance of a temperature step near the nozzle’s throat (Figure 7a), which indicates that steam condensation had occurred and a large amount of latent heat was released. The condensation shock that was formed by the steam’s condensation resulted in a pressure rise and Mach number reduction in the location of the steam condensation, as illustrated in Figure 7b,c. The droplets’ nucleation ratio (Figure 7e) reveals that massive droplet cores were generated, due to the higher saturation ratio (Figure 7d) in the steam condensation zone. Therefore, the formation of these droplet cores sharply increased the liquid mass fraction and the average droplet radius in the rapid nucleation zone, as shown in Figure 7g. Additionally, the volume of droplets per unit remained constant in the divergent section (see Figure 7f), which also caused a slight increase in the average droplet radius (Figure 7h) of the droplets in the droplet growth zone. This is because the steam molecules that were in a free state condensed on the droplet cores, as discussed in Section 4.1.1. In particular, for the nozzle with a 0° expansion angle, the steam hardly condensed at all, resulting in the droplets’ nucleation rate, droplets per unit volume, droplets’ average radius and liquid mass fraction all equaling zero, as seen in Figure 7.
As shown in Figure 7, we also learned that the enlargement of the nozzle’s divergent section’s expansion angle reduced the intensity of the condensation shock wave and moved the position of the condensation shock forward (see the enlarged view in Figure 7b,c). The regions of the steam saturation ratio that were larger than 1 and the droplets’ nucleation ratio that were larger than 0 were both reduced in accordance with the increase in the throat expansion angle, as depicted in Figure 7d,e. However, the droplets per unit volume (Figure 7f) increased with the enlargement of the expansion angle, which infers that enlarging the expansion angle of the nozzle’s divergent section will increase the mass fraction of the liquid phase (Figure 7g), thereby increasing the humidity of the nozzle outlet. As a consequence, we should reasonably reduce the expansion angle of the nozzle’s divergent section in order to alleviate the adverse effect of steam’s spontaneous condensation in the nozzle.

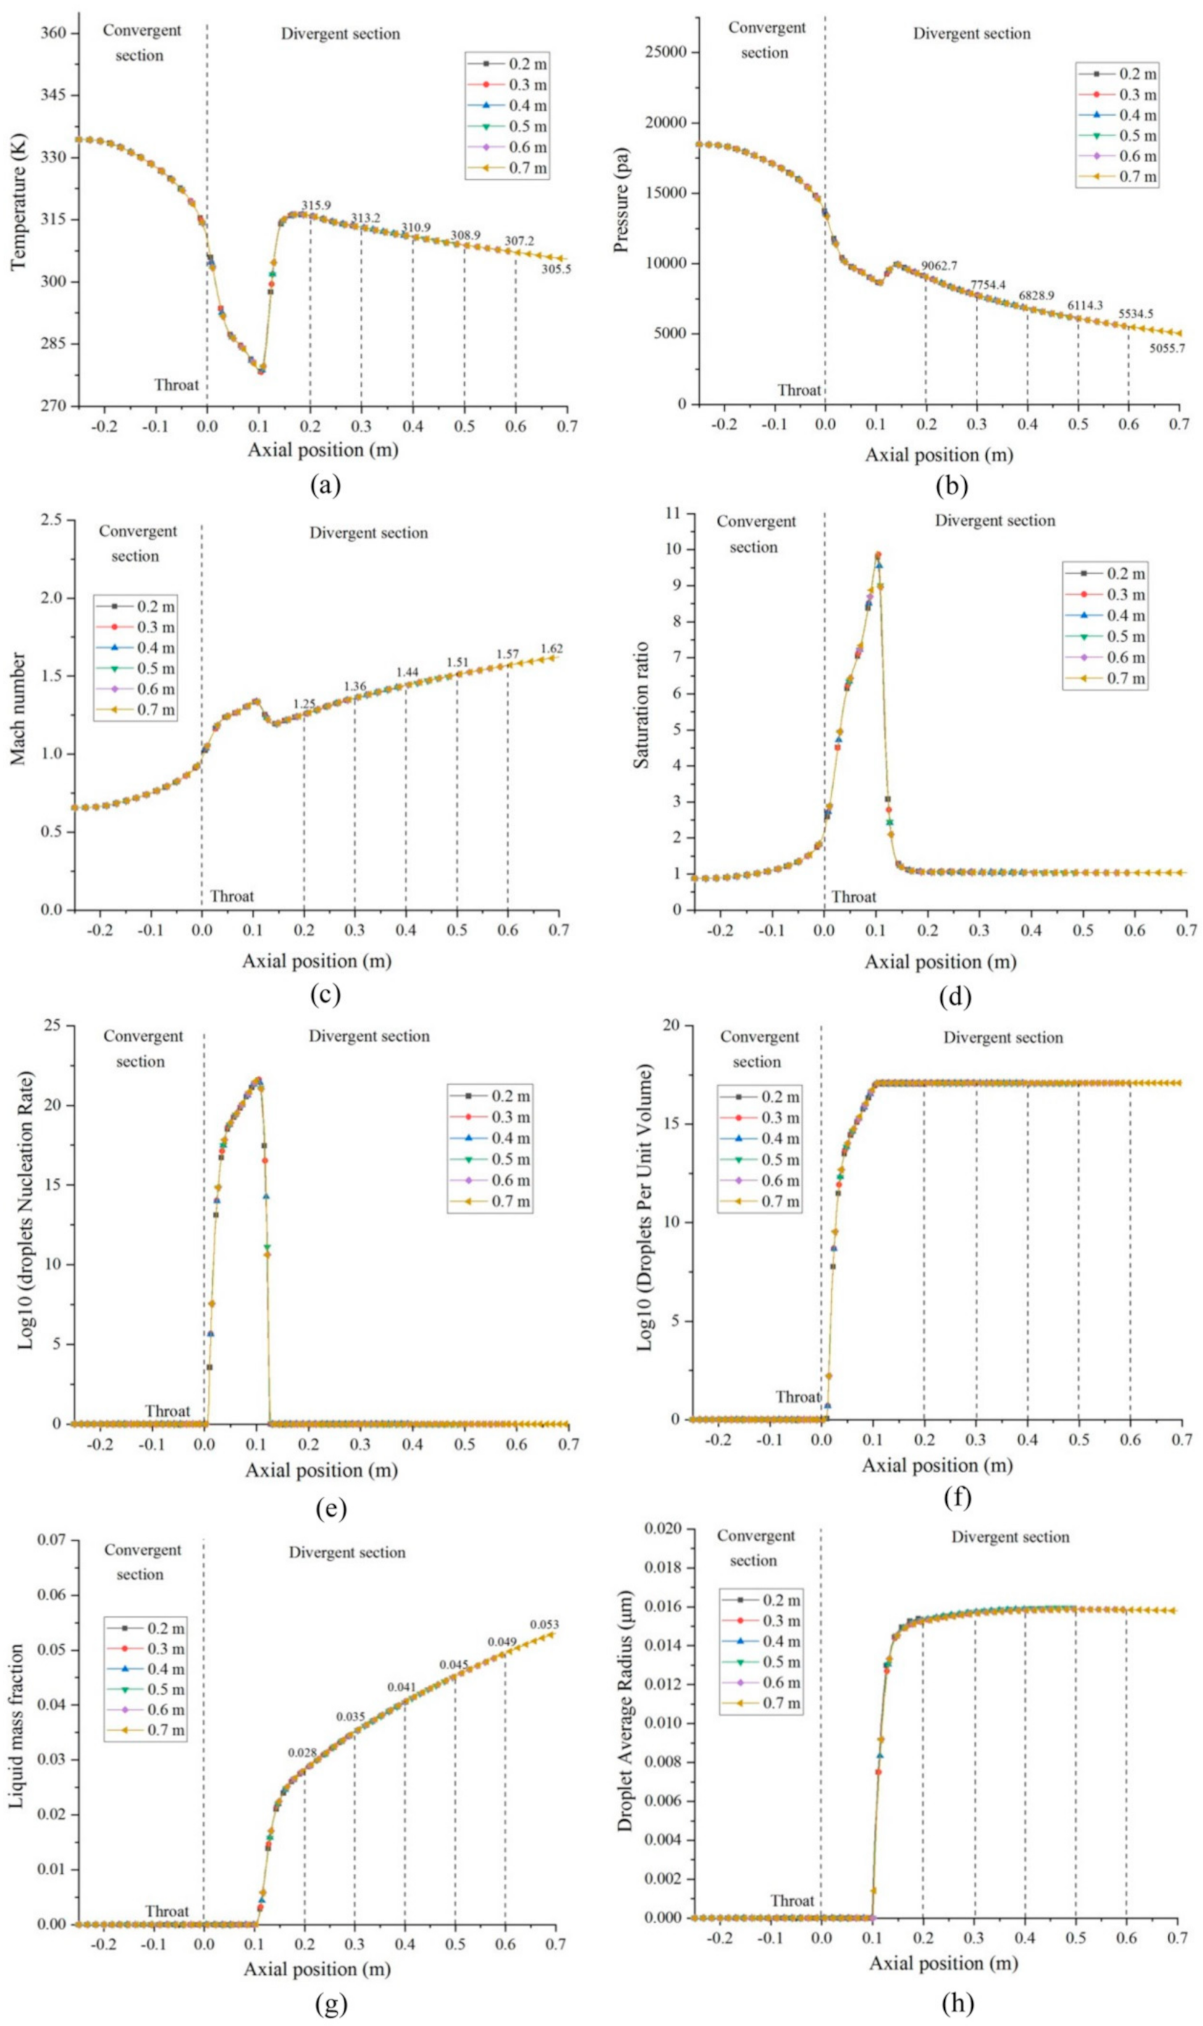
4.1.3. Length of the Nozzle’s Divergent Section

To investigate the effect of a nozzle’s divergent section length on steam condensation, we selected six different lengths (0.2, 0.3, 0.4, 0.5, 0.6, and 0.7 m). As can be seen in Figure 8, all of the steam parametric curves were completely overlapped. The only difference was found in those parameter values that were positioned at the nozzle’s outlet. Figure 8a demonstrates that the steam condensation released the same amount of latent heat (i.e., the same temperature step) under the different nozzles’ divergent section lengths. All of the parametric curves had the same condensation shock position and shock intensity, as illustrated in Figure 8b,c. As the nozzle’s divergent section was lengthened, the pressure value at the nozzle’s outlet gradually decreased. Compared with the pressure value, the nozzle outlet’s Mach number showed the opposite result.
Due to the release of the same amount of latent heat from the steam condensation, the same saturation ratio (Figure 8d) and droplets’ nucleation ratio (Figure 8e) were formed under the different nozzles’ divergent section lengths. The same curves of these two parameters will inevitably lead to the same curve for the droplets per unit volume, as shown in Figure 8f. Figure 8g illustrates that the liquid mass fraction of the nozzle’s outlet increased with the increase in the nozzle’s divergent section length, which can be attributed to the increase in the droplet number in the nozzle. This is the product of the volume of the nozzle’s divergent section and the number of droplets per unit volume.

4.2. Irreversibility Analysis under Different Nozzle Geometries

In this section, the entropy generation rate is investigated in order to identify where the irreversibility occurs, the type of entropy generation, and its effect on the nozzle’s performance.

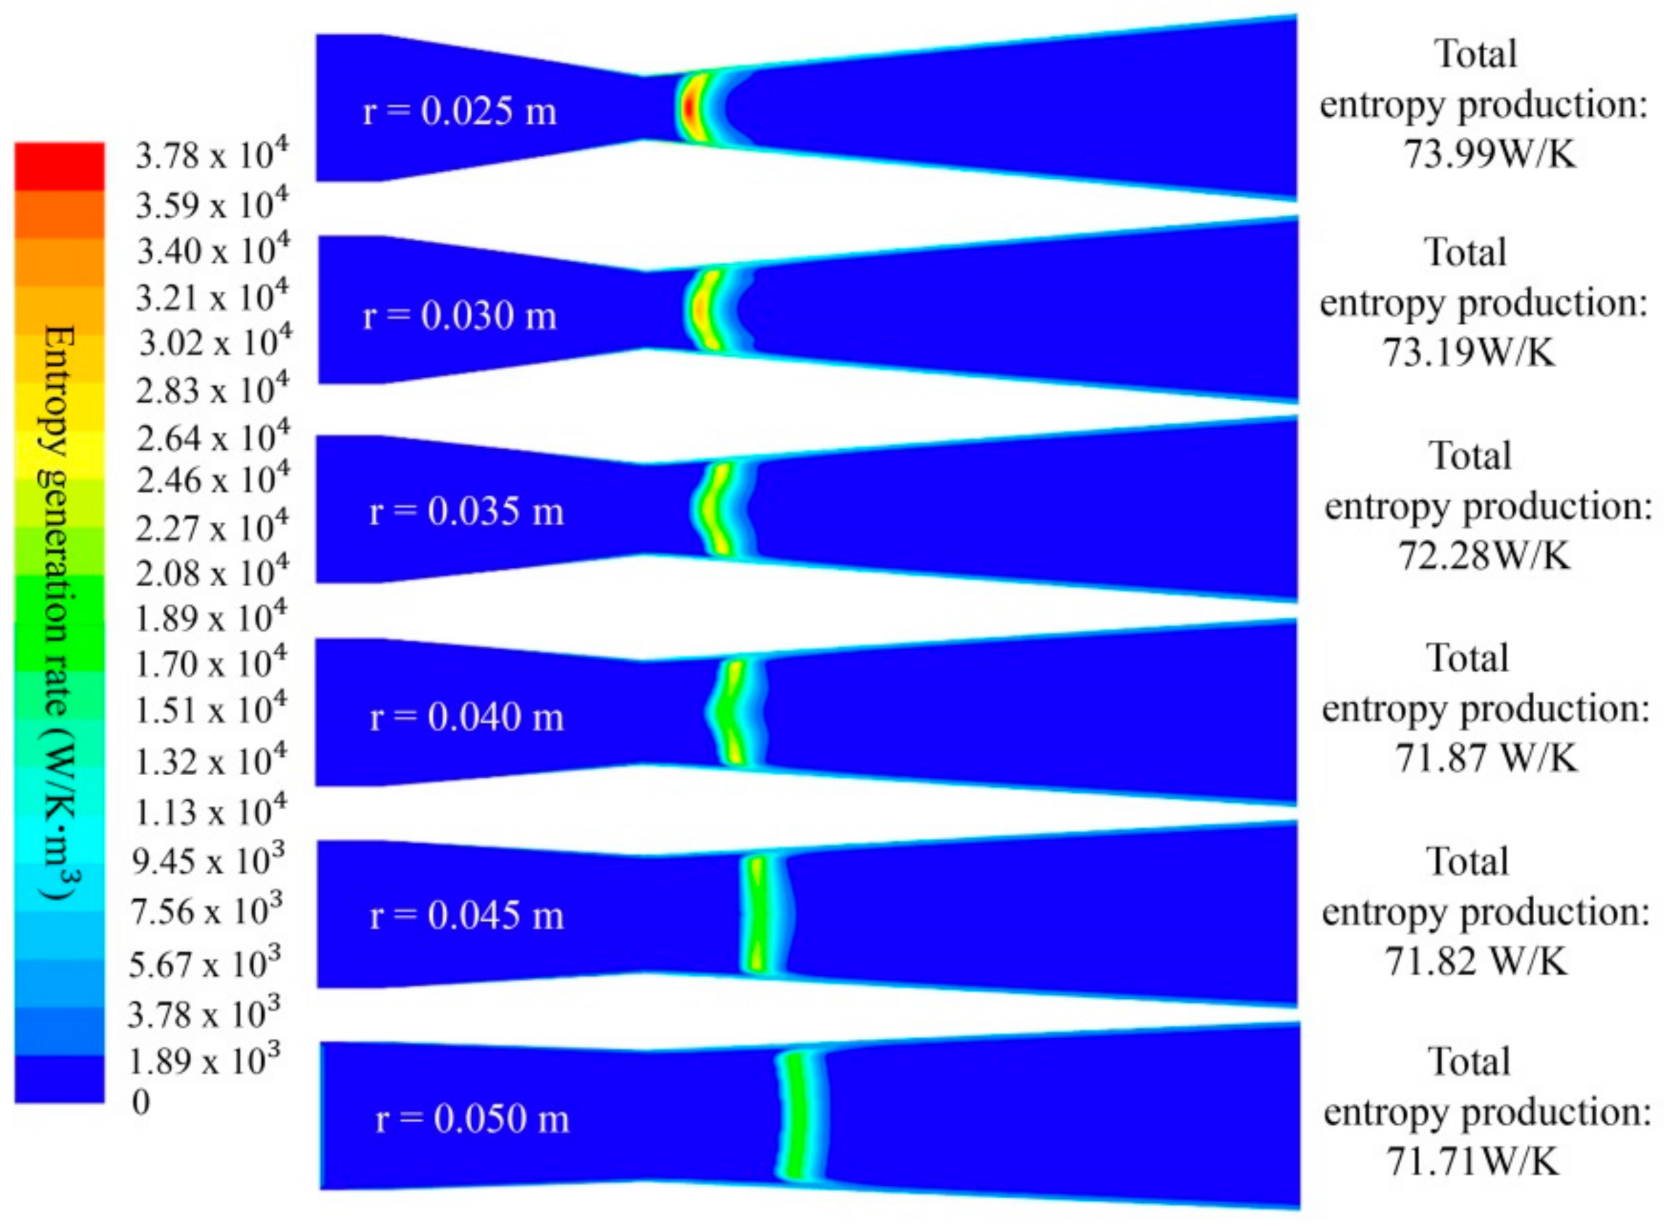
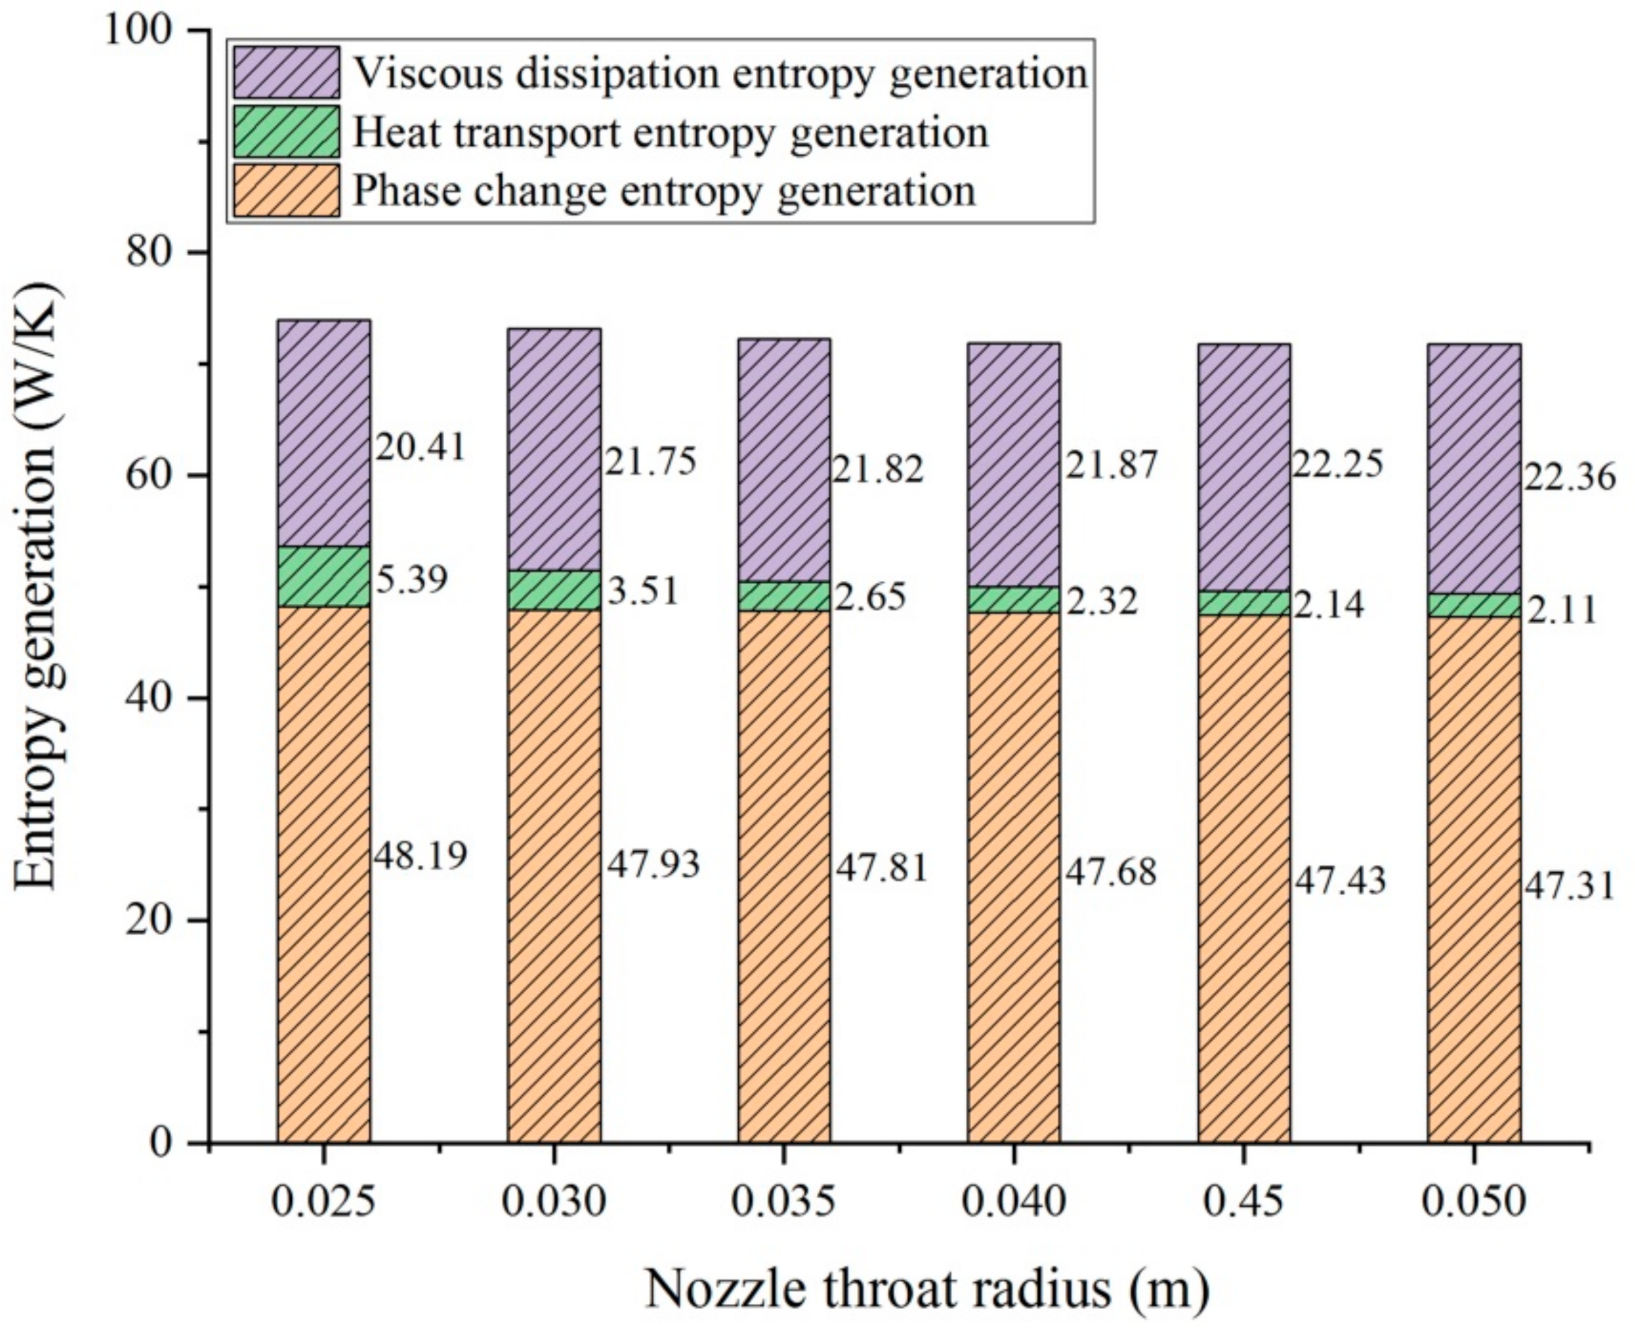
4.2.1. Nozzle Throat Radius

It can be seen from Figure 9 that the total entropy generation rate was mainly generated and concentrated at the nozzle’s throat. The area of the entropy generation rate gradually increased with the increase in the throat radius, but the peak value of the total entropy generation rate decreased. This directly caused the total entropy production (the volume integrals for the total entropy generation rate) to decrease from 73.99 W/K under a throat radius of 0.025 m to 71.71 W/K under a throat radius of 0.05 m. Moreover, the position of the total entropy generation rate concentration region gradually moved downstream of the nozzle’s divergent section.
Three types of entropy generation make up the total entropy production: viscous dissipation, heat transport, and phase change entropy generation. These are illustrated in Figure 10 in the form of a stacked column chart. It was found that phase change entropy generation accounted for the largest proportion of entropy, followed by viscous dissipation, and then heat transport. This was found to be true under all of the different nozzle throat radii conditions. The viscous dissipation and the phase change entropy generation were mainly generated in the steam condensation shock region, whereas the heat transport entropy generation was mostly produced at the boundary between the liquid phase and gas phase. As shown in Figure 10, the heat transport and the phase change entropy generation gradually reduced, while the viscous dissipation entropy generation increased with the increase in throat radius. Heat transport and phase change entropy generation reduced from 48.19 and 5.39 W/K to 47.31 and 2.11 W/K, respectively. The viscous dissipation entropy generation increased from 20.41 W/K (the original value) to 22.36 W/K. It is worth noting that the reduction of the phase change entropy generation caused the decrease of the liquid mass fraction and the suppression of the steam’s condensation. In addition, it can be more clearly seen from Figure 11 that the liquid mass fraction and the total entropy production both reduced when the nozzle throat radius increased from 0.025 to 0.05 m, but the opposite result was obtained in terms of the mass flow rate. This indicates that properly increasing the nozzle throat radius is beneficial to improving the performance of the nozzle, suppressing the intensity of the spontaneous condensation of steam and reducing energy waste.

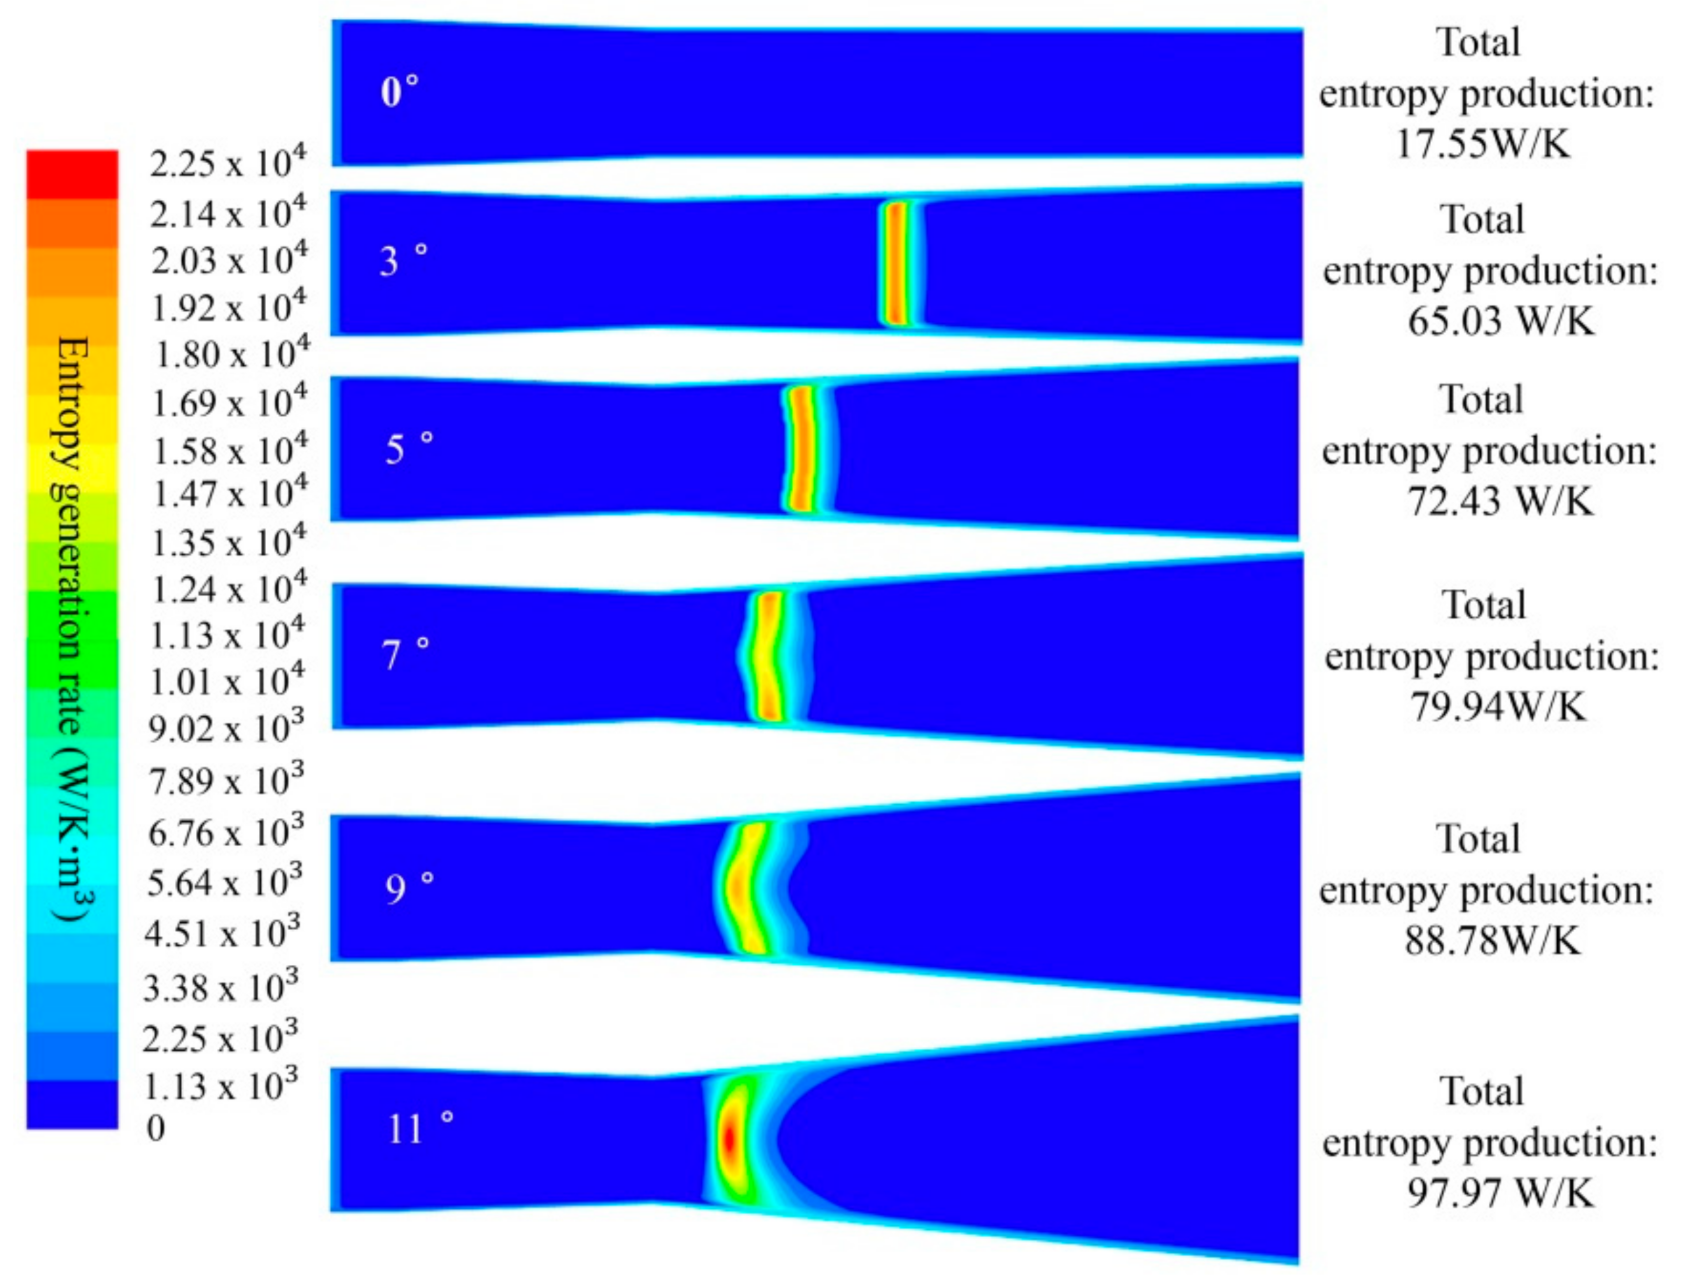
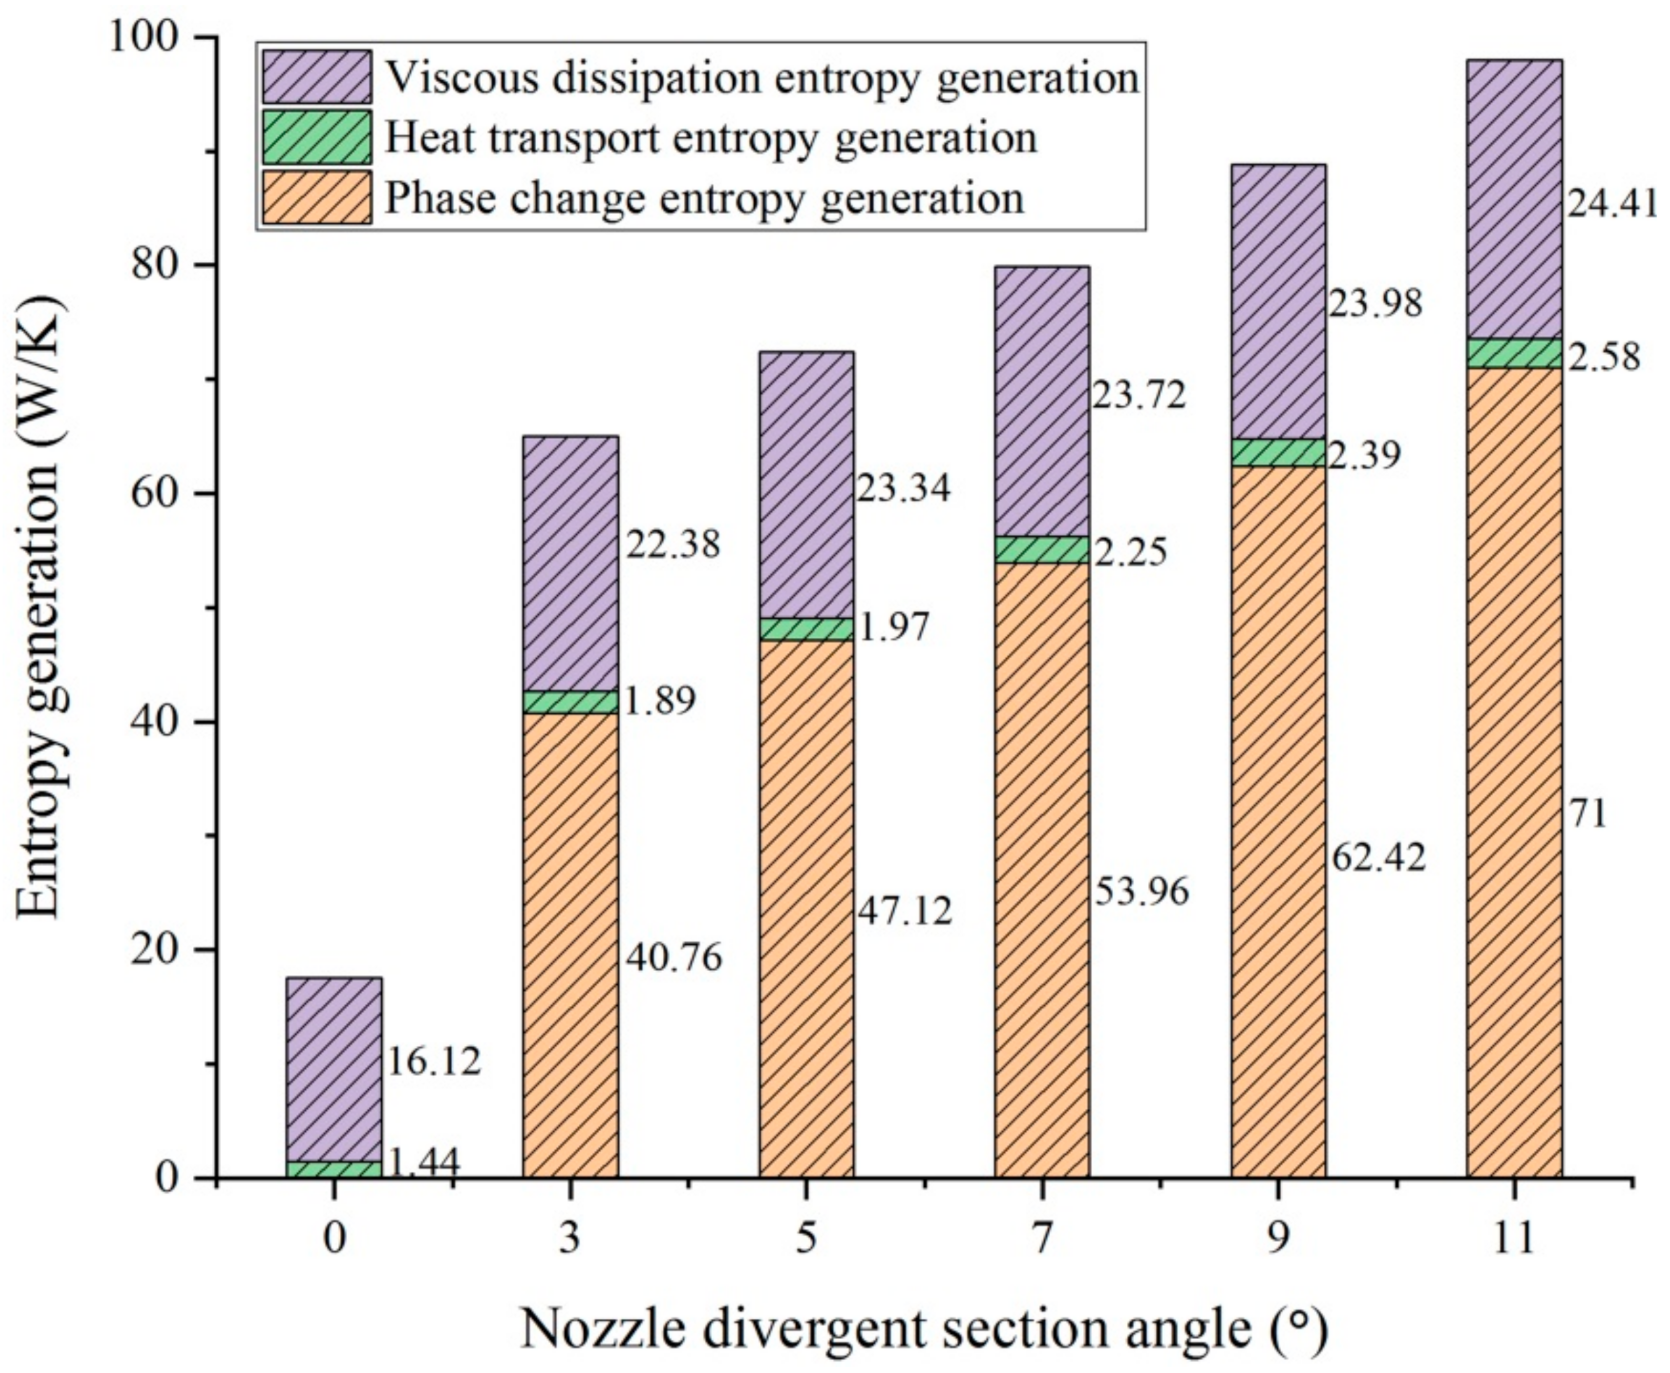
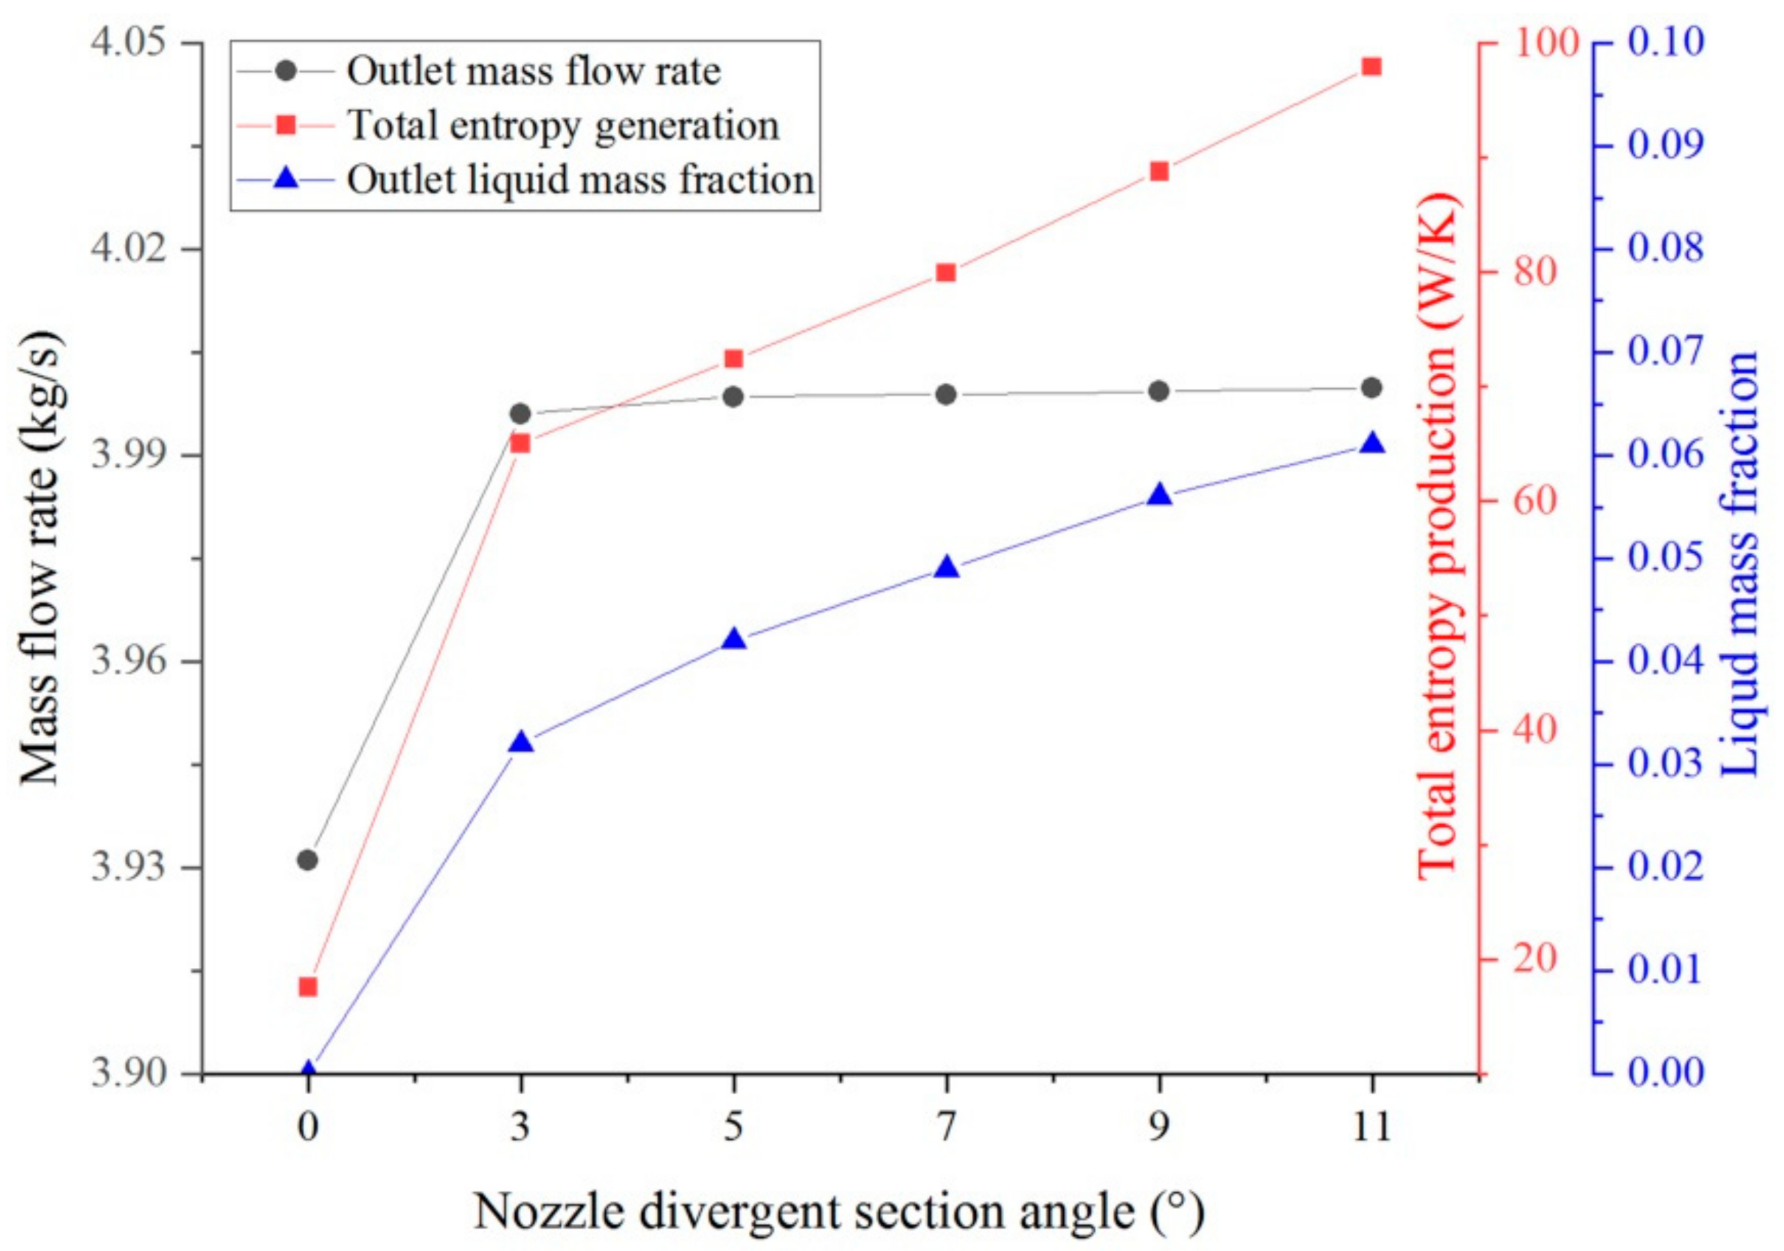
4.2.2. Expansion Angle of the Nozzle’s Divergent Section

As shown in Figure 12, as the nozzle’s expansion angle was increased, the concentration region of the total entropy generation rate gradually moved upstream of the nozzle’s divergent section and its peak value and area also increased. Therefore, the total entropy production increased from 17.55 W/K at the 0° nozzle expansion angle to 97.97 W/K at the 11° nozzle expansion angle; a nearly five-fold increase. This was due to the condensation behavior of the steam, which almost disappeared at the 0° nozzle expansion angle, so a small total entropy production value was generated.
Figure 13 illustrates that the enlargement of the nozzle expansion angle changed the composition of the three modes of entropy generation: the nozzle expansion angle changed from 0 to 11°, which resulted in an increase in the viscous dissipation and the heat transport entropy generation from 16.12 and 1.44 W/K to 24.41 and 2.58 W/K, respectively. Moreover, the increase in phase change entropy generation from 0 to 71 W/K also led to an increase in the liquid mass fraction. As already seen for the proportion of entropy production in Section 4.2.1, the largest proportion of entropy production was still generated by phase changes, followed by viscous dissipation and then heat transport.
Figure 14 clearly shows that the curve of the mass flow rate has a steeper slope between the 0° and 3° nozzle expansion angles than that which was found between the 3° and 11° angles. This is because the steam’s spontaneous condensation did not happen at the 0° nozzle expansion angle, which led to the generation of smaller values of the total entropy production and liquid mass fraction. Once the expansion angle was larger than 3°, increased entropy production and liquid mass fraction usually led to more energy being converted into useless work and a reduction in the flow velocity of the steam, which directly slowed the growth rate of the mass flow rate, as depicted in Figure 14. Therefore, it is not appropriate to attempt to improve nozzle performance by expanding the expansion angle of the nozzle’s divergent section. This caution is evidenced by the lower mass flow rate growth rate, the increase in the total entropy production and the nozzle outlet humidity that were found between the 3° and 11° expansion angles (see Figure 14).

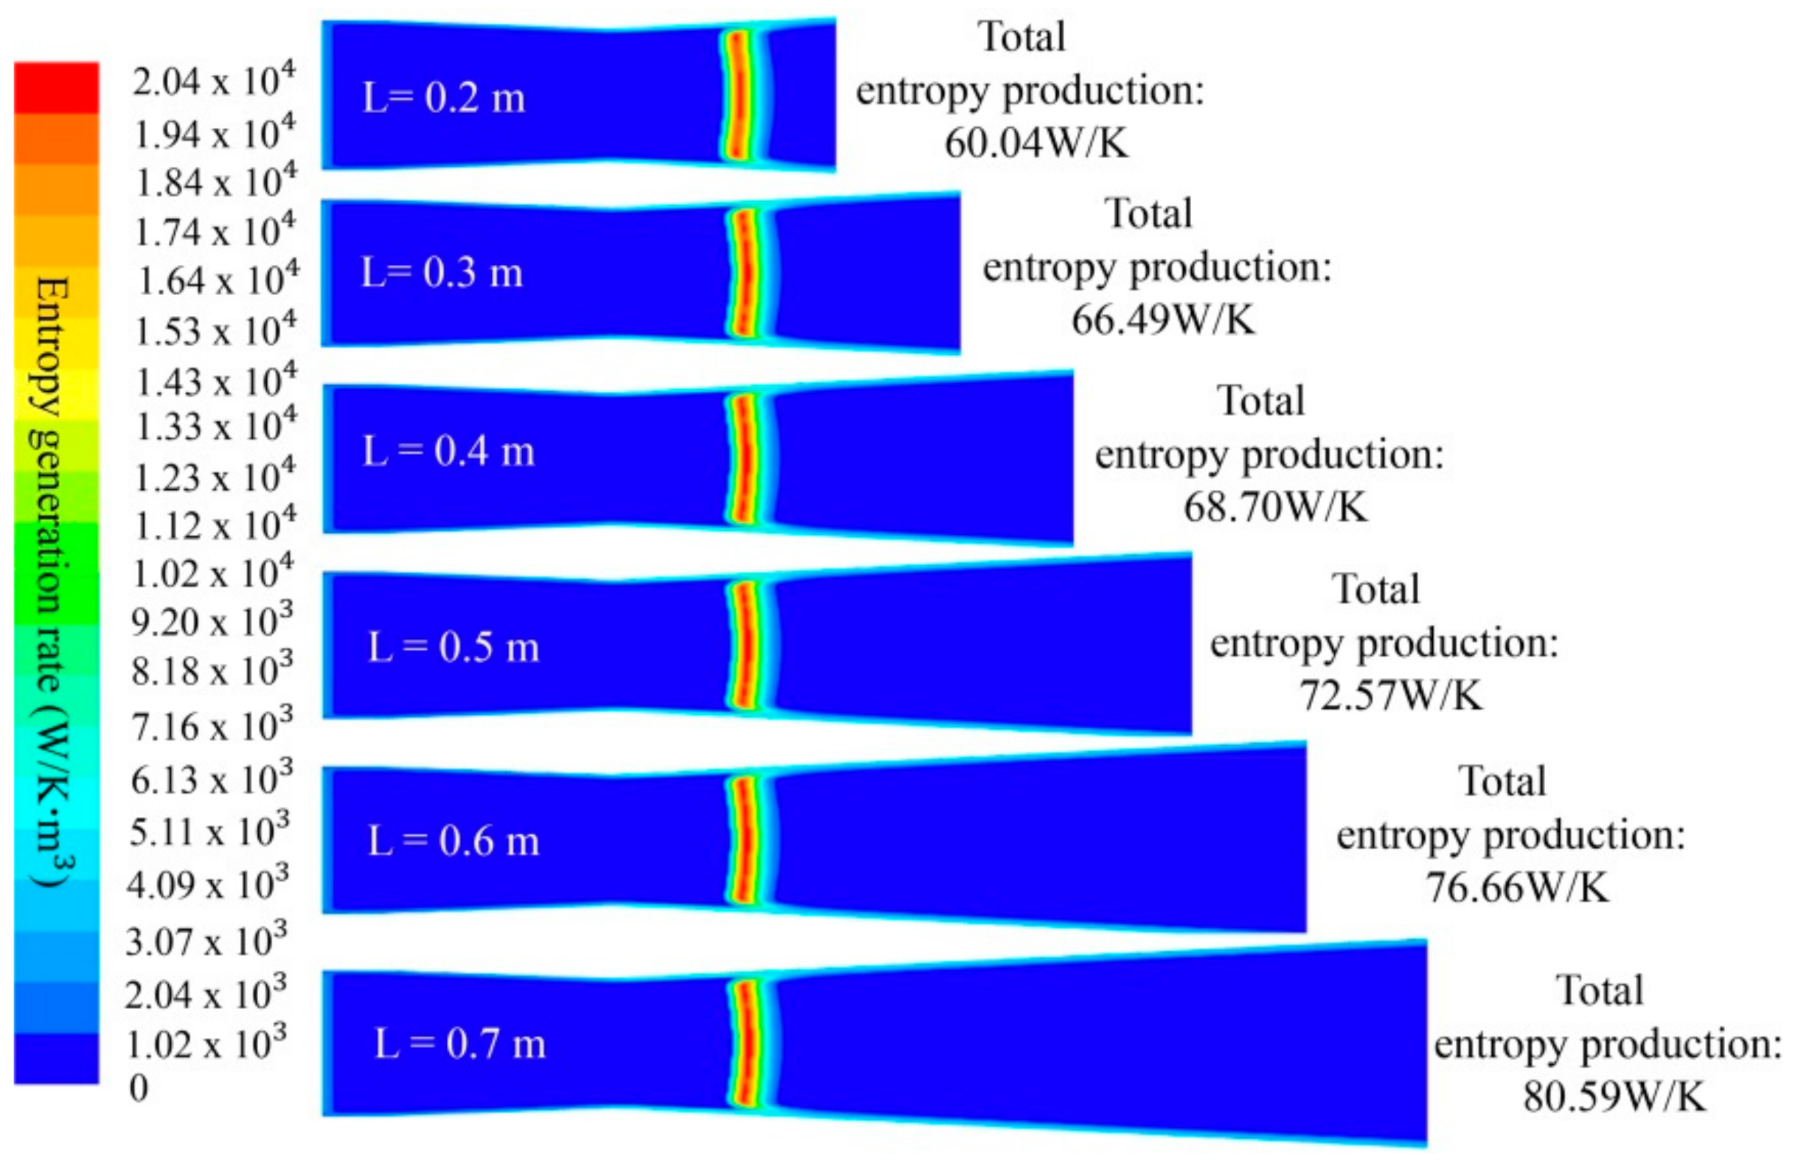
4.2.3. Length of the Nozzle’s Divergent Section

The changes in the total entropy generation rate that were caused by the growth of the length of the nozzle’s divergent section are presented in Figure 15. It was found that the location and the area of the total entropy generation rate concentration region remained almost the same. The total entropy production increased from 60.04 to 80.59 W/K as the divergent section was lengthened from 0.2 to 0.7 m. Moreover, the three entropy generation processes all increased as the divergent section was lengthened from 0.2 to 0.7 m. Under this condition, the viscous dissipation, heat transport and phase change entropy generation increased from 13.35, 1.41, and 45.27 W/K to 30.06, 2.69, and 47.84 W/K, respectively (see Figure 16). We can see that the phase change entropy generation was still the largest contributor to entropy among the three types of entropy production, under their respective conditions. Interestingly, although there was growth of the total entropy production and liquid mass fraction at the nozzle outlet as the divergent section length increased, we found that the nozzle’s performance was almost unaffected. This observation is based on the mass flow rate of the nozzle, which maintained a constant of 3.997 kg/s, as shown in Figure 17.

5. Conclusions

In this paper, the effects of the throat radius, divergent section expansion angle and divergent section length of a nozzle on the spontaneous condensation of steam were numerically investigated. The irreversibility flow in the nozzle was also analyzed by identifying the proportion of entropy generation that could be attributed to three mechanisms (viscous dissipation, heat transport and phase change) and the distributions of the total entropy generation rate under different nozzles’ geometric structures. In addition, the nozzle’s performance was studied by comparing the mass flow rate, total entropy production and liquid mass fraction. The detailed findings are as follows:
  • The increase in the nozzle throat radius enhanced the intensity of the condensation shock and increased the mass flow rate and the pressure at the nozzle outlet. The total entropy production in the nozzle decreased from 11.73 to 10.56 W/K as the throat radius increased from 0.025 to 0.05 m. Therefore, increasing the nozzle throat radius can not only improve the nozzle’s performance, but also reduce the waste of energy. In addition, the reduction in liquid mass fraction and phase change entropy generation indicates that the spontaneous condensation behavior of wet steam can be suppressed by increasing the throat radius.
  • When the expansion angle of the nozzle’s divergent section changed from 0 to 11°, the nozzle’s outlet Mach number increased, but the nozzle outlet pressure decreased and the intensity of the condensation shock was weakened. Moreover, there was an increase in the liquid mass fraction, which caused an increase in phase change entropy generation. Therefore, reducing the nozzle’s expansion angle inhibited the wet steam’s spontaneous condensation behavior, to a certain extent. In particular, the steam’s spontaneous condensation behavior disappeared at an expansion angle of 0°.
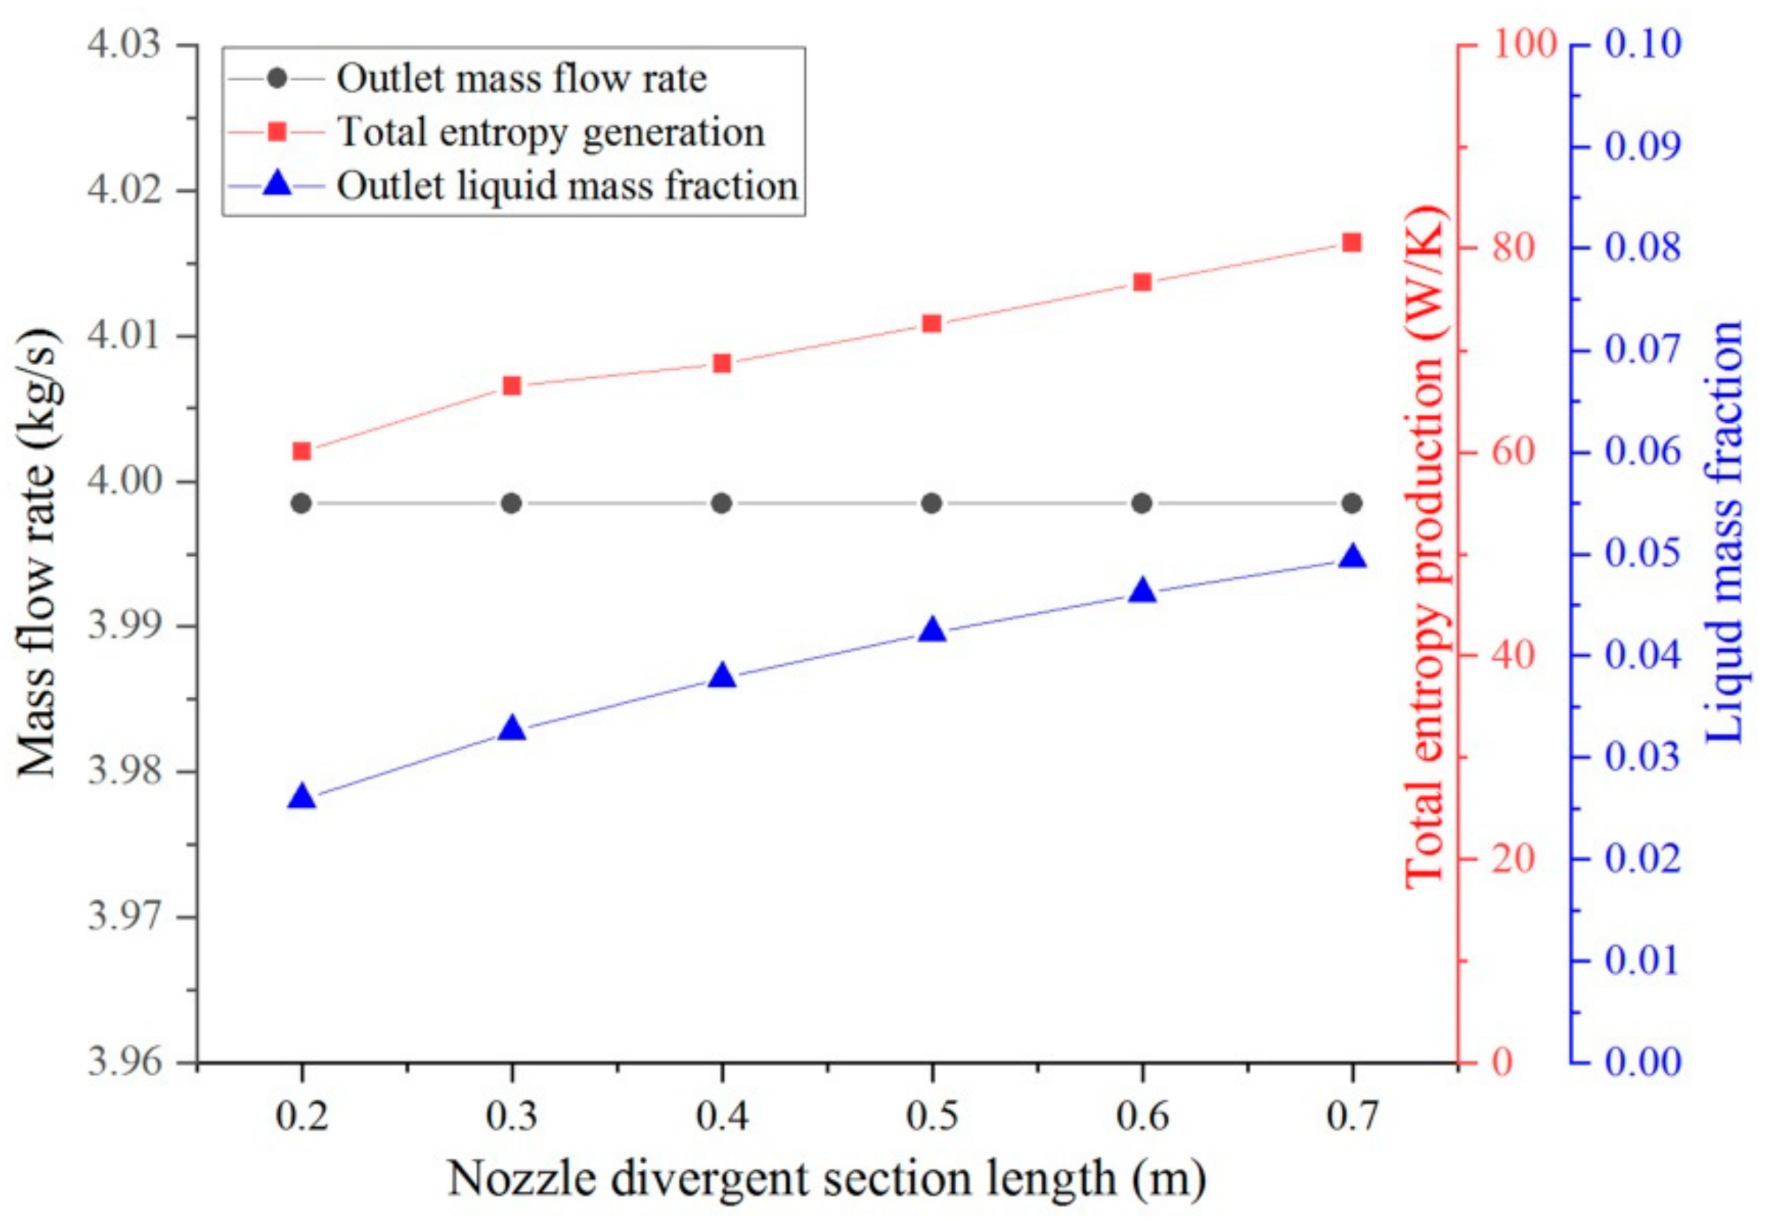
  • Lengthening the nozzle’s divergent section did not change the condensation shock’s intensity and its position in the nozzle, which resulted in a complete overlap of the curves of the liquid mass fraction, saturation ratio, droplets’ nucleation rate and droplets per unit volume in the steam condensation shock region. As the divergent section’s length was increased from 0.2 to 0.7 m, the three identified types of entropy generation, total entropy production, and liquid mass fraction all increased, while the mass flow rate remained constant at 3.997 kg/s. Consequently, lengthening the nozzle’s divergent section did not improve the nozzle’s performance, but it did cause an increase in the humidity in the nozzle’s outlet and the wastage of energy.
  • No matter how the nozzle’s geometric structure changed, the largest proportion of entropy generation was still accounted for by phase changes, followed by viscous dissipation and then heat transport. This indicates that steam’s condensation behavior creates a large amount of irreversible energy, resulting in energy waste and reducing the nozzle’s performance. Consequently, the spontaneous condensation behavior of wet steam should be suppressed in order to alleviate the performance deterioration that is caused by this behavior when a steam ejector is running.

Author Contributions

Conceptualization, H.L. and X.W.; methodology, H.L. and J.N.; software, H.L and H.H.; validation, J.N. and H.H.; formal analysis, H.L. and J.N.; investigation, H.L., J.N.; resources, X.W.; data curation, H.L. and H.H.; writing—original draft preparation, H.L.; writing—review and editing, H.L. and H.H.; visualization, H.L.; supervision, X.W.; project administration, X.W. and J.T.; funding acquisition, X.W. and J.T. All authors have read and agreed to the published version of the manuscript.

Funding

This research was funded by the National Natural Science Foundation of China (grant no. 51775098) and the Australian Research Council (DP160101953).

Institutional Review Board Statement

Not applicable.

Informed Consent Statement

Not applicable.

Conflicts of Interest

The authors declare no conflict of interest.

Nomenclature

ρ , ρ v , ρ l mixing fluid density, vapor density, and liquid phase density (kg/m3)
Rgas law constant
T,Tv,Tl static temperature, vapor temperature, and liquid phase temperature (K)
P pressure, (Pa)
ui, uj, uk x, y, z components of velocity, (m/s)
τ ij stress tensor
αeff effective thermal conductivity
μeff effective viscosity
δij unit tensor
E total fluid energy
k turbulent kinetic energy
ω specific dissipation rate
μ dynamic viscosity, (N·s/m2)
μ teddy viscosity, (N·s/m2)
β liquid phase mass fraction
Γ mass generation rate, (kg/m3s)
S super saturation ratio
I number of liquid droplets
η droplet number density, (1/m3)
r ¯ average droplet radius, (m)
r droplet radius,(m)
r* critical droplet radius, (m)
KB Boltzmann constant
σ droplet surface tension
M molecular mass, (kg)
θ non-isothermal correction factor
h specific enthalpy
hlv latent heat due to condensation
qc evaporation coefficient
γ ratio of specific heats
Vd average droplet volume, (m3)
B, C virial coefficients, (m3/kg, m6/kg2)
Cp isobaric heat capacity, (J/(kg·K))
s specific entropy
Sgentotal entropy generation rate, (W·K–1m–1)
Sgen,μentropy produced by viscous dissipation, (W·K–1m–1)
Sgen,h entropy produced by heat transfer, (W·K–1m–1)
  α t turbulent thermal diffusivity rate

References

  1. Strušnik, D.; Marčič, M.; Golob, M.; Hribernik, A.; Živić, M.; Avsec, J. Energy efficiency analysis of steam ejector and electric vacuum pump for a turbine condenser air extraction system based on supervised machine learning modelling. Appl. Energy 2016, 173, 386–405. [Google Scholar] [CrossRef]
  2. Thongtip, T.; Aphornratana, S. An experimental analysis of the impact of primary nozzle geometries on the ejector performance used in R141b ejector refrigerator. Appl. Therm. Eng. 2017, 110, 89–101. [Google Scholar] [CrossRef]
  3. Liu, J.; Wang, L.; Jia, L.; Wang, X. The influence of the area ratio on ejector efficiencies in the MED-TVC desalination system. Desalination 2017, 413, 168–175. [Google Scholar] [CrossRef]
  4. Brunner, D.A.; Marcks, S.; Bajpai, M.; Prasad, A.K.; Advani, S.G. Design and characterization of an electronically controlled variable flow rate ejector for fuel cell applications. Int. J. Hydrog. Energy 2012, 37, 4457–4466. [Google Scholar] [CrossRef]
  5. Damiani, L.; Revetria, R. New steam generation system for lead-cooled fast reactors, based on steam re-circulation through ejector. Appl. Energy 2015, 137, 292–300. [Google Scholar] [CrossRef]
  6. Ruangtrakoon, N.; Aphornratana, S.; Sriveerakul, T. Experimental studies of a steam jet refrigeration cycle: Effect of the primary nozzle geometries to system performance. Exp. Therm. Fluid Sci. 2011, 35, 676–683. [Google Scholar] [CrossRef]
  7. Ruangtrakoon, N.; Thongtip, T.; Aphornratana, S.; Sriveerakul, T. CFD simulation on the effect of primary nozzle geometries for a steam ejector in refrigeration cycle. Int. J. Therm. Sci. 2013, 63, 133–145. [Google Scholar] [CrossRef]
  8. Yang, X.; Long, X.; Yao, X. Numerical investigation on the mixing process in a steam ejector with different nozzle structures. Int. J. Therm. Sci. 2012, 56, 95–106. [Google Scholar] [CrossRef]
  9. Fu, W.; Li, Y.; Liu, Z.; Wu, H.; Wu, T. Numerical study for the influences of primary nozzle on steam ejector performance. Appl. Therm. Eng. 2016, 106, 1148–1156. [Google Scholar] [CrossRef]
  10. Wu, Y.; Zhao, H.; Zhang, C.; Wang, L.; Han, J. Optimization analysis of structure parameters of steam ejector based on CFD and orthogonal test. Energy 2018, 151, 79–93. [Google Scholar] [CrossRef]
  11. Moore, P.T.W.; Crane, R.I.; Davidson, B.J. Predicting the fog drop size in wet steam turbines. In Wet Steam 4 Conference; Institute of Mechanical Engineers (UK), University of Warwick: Coventry, UK, 1973. [Google Scholar]
  12. Moses, C.A.; Stein, G.D. On the Growth of Steam Droplets Formed in a Laval Nozzle Using Both Static Pressure and Light Scattering Measurements. J. Fluids Eng. 1978, 100, 311–322. [Google Scholar] [CrossRef]
  13. Gyarmathy, G. Nucleation of steam in high-pressure nozzle experiments. Proc. Inst. Mech. Eng. Part A J. Power Energy 2005, 219, 511–521. [Google Scholar] [CrossRef]
  14. Gyarmathy, G. Grundlagen einer Theorie der Nassdampfturbine; ETH: Zurich, Switzerland, 1962. [Google Scholar]
  15. Bakhtar, F.; Tochai, M.M. An investigation of two-dimensional flows of nucleating and wet steam by the time-marching method. Int. J. Heat Fluid Flow 1980, 2, 5–18. [Google Scholar] [CrossRef]
  16. Young, J.B. An Equation of State for Steam for Turbomachinery and Other Flow Calculations. J. Eng. Gas Turbines Power 1988, 110, 1–7. [Google Scholar] [CrossRef]
  17. Young, J.B. Two-Dimensional, Nonequilibrium, Wet-Steam Calculations for Nozzles and Turbine Cascades. J. Turbomach. 1992, 114, 569–579. [Google Scholar] [CrossRef]
  18. Young, J. The fundamental equations of gas-droplet multiphase flow. Int. J. Multiph. Flow 1995, 21, 175–191. [Google Scholar] [CrossRef]
  19. Wang, X.-D.; Dong, J.; Wang, T.; Tu, J. Numerical analysis of spontaneously condensing phenomena in nozzle of steam-jet vacuum pump. Vacuum 2012, 86, 861–866. [Google Scholar] [CrossRef]
  20. Wang, X.; Dong, J.; Li, A.; Lei, H.; Tu, J. Numerical study of primary steam superheating effects on steam ejector flow and its pumping performance. Energy 2014, 78, 205–211. [Google Scholar] [CrossRef]
  21. Sharifi, N.; Boroomand, M.; Sharifi, M. Numerical assessment of steam nucleation on thermodynamic performance of steam ejectors. Appl. Therm. Eng. 2013, 52, 449–459. [Google Scholar] [CrossRef]
  22. Sharifi, N.; Boroomand, M.; Kouhikamali, R. Wet steam flow energy analysis within thermo-compressors. Energy 2012, 47, 609–619. [Google Scholar] [CrossRef]
  23. Ding, H.; Wang, C.; Zhao, Y. An analytical method for Wilson point in nozzle flow with homogeneous nucleating. Int. J. Heat Mass Transf. 2014, 73, 586–594. [Google Scholar] [CrossRef]
  24. Abadi, S.N.R.; Kouhikamali, R.; Atashkari, K. Two-fluid model for simulation of supersonic flow of wet steam within high-pressure nozzles. Int. J. Therm. Sci. 2015, 96, 173–182. [Google Scholar] [CrossRef]
  25. Abadi, S.M.A.N.R.; Kouhikamali, R.; Atashkari, K. Non-equilibrium condensation of wet steam flow within high-pressure thermo-compressor. Appl. Therm. Eng. 2015, 81, 74–82. [Google Scholar] [CrossRef]
  26. Wróblewski, W.; Dykas, S. Two-fluid model with droplet size distribution for condensing steam flows. Energy 2016, 106, 112–120. [Google Scholar] [CrossRef]
  27. Yang, Y.; Walther, J.H.; Yan, Y.; Wen, C. CFD modeling of condensation process of water vapor in supersonic flows. Appl. Therm. Eng. 2017, 115, 1357–1362. [Google Scholar] [CrossRef]
  28. Yang, Y.; Zhu, X.; Yan, Y.; Ding, H.; Wen, C. Performance of supersonic steam ejectors considering the nonequilibrium condensation phenomenon for efficient energy utilisation. Appl. Energy 2019, 242, 157–167. [Google Scholar] [CrossRef] [Green Version]
  29. Zhang, G.; Dykas, S.; Yang, S.; Zhang, X.; Li, H.; Wang, J. Optimization of the primary nozzle based on a modified condensation model in a steam ejector. Appl. Therm. Eng. 2020, 171, 115090. [Google Scholar] [CrossRef]
  30. Ariafar, K.; Buttsworth, D.; Sharifi, N.; Malpress, R. Ejector primary nozzle steam condensation: Area ratio effects and mixing layer development. Appl. Therm. Eng. 2014, 71, 519–527. [Google Scholar] [CrossRef]
  31. Wang, C.; Wang, L.; Zou, T.; Zhang, H. Influences of area ratio and surface roughness on homogeneous condensation in ejector primary nozzle. Energy Convers. Manag. 2017, 149, 168–174. [Google Scholar] [CrossRef]
  32. Ansys, I. ANSYS-FLUENT 15.0 User’s Guide; ANSYS, Inc.: Pittsburgh, PA, USA, 2013. [Google Scholar]
  33. Besagni, G.; Inzoli, F. Computational fluid-dynamics modeling of supersonic ejectors: Screening of turbulence modeling approaches. Appl. Therm. Eng. 2017, 117, 122–144. [Google Scholar] [CrossRef]
  34. Varga, S.; Soares, J.; Lima, R.; Oliveira, A. On the selection of a turbulence model for the simulation of steam ejectors using CFD. Int. J. Low-Carbon Technol. 2017, 12, 233–243. [Google Scholar] [CrossRef]
  35. Mazzelli, F.; Giacomelli, F.; Milazzo, A. CFD modeling of condensing steam ejectors: Comparison with an experimental test-case. Int. J. Therm. Sci. 2018, 127, 7–18. [Google Scholar] [CrossRef]
  36. Besagni, G.; Cristiani, N.; Croci, L.; Guédon, G.R.; Inzoli, F. Computational fluid-dynamics modelling of supersonic ejectors: Screening of modelling approaches, comprehensive validation and assessment of ejector component efficiencies. Appl. Therm. Eng. 2021, 186, 116431. [Google Scholar] [CrossRef]
  37. Ishazaki, K.; Ikohagi, T.; Daiguji, H. High-resolution numerical method for transonic non-equilibrium condensation flows through a steam turbine cascade. In Proceedings of the 6th International Symposium on Computational Fluid Dynamics, Lake Tahoe, NV, USA, 4–8 September 1995; pp. 479–484. [Google Scholar]
  38. Herwig, H.; Kock, F. Direct and indirect methods of calculating entropy generation rates in turbulent convective heat transfer problems. Heat Mass Transf. 2006, 43, 207–215. [Google Scholar] [CrossRef]
  39. Ding, H.; Zhao, Y.; Wen, C.; Wang, C.; Sun, C. Energy efficiency and exergy destruction of supersonic steam ejector based on nonequilibrium condensation model. Appl. Therm. Eng. 2021, 189, 116704. [Google Scholar] [CrossRef]
  40. Wang, C.; Wang, L.; Zhao, H.; Du, Z.; Ding, Z. Effects of superheated steam on non-equilibrium condensation in ejector primary nozzle. Int. J. Refrig. 2016, 67, 214–226. [Google Scholar] [CrossRef]
Figure 1. Schematic diagram of steam ejector and nozzle structure.
Applsci 11 11954 g001
Figure 2. Geometric structure of the nozzle B with: (a) different throat radii, (b) different expansion angles of the divergent section, and (c) different lengths of the divergent section.
Applsci 11 11954 g002
Figure 3. The mesh structure of nozzle B and the wall Y plus value.
Applsci 11 11954 g003
Figure 4. Comparison of the liquid mass fraction under different grid levels.
Applsci 11 11954 g004
Figure 5. Validation of numerical simulation: (a) Moore A nozzle, (b) Moore B nozzle, (c) Moore C nozzle, and (d) the structures of three nozzles.
Applsci 11 11954 g005
Figure 6. The steam parametric curves along the axis under different nozzle throat radii: (a) temperature, (b) pressure, (c) Mach number, (d) saturation ratio, (e) droplet nucleation rate, (f) droplets per unit volume, (g) liquid mass fraction, (h) droplet average radius.
Applsci 11 11954 g006
Figure 7. The steam parametric curves along the axis at different expansion angles of the nozzle’s divergent section: (a) temperature, (b) pressure, (c) Mach number, (d) saturation ratio, (e) droplet nucleation rate, (f) droplets per unit volume, (g) liquid mass fraction, (h) droplet average radius.
Applsci 11 11954 g007
Figure 8. The steam parametric curves along the axis under different lengths of the nozzle’s divergent section: (a) temperature, (b) pressure, (c) Mach number, (d) saturation ratio, (e) droplet nucleation rate, (f) droplets per unit volume, (g) liquid mass fraction, (h) droplet average radius.
Applsci 11 11954 g008
Figure 9. The total entropy generation rate and total entropy production under different nozzle throat radii.
Applsci 11 11954 g009
Figure 10. The three types of entropy generation under different nozzle throat radii.
Applsci 11 11954 g010
Figure 11. The mass flow rate, total entropy production and liquid mass fraction under different nozzle throat radii.
Applsci 11 11954 g011
Figure 12. The total entropy generation rate and total entropy production at different expansion angles of the nozzle’s divergent section.
Applsci 11 11954 g012
Figure 13. The three types of entropy generation at different expansion angles of the nozzle’s divergent section.
Applsci 11 11954 g013
Figure 14. The mass flow rate, total entropy production and liquid mass fraction at different expansion angles of the nozzle’s divergent section.
Applsci 11 11954 g014
Figure 15. The entropy generation rate and total entropy production under different lengths of the nozzle’s divergent section.
Applsci 11 11954 g015
Figure 16. The three types of entropy generation under different lengths of the nozzle’s divergent section.
Applsci 11 11954 g016
Figure 17. The mass flow rate, total entropy production and liquid mass fraction under different lengths of the nozzle’s divergent section.
Applsci 11 11954 g017
Table 1. Geometric structure of the nozzle B.
Coordinate Value (m)Point APoint BPoint CPoint D
Throatx−0.25−0.200.5
Radiusy0.05630.05630.025/0.03/0.035/0.072
0.04/0.045/0.05
Expansionx−0.25−0.200.5
Angley0.05630.05630.050.056/0.063/0.072
0.081/0.089/0.98
Divergentx−0.25−0.200.2~0.5
Section Lengthy0.05630.05630.50.059/0.063/0.068
0.072/0.076/0.081
Nozzle Bx−0.25−0.200.5
Structurey0.05630.05630.050.072
Table 2. Initial values of the boundary condition.
Steam Pressure (Pa)Steam Temperature (K)Steam Superheat (K)
Nozzle inlet (A)25,000354.616.5
Nozzle inlet (B)25,000357.619.5
Nozzle inlet (C)25,000358.620.5
Nozzle inlet (A/B/C)2000300/
Table 3. Boundary condition settings.
ItemBoundary Condition
Nozzle WallAdiabatic and no-slip
Nozzle inletPressure inlet
Nozzle outletPressure outlet
Table 4. Properties of the working fluid.
PropertyValue
Dynamic viscosity1.34 × 10−5 kg/m·s
Thermal conductivity0.00261 W/m·K
Specific heat capacity2014.00 J/kg·K
Molecular weight18.01534 kg·k/mol
Publisher’s Note: MDPI stays neutral with regard to jurisdictional claims in published maps and institutional affiliations.

