Article

Optimization of Photogrammetric Flights with UAVs for the Metric Virtualization of Archaeological Sites. Application to Juliobriga (Cantabria, Spain)

by
Julio Manuel de Luis-Ruiz
,
Javier Sedano-Cibrián
,
Raúl Pereda-García
,
Rubén Pérez-Álvarez
* and
Beatriz Malagón-Picón
Cartographic Engineering and Mining Exploitation R+D+i Group, University of Cantabria, 39316 Torrelavega, Spain
*
Author to whom correspondence should be addressed.
Submission received: 8 December 2020 / Revised: 21 January 2021 / Accepted: 23 January 2021 / Published: 28 January 2021
(This article belongs to the Special Issue 3D Virtual Reconstruction for Archaeological Sites)

Abstract

:
Three-dimensional models are required to virtualize heritage sites. In recent years, different techniques that ease their generation have been consolidated, such as photogrammetry with Unmanned Aerial Vehicles (UAVs). Nonmetric cameras allow relatively inexpensive data collections. Traditional aerial photogrammetry has established methodologies, but there are not commonly used recommendations for the selection of parameters when working with UAV platforms. This research applies the Taguchi Design of Experiments Method, with four parameters (height of flight, forward and lateral overlaps, and inclination angle of the sensor) and three levels (L9 matrix and nine flights), to determine the set that offers the best metric goodness and, therefore, the most faithful model. The Roman civitas of Juliobriga (Cantabria, North of Spain) was selected for this experiment. The optimal flight results of the average signal-to-noise ratio analysis were height of 15 m, forward and lateral overlaps of 80%, and inclination of 0° (nadiral). This research also highlights the noticeable contribution of the inclination in the accuracy of the model with respect to the others, which is 16.4 times higher than that of the less relevant one (height of flight). This leads to propose avoiding inclination angle as a variable, and the sole development of nadiral flights to obtain accurate models.

1. Introduction

In recent years, digital images and videos have allowed the consideration of virtualization as a tool to ease the access of visual information of objects/territories. It is easy to obtain virtual itineraries that permit the visualization of all types of locations, thus providing a tremendously accurate image of the place that is visited, even if it is miles of kilometers away from the user. This virtualization provides a large number of advantages, and, although the accessibility to information may be the most important one, since after the virtualization, it can be broadcasted in a practically worldwide way, there is another one of great importance. If the virtualization is developed in an appropriate way, it does allow not only a visual replication of all the elements that exist on a certain location but also their metric representation. This permits agents to prospect, investigate, manage, or even reproduce the asset. Due to all these reasons, the metric aspects are so important for a virtual recreation.
The metric component of the virtualization has been widely developed in recent years, due to the emergence of several surveying techniques that allow modeling objects/territories [1], such as remote sensing, lidar, laser scanner, etc. Photogrammetry with UAVs (Unmanned Aerial Vehicles) has become a tool with great potential for several areas, such as agriculture, geology, engineering, or archaeology. This is due to the characteristics that this kind of vehicles offer, i.e., reduced size and weight, low cost, and easy handling [2]. This type of platforms allows collecting the information (aerial photographs) that is required for the generation of point-clouds and 3D models, which, after the application of the matching texture, lead to the recreation of orthomosaics, interactive PDFs, virtual itineraries through the model, etc. [3]. Therefore, the models themselves are the resources that are required for a virtualization of the object/territory with not only good visual appearance but also a proper metric that permits measuring, and the images obtained with UAVs are adequate for the traditional photogrammetric activities, due to their great resolution and the capacity to cover large areas with low costs. This supports their noticeable potential for archaeological surveying [4].
The generation of 3D models of the territory with UAVs is nourished by the images that the sensor comprised by the drone can capture, which must have enough quality according to the archaeological asset that is under study, and the process must be economically proportional. Hence, the acquisition of aerial photographs must be developed in an adequate way that guarantees the desired accuracy and level of detail, and their quality will depend on the flight during which they are taken [5]. This flight or mission must be previously defined by the pilot, according to the features of the sensor, and technical characteristics of the photogrammetric flight. This is usually developed by generic software, as it does not depend on the application for which the model is intended.
Traditional aerial photogrammetry has covered a larger way in time, and parameters for the design and dimensioning of the flight project have been set according to the recommendations of several authors, or standardized charts. When working with UAV platforms, there is not specific information that establishes a methodology to dimension the photogrammetric flight projects for the acquisition of images with suitable quality for the generation of the final products. It is frequently assumed that a poor quality is related to the technical limitations of the platforms, instead of interpreting the dependence of the result with respect to design parameters.
The definition of these technical factors is extremely important, due to its influence not only on the image resolution, but also on the management of the images, and the final products [6]. The analysis of the dependence between the final result and the initially fixed parameters is highly important. This research proposes the contrast of several photogrammetric flights with different settings of parameters, which are defined according to the application of the Taguchi Design of Experiments (DOE) Method, and their final products. This analysis is developed on the basis of the metric goodness. Priority is granted to it over other possible considerations, given the final aim of this research, which seeks the metric fidelity of the final model. All the foregoing is intended to set generalized recommendations about the most suitable parameters for the dimensioning of the photogrammetric flight that allows generating a 3D model of an archeological site and the subsequent optimal virtualization.

2. Materials and Methods

The project or mission allows defining the parameters that characterize the flight of the UAV during the acquisition of images. These photographs will be subsequently processed and define the quality of the virtual product that is desired to obtain. It seems obvious that if this research seeks the optimization of these parameters, a review of the main ones is required to try to determine their importance and variability. This analysis is intended to guarantee that the selected factors provide enough overlap and stereoscopic coverage to allow the processing of the set of images with specific photogrammetric software.

2.1. Traditional Parameters for the Implementation of the Flight Project

When setting the parameters of a photogrammetric flight developed with UAV aimed at the acquisition of information for the virtualization of objects/territories, the control of the UAV itself must be taken into account. This is due to the different flight alternatives that are available: automatic mode, monitored, supervised, preprogrammed, and remote controlled [7]. The automatic mode is the most applied option for the development of photogrammetric activities [8], as it guarantees a more homogeneous distribution of the images, while fulfilling the coverage requirements set [9]. This typology of flight is the most common when generating orthoimages or 3D models, and parameters such as the extent and morphology of the terrain, the photogrammetric camera, the scales of the photographs and the model, the flight height, the forward and lateral overlaps, the direction and track of the passes, the time of the flight, the day and hour, the coordinates of the points of the taking off and landing points, etc. must be considered for its programming.
For the resolution of the flight project, the pilot establishes approximately three or four parameters, which estimates the global set of adjustments. In this regard, platforms manufacturers provide software that allows developing the required calculations nowadays, by setting exclusively four parameters (height of flight, forward and lateral overlap, and speed of flight), apart from the focal length of the photogrammetric camera that is used. All the foregoing implies that the pilot estimates the flight projects in a somewhat approximate way, without any methodology that allows optimizing these parameters, or suits the actual necessities of the modeled object or territory. To adapt the parameters applied for the dimensioning of the flight project, reviewing the ones that have been traditionally applied seems coherent.
  • The atmospheric constrains. These are a very important set of parameters that must be considered in any photogrammetric flight. They define the climatic and lighting conditions during the acquisition of the images. Despite their lack of influence on the geometry and the flight project itself, they must be identified in the first instance, as they can impede the development of the flight if they are severe, and even without being extreme, they may seriously affect the quality of the images and, therefore, the quality of the model [9].
  • The sensor or photographic camera. They are not parameters themselves, but they usually constrain the flight. They are mainly defined by two technical features: the focal length and the size of the sensor. Two different types of cameras are applied in photogrammetry. When working in the range of low-cost sensors, which are also known as nonmetric cameras, their specifications are not fixed in a precise way by the manufacturer. This implies several sources or error that are usually soothed with methodology of surveying and management. It is worth noting that this research is focused on this type of sensors due to an obvious reason, i.e., the economic factor, which undoubtedly eases the current growth of this technique in the market.
  • The geometry or direction of the plane passes. They define the simple or double grid that can be applied for a photogrammetric flight. The simple grid, in which the flight has just one direction, easily adapts to models or mappings where the variability of the vertical component is scarce (plain terrains) [6]. The double grid (flight in two perpendicular directions) is suitable to model objects whose vertical component varies widely (upright structures, buildings, etc.), in which hidden areas must be avoided while acquiring the photographs.
  • The photogrammetric support. It is not a parameter of the flight project itself, as it does not imply any interaction with the features set for the definition of how the platform must operate to acquire the images. However, it provides a higher quality and, above all, metric accuracy to the final model, especially when flying with low-cost sensors. The Ground Control Points (GCPs) are a set of points that area easily identifiable in the images. They are generally materialized with photogrammetric targets whose coordinates with respect to the selected reference system are defined by means of surveying methods. They are usually evenly distributed along the area that is modeled, and they allow the orientation and scaling of the model. The technology of most photogrammetric software programs designed for processing images acquired with drones is based on Structure from Motion (SfM), which allows obtaining 3D models from 2D images taken from different points of view. This methodology does not require GCPs, as the scale, georeferencing, and orientation of the images for the generation of the models are developed by automatically relating the images from a set of points, which allow the reconstruction of the location of the cameras in the space to generate the point-cloud [10]. However, their use while processing clearly improves the geometry and accuracy of the final model. Platforms that include GPS within the sensor market, which do not require photogrammetric support [11], are available in the market, but they are not low-cost devices.
  • Speed of flight. This parameter alludes to the UAV momentum during the itinerary that must follow. It is usually set at about 4 m/s. The definition of a higher or lower speed of flight conditions the total time of flight, the time between shots, and even the shuttering speed. All these parameters must be taken into account due to the limitations of both the UAV and the nonmetric cameras. Generally, it can be stated that the speed of flight is relevant, as it greatly conditions the duration of the flight, but it has little affection with respect to the geometry of the flight, and even less in terms of the accuracy of the subsequent models.
  • Height of flight. It is a parameter of great relevance, as it conditions most of the final parameters and specially the number of images and resolution. The resolution is usually expressed as the Ground Sample Distance (GSD), which is defined as the distance between the centers of two consecutive pixels. It is directly dependent on the height of flight, i.e., a lower height implies a lower GSD and, therefore, a higher resolution. A limit or level of acceptable resolution must be established to set the maximum height of flight. On the basis of the GSD concept, the height of flight can be defined by applying Equation (1) [12].
    FH = GSD·FL·PN/SW,
    where FH is the height of flight (m), GSD is the Ground Sample Distance (m), FL is the focal length (mm), PN is the number of pixels per image width, and SW is the sensor width (mm). After setting the GSD that is desired to obtain, Equation (1) determines the height of flight that guarantees that resolution. This procedure is constrained when low-cost sensors are applied, as the focal length may suffer variations that alter the metric desired. However, this parameter can be determined with relatively good precision during calibration. Another disadvantage lies on the lack of defined GSD values for the different applications of the virtualization. This is due to the difficulties to establish a required level of detail for an archaeological site, in which the asset or the land to model can have very different dimensions. Hence, it can be stated that this is one of the main factors to define in a flight project [13], and there is a great controversy about fixing its value. At best, the authors of several works focused on this field offer an approximate recommendation of the values to apply.
  • Forward overlap. It is defined as the overlapping between two consecutive frames in the same pass. It is generally expressed as a percentage of the surface covered. It allows the stereoscopic overlap and the 3D representation. Typical forward overlap values range between the minimum that is applied in conventional photogrammetry (60%), and those applied to generate ortophotographs (80–90%). A small forward overlap implies little stereoscopic aliasing. On the other hand, a high value implies developing flights with many more photographs, which can imply a problem for the management of the data. However, a high value is usually adopted in order to guarantee good 3D models and ortophotographs.
  • Lateral overlap. It is defined as the overlap between two consecutive passes of a same photogrammetric flight. It is usually expressed as a percentage of the surface covered, and it permits the stereoscopic overlap and the 3D representation. Typical values of lateral overlap range between the minimum applied in conventional photogrammetry (20%) [12] and the one applied for orthophotographs (80%). Again, a small lateral overlap implies little stereoscopic overlapping, while a high value implies more. A high value implies flights with many more passes, which can be a problem for the processing of data. As it happens with the forward overlap, a high value is usually applied to ensure overlapping and, therefore, good models and orthomosaics.
  • Inclination angle of the sensor. It is defined as the angle that the optical axis of the camera forms with the vertical direction, measured from the nadir. Conventional photogrammetry is characterized by being of vertical axis. The gimbal suspension that is embodied in the sensor keeps it perpendicular to the focal plane and avoids possible deviations. Nevertheless, due to the existence of certain elements of structures, a change in the inclination angle can be interesting to obtain images with more altimetric information of the objects that are desired to model (buildings, etc.) [14]. Finding recommendations about this parameter is not easy, and it is undoubtedly one of the most important to avoid gaps in the geometric model, and to provide a high visual value. In this regard, and considering the relative position of the surface the element to be captured and the principal axis of the camera [15], examples of perpendicular [16], oblique, and a combination of both types of shots can be found in literature [17].

2.2. Taguchi Design of Experiments Method

Nowadays, there is great interest in quality management. It seeks processes that provide products in the fastest, most efficient, and as economic as possible way. According to this interest, different procedures and statistic methodologies have been developed to evaluate and improve certain processes by analyzing the involved parameters of factors and taking actions. This can be applied to photogrammetric flights, which are nothing but a process aimed at taking photographs of the territory. As mentioned in the previous section, these processes count with a series of factors that are involved in the quality of the final product. This research is focused on the application of the Taguchi Design of Experiment (DOE) Method [18] for the optimization of the photogrammetric flight.
This technique was developed by the Japanese engineer Genichi Taguchi. It is an “ad hoc” experiment that allows choosing the process that works more consistently within a certain operative environment. The basic assumption is that not all the factors that cause variability can be controlled. The goodness of Taguchi Method is that it finds a good design (although it may not be the best) by developing a relatively reduced number of experiments, so that it reaches a good cost/benefit ratio. Although its initial uses were focused on the field of quality engineering [19], recent examples related to different disciplines such as mechanical [20] and oil [21] technologies, management of polluted soils [22], structural monitoring [23], or medicine [24] can be found. Considering its use in the field of photogrammetry with UAV platforms, it has been applied to the process of data management [25,26], but not to the design of the flight.
Before starting the experiment, noise and control factors must be identified. It can be stated that a photogrammetric flight designed with Taguchi DOE Method will be optimized, as all the factors will have been properly chosen.
The technique is based on the application of an orthogonal matrix that indicates the experiments that must be developed. It is also known as orthogonal arrange, and it estimates the effects of the factors in the average response and the variation. In addition to this, as it is an orthogonal arrange, the design is balanced: the levels of the factors are equally weighted. This allows that every factor can be evaluated without taking into account the rest of factors: the effect of a factor does not affect the estimation of another. As the designs with orthogonal arranges are mainly focused on the key effects, the time, and costs associated to the experiment are reduced.
Taguchi DOE Method can be developed in dynamic or static ways. The dynamic design applies the signal factors, that is to say, those that are controlled by the user during their application with a range of values. In a design with dynamic response, the characteristic of quality works through a range of values, and the final objective is to improve the relation between a signal factor and the output response.
Taguchi DOE Method applies the fractional factorial designs or orthogonal arrays. However, when the number of factors is increased, the possible interactions also raise, and due to this, the difficulties to identify which are the specific conditions to experiment. Taguchi developed a series of orthogonal arrays that called:
La = (b)c.
Taguchi’s design for an experiment with four control factors and three levels of variability corresponds to the L9 matrix, which is shown in Table 1.
According to the characteristic that is desired to obtain: there are three alternatives to calculate the signal-to-noise ratio: smaller is better, nominal is best and larger is better. In this case, since the error of geometry of the final model is assessed, it is aimed that the error tends to zero, which means that the model suits the reality that it represents. The signal-to-noise ratio that optimizes the photogrammetric flight is the one with the bigger value, which is the one that minimizes the error, and can be defined as it follows:
S / N = 10 · log 10 1 n i = 1 n y i 2 ,
where S/N is the signal-to-noise ratio, n is the number of repetitions, and yi is the observed value.
After obtaining the signal-to-noise ratio for each arrange, the average signal-to-noise ratio is calculated.
S / N ¯ = 1 9 i = 1 9 ( S / N ) i ,
where S / N ¯ is the average signal-to-noise ratio and S/Ni are the signal-to-noise ratios of each test.
The results obtained from the signal-to-noise ratio can be analyzed with several procedures. In this particular case, the statistic technique that has been applied to determine the influence of each parameter is the Pareto-ANOVA Method [27]. It is a fast and simple technique that considers the signal-to-noise ratio of all the tests and allows for identification of the most influent parameter on the final result, which is the one with the greatest variability between the average signal-to-noise ratios for each level and parameter (Δ).
On that purpose, the sum of squares of the variation with respect to the average (SS) is calculated.
SS = i = 1 9 [ S / N S / N ¯ ] 2 .
After that, the sum of squares for every parameter (SSi) is determined.
SS i = i = 1 3 [ ( S / N ) ij S / N ¯ ] 2 ,
where (S/N)ij are the average signal-to-noise ratios for each level of each parameter.
Finally, the contribution of each parameter is calculated by the application of Equation (7).
Contribution   ( % ) = SS i SS   · 100 .

2.3. Methodological Proposal Adapted for the Optimization of Flights

Starting from the premise of this research, the optimization of the potential photogrammetric flights over archaeological sites, to obtain a 3D model that allows for virtualization with the added advantage of good metrics, Taguchi DOE Method is applied to enhance the most relevant parameters that the pilot can modify (control factors). After the analysis that was developed in Section 2.1., it seems reasonable that the most determinant factors are the ones included in Table 2. The levels for each parameter range according to the recommendations and values applied in several works of research related to the application of aerial photogrammetry with UAV to the analysis of archaeological sites and structures [1,28,29,30,31].
Taguchi DOE Method applied to four factors with three different levels implies a matrix with nine arranges or tests. It is worth noting that there are other procedures such as Fisher DOE Method, that require 34 tests. This entails the development of 81 flights, in order to obtain 81 models to contrast the variation of their accuracy. This large volume of experiments, which implies important costs and time, justifies the application of Taguchi DOE Method. For this particular case, the resulting matrix is shown in Table 3.
It is worth noting that the meteorologic conditions related to the wind speed and direction, and the lightning, are left as noncontrollable or noise factors. However, their incidence can be reduced with a proper planification of the flight in terms of date and hour. For the analysis, a statistical value is proposed for every test: the average signal-to-noise ratio, which is obtained from the measurements taken in each of them. Otherwise, the dependence of the parameter of interest with respect to the controllable variables can be analyzed, and the effects of noise factors can be compensated, with the identification and optimization of those upon which it is possible to act.
Given the objective of this research, the error that is committed when measuring a distance is adopted as fundamental variable for its determination. For this purpose, eight 1-m-long stadias were evenly distributed on the archaeological site before developing the flights, so as to be able to determine the geometric accuracy of the model. These elements have been selected, rather than other structures that already existed in the site, due to their easy identification in photographs, and the accuracy that, as a standard [32,33], they must have. From these measurements, it will be possible to establish the signal-to-noise ratio proposed by Taguchi, thus analyzing the dependence of the final result geometry with respect to the design variables of the flight project.
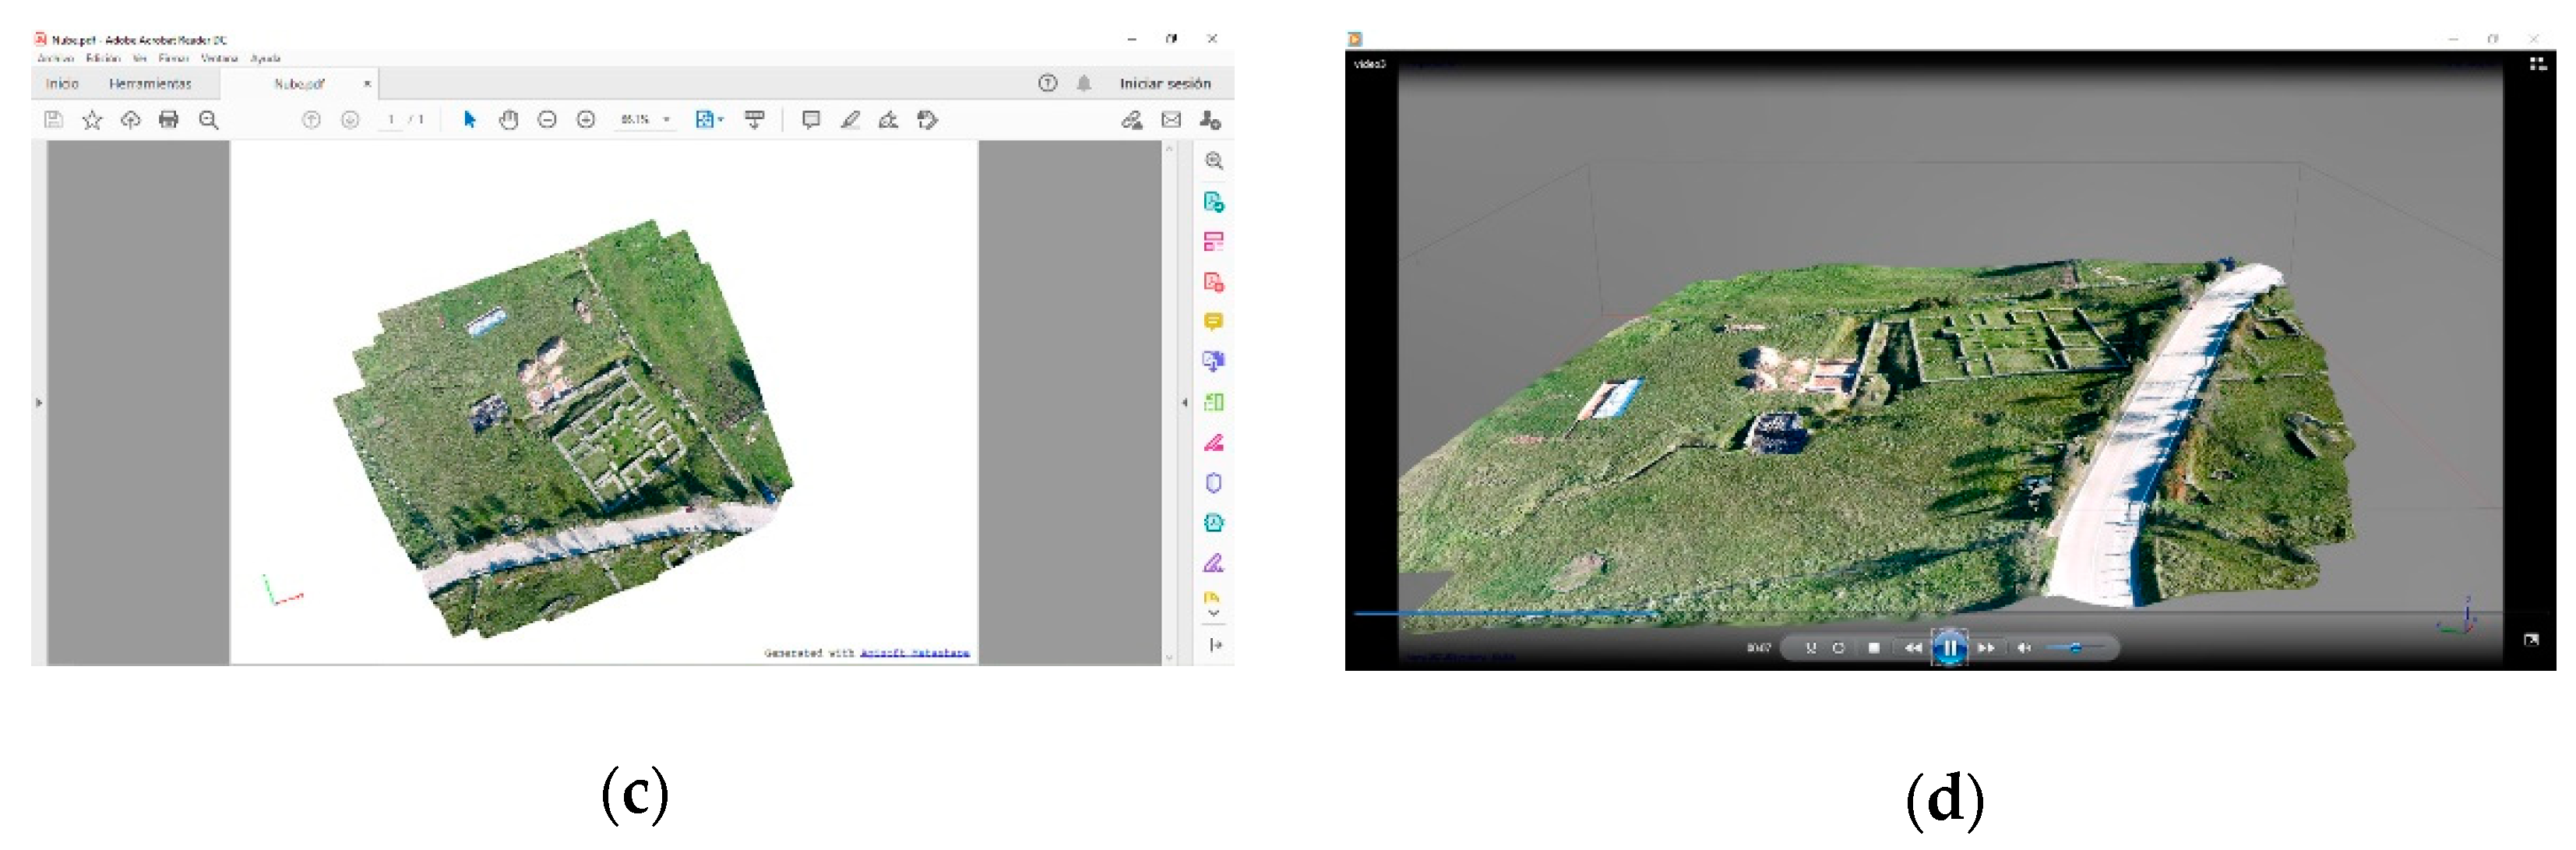
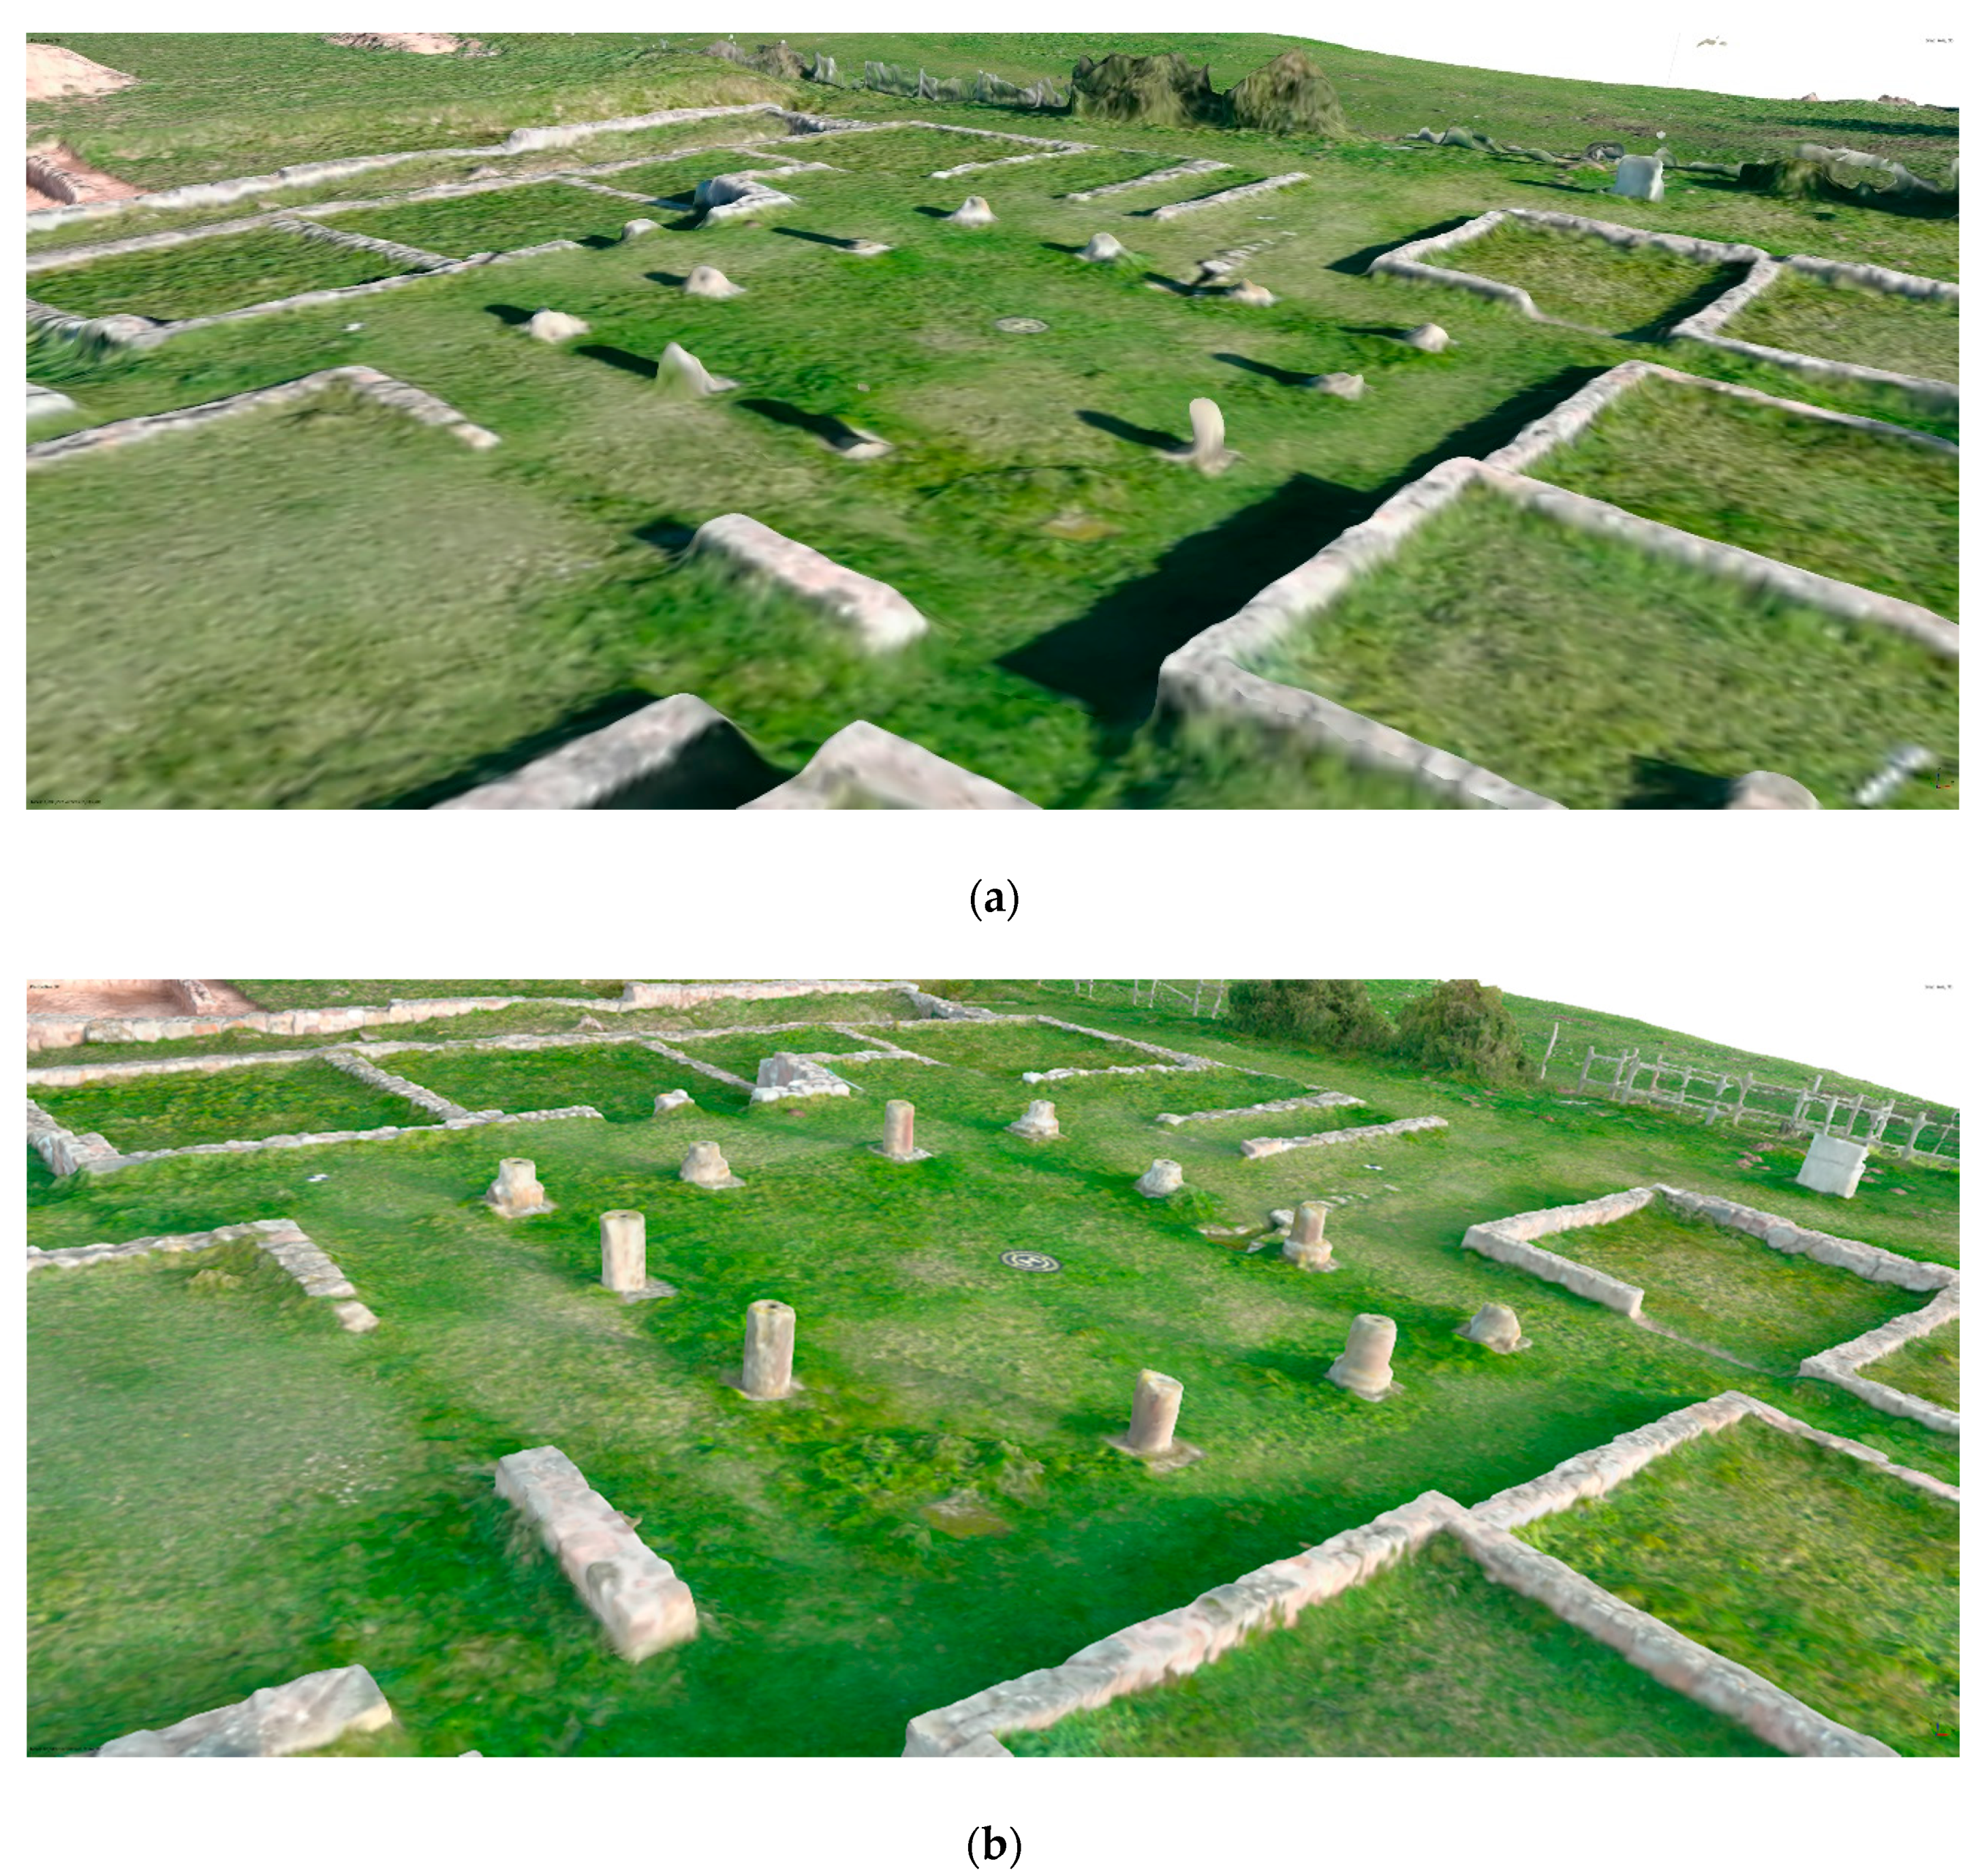
From the images of each photogrammetric block, which were acquired with the flights included in the Taguchi orthogonal matrix, their management with photogrammetric software is arranged. Texturized 3D models are generated according to the workflow proposed by the program itself, with the same configuration of the intermediate processes. Had the models been obtained, measurements of the different stadias will be taken in all of them by the application of the built-in tools, so that the geometric error of the different parts of the model can be defined to determine the signal-to-noise ratio that allows contrasting results.
The signal-to-noise ratio is calculated, thus obtaining a value for each test. The average value of the parameter is calculated for each one of the three levels of the four parameters subsequently. This allows for comparison of the results. The most suitable level will be defined for each parameter as the one that shows a higher average of the signal-to-noise ratio.

3. Results

The results of the application of the methodological proposal to the case study, which in this case is developed in the archaeological site of Juliobriga, are described below.

3.1. Juliobriga

The Roman civitas of Juliobriga is located in the current village of Retortillo, which is part of the Municipality of Campoo de Enmedio (Cantabria, North of Spain, Figure 1) [34]. The city was developed on a hill whose height is over 900 m. Mentions to Juliobriga can be found in Pliny the Elder’s works, who included it among the settlements that constituted the Conventus Cluniensis, within the province of Hispania Citerior, and considered it as the only noticeable populus in Cantabria. Ptolomeo cited it as one of the eight cities whose center was in this territory, and the only one that did not receive its name from indigenous groups after the Roman conquest. “Juliobriga” alludes to the nomen of the imperial family (Ivlii), and to the suffix -briga, which reflects the origin of the civitas within the program of urbanization that was promoted by Emperor August after the Cantabrian Wars (19 BC). Although the date of foundation is unknown, its coincidence with August’s third trip to Hispania is commonly accepted (15 BC) [35]. The process of urbanization was completed during the first century AD and was kept in use until the middle decades of the third century.
The archaeological site, whose excavations have been developed since 1940, has an approximate surface of 18,000 m2. It counts with three distinct areas (Figure 2): “La Carretera” (“The Road”), “El Foro” (“The Forum”), and “La Llanuca” (“The Little Plain”). The most recent works of excavation were developed in a dwelling known as “La Casa de los Mosaicos” (‘The House of Mosaics’), which is located in the area of “La Carretera.” This house had an arcaded courtyard of over 800 m2 and private therms. This research is developed in the northern sector of “La Carretera.”
Considering the nature of this research, it is worth mentioning other previous surveying works that were developed on this site [36]. In this regard, a photogrammetric flight allowed the generation of an orthomosaic at a scale of 1:500 in 1994 and a Digital Terrain Model (DTM), which covered the excavations that were developed until 1999 at a scale of 1:200, according to the Universal Transverse Mercator Projection, with an equidistance between the level curves of 1 m. For the development of the latter, the coordinates were linked to the National Geodetic Network by means of GPS, with the implementation of four topographic vertices that allowed providing coordinates to the complete set of points and densifying the number of vertexes with traverses until the area of interest was covered. Finally, the points that defined the site in a geometrical way were radiated, with 2500 records.

3.2. Design of the Experiment

The Autel Robotics EVO Pro II Platform (Figure 3), which is one of the most versatile low-cost drones nowadays, was applied for this experiment.
This platform is characterized by its reduced weight, slightly over 1 kg, a battery autonomy of 40 min, a maximum speed of 20 m/s, and a maximum range of transmission of 9 km. In addition to this, its little dimensions make it perfectly easy to handle. However, its biggest advantage is the RGB (Red, Green, Blue) sensor that is mounted on it. In this regard, it is possibly one of the devices with the best price/quality ratio. Its main features are shown in Table 4.
Had the sensor been stablished, the next step implies the definition of the several configurations of the photogrammetric flights by setting the four parameters with their three levels, which correspond to the ranges that are conventionally applied in photogrammetry. Height of flight, forward and lateral overlap, and the inclination angle of the sensor are fixed according to the design that is shown in Table 3. The combination of factors affects the complexity of the project in a substantial way (Figure 4 and Table 5).
It is worth mentioning that, as described in the methodological proposal, the experiment has been structured according to the nine flights that are shown in Table 3. When working in a case similar to the one that is described in this work, the archaeological site of Juliobriga, which is characterized by the presence of half-meter-high walls, the development of double-grid flights is interesting to obtain images of all the surfaces of the existing structures and, therefore, to improve the result. All the flights are designed according to this procedure, so as to reduce hidden areas in the model. In addition to this, in order to improve the orientation and scaling of the models and taking into account the use of low-cost sensor, pre-signaling with 15 GCPs is applied. These points are materialized with photogrammetric targets (Figure 5a). For the observation of these GCPs in RTK (Real Time Kinematics) mode, two Leica Global Positioning System (GPS) Leica GS-15 devices were applied.
As mentioned, the use of quantitative parameters to assess the influence of each parameter in the suitability of the model is sought. Special attention is paid to the metric aspect, and to develop a proper contrast of the geometric fidelity of the models generated from the different configurations of flights, the lengths of a series of standard elements are measured in them. These elements are 1-m-long stadias, which are characterized by their invariability and the good definition of their length, due to the nature of the material that is used for their manufacturing. To this end, eight stadias were distributed through the area that was considered for the development of this research (Figure 5b).
The location of the support (targets) and control elements (stadias) are shown in Figure 6.

3.3. Data Management

The software Leica Ski-pro was applied for the treatment of GPS data, which allows calculating coordinates according to the System of Reference chosen, ETRS89-UTM. The software Autel Explorer was used to program the flights, which permits designing flight projects or missions.
For the management of the images that were obtained from the photogrammetric flights, which implies alignation, orientation, scaling and the generation of point-clouds, models, and orthophotographs, Agistoft Metashape was applied.
One of the advantages of this software is related to the camera self-calibration function, which applies the Exchangeable Image File Format (EXIF) data of the images. This permits solving an important problem in the field of photogrammetry by means of analytic processes [37], as it improves the internal model and physical parameters of the camera, and minimizes the influence of the variables that affect its metric performance [38]. This is particularly indicated for low-cost cameras. The camera self-calibration developed with Agisoft Metashape determines the focal length, the principal point, and the coefficients that are obtained from a polynomial adjustment that is aimed at solving the radial and tangential distortions. The focal length and the coordinates of the principal point can be expressed in millimeter or pixels, while the coefficients are dimensionless parameters. The set of parameters for the camera that was applied for the development of the work are shown in Table 6.
The technical requirements of hardware were not too demanding, as the models used up to 685 images, with total size was 8.0 GB. The data were processed with a device whose features are listed below:
  • Intel Core i7 3770 K, with CPU at 3.5 GHz, 3901 MHz;
  • Four main processors and eight logical processors;
  • RAM: 32 GB;
  • Hard disk: 2 TB;
  • Graphic Card: GeForce GTX560.

3.4. Results of the Tests

Table 7 shows the results obtained for each flight by measuring the lengths of the stadias that were located in the study area (expressed in cm) and the signal-to-noise ratio for the error that was committed when measuring the distance, according to Equation (3). It is worth noting that the measurement of distance of the eight stadias was not possible for all the designed flights due to the luxuriance of the grass. However, its incidence is minimal and the signal-to-noise ratio is calculated with the average of the deviations that were obtained for each test, which range between seven and eight values.
After considering the results of each flight, the statistic values related to each level of the different parameters (height of flight, forward and lateral overlap, and angle of inclination). For every parameter and level, an average signal-to-noise ratio and variability is obtained (Table 8). The latter expresses the maximum variation of the signal-to-noise ratio for each parameter, according to Equations (6) and (7).
According to the analysis of the variability, it can be stated that the influence of the inclination is much higher than those of the rest of the factors. Table 9 summarizes the results obtained from the calculation of the average signal-to-noise ratio, the sum of squares (SS) of the average variation, and the sum of squares for each parameter.
From these data, the individual contribution of each parameter (Table 10) can be calculated according to Equation (7).
On the light of the results the analysis according to Taguchi DOE Method, the suitable combination of factors to optimize the photogrammetric flight with respect to the geometrical goodness is the one that fixes the height of flight at its lowest level (15 m), the forward and lateral overlaps at their highest levels (80% for both), and the angle of inclination at its lowest level (nadiral).

3.5. Results of the Model

As previously mentioned, the selection of Taguchi DOE Method implies a substantial reduction in the number of tests required to determine the optimal combination of parameters. However, it has a disadvantage with respect to the application of Fisher DOE Method, i.e., the combination that is indicated as optimum by the method can be absent among those initially set for the development of the experiments. This situation is precisely what happens in this particular research: the optimum combination (height of flight of 15 m, forward and lateral overlaps of 80%, and inclination angle of 0°) is not included in the set of flights prescribed by the L9 matrix. In an actual case, the territory/object should be flight again to obtain the precise model. As this is not the aim of this research, the results of the most accurate flight among the ones developed for the application of Taguchi DOE Method, that is to say, the one with the highest signal-to-noise ratio is used. According to Table 7, the flight that satisfies this condition and, therefore, improves the metric quality, is flight number 5. This is the reason why, among the flights developed, it is the most suitable for the virtualization of the site, and is applied as the basis for the generation of several graphic outputs.
The management of the data obtained from the flights allows the generation of point-clouds. Figure 7a,b shows two point-clouds obtained from the flight selected. They are characterized by different densities of points (27,478 and 21,858,754 points, respectively). The point-clouds are suitable for the ex-situ measurement of distances. In addition to being a first graphic output, the point-clouds are the basis for the generation of meshed models (Figure 7c,d).
Point clouds can be applied to generate outputs, which are characterized by offering a higher sensation of realism and tangibility, due to the availability of triangulated and texturized surfaces (Figure 8a), instead of a representation of the asset from a quasicontinuous set of points. These triangulated models allow measuring volumes, which is interesting for the analysis of the element/territory that has been modelled. Traditional orthophotographs can be generated (Figure 8b). It is worth mentioning that although all these outputs can be managed by means of open-source software, an application with noticeable interest is the one related to the generation of interactive PDFs, whose management is easy and even allow simple measurements (Figure 8c) or a simple dissemination of the asset. Other products of interest that can be obtained from these models are the virtual itineraries (Figure 8d) or the development of interactive application, which increase the user’s interaction with the representation of the asset.
Before ending this section, it seems coherent offering the results with the resolution of accuracy with which the models and the subsequent virtualization are developed, as the general views of the archaeological site that are shown in Figure 7 and Figure 8 can lead to think that they might lack the required level of detail. Figure 9 offers a comparison between the models obtained with the worst and best flights.

4. Discussion

After applying the Taguchi DOE Method to optimize the photogrammetric flights that are developed with UAVs to generate the information required for the metric virtualization of archaeological sites, several interpretations regarding the results obtained can be presented:
  • Had Taguchi DOE Method been selected, the noise and control parameters or factors have been selected. During the development of this research, the different levels among which the control parameters range were developed. Had the height of flight (15–45–75 m), the forward (60–70–80%) and lateral (60–70–80%) overlaps, and the inclination of the camera with respect to the nadir (0–30–60°) been selected, an experiment with nine photogrammetric flights was proposed. According to the accuracy of each model, the one with the highest variability, and therefore, the one that can be considered as optimal, and the incidence of each factor were determined.
  • The results support that the most suitable parameters for the flights applied for the generation of models that allow a subsequent metric virtualization of objects/territories in similar archaeological sites to the one considered in this research are a height of flight of 15 m, forward and lateral overlaps of 80% (it must be noticed that the variation in the variability of both recoveries for flights with 70% and 80% is very little, which allows adopting the first value to reduce costs while maintaining quality), and an inclination of the sensor of 0° (nadiral). These results become the methodological proposal for the dimensioning of photogrammetric flights with UAVs whose aim is the generation of accurate 3D models with low-cost models. This is the main scientific contribution of this research, since none have been found during the bibliographical review. This highlights the relevance of this proposal.
  • In addition to the foregoing, this research reports the influence of each parameter, which implies that the main factors that condition the variability are the angle of inclination of the sensor (its influence is 16.4 times higher than that of the height of flight, which is less incident factor), the forward overlap (3.4 times), and the lateral overlap (1.3 times higher with respect to the influence of the height of flight). This indicates the parameters that should stop being considered as variables, given their great influence on the accuracy. More specifically, the inclination of the sensor should not be applied as a variable any longer, and the flights should be restricted to the nadiral ones. This is the other relevant contribution of this research, as a very commonly applied technique among UAVs pilots is the application of flights with sensor inclinations that allow acquiring details in the vertical plane (building facades, etc.). This improves the visual aspect of the model, as it avoids gaps, but clearly affects the accuracy in a negative way. The influence of the other three factors, height of flight, and forward and lateral overlaps is much more alike, and their variabilities are smaller, so not considering them is not adequate.
  • Time requirements and their relation with the design of the flight should be noticed. The comparison among the flights that have been developed shows that the differences between those with the best and the worst metric qualities (flights 4 and 5; Table 5) are just 23 images, 1 min of flight, and 23 min of data processing. The best flight in terms of metric performance required 58 images, 10 min of acquisition and 95 min of processing. All the foregoing implies that the difference in the total amount of time needed for the generation of the worst model is only 22.85% lower than that needed to get the best one within the initial set. In addition to the foregoing, the difference in terms of effort between the flights with the highest and lowest requirements (flights 8 and 3; Table 5) is wide. If the efforts needed to generate the models from the different flights are compared, the requirements related to the best one in terms of metric performance are well positioned and perfectly assumable. Hence, it can be stated that it is well balanced in terms of effort. A deeper analysis of the effort could be developed by setting another experiment based on the application of Taguchi DOE Method, which should be the aim of another research.
  • It is worth mentioning that the application of Taguchi DOE Method to the optimization of accurate photogrammetric flights with nonmetric sensors can be based on the contrast of other variables, such as the GSD of the model that is obtained. Beforehand, the result should be similar, but this implies another line of research with a close but not exactly equal approach. It should be reminded that the model must have to satisfy other requirements apart from the accuracy, such as a good visual condition of the virtualization, feasible times for the management of the data, tractable file sizes, etc. All these characteristics could be analyzed with another application of Taguchi DOE Method, as the tests and the research itself would be different. This would permit the optimization of not only the photogrammetric flight, but the whole process in a global way, since all these factors affect the final result of the virtualization.

5. Conclusions

Nowadays, virtualization is a widely extended process. The advantages of the virtualization of an object/archaeological site are undeniable, and society increasingly requires these tools that allow the dissemination of information. If the virtualization is required to have an adequate metric (metric virtualization), the information that is adopted as basis for its development (the initial model) must have the proper metric. The metric goodness is a feature that eases the integration, management, or maintenance of the archaeological asset, and it is fundamental to advance in the processes of virtualization.
There are many sensors that allow a fast and accurate collection of data of any object/territory that is desired to model (remote sensing, laser scanner, lidar, etc.), although the use of low-cost sensors is increasingly common. In the latter, the metric is not as rigorous as in the case of metric sensors. This research is aimed at optimizing flights with low-cost sensors, so as to ease the generation of accurate information that boost the processes of virtualization.
After selecting the nonmetric sensor to apply in a certain photogrammetric flight with UAV, the next issue to solve is the selection of the parameters that are involved in the geometry of the flight, in order to obtain the most accurate model. It can be stated that the flight will have been optimized. During the development of this research, Taguchi DOE Method has been proposed instead of other available statistical procedures, because it permits optimizing the flight project to obtain the best accuracy possible with a reduced number of tests. In addition to this, it permits analyzing the influence of each parameter according to the variability and, therefore, redefining the parameters that influence the flight project in terms of the required accuracy. The application of this process to analyze the accuracy of the geometric model can be extrapolated to other stages of the virtualization, so as to optimize the whole process.
As a result of the application of Taguchi DOE Method, a methodological proposal for the development of photogrammetric flights with nonmetric sensor is obtained. This allows optimizing the accuracy of the models that are applied for the subsequent virtualization. This proposal implies the main contribution of this research, and arises as the first robust proposition that exists nowadays related to this matter. The proposal sets four parameters: height of flight (15 m), forward and lateral overlaps (80% in both cases), and inclination angle of the sensor (0°). In addition to this, it justifies removing the inclination angle when trying to obtain accurate models. Angles different than 0 are commonly applied by UAVs pilots when developing this kind of photogrammetric flights, and this research justifies the negative consequences that they imply on the accuracy of the model.

Author Contributions

Conceptualization, J.M.d.L.-R., J.S.-C., and R.P.-Á.; formal analysis, J.M.d.L.-R., J.S.-C., and R.P.-G.; investigation, J.M.d.L.-R., J.S.-C., and R.P-G.; methodology, J.M.d.L.-R., J.S.-C., and R.P.-Á.; fieldwork, J.M.d.L.-R., R.P.-G., and J.S.-C.; data management, J.S.-C. and R.P.-G.; supervision, J.M.d.L.-R.; writing—original draft, J.M.d.L.-R., J.S.-C., R.P.-Á., R.P-G., and B.M.-P.; writing—review and editing, J.M.d.L.-R., J.S.-C., R.P.-G., R.P.-Á., and B.M.-P. All authors have read and agreed to the published version of the manuscript.

Funding

This research received no external funding.

Institutional Review Board Statement

Not applicable.

Informed Consent Statement

Not applicable.

Data Availability Statement

The data presented in this study are openly available in the repository of the University of Cantabria, at: https://disco.unican.es/public/?file=3175d60f. The following password is required: Appl. Sci.

Conflicts of Interest

The authors declare no conflict of interest.

References

  1. Ruiz Sabina, J.; Gallego Valle, D.; Peña Ruiz, C.; Molero García, J.; Gómez Laguna, A. Aerial photogrammetry by drone in archaeological sites with large structures. Methodological approach and practical application in the medieval castles of Campo de Montiel. Virtual Archaeol. Rev. 2015, 6, 5–19. [Google Scholar] [CrossRef] [Green Version]
  2. Daponte, P.; De Vito, L.; Mazzilli, G.; Picariello, F.; Rapuano, S. A height measurement uncertainty model for archaeological surveys by aerial photogrammetry. Measurement 2017, 98, 192–198. [Google Scholar] [CrossRef]
  3. Battulwar, R.; Winkelmaier, G.; Valencia, J.; Naghadehi, M.Z.; Peik, B.; Abbasi, B.; Parvin, B.; Sattarvand, J. A practical methodology for generating high-resolution 3D models of open-pit slopes using UAVs: Flight path planning and optimization. Remote Sens. 2020, 12, 2283. [Google Scholar] [CrossRef]
  4. Hill, A.C.; Laugier, E.J.; Casana, J. Archaeological remote sensing using multi-temporal, drone-acquired thermal and near infrared (NIR) imagery: A case study at the Enfield Shaker Village, New Hampshire. Remote Sens. 2020, 12, 690. [Google Scholar] [CrossRef] [Green Version]
  5. Mesas-Carrascosa, F.J.; García, M.D.N.; De Larriva, J.E.M.; García-Ferrer, A. An analysis of the influence of flight parameters in the generation of unmanned aerial vehicle (UAV) orthomosaics to survey archaeological areas. Sensors 2016, 16, 1838. [Google Scholar] [CrossRef] [PubMed] [Green Version]
  6. Koch, T.; Körner, M.; Fraundorfer, F. Automatic and semantically-aware 3D UAV flight planning for image-based 3D reconstruction. Remote Sens. 2019, 113, 1550. [Google Scholar] [CrossRef] [Green Version]
  7. Saifizi, M.; Azani Mustafa, W.; Syahirah Mohammad Radzi, N.; Aminudin Jamlos, M.; Zulkarnain Syed Idrus, S. UAV based image acquisition data for 3D model application. IOP Conf. Ser. Mater. Sci. Eng. 2020, 917, 012074. [Google Scholar] [CrossRef]
  8. Kauhanen, H.; Rönnholm, P.; Vaaja, M.; Hyyppä, H. Designing and building a cost-efficient survey drone. Int. Arch. Photogramm. Remote Sens. Spat. Inf. Sci. 2020, 43, 165–172. [Google Scholar] [CrossRef]
  9. Doukari, M.; Batsaris, M.; Papakonstantinou, A.; Topouzelis, K. A protocol for aerial survey in coastal areas using UAS. Remote Sens. 2019, 11, 1913. [Google Scholar] [CrossRef] [Green Version]
  10. Özyeşil, O.; Voroninski, V.; Basri, R.; Singer, A. A survey of structure from motion. Acta Numer. 2017, 305–364. [Google Scholar] [CrossRef]
  11. Hill, A.C. Economical drone mapping for archaeology: Comparisons of efficiency and accuracy. J. Archaeol. Sci. Rep. 2017, 24, 80–91. [Google Scholar] [CrossRef]
  12. Tziavou, O.; Pytharouli, S.; Souter, J. Unmanned Aerial Vehicle (UAV) based mapping in engineering geological surveys: Considerations for optimum results. Eng. Geol. 2017, 232, 1–22. [Google Scholar] [CrossRef] [Green Version]
  13. Trajkovski, K.K.; Grigillo, D.; Petrovič, D. Optimization of UAV flight missions in steep terrain. Remote Sens. 2020, 12, 1293. [Google Scholar] [CrossRef] [Green Version]
  14. Ewertowski, M.W.; Tomczyk, A.M.; Evans, D.J.A.; Roberts, D.H.; Ewertowski, W. Operational framework for rapid, very-high resolution mapping of glacial geomorphology using low-cost Unmanned Aerial Vehicles and structure-from-motion approach. Remote Sens. 2019, 11, 65. [Google Scholar] [CrossRef] [Green Version]
  15. Gómez-López, J.M.; Pérez-García, J.L.; Mozas-Calvache, A.T.; Delgado-García, J. Mission flight planning of RPAS for photogrammetric studies in complex scenes. ISPRS Int. J. Geo-Inf. 2020, 9, 392. [Google Scholar] [CrossRef]
  16. Taddia, Y.; González-García, L.; Zambello, E.; Pellegrinelli, A. Quality Assessment of Photogrammetric Models for Facade and Building Reconstruction Using DJI Phantom 4 RTK. Remote Sens. 2020, 12, 3144. [Google Scholar] [CrossRef]
  17. Piech, I.; Ruzyczka, A. Generating of building facades orthophotoplans with UAV and terrestrial photos. IOP Conf. Ser. Earth Environ. Sci. 2019, 221, 012074. [Google Scholar] [CrossRef]
  18. Taguchi, G. Introduction to Quality Engineering: Designing Quality Into Products and Processes, 1st ed.; Asian Productivity Organization: Tokyo, Japan, 1986; 191p. [Google Scholar]
  19. Taguchi, G. Quality Engineering in Production Systems, 1st ed.; McGraw-Hill: New York, NY, USA, 1988; 173p. [Google Scholar]
  20. Dutta, S. Kumar Reddy Narala, S. Optimizing turning parameters in the machining of AM alloy using Taguchi methodology. Measurement 2021, 169, 108340. [Google Scholar] [CrossRef]
  21. Subramani, S.; Govindasamy, R. Application of MRSN ratio and Taguchi parametric design in optimization of parameters of DI CI engine fueled with diesel-biodiesel-higher alcohol blends. Fuel 2021, 285, 119116. [Google Scholar] [CrossRef]
  22. Razmi, B.; Ghasemi-Fasaei, R.; Ronaghi, A.; Mostowfizadeh-Ghalamfarsa, R. Investigation of factors affecting phytoremediation of multi-elements polluted calcareous soil using Taguchi optimization. Ecotoxicol. Environ. Saf. 2021, 207, 111315. [Google Scholar] [CrossRef]
  23. Nokhbatolfoghahai, A.; Navazi, H.; Groves, R. Evaluation of the sparse reconstruction and the delay-and-sum damage imaging methods for structural health monitoring under different environmental and operational conditions. Measurement 2021, 169, 108495. [Google Scholar] [CrossRef]
  24. Lin, C.J.; Jeng, S.Y.; Chen, M.K. Using 2D CNN with Taguchi parametric optimization for lung cancer recognition from CT images. Appl. Sci. 2020, 10, 2591. [Google Scholar] [CrossRef]
  25. Lin, H.L.; Chou, Y.T.; Hsia, S.Y. Optimized Parameters on Enhanced Precision of Image Matching in UAS Photogrammetry. In Proceedings of the 2018 IEEE International Conference on Advanced Manufacturing, Yunlin, Taiwan, 16–18 November 2019; Meen, T.-H., Ed.; Institute of Electrical and Electronics Engineer: Reedhook, NY, USA, 2019; pp. 194–197. [Google Scholar]
  26. Sibaruddin, H.I.; Shafri, H.Z.M.; Pradhan, B.; Haron, N.A. UAV-based approach to extract topographic and as-built information by utilising the OBIA technique. J. Geosci. 2018, 6, 103–123. [Google Scholar] [CrossRef]
  27. Vankanti, V.K.; Ganta, V. Optimization of process parameters in drilling of GFRP composite using Taguchi method. J. Mater. Res. Technol. 2014, 3, 35–41. [Google Scholar] [CrossRef] [Green Version]
  28. Morgenthal, G.; Hallermann, N. Quality assessment of unmanned aerial vehicle (UAV) based visual inspection of structures. Adv. Struct. Eng. 2014, 17, 289–302. [Google Scholar] [CrossRef]
  29. Stek, T.D. Drones over Mediterranean landscapes. The potential of small UAV’s (drones) for site detection and heritage management in archaeological survey projects: A case study from Le Pianelle in the Tappino Valley, Molise (Italy). J Cult. Herit. 2016, 22, 1066–1071. [Google Scholar] [CrossRef]
  30. Laguela, S.; Diaz-Vilarino, L.; Roca, D.; Lorenzo, H. Aerial thermography from low-cost UAV for the generation of thermographic digital terrain models. Opto-Electron. Rev. 2015, 23, 76–82. [Google Scholar] [CrossRef] [Green Version]
  31. Rakha, T.; Gorodetsky, A. Review of Unmanned Aerial System (UAS) applications in the built environment: Towards automated building inspection procedures using drones. Autom. Constr. 2018, 93, 252–264. [Google Scholar] [CrossRef]
  32. Ali, A.E. Accuracy of stadia tacheometry with optical theodolites and levels. J. King Saud Univ.-Eng. Sci. 1995, 7, 175–184. [Google Scholar] [CrossRef]
  33. Ibraheem, A.T.; Hasim Mehdi, A.; Adil Najeeb, Z. The utilization of stadia measurements for different constructions works. Int. J. Tech. Res. Appl. 2015, 3, 37–44. [Google Scholar]
  34. Cepeda Ocampo, J.J.; Iglesias Gil, J.M.; Ruiz Gutiérrez, A.; Teichner, F. La determinación del perímetro urbano de Iuliobriga (Cantabria): Prospecciones geofísicas y sondeos arqueológicos en el sector de La Llanuca. Madr. Mitt. 2009, 50, 172–196. [Google Scholar]
  35. Fernández Vega, P.A.; Bolado del Castillo, R.; Callejo Gómez, J.; Mantecón Callejo, L. Un término augustal del ager Iuliobrigensium. Arch. Esp. Arqueol. 2012, 85, 267–271. [Google Scholar] [CrossRef] [Green Version]
  36. De Luis Ruiz, J.M.; Ferrer Torio, R. Secuencialización de las actividades topográficas de campo y gabinete desarrolladas en Iuliobriga. In Proceedings of the Cursos sobre el Patrimonio Histórico 4, Actas de los X Cursos Monográficos sobre el Patrimonio Histórico, Reinosa, Spain, 12–23 July 1999; Iglesias Gil, J.M., Ed.; Ayuntamiento de Reinosa: Reinosa, Spain, 1999; pp. 385–394. [Google Scholar]
  37. Brown, D.C. Decentering distortion of lenses. Photogramm. Eng. 1996, 32, 444–462. [Google Scholar]
  38. Mendikute, A.; Yagüe-Fabra, J.A.; Zatarain, M.; Bertelsen, Á.; Leizea, I. Self-calibrated in-process photogrammetry for large raw part measurement and alignment before machining. Sensors 2017, 17, 2066. [Google Scholar] [CrossRef] [PubMed] [Green Version]
Figure 1. Location of Juliobriga.
Applsci 11 01204 g001
Figure 2. Distribution of the excavated areas in the archaeological site of Juliobriga.
Applsci 11 01204 g002
Figure 3. Autel Robotics EVO Pro II.
Applsci 11 01204 g003
Figure 4. Itineraries of different flights. (a) Flight number 3 (height of flight: 15 m; forward overlap: 80%; lateral overlap: 80%). (b) Flight number 1 (height of flight: 15 m; forward overlap: 60%; lateral overlap: 60%). (c) Flight number 4 (height of flight: 45 m; forward overlap: 60%; lateral overlap: 70%).
Applsci 11 01204 g004
Figure 5. (a) Target applied for the photogrammetric support. (b) Stadia.
Applsci 11 01204 g005
Figure 6. Location of stadias and targets.
Applsci 11 01204 g006
Figure 7. Graphic outputs obtained from the most accurate flight. (a) Point-cloud. (b) Dense point-cloud. (c) Wireframe model. (d) Triangulated model.
Applsci 11 01204 g007
Figure 8. Graphic outputs obtained from the most accurate flight. (a) Texturized model. (b) Orthophotograph. (c) Interactive PDF. (d) Virtual itinerary.
Applsci 11 01204 g008aApplsci 11 01204 g008b
Figure 9. Differences in the quality between flights of the initial set. (a) Worst possible flight (number 4). (b) Best possible flight (number 5).
Applsci 11 01204 g009
Table 1. Orthogonal arrange with four factors and three levels L9 = (3)4.
TestFactors
ABCD
11111
21222
31333
42123
52231
62312
73132
83213
93321
Table 2. Control factors and levels for the application of Taguchi Design of Experiments (DOE) Method.
FactorsLevels
123
Height of flight15 m45 m75 m
Forward overlap60%70%80%
Lateral overlap60%70%80%
Inclination angle of the sensor30°60°
Table 3. Proposal for the application of Taguchi DOE Method to photogrammetric flights.
FlightControl Factors
Height of Flight (m)Forward Overlap (%)Lateral Overlap (%)Inclination Angle (°)
11560600
215707030
315808060
445607060
54570800
645806030
775608030
875706060
97580700
Table 4. Main features of the sensor.
Specifications
Configuration6 K
Focal length10.6 mm
Sensor size1’’ CMOS
Maximum resolutionImage: 5427 × 3648
Table 5. Time of flight, number of images, and processing time of each flight.
FlightTime of Flight (min)Number of ImagesProcessing Time (h)
1101724:30
2153168:00
33977412:00
49351:12
510581:35
69421:05
79210:43
85130:41
97220:54
Table 6. Self-calibration parameters.
Parameters
Focal length (pixels)4255.70977
Principal point coordinates (pixels)cx1.77546
cy−13.6019
Radial distortion coefficientsk10.0807059
k2−0.258361
k30.307656
k40
Tangential distortion coefficientsp10.000694868
p20.00221493
Affinity and Skew transformation coefficients.b10
b20
Table 7. Results of the measurement of distances and signal-to-noise ratio.
TestMeasurement of the Stadia Length (cm)S/N
12345678
198.8101.0101.0101.0103.0100.0103.0114.0−14.3624
2101.099.8103.0102.0105.0102.0101.0112.0−13.7116
392.896.3100.096.499.897.5114.0−16.0327
493.8103.0105.0103.097.3102.0126.0−20.4068
598.7102.098.799.3102.099.6104.0110.0−12.0422
695.6103.098.4105.0105.0102.0106.0113.0−15.5919
792.7107.096.4104.099.496.0103.0113.0−16.0961
8107.092.7114.0102.098.788.8111.0−18.9560
998.6103.0104.0102.095.0105.0104.0106.0−12.2063
Table 8. Average signal-to-noise ratio for each factor and level and variability.
LevelHeight of FlightForward OverlapLateral OverlapInclination Angle
1−14.7022−16.9551−16.3034−12.8703
2−16.0136−14.9033−15.4416−15.1332
3−15.7528−14.6103−14.7237−18.4651
Variability1.31142.34481.57985.5948
Table 9. Statistical values associated to each parameters.
Parameters
Average S/N−15.4895
SS variation63.9636
SS height0.9638
SS forward overlap3.2646
SS lateral overlap1.2513
SS inclination angle15.8415
Table 10. Contribution of each parameter.
Contributions
Height1.5068
Forward overlap5.1039
Lateral overlap1.9562
Inclination angle 24.7664
Publisher’s Note: MDPI stays neutral with regard to jurisdictional claims in published maps and institutional affiliations.

