
Influence of Coniferous Wood Conditioning by Pulsed Electric Field on Its Combustion Heat Characteristics


Department of Machinery Exploitation, Ergonomics and Production Processes, University of Agriculture in Krakow, Balicka 116B, 30-149 Krakow, Poland
*
Author to whom correspondence should be addressed.
Appl. Sci. 2021, 11(3), 983; https://0-doi-org.brum.beds.ac.uk/10.3390/app11030983
Submission received: 15 December 2020
/
Revised: 19 January 2021
/
Accepted: 20 January 2021
/
Published: 22 January 2021
(This article belongs to the Special Issue Applied Electromagnetism in Modern Engineering and Medical Technologies)
Abstract
:The article presents the impact of sawdust conditioning from coniferous trees with a pulsed electric field (PEF) on the characteristics of the combustion heat. The study used four variants of electric field parameters, i.e., (I) 300 discharges with an electric field intensity of 25 kV·cm−1, (II) 150 discharges with an electric field intensity of 25 kV·cm−1, (III) 300 discharges with an electric field intensity of 30 kV·cm−1, (IV) 150 discharges with an electric field intensity of 30 kV·cm−1. It should be noted that the interval between successive discharges was 10 sec and it was constant for each variant of the experiment. A change in the characteristics of the heat of combustion was found under the influence of a pulsed electric field on sawdust from coniferous trees in each period of the measurement. The highest temperatures were achieved by the interaction of a pulsed electric field with a discharge pulse of 30 kV·cm−1 and the number of discharge cycles amounting to 300, whereas significantly lower temperature values were recorded with the discharge electric field intensity of 25 kV·cm−1. It was found that the longest times from the moment of ignition to reaching the maximum temperature were obtained for the material after the influence of PEF with an electric field intensity of 30 kV·cm−1 and the number of pulses 300 (IV combination), while the shortest time of the analyzed interval was stated for the first combination of the experiment (electric field intensity 25 kV·cm−1 and a number of pulses 150). The use of a pulsed electric field allows modeling the combustion time of a homogeneous material, which enables the improvement of the process control possibilities, and is also important information for the design of devices intended for biomass combustion.
1. Introduction
Currently, in many countries, the production of energy from biomass constitutes the largest share in the structure of the use of renewable energy, and biomass is believed to be most likely to increase the use of this fuel as a source of renewable energy [1,2,3,4]. Statistically, biomass is one of the three most important sources of fuel used for generating electricity and thermal applications [2]. Nowadays, many modern technologies are used on a global scale to effectively convert biomass into heat, steam energy, as well as liquid and gaseous biofuels [5,6,7,8]. Due to the high potential of wood to be used for commercial biofuel production, it is expected to continuously increase wood resources, especially so-called energy plantations. However, from an economic point of view, these production systems are not financially advantageous, and the clones of trees such as willows and poplars produced by cultivation programs do not grow fast enough to obtain profitable biofuel production [9]. The net amount of biomass in wood depends on the tree species but also on the available amount of solar energy, the amount of energy captured by the plant, the efficiency of photosynthesis conversion or the loss of biomass as a result of plant life processes [10]. The most important parameters characterizing wood and other thermally transformed fuels in terms of their energy use are combustion heat and calorific value [11,12]. These parameters may differ significantly even within the same fuel, which is affected by many factors, and so, for example, pinewood in air-dry conditions may reach values from 18.6 MJ·kg−1 [13] to 20.54 MJ·kg−1 [14]. The heat of fuel combustion decreases with increasing water content, which in the case of wood is stored in the cell walls and in the spaces between dead cells [15,16]. When determining the heat of combustion with the use of a calorimetric bomb, the time and temperature of the medium receiving heat from the bomb body are automatically recorded [17]. As a result of this registration, a time–temperature characteristic is created. Measurement of the temperature of individual periods of the combustion process enables to determine the so-called corrected temperature rise needed to estimate the calorific value. In turn, the duration of individual periods is used to determine the so-called amount of heat exchange in the calorimeter, which allows defining the correction for heat exchange between the calorimeter and the thermostat [18].
It should, however, be noted that there are indications suggesting that the characteristics of the heat of combustion can be modified by proper conditioning of the biological material [19,20,21,22,23]. The most popular methods of pretreatment of organic substances include thermal treatments, which, while improving the conditions of mass transfer, simultaneously cause several unfavorable changes in the product, e.g., irreversible changes in color or degradation of biologically active compounds [24,25,26]. One of the most promising nonthermal pretreatment techniques prior to drying is the use of high voltage pulses that generate a time-varying electric field—pulsed electric field (PEF) [26,27,28]. The interaction with a pulsed electric field causes changes in the structure of the cell membrane called electroporation, which is a process of creating new or enlarging already existing membrane pores. The perforation of the natural structure of the cell membrane facilitates the diffusion of water and components dissolved in it. This reduces the resistance to mass movement (accelerates many processes, e.g., drying or osmotic dehydration) and improves the extraction conditions [29,30,31].
The aim of the presented research was to determine the impact of the pulsed electric field on the characteristics of the combustion heat of the selected biological material and further to determine the combustion curve for each combination of the experiment.
2. Materials and Methods
The paper analysis biological material in the form of sawdust from three coniferous trees, i.e., spruce, fir and larch. The sawdust was subjected to a pulsed electric field with an electric field intensity of 25 kV·cm−1 in two variants of the number of capacitor discharges, i.e., 150 and 300, an electric field intensity of 30 kV·cm−1, where two variants of the number of discharges were also applied, i.e., 150 and 300. The time between successive discharges amounted to 10 s and was the same for each variant of the electric field intensity and the number of discharges. Research on the heat of combustion and calorific value of biological material was carried out in the Laboratory of Experimental Research Techniques for Biological Products and Raw Materials of the Faculty of Production and Power Engineering at the University of Agriculture in Krakow, accredited by the Polish Center for Accreditation with number AB 1698.
Figure 1 presents a simplified schematic diagram of the conducted experiment. It should be noted that each type of sawdust was also tested in the so-called blank test, in the case of which sawdust was not subjected to the pulsed electric field.
The interaction with the pulsed electric field was conducted on the test stand (Figure 2), which generates a pulsed electric field with an electric field intensity from 0 kV·cm−1 to 30 kV·cm−1. The described stand was constructed by ERTEC-Poland, then the device was significantly modified by the authors of this publication due to the specifications of the research carried out. The electric field intensity magnitude adjustment is smooth thanks to the use of a multiturn potentiometer. The energy of a single discharge can be ranged from 18 J to 270 J depending on the magnitude of the electric field intensity and the duration of the discharge.
The stand includes a capacitor with a capacity equal 0.25 mF, and the frequency of the generated discharges depends on the interaction electric field intensity and up to 10 kV·cm−1, the frequency of discharges may be at least 1 Hz, while in the case of electric field intensity exceeding 10 kV·cm−1, the minimum frequency of discharges is 0.33 Hz. The station is equipped with proprietary software based on the LabVIEW platform, which allows you to program the sequences of activities and output parameters during the impact of the pulsed electric field on the material collected in the cell and then archives the data.
The material subjected to the pulsed electric field is inserted into an element called a stationary sterilization cell (Figure 3), made of Teflon, in the form of two interconnected cylinders, with the bases of these cylinders made of a material with good electrically conductive properties (stainless steel). The cell has a capacity of 20 mL. After filling it with the test substance, the cell is closed thanks to the applied threaded connection. Then it is placed on the electrode, and the second electrode is lowered onto its opposite base after the discharge chamber is closed.
In the device used, there is the possibility of generating pulses of exponential shape. Figure 4 demonstrates the electrical diagram of the device, and Figure 5 shows the shape of the generated pulses.
The electrical properties of the station in question were tested with the use of the polish Twelve Electric company AS3-mini-network parameter analyzer, equipped with a RIGOL Technologies DS1204B three-phase digital oscilloscope for recording voltage and current waveforms. On the basis of the collected results, it was determined that the average energy consumption for generating a single impulse is 65.6 mJ. During the tests, values ranging from 56.5 mJ to 71.3 mJ were measured, and the determined value of the coefficient of variation was 6.9%. During the measurements of the parameters of the generated high voltage pulse, the value of the initial electric field intensity was changed in the range from 4 to 30 kV·cm−1. The recorded waveforms are summarized in Figure 6. The recorded waveforms present the oscillating course of changes in the voltage value of the generated pulse. Its initial amplitude depends on the adopted voltage that triggers the pulse. The time during which the oscillations of the generated impulse were suppressed for all tested impulses amounted to approx. 150–160 µs.
Figure 7 presents the visualization made in ANSYS [33], and in particular: distribution of the electric potential in the range from 0 kV to 30 kV (a,b) and the gradients of electric field intensity (c,d) in the vicinity of electrodes (1) for the break time value of 0.5 s (a,c) and 1 s (b,d) from previous discharge. It also demonstrates the figure geometry of the previous discharge channel (2).
Before the samples were placed in the chamber of the Ertec Su-1 stand, the standardized material was stabilized in accordance with the EN 14780:2011 standard (tested material was unified and brought to the air-dry state). Then, within each species of wood, two groups were distinguished, one of which was the so-called control test, where the pulsed electric fuel was not applied, while the other was subjected to the pulsed electric field. In both cases, the moisture content in the analytical state was determined in accordance with EN ISO 18134-3:2015 standard [34]. The test portion of the material (minimum 1 g weighing to the nearest 0.1 mg.) is dried at a temperature of (105 ± 2) °C in the air atmosphere until the constant mass is achieved. Constant mass was defined as a change not exceeding 1 mg in mass during a heating period of 60 min. The percentage of moisture was calculated from the loss in mass of the test portion. In addition, for the sample that was subjected to the pulsed electric field interaction, the moisture content of the wood was determined again before the combustion heat test was conducted. Such a procedure made it possible to exclude the influence of the differentiation of the controlled and processed material moisture content on the basis of the obtained results of the combustion heat. The value of 0.1% was adopted as the limit of repeatability. The combustion heat of the tested biological material was determined with the use of a calorimetric bomb combustion method, based on the EN ISO 18125:2017 standard [18]. A weighed portion of the analysis sample (1 ± 0.1) g was burned in high-pressure oxygen (the bomb filled to 3 MPa by pure oxygen with an assay of at least a volume fraction of 99.5%, and free from the combustible matter) in a bomb calorimeter. The effective heat capacity of the calorimeter was determined in calibration experiments by combustion of certified benzoic acid under similar conditions, accounted for in the certificate (ambient temperature equal to 25 °C). The corrected temperature rise was established from observations of temperature before, during and after the combustion reaction took place. Water (distilled, 1.0 ± 0.1 mL) was added to the bomb initially to give a saturated vapor phase prior to combustion, thereby allowing all the water formed, from the hydrogen and moisture in the sample, to be regarded as liquid water. For this purpose, the polish Precyzja-Bit company calorimeter (model Kl 12Mn) was used (Figure 8a), which allowed the determination of changes in the temperature of the liquid in the calorimetric vessel with an accuracy of 0.001 °C. The capacity of the calorimetric vessel in the device equal to 2.7 L. Due to the methodology used and the low-density of sawdust, the material had to be compressed with a manual press (Figure 8b) before taking measurements. Only such a prepared portion could be used to make measurements.
The calorimeter measured and then automatically records three characteristic temperature points and three basic periods in the time–temperature course of the combustion process, as shown in Figure 9.
The exact value of the heat of combustion was determined using the Formula (1) [18], where is the gross calorific value at constant volume of the fuel as analyzed, in J·g−1; —is the mean value of the effective heat capacity of the calorimeter as determined in the calibrations, in J·K; —is the corrected temperature rise, in K; —is the contribution from the combustion of the fuse, in J; —is the contribution from the oxidation of the ignition wire, in J; —is the contribution from the formation of nitric acid (from liquid water and gaseous nitrogen and oxygen, in J; —is the correction for taking the sulfur from the aqueous sulfury acid to gaseous sulfur dioxide, in J; —is the mass of the sample of the fuel, in g; —is the mass of the combustion aid, in g; —is the gross calorific value at constant volume of the combustion aid, in J·g.
In order to confirm or reject the hypothesis about the normal distribution of the examined parameter, the results of the research were subjected to the Kolmogorov–Smirnov test. Afterward, selected basic descriptive statistics were calculated in accordance with [35], significant due to the described phenomena. The statistical package Statistica 9.0 and MS Office Excel (Analysis ToolPak-VBA) were used for the calculations.
3. Results
Each of the tested materials (spruce, fir and larch sawdust) was subjected to a separate analysis.
3.1. Spruce Sawdust
Samples of spruce sawdust constituting a control sample (without PEF influence) and after PEF treatment had a moisture value in the analytical state at the level of 9.9 ± 0.1%. Analyzing the temperature characteristics during the combustion of biological material, which was a spruce tree previously subjected to stimulation with a pulsed electric field (Figure 10), it was found that the highest temperature was obtained in the case of PEF with an electric field intensity of 30 kV·cm−1, where the number of pulses amounted to 300. The lowest temperature during combustion was recorded for the test, in which the parameters of the pulsed electric field were as follows: electric field intensity 25 kV·cm−1 and the number of pulses 150. In the case of other combinations of PEF, the values of the temperatures obtained were in the range from 22.17 °C to 22.27 °C. Taking into account only the values of the measured temperatures, disregarding their characteristics, it was stated that for all combinations of the experiment, the differences that arose were statistically significant and of great importance for the entire analyzed process.
The key stimulation parameters from the point of view of temperature increase were the discharge electric field intensity and the time of exposure. It should be noted that in the case of the blank test (not subjected to stimulation with a pulsed electric field), the lowest temperatures were recorded. Even though the analyzed temperature differences in terms of absolute values constitute a small value within the range of interest for the setting phenomenon, it represents a significant proportion of the value.
Another analyzed element was the time from the moment of ignition to the moment of obtaining the maximum temperature, the differentiation of which may indicate the measurable effect of the pulsed electric field on biological material, extending or shortening this time. Figure 11 presents the time characteristics of the individual stages of calorimetric research on a spruce tree previously subjected to pulsed electric field stimulation.
3.2. Fir Sawdust
For fir sawdust in both analyzed groups (before and after the exposure to PEF) had a constant value of moisture in the analytical state equal to 8.6%. Analyzing the temperature characteristics during the combustion of biological material, which was fir sawdust previously subjected to the pulsed electric field (Figure 12), it was found, as in the case of sawdust of spruce wood, that the highest temperature was obtained in the case of PEF with an electric field intensity of 30 kV·cm−1, where the number of pulses amounted to 300. The lowest temperature during combustion was recorded for the test in which the parameters of the pulsed electric field were as follows: discharge electric field intensity 25 kV·cm−1, number of pulses 150. It must be emphasized that in the case of the blank (unstimulated) test, the lowest temperatures were recorded. Despite the fact that the analyzed temperature differences in terms of absolute values constitute a small value, within the variability of temperatures of the phenomenon in question, they accounted for a significant value.
In the case of the time from the moment of ignition to reaching the maximum temperature, significant differentiation was recorded, which proves the measurable effect of the pulsed electric field on the biological material. Figure 13 presents the time characteristics of the individual stages of calorimetric research on fir sawdust that were previously subjected to the pulsed electric field. It was found that the longest duration of the interval in question was obtained in the case of the impact of PEF with the parameters of the 3rd combination (electric field intensity 30 kV·cm−1 and number of pulses 150), while the shortest time was obtained in the case of the 2nd combination of the experiment.
When analyzing the time of individual combustion phases, it was noted that in the case of the duration of the second phase (the difference between the values of the time recorded for the third and the second temperature), the difference in absolute value in the time sections between the material stimulated with the electric field intensity of 25 kV·cm−1 and 30 kV·cm−1 and the same number pulses was over 30%. In the case of the third combustion phase, much greater relative differences were recorded in their duration, even though in absolute values, this differentiation is much smaller. It should be emphasized that there was an almost two-fold difference in the duration of the phase between the combinations of experiments I and II, and experiments III and IV, where the differentiation in the stimulation resulted mainly from the applied discharge electric field intensity, i.e., in the first two cases it was 25 kV·cm−1, while in the other two it was 30 kV·cm−1. On the other hand, the differences within the combination, where the stimulation electric field intensity was the same, the time of the analyzed phase differed only slightly despite the different number of PEF pulses. In the fourth analyzed combustion phase, its duration did not differ within the analyzed combinations of the experiment and did not exceed 10 s, which constituted less than 10% of the measured values.
3.3. Larch Sawdust
Larch sawdust that was not subjected to conditioning had a moisture content of 8.3%, while after the PEF interaction process, the moisture decreased by 0.1%, which was within the assumed error limit. The characteristics of the temperature course during combustion in the case of sawdust from the larch tree were characterized by a very low variability within the tested combinations of pulsed electric field stimulation. Contrary to the other analyzed biological materials, no clear influence on the nature of the temperature curve and its nodal values was observed. Figure 14 shows the characteristics for each experiment combination, which are almost identical, although it should be noted that it is worth noting that slightly higher temperatures were recorded in the fourth experiment combination (electric field intensity 30 kV·cm−1 and number of pulses 300).
A similar statement applies to the time of combustion, where the influence of pulsed electric field stimulation on the analyzed volume was not observed. In the analyzed case, there were no significant differences, from the point of view of the process, in time and temperature values between the biological material subjected to stimulation and the material constituting the blank sample, which was not subjected to stimulation. In the case of the time of the individual combustion phases of the material, no significant differences were also noted as a consequence, and they were not visualized.
4. Discussions and Conclusions
The interaction of a material with a pulsed electric field is the subject of many research interests. There are known results of studies in which this stimulation was applied to such biological materials as milk [36], egg mass [37,38], fruit and vegetable juices [39,40,41], cider [42,43], olive oil [44], raspberries [45], apples [46], potatoes [47], wheat [48], and even yeast [49]. There have also been many attempts to use PEF as an alternative to high-temperature extraction [50] or to improve LCB porosity in biorefineries [51].
The influence of the pulsed electric field on wood material was described in the work of Kumar et al. [52], who observed an increase in tissue porosity in the obtained results of the interaction on wood chips with an electric field of 1–10 kV·cm−1. According to the authors, the obtained results indicate an increased efficiency of the cellulose hydrolysis process, and the consequences that PEF causes in organic matter, especially in wood biomass, constitute disturbances and structural changes in the cell membrane, causing the loss of its semipermeability, thus facilitating the entry of enzymes hydrolyzing polysaccharides and lignin [30,31]. Nevertheless, the mechanism that unambiguously determines these phenomena has not been described in detail [53].
There are no studies in the literature that would prove even an attempt to determine the influence of PEF on the characteristics of the heat of combustion. Moreover, the mentioned characteristic always appears as a necessary element of calorific value measurements. However, its role is reduced to only one of the stages of the methodology used to determine the value of the heat of combustion of the tested fuel. On the other hand, from the physical and energetic point of view, both the amount of energy produced and the time in which this energy was released seems to be important. As a rule, each of these factors is considered separately, and different methodologies are used to determine them.
As noted by Rhen et al. [54], knowledge of the combustion time enables the improvement of the process control possibilities, constituting at the same time crucial information for the design of devices intended for fuel combustion. In the research on the combustion time of coal obtained in the pyrolysis process of pellets made of spruce wood sawdust, the abovementioned author noticed that the time depended on the used material and ranged from 4.5 to 6.5 min. In the case of combustion temperature analyses, the authors [55,56,57] emphasize the role played by two characteristic points, which are the ignition temperature and the peak temperature. However, they note that the first of the abovementioned temperatures, in the case of biomass combustion, varies within a narrow range, while the second depends primarily on the content of volatile substances in the fuel. The analysis of the heat of combustion characteristics enables both the duration of the combustion process to be determined and the characteristic points of this process to be designated. Thus, it is a link connecting precise measurements of time and temperature separately with measurements based on the determination of these values in order to designate the heat of combustion.
It seems that the increase in tissue porosity described by the authors [30,31,52] may be the cause of changes in the combustion process of wood material, which results in differences in temperature and duration of individual periods of characteristics. It is also not without significance that sawdust treated as a residue of forest production was used in the research and thus characterized by a greater variability of wood components, i.e., cellulose, hemicellulose, lignin and extractive substances [58,59], compared to the uniform wood material, which can be, e.g., tree trunks cleared of bark.
At present, it is impossible to precisely parameterize the process of PEF influence on the characteristics of the combustion heat of the tested fuel. Therefore, there is a need to conduct further experiments and extend the scope of research not only to other parameters of the electric field but also to various types of wood.
This research has demonstrated the influence of organic matter conditioning on the temperature characteristics, as well as time characteristics of individual combustion stages. It was also found that the decisive factor in changing the properties of sawdust is the discharge electric field intensity and, secondly, the number of discharge pulses.
Author Contributions
Conceptualization, P.K. and E.P.; methodology, P.K. and T.D.; software, T.D.; validation, P.K., T.D. and E.P.; formal analysis, E.P.; investigation, T.D.; resources, P.K.; data curation, T.D.; writing—original draft preparation, E.P.; writing—review and editing, P.K.; visualization, E.P.; supervision, P.K. All authors have read and agreed to the published version of the manuscript.
Funding
This research received no external funding.
Institutional Review Board Statement
Not applicable.
Informed Consent Statement
Not applicable.
Data Availability Statement
The data presented in this study is available upon request of the respective author. The data is not publicly available due to the possibility of their commercial use by the unit in which the authors are employed and the use of source data for further research and development works of an accredited laboratory (Polish accreditation number AB 1698), whose staff are the authors of this publication.
Conflicts of Interest
The authors declare no conflict of interest.
References
- Balat, M.; Acici, N.; Ersoy, G. Trends in the Use of Biomass as an Energy Source. Energy Sources Part B Econ. Plan. Policy 2006, 1, 367–378. [Google Scholar] [CrossRef]
- Uddin, M.; Techato, K.; Taweekun, J.; Rahman, M.M.; Rasul, M.; Mahlia, T.M.I.; Rahman, S.M.A. An Overview of Recent Developments in Biomass Pyrolysis Technologies. Energies 2018, 11, 3115. [Google Scholar] [CrossRef] [Green Version]
- Papoutsidakis, M.; Symeonaki, E.; Tseles, D.; Drosos, C. The biomass as an energy source and its application benefits. Int. J. Eng. Appl. Sci. Technol. 2018, 2, 1–5. [Google Scholar]
- Spîrchez, C.; Lunguleasa, A.; Croitoru, C. The importance of the wood biomass in environment protection. AIP Conf. Proc. 2017, 1918, 1–10. [Google Scholar]
- Karlsson, O.; Sidorova, E.; Moren, T. Influence of Heat Transferring Media on Durability of Thermally Modified Wood. Bioresources 2011, 6, 356–372. [Google Scholar]
- Nanda, S.; Reddy, S.N.; Vo, D.V.N.; Sahoo, B.N.; Kozinski, J.A. Catalytic gasification of wheat straw in hot compressed (subcritical and supercritical) water for hydrogen production. Energy Sci. Eng. 2018, 6, 448–459. [Google Scholar] [CrossRef] [Green Version]
- Norouzi, O.; Safari, F.; Jafarian, S.; Tavasoli, A.; Karimi, A. Hydrothermal gasification performance of Enteromorpha intestinalis as an algal biomass for hydrogen-rich gas production using Ru promoted Fe–Ni/γ-Al2O3 nanocatalysts. Energy Convers. Manag. 2017, 141, 63–71. [Google Scholar] [CrossRef]
- de Araujo Guilherme, A.; Dantas, P.V.F.; Padilha, C.E.D.A.; dos Santos, E.S.; de Macedo, G.R. Ethanol production from sugarcane bagasse: Use of different fermentation strategies to enhance an environmental-friendly process. J. Environ. Manag. 2019, 234, 44–51. [Google Scholar] [CrossRef]
- Ko, J.H.; Kim, W.C.; Cho, J.S.; Choi, Y.I.; Park, E.J.; Im, J.H.; Han, O.; Keathley, D.; Han, K.H. EliteTreeTM: An advanced biomass tree crop technology that features greater wood density and accelerated stem growth. Biofuels Bioprod. Biorefining 2017, 11, 521–533. [Google Scholar] [CrossRef]
- Mitani, A.; Barboutis, I. Changes by heat treatment in color and dimensional stability of beech (Fagus sylvatica L.) wood. Drevna Industrija 2014, 65, 225–232. [Google Scholar] [CrossRef]
- Toscano, G.; Foppa, P.E. Calorific value determination of solid biomass fuel by simplified method. J. Agric. Eng. 2009, 3, 1–6. [Google Scholar] [CrossRef]
- Bell, D.A.; Towler, B.F.; Fan, M. The Nature of Coal. In Coal Gasification and Its Applications, 1st ed.; Bell, D.A., Towler, B.F., Fan, M., Eds.; William Andrew Publishing: Norwich, NY, USA, 2011; Volume 1, pp. 1–15. [Google Scholar]
- Günther, B.; Gebauer, K.; Barkowski, R.; Rosenthal, M.; Bues, C.T. Calorific value of selected wood species and wood products. Eur. J. Wood Wood Prod. 2012, 70, 755–757. [Google Scholar] [CrossRef]
- Orémusová, E.; Tereňová, L.; Réh, R. Evaluation of the gross and net calorific value of the selected wood species. Adv. Mater. Res. 2014, 1001, 292–299. [Google Scholar] [CrossRef]
- Demirbaş, A. Effects of moisture and hydrogen content on the heating value of fuels. Energy Sources Part A Recovery Util. Environ. Eff. 2007, 29, 649–655. [Google Scholar] [CrossRef]
- Charbel, A.T.; Trinchero, B.D.; Morais, D.D.; Mesquita, H.; Birchal, V.S. Evaluation of the Potential of Fruit Peel Biomass after Conventional and Microwave Drying for Use as Solid Fuel. Appl. Mech. Mater. 2015, 798, 480–485. [Google Scholar] [CrossRef]
- Aniszewska, M.; Gendek, A. Comparison of heat of combustion and calorific value of the cones and wood of selected forest trees species. For. Res. Pap. 2014, 75, 231–236. [Google Scholar] [CrossRef] [Green Version]
- European Standard EN ISO 18125:2017 Solid Biofuels—Determination of Calorific Value; European Committee for Standardization: Brussels, Belgium, 2017.
- Jayakumar, E.; Chittibabu, S.; Shanmugasundaram, S.; Lope, G.T. Synergetic effect of microwave heated alkali pre-treatment on densification of rice (Oryza sativa) husk biomass grinds. Energy Sources Part A Recovery Util. Environ. Eff. 2019, in press. [Google Scholar]
- Phanphanich, M.; Mani, S. Impact of torrefaction on the grindability and fuel characteristics of forest biomass. Bioresour. Technol. 2011, 102, 1246–1253. [Google Scholar] [CrossRef]
- Yu, N.; Cai, Y.; Li, X.; Fan, Y.; Yin, H.; Zhang, R. Catalytic pyrolysis of rape straw for upgraded bio-oil production using HZSM-5 zeolite. Nongye Gongcheng Xuebao/Trans. Chin. Soc. Agric. Eng. 2014, 30, 264–271. [Google Scholar]
- Hassan, S.S.; Williams, G.A.; Jaiswal, A.K. Emerging technologies for the pretreatment of lignocellulosic biomass. Bioresour. Technol. 2018, 262, 310–318. [Google Scholar] [CrossRef] [Green Version]
- Zhao, X.; Zhang, L.; Liu, D. Pretreatment of Siam weed stem by several chemical methods for increasing the enzymatic digestibility. Biotechnol. J. 2010, 5, 493–504. [Google Scholar] [CrossRef] [PubMed]
- Aguilera, J.M.; Chiralt, A.; Fito, P. Food dehydration and product structure. Trends Food Sci. Technol. 2003, 14, 432–437. [Google Scholar] [CrossRef]
- Welti-Chanes, J.; Guerrero, J.; Bárcenas, M.E.; Aguilera, J.; Vergara, F.; Barbosa-Cánovas, G. Glass transition temperature (Tg) and water activity (aw) of dehydrated apple products. J. Food Process Eng. 2007, 22, 91–101. [Google Scholar] [CrossRef]
- Donsì, F.; Ferrari, G.; Pataro, G. Applications of Pulsed Electric Field Treatments for the Enhancement of Mass Transfer from Vegetable Tissue. Food Eng. Rev. 2010, 2, 109–130. [Google Scholar] [CrossRef]
- Toepfl, S. Pulsed Electric Fields (PEF) for Permeabilization of Cell Membranes in Food- and Bioprocessing-Applications, Process and Equipment Design and Cost Analysis. Ph.D. Thesis, Technischen Universität, Berlin, Germany, 2006. [Google Scholar]
- Tylewicz, U.; Tappi, S.; Mannozzi, C.; Romani, S.; Dellarosa, N.; Laghi, L.; Ragni, L.; Rocculi, P.; Dalla Rosa, M. Effect of pulsed electric field (PEF) pre-treatment coupled with osmotic dehydration on physico-chemical characteristics of organic strawberries. J. Food Eng. 2017, 4, 66–78. [Google Scholar] [CrossRef]
- Wiktor, A.; Witrowa-Rajchert, D. Applying Pulsed Electric Field to enhance plant tissue dehydration process. Żywn. Nauka Technol. Jakość 2012, 2, 22–32. [Google Scholar] [CrossRef]
- Kumar, A.K.; Sharma, S. Recent updates on different methods of pretreatment of lignocellulosic feedstocks: A review. Bioresour. Bioprocess 2017, 4, 1–19. [Google Scholar] [CrossRef] [Green Version]
- Barba, F.J.; Parniakov, O.; Pereira, S.A.; Wiktor, A.; Grimi, N.; Boussetta, N.; Saraiva, J.A.; Raso, J.; Martin-Belloso, O.; Witrowa-Rajchert, D.; et al. Current applications and new opportunities for the use of pulsed electric fields in food science and industry. Food Res. Int. 2015, 77, 773–798. [Google Scholar] [CrossRef]
- Wesołowski, M.; Nęcka, K.; Dróżdż, T.; Kiełbasa, P. The concept of modeling a pulsed electric field discharge (PEF) in agricultural and food industry products. In polish. Prz. Elektrotech. 2018, 94, 119–123. [Google Scholar]
- Wesołowski, M.; Tabor, S.; Kiełbasa, P.; Kurpaska, S. Electromagnetic and thermal phenomena modeling of electrical discharges in liquids. Appl. Sci. 2020, 10, 3900. [Google Scholar] [CrossRef]
- European Standard EN ISO 18134-3:2015 Solid Biofuels—Determination of Moisture Content—Oven Dry Method—Part: Moisture in General Analysis Sample; European Committee for Standardization: Brussels, Belgium, 2015.
- Standard ISO 3534-1:2006 Statistics—Vocabulary and Symbols—Part: General Statistical Terms and Terms Used in Porbability; European Committee for Standardization: Brussels, Belgium, 2006.
- Sepulveda, D.R.; Gongora-Nieto, M.M.; Guerrero, J.A.; Barbosa Canovas, G.V. Shelf life of whole milk processed by pulsed electric fields in combination with PEF-generated heat. Food Sci. Technol. 2009, 42, 735–739. [Google Scholar] [CrossRef]
- Monfort, S.; Gayán, E.; Condón, S.; Raso, J.; Álvarez, I. Design of a combined process for the inactivation of Salmonella Enteritidis in liquid whole egg at 55 °C. Int. J. Food Microbiol. 2011, 145, 476–482. [Google Scholar] [CrossRef] [PubMed]
- Monfort, S.; Saldaña, G.; Condón, S.; Raso, J.; Álvarez, I. Inactivation of Salmonella spp. in liquid whole egg using pulsed electric fields, heat, and additives. Food Microbiol. 2012, 30, 393–399. [Google Scholar] [CrossRef] [PubMed]
- Nguyen, P.; Mittal, G.S. Inactivation of natturally occuring microorganisms in tomato juice using pulsed electric field (PEF) with and without antimicrobials. Chem. Eng. Process. 2007, 46, 360–365. [Google Scholar] [CrossRef]
- Mosqueda-Melgar, J.; Raybaudi-Massilia, R.M.; Martin-Belloso, O. Non-thermal pasteurization of fruit juices by combining high-intensity pulsed electric fields with natural antimicrobials. Innov. Food Sci. Emerg. Technol. 2008, 9, 328–340. [Google Scholar] [CrossRef]
- Grimi, N.; Mamouni, F.; Lebovka, N.; Vorobiev, E.; Vaxelaire, J. Impact of apple processing modes on extracted juice quality: Pressing assisted by pulsed electric fields. J. Food Eng. 2011, 103, 52–61. [Google Scholar] [CrossRef]
- Liang, Z.; Cheng, Z.; Mittal, G.S. Inactivation of spoilage microorganisms in apple cider using a continuous flow pulsed electric field system. Food Sci. Technol. 2006, 39, 351–357. [Google Scholar] [CrossRef]
- Iu, J.; Mittal, G.S.; Griffiths, M.W. Reduction in levels of Escherichia coli O157:H7 in apple cider by pulsed electric fields. J. Food Prot. 2001, 64, 964–969. [Google Scholar] [CrossRef]
- Abenoza, M.; Benito, M.; Saldaña, G.; Álvarez, I.; Raso, J.; Sánchez-Gimeno, A.C. Effects of pulsed electric field on yield extraction and quality of olive oil. Food Bioprocess Technol. 2013, 6, 1367–1373. [Google Scholar] [CrossRef]
- Lamaunauskas, N.; Pataro, G.; Bobinas, C.; Satkauskas, S.; Viskelis, P.; Bobonaite, R.; Ferarri, G. Impact of pulsed electric field treatment on juice yield and recovery of bioactive compounds from raspberries and their by-products. Zemdirb. Agric. 2016, 103, 83–90. [Google Scholar] [CrossRef] [Green Version]
- Wu, Y.; Guo, Y.; Zhang, D. Study of the Effect of High-Pulsed Electric Field treatment on Vacuum Freeze-Drying of Apples. Dry. Technol. 2011, 29, 1714–1720. [Google Scholar] [CrossRef]
- Wu, Y.; Zhang, D. Effect of Pulsed Electric Field on Freeze-Drying of Potato Tissue. IJFE 2014, 10, 857–862. [Google Scholar] [CrossRef]
- Dalvi-Isfahan, M.; Hamdami, N.; Le-Bail, A.; Xanthakis, E. The principles of high voltage electric field and its application in food processing: A review. Food Res. Int. 2016, 89, 48–62. [Google Scholar] [CrossRef]
- Raschke, D. Pulsed electric fields—Influence on Physiology, Structure and Extraction Processes of the Oleaginous Yeast Waltomyces lipofer. Ph.D. Thesis, Technischen Universität, Berlin, Germany, 2010. [Google Scholar]
- Bouras, M.; Grimi, N.; Bals, O.; Vorobiev, E. Effect of PEF and HVED on the polyphenols extraction from Quercus robur bark. In Proceedings of the 1st World Congress on Electroporation and Pulsed Electric Fields in Biology, Medicine and Food & Environment Technologies, Portorož, Slovenia, 6–10 September 2015; Jarm, T., Kramar, P., Eds.; Springer: Berlin/Heidelberg, Germany, 2015. [Google Scholar]
- Mahnič-Kalamiza, S.; Vorobiev, E.; Miklavčič, D. Electroporation in food processing and biorefinery. J. Membr. Biol. 2014, 247, 1279–1304. [Google Scholar] [CrossRef] [PubMed]
- Kumar, P.; Barrett, D.M.; Delwiche, M.J.; Stroeve, P. Pulsed electric field pretreatment of switchgrass and wood chip species for biofuel production. Ind. Eng. Chem. Res. 2011, 50, 10996–11001. [Google Scholar] [CrossRef]
- Qin, J.; Pasko, V.P. On the propagation of streamers in electrical discharges. J. Phys. Part D Appl. Phys. 2014, 47, 435202. [Google Scholar] [CrossRef]
- Rhen, C.; Ohman, M.; Gref, R.; Wasterlund, I. Effect of raw material composition in woody biomass pellets on combustion characteristics. Biomass Bioenergy 2007, 31, 66–72. [Google Scholar] [CrossRef]
- Haykırı-Acma, H. Combustion characteristics of different biomass materials. Energy Convers. Manag. 2003, 44, 155–162. [Google Scholar] [CrossRef]
- Kucukbayrak, S.; Haykırı-Acma, H.; Ersoy-Mericboyu, A.; Yaman, S. Effect of lignite properties on reactivity of lignite. Energy Convers. Manag. 2001, 42, 613–626. [Google Scholar] [CrossRef]
- Haykırı-Acma, H.; Ersoy-Mericboyu, A.; Kucukbayrak, S. Effect of mineral matter on the reactivity of lignite chars Energy Convers. Manag. 2001, 42, 11–20. [Google Scholar]
- Rhen, C. Chemical composition and gross calorific value of the aboveground biomass components of young Picea abies. Scand. J. For. Res. 2004, 19, 72–81. [Google Scholar] [CrossRef]
- Nurmi, J. Heating values of mature trees. Acta For. Fenn. 1997, 256, 1–28. [Google Scholar] [CrossRef] [Green Version]
Figure 1.
Schematic diagram of the experimental procedure.

Figure 2.
Ertec Su-1 test stand.

Figure 3.
Stationary cell located inside the pulsed electric field (PEF) conditioning chamber.

Figure 4.
Schematic diagram of an electrical system for generating PEF pulses with an “exponential” shape [32].
Figure 4.
Schematic diagram of an electrical system for generating PEF pulses with an “exponential” shape [32].

Figure 5.
The assumed shape of a bipolar “exponential” pulse [32].
Figure 5.
The assumed shape of a bipolar “exponential” pulse [32].

Figure 6.
Voltage pulse as a function of time changes depending on the voltage [32].
Figure 6.
Voltage pulse as a function of time changes depending on the voltage [32].

Figure 7.
Electric potential distribution (a,b) and electric field gradients (c,d) distribution for nonlinear parameters (ε, ρ) after 0.5 s (a,c) and 1 s (b,d) from previous discharge. 1—electrode; 2—geometry of previous discharge channel [33].
Figure 7.
Electric potential distribution (a,b) and electric field gradients (c,d) distribution for nonlinear parameters (ε, ρ) after 0.5 s (a,c) and 1 s (b,d) from previous discharge. 1—electrode; 2—geometry of previous discharge channel [33].

Figure 8.
Elements of the stand for determining the heat of combustion: (a) calorimeter, (b) manual press.
Figure 8.
Elements of the stand for determining the heat of combustion: (a) calorimeter, (b) manual press.

Figure 9.
Example time–temperature curve from EN ISO 18125:2017-07 [18].
Figure 9.
Example time–temperature curve from EN ISO 18125:2017-07 [18].

Figure 10.
Characteristics of the combustion temperature of a sample of a spruce tree conditioned with a pulsed electric field: I (electric field intensity 25 kV·cm−1 and number of pulses 150); II (electric field intensity 25 kV·cm−1 and number of pulses 300); III (electric field intensity 30 kV·cm−1 and number of pulses 150); IV (electric field intensity 30 kV·cm−1 and number of pulses 300).

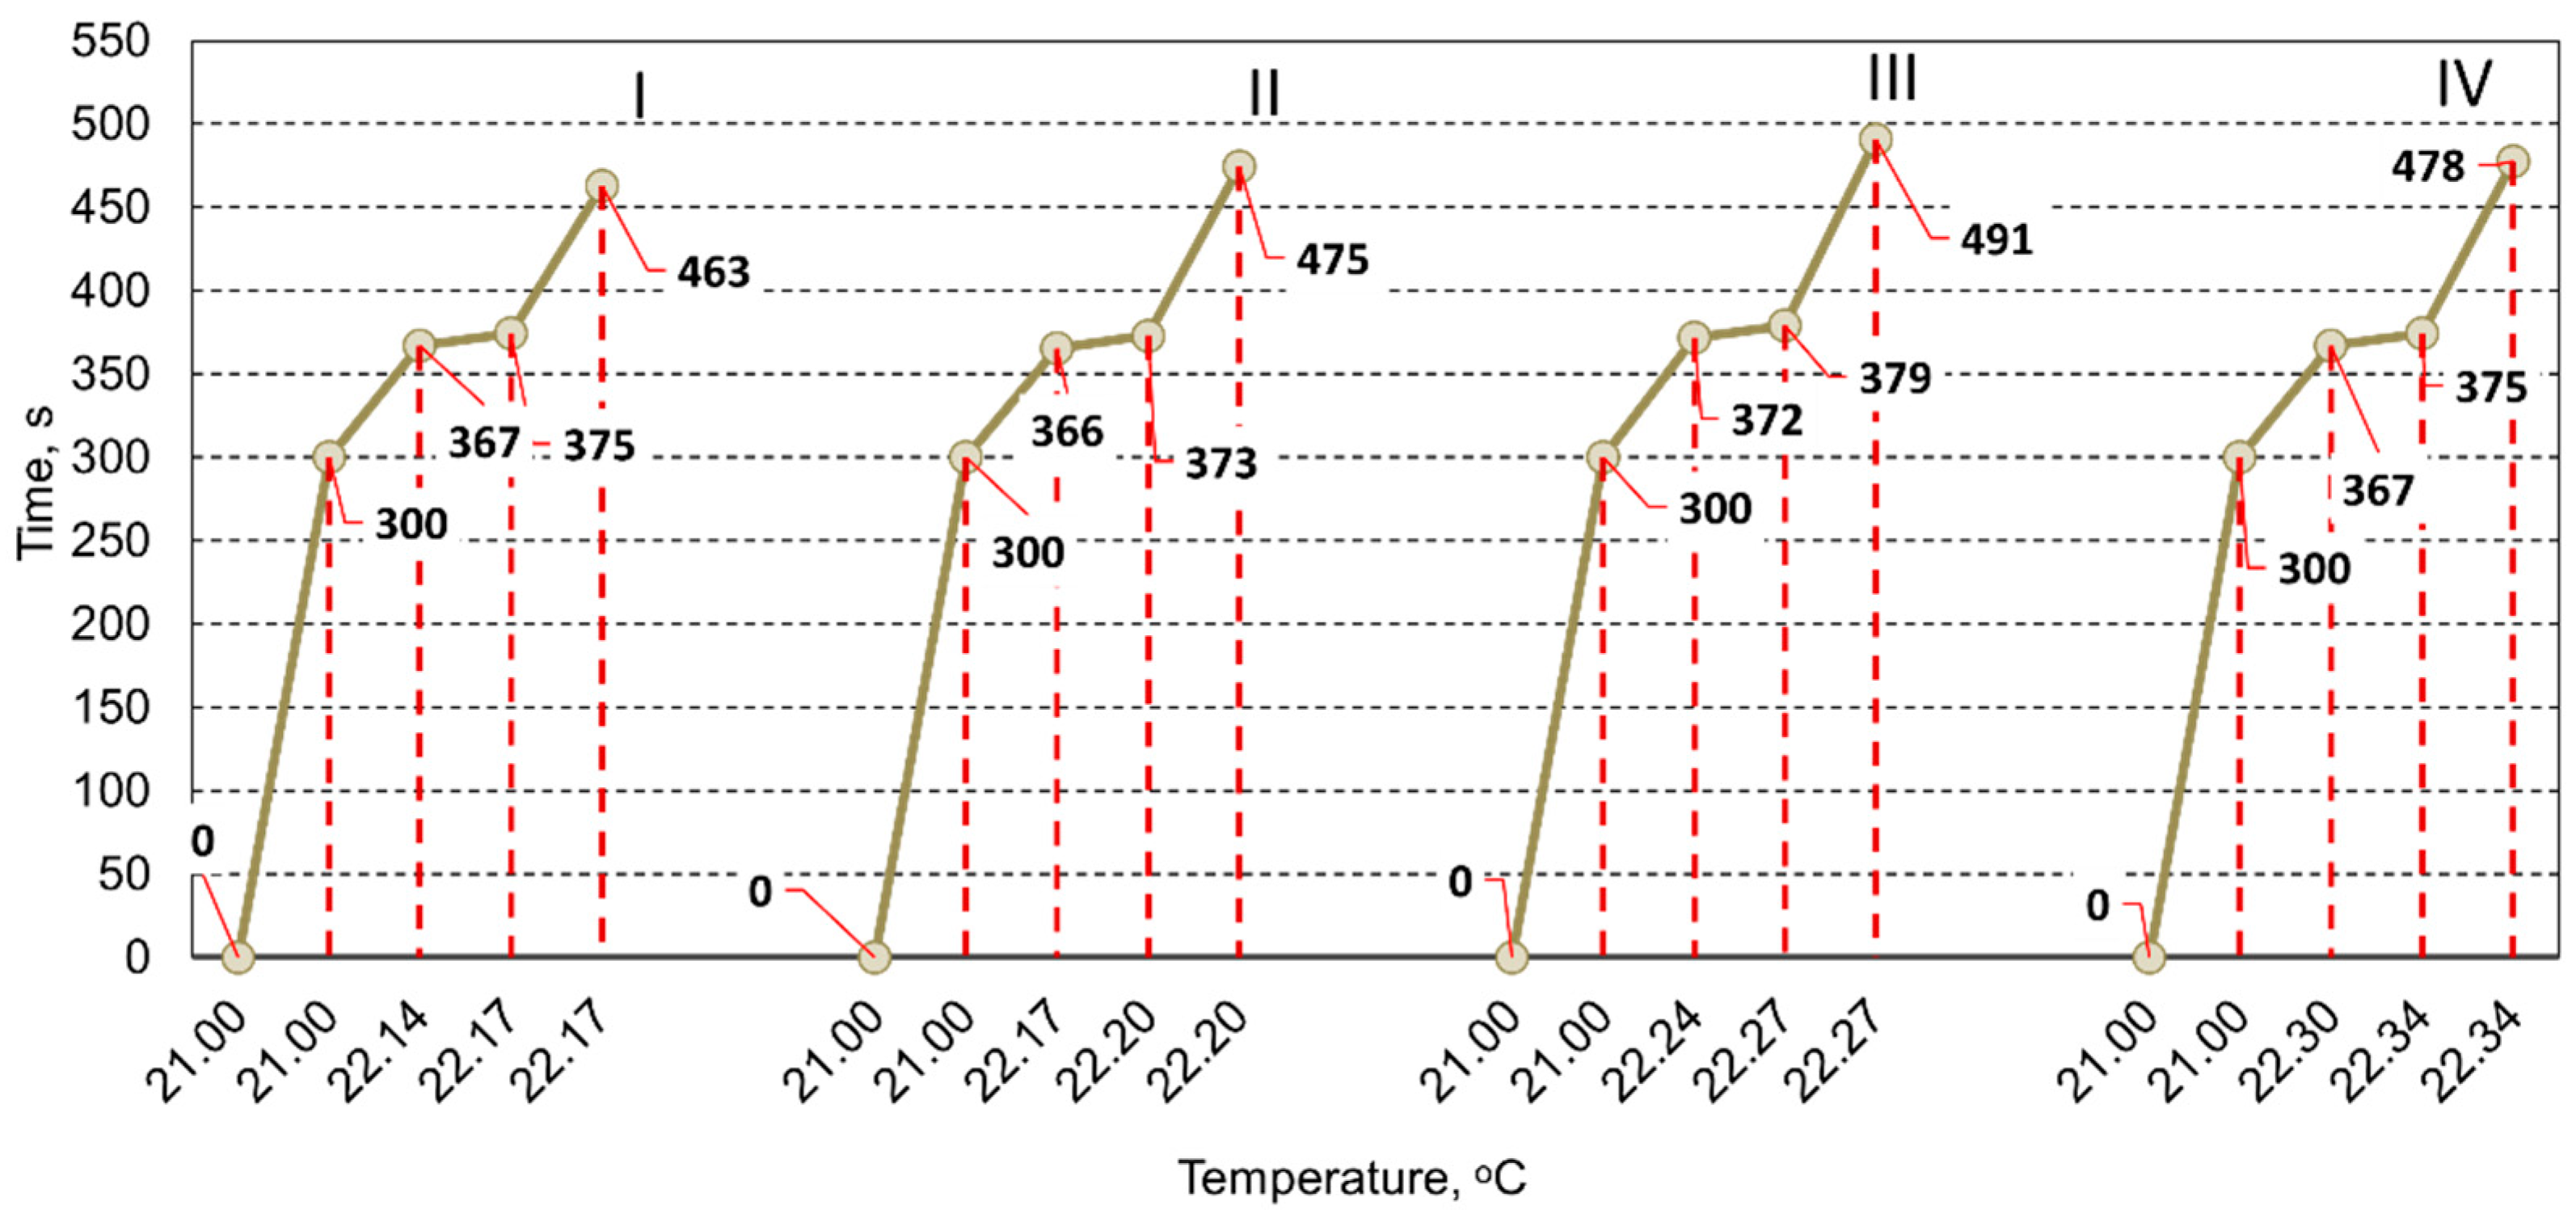
Figure 11.
Time characteristics of the individual combustion stages of a sample of spruce trees conditioned with a pulsed electric field: I (electric field intensity 25 kV·cm−1 and number of pulses 150); II (electric field intensity 25 kV·cm−1 and number of pulses 300); III (electric field intensity 30 kV·cm−1 and number of pulses 150); IV (electric field intensity 30 kV·cm−1 and number of pulses 300). It was found that the longest times from ignition to reaching the maximum temperature were obtained for the material under the influence of PEF with an electric field intensity of 30 kV·cm−1 and the number of pulses 150 (III combination), while the shortest time of the analyzed interval was stated for the second combination of the experiment (electric field intensity 25 kV·cm−1 and number pulses 300). Taking into consideration all the used combinations of experiments, from the point of view of the duration of individual combustion cycles, there were no statistically significant differences in the measured values. Only a slight increase in the value of time was found for the samples after the PEF exposure, where the discharge electric field intensity amounted to 30 kV·cm−1. It should be underlined that in the case of the first combination, the combustion time is the shortest in all measured sections.

Figure 12.
Characteristics of combustion temperature of a fir tree sample conditioned with a pulsed electric field: I (electric field intensity 25 kV·cm−1 and number of pulses 150); II (electric field intensity 25 kV·cm−1 and number of pulses 300); III (electric field intensity 30 kV·cm−1 and number of pulses 150); IV (electric field intensity 30 kV·cm−1 and number of pulses 300).

Figure 13.
Time characteristics of individual combustion stages of a fir tree sample conditioned by a pulsed electric field: I (electric field intensity 25 kV·cm−1 and number of pulses 150); II (electric field intensity 25 kV·cm−1 and number of pulses 300); III (electric field intensity 30 kV·cm−1 and number of pulses 150); IV (electric field intensity 30 kV·cm−1 and number of pulses 300).

Figure 14.
Characteristics of combustion temperature of a larch tree sample conditioned with a pulsed electric field: I (electric field intensity 25 kV·cm−1 and number of pulses 150); II (electric field intensity 25 kV·cm−1 and number of pulses 300); III (electric field intensity 30 kV·cm−1 and number of pulses 150); IV (electric field intensity 30 kV·cm−1 and number of pulses 300).


Table 1.
Characteristic temperature points of spruce sawdust combustion.
| Point | Parameters | Combination I | Combination II | Combination III | Combination IV |
|---|---|---|---|---|---|
| Start measuring | t [s] | 0 | 0 | 0 | 0 |
| T [°C] | 21.00 | 21.00 | 21.00 | 21.00 | |
| Sample ignition | t [s] | 300 | 300 | 300 | 300 |
| T [°C] | 21.00 | 21.00 | 21.00 | 21.00 | |
| End of combustion | t [s] | 367 | 366 | 372 | 367 |
| T [°C] | 22.14 | 22.17 | 22.24 | 22.30 | |
| Temperature stabilization | t [s] | 375 | 373 | 379 | 375 |
| T [°C] | 22.17 | 22.20 | 22.27 | 22.34 | |
| End of measurement | t [s] | 463 | 475 | 491 | 478 |
| T [°C] | 22.17 | 22.20 | 22.27 | 22.34 |
Table 2.
Characteristic temperature points of fir sawdust combustion.
| Point | Parameters | Combination I | Combination II | Combination III | Combination IV |
|---|---|---|---|---|---|
| Start measuring | t (s) | 0 | 0 | 0 | 0 |
| T (°C) | 21.00 | 21.00 | 22.00 | 22.00 | |
| Sample ignition | t (s) | 300 | 300 | 300 | 300 |
| T (°C) | 21.00 | 22.00 | 22.00 | 22.00 | |
| End of combustion | t (s) | 384 | 375 | 401 | 390 |
| T (°C) | 22.20 | 22.30 | 22.30 | 22.40 | |
| Temperature stabilization | t (s) | 394 | 384 | 422 | 406 |
| T (°C) | 22.20 | 22.30 | 22.40 | 22.40 | |
| End of measurement | t (s) | 506 | 491 | 536 | 506 |
| T (°C) | 22.20 | 22.30 | 22.40 | 22.40 |
Table 3.
Characteristic temperature points of larch sawdust combustion.
| Point | Parameters | Combination I | Combination II | Combination III | Combination IV |
|---|---|---|---|---|---|
| Start measuring | t (s) | 0 | 0 | 0 | 0 |
| T (°C) | 22.00 | 22.00 | 22.00 | 22.00 | |
| Sample ignition | t (s) | 300 | 300 | 300 | 300 |
| T (°C) | 22.00 | 22.00 | 22.00 | 22.00 | |
| End of combustion | t (s) | 361 | 378 | 359 | 381 |
| T (°C) | 22.40 | 22.40 | 22.40 | 22.43 | |
| Temperature stabilization | t (s) | 367 | 400 | 367 | 402 |
| T (°C) | 22.40 | 22.40 | 22.40 | 22.44 | |
| End of measurement | t (s) | 455 | 575 | 486 | 511 |
| T (°C) | 22.40 | 22.40 | 22.40 | 22.44 |
Publisher’s Note: MDPI stays neutral with regard to jurisdictional claims in published maps and institutional affiliations. |
© 2021 by the authors. Licensee MDPI, Basel, Switzerland. This article is an open access article distributed under the terms and conditions of the Creative Commons Attribution (CC BY) license (http://creativecommons.org/licenses/by/4.0/).
Share and Cite
MDPI and ACS Style
Kiełbasa, P.; Dróżdż, T.; Popardowski, E. Influence of Coniferous Wood Conditioning by Pulsed Electric Field on Its Combustion Heat Characteristics. Appl. Sci. 2021, 11, 983. https://0-doi-org.brum.beds.ac.uk/10.3390/app11030983
AMA Style
Kiełbasa P, Dróżdż T, Popardowski E. Influence of Coniferous Wood Conditioning by Pulsed Electric Field on Its Combustion Heat Characteristics. Applied Sciences. 2021; 11(3):983. https://0-doi-org.brum.beds.ac.uk/10.3390/app11030983
Chicago/Turabian StyleKiełbasa, Paweł, Tomasz Dróżdż, and Ernest Popardowski. 2021. "Influence of Coniferous Wood Conditioning by Pulsed Electric Field on Its Combustion Heat Characteristics" Applied Sciences 11, no. 3: 983. https://0-doi-org.brum.beds.ac.uk/10.3390/app11030983
Note that from the first issue of 2016, this journal uses article numbers instead of page numbers. See further details here.