
Assessing the Technical Specifications of Predictive Maintenance: A Case Study of Centrifugal Compressor


Department of Mechanical and Structural Engineering and Material Science, University of Stavanger, 4036 Stavanger, Norway
*
Author to whom correspondence should be addressed.
Appl. Sci. 2021, 11(4), 1527; https://0-doi-org.brum.beds.ac.uk/10.3390/app11041527
Submission received: 28 December 2020
/
Revised: 27 January 2021
/
Accepted: 28 January 2021
/
Published: 8 February 2021
(This article belongs to the Special Issue Reliability Techniques in Industrial Design)
Abstract
:Dependability analyses in the design phase are common in IEC 60300 standards to assess the reliability, risk, maintainability, and maintenance supportability of specific physical assets. Reliability and risk assessment uses well-known methods such as failure modes, effects, and criticality analysis (FMECA), fault tree analysis (FTA), and event tree analysis (ETA)to identify critical components and failure modes based on failure rate, severity, and detectability. Monitoring technology has evolved over time, and a new method of failure mode and symptom analysis (FMSA) was introduced in ISO 13379-1 to identify the critical symptoms and descriptors of failure mechanisms. FMSA is used to estimate monitoring priority, and this helps to determine the critical monitoring specifications. However, FMSA cannot determine the effectiveness of technical specifications that are essential for predictive maintenance, such as detection techniques (capability and coverage), diagnosis (fault type, location, and severity), or prognosis (precision and predictive horizon). The paper proposes a novel predictive maintenance (PdM) assessment matrix to overcome these problems, which is tested using a case study of a centrifugal compressor and validated using empirical data provided by the case study company. The paper also demonstrates the possible enhancements introduced by Industry 4.0 technologies.
1. Introduction
The centrifugal compressor is a highly complex system, given the nature of its components and transient operational behaviors. Despite its complexity, it is widely applied in the oil and gas (O&G) industry to transport natural gas through subsea pipelines. It plays a vital role in the operational availability and thereby the revenue of an O&G company, as it determines whether consumers receive natural gas. Most maintenance activities are based on recommendations provided by the equipment vendor, and this, in turn, is based on experience. Hence, the proposed maintenance schedule may be under- or over-predicted. If the maintenance activities recommended by the generic maintenance schedule do not fit the actual health of the equipment, the equipment will be maintained either more or less than necessary, preventing its full utilization and handicapping operations.
The technologies accompanying Industry 4.0 are expected to revolutionize maintenance management by introducing novel ways to analyze big data (characterized by the 5Vs: velocity, variability, veracity, volume, and value). The technologies of Industry 4.0 (cyber-physical systems (CPS), internet of things (IoT), cloud computing, big data, etc.) have been present in the Industry 3.0 environment for a long time, but their comprehensiveness and capabilities are greatly improved in the Industry 4.0 context. For example, in Industry 3.0, IoT was applied at the enterprise level, while in Industry 4.0, it is applied at the asset level and between asset and enterprise levels [1]. These improvements present new ways of analyzing big data: namely, the detection, diagnosis, and prognosis of failure. Such analyses were traditionally based on a single parameter, but an Industry 4.0 environment combines several different sensor signals and parameters (i.e., process, health and performance indicators) with enterprise-level data (e.g., production forecasts, spare part management, and equipment information), all the way down to the component level [2]. These novel techniques for data acquisition and analysis require new algorithms that manage the analysis of multivariate sensor signals (i.e., big data) to perform accurate and reliable detection, diagnosis, and prognosis of the equipment or component of interest [3]. The use of predictive maintenance (PdM) in Industry 4.0 is expected to yield many benefits [4], but the extent of the enhancements (i.e., levels of detection, diagnosis, and prognosis) is not yet known.
Designing for maintenance and maintenance support is already guided by IEC 60706-2 [5]. In addition, several existing standards provide supportive guidelines for the implementation of different maintenance strategies. For instance, the NORSOK Z-008 standard [6] has guidelines to implement preventive maintenance, while IEC 60812 [7] demonstrates the development process of failure mode, effect, and criticality analysis (FMECA) to support the assessment of component criticality and failures for equipment that is designed-out or frequently maintained. The ISO 13379-1 [8] and ISO 17359 [9] standards stipulate the implementation of condition-based maintenance (CBM), showing how to monitor failure propagation through failure mode and symptom analysis (FMSA). However, no standards are available to design PdM-ready equipment, despite the promise of PdM in an Industry 4.0 environment [4].
Certain technical requirements and specifications must be considered to standardize guidelines to design PdM-ready equipment [10]. First, designing for PdM-ready equipment does not solely consider the process of sensor implementation and data acquisition, as in traditional CBM. However, all the equipment in the physical space (hardware) must be aligned with the cyberspace equipment (software) to perform the required detection, diagnosis, and prognosis. Second, PdM in Industry 4.0 requires combining several different sensor parameters with enterprise-level data of varying quality (i.e., value, resolution, etc.). The technical requirements include determining the specific failure symptom (tracking indicator) of the failure mechanisms associated with the system under study [10]. Then, effective feature extraction procedures and data analysis techniques must be selected to track the symptom as early as possible over the entire fault evolution process to detect, diagnose, and predict under different scenarios (e.g., fluctuating operation, change of loading, multi-faults, and fault interactions).
Technical analyses play a decisive role in reaching a detailed understanding of system criticality and risk assessment. FMECA and FMSA are well-known systematic bottom-up approaches. Although they have the same objective of providing a holistic risk picture of a system, they differ to some extent. Briefly, FMECA facilitates examining the effects and consequences of the occurrence of specific failure modes associated with the specific system under study. Meanwhile, FMSA considers the detection of the failure modes associated with the system by connecting the occurrence of failure modes to specific monitorable symptoms using sensor technology.
The concept of FMSA was first standardized by ISO-13379-1 [8]. In addition, several big O&G companies developed their own FMSA procedures. The PdM analysis matrix [10] is the most recent update of FMSA, presented in ISO 13379-1 [8]. It adds prediction through prognosis to the traditional focus on detection and diagnosis.
Although the authors of this paper consider the PdM analysis matrix [10] to be the most state-of-the-art risk analysis, it lacks some requirements from an Industry 4.0 perspective. First, it does not address the basic logic connecting sensor technology with the levels of detection, diagnosis, and prediction of specific failure modes by connecting failure mechanisms to failure symptoms. Second, it lacks a methodology that would enable assigning quantitative values to levels of detection, diagnosis (tracking), and prognosis (prediction) supported by qualitative descriptions.
The purpose of this paper is to determine these technical specifications and develop a novel PdM assessment matrix that is demonstrated through a case study—making a centrifugal compressor PdM-ready. The paper takes an inductive approach to determine the technical specifications for a PdM-ready compressor based on data extracted from two sources: (1) a detailed systematic literature review and (2) case study data.
The remainder of this paper is organized as follows. Section 2 introduces the materials and methods, including state-of-the-art centrifugal compressor monitoring and the novel PdM assessment matrix design process. Section 3 is divided into two parts. First, the novel PdM assessment matrix process is demonstrated using a case study. Then, the enhancements to detection, diagnosis, and prognosis offered by Industry 4.0 technologies are shown. Section 4 specifies some conclusions.
2. Materials and Methods
This section explains the materials and methods applied in this research. First, Section 2.1 presents a detailed literature review addressing state-of-the-art centrifugal compressor monitoring. Second, Section 2.2 outlines the development of a novel PdM assessment matrix that allows the PdM readiness of equipment to be assessed.
2.1. State-of-the-Art Centrifgual Compressor Monitoring
The four-stage process presented by Tranfield [11] is adopted in a detailed systematic literature review to highlight the information needed to fulfill the requirements of a PdM-ready centrifugal compressor.
- Stage I—Define (identification of need for a literature review and development of protocol)
The literature review was intended to determine the requirements of a PdM-ready centrifugal compressor. This included highlighting the associated critical components and failure modes, the failure mechanisms and symptoms of each critical failure mode, the matching sensor that enables symptoms to be monitored, and the sensor coverage. It also included determining prioritized techniques for detection, diagnosis, and prognosis. The literature review protocol comprised data on fault type, measurement type, signal processing techniques, and diagnosis and prognosis approaches.
- Stage II—Collect and select
Relevant papers were identified and collected. This process included a search for relevant keywords in the Scopus database as depicted in Table 1. As seen in the Table 1, the number of relevant hits was limited to 64 papers.
- Stage III and IV—Analyze (categorization of documents and data extraction) and document results (document findings)
Relevant papers were studied and the necessary data were extracted according to the literature review protocol. The results are summarized in Table 2.
To summarize, most of the literature examines the maintainable item in terms of the overall equipment efficiency of the centrifugal compressor. The failure mechanisms are surge, fouling, and wear. The literature also demonstrates the usefulness of the application of various types of measurement, such as the process parameters of pressure and temperature, the performance indicator of flow, and health monitoring using vibration. The literature review indicates that the maintainable items and the failure modes, mechanisms, and symptoms are defined interchangeably.
The database of Offshore and Onshore Reliability Data (OREDA) [72] provides solid and transparent definitions of the critical failure modes, maintainable items, and failure mechanism of centrifugal compressors operated at the Norwegian continental shelf. Therefore, as the case study is a centrifugal compressor operating in the O&G industry, the study adopts the definitions used in the well-known and widely adopted OREDA database. The categorizations of failure severity levels are critical, degraded, and incipient failures. Importantly, the failure mechanisms in the OREDA data are interchangeable with those in the literature review (Table 2). However, there are some differences, as the failure mechanisms in the literature are presented by different researchers with proliferating definitions. Clearly, researchers do not follow a common standardized definition of failure modes, failure mechanisms, etc.
The literature review shows several techniques enable the condition monitoring of failures on centrifugal compressors. But there is no guarantee that all techniques are equally effective in their detection, diagnosis, and prognosis. Thus, an effectiveness assessment method [73] for detection, diagnosis, and prediction is needed to determine the associated priority indexes and a final PdM level.
2.2. PdM Assessment Matrix for Centrfiugal Compressor
In general, PdM comprises the activities of detection, diagnosis, and prognosis. To be more specific, the first concerns the detection of the presence of a failure, and the second is about diagnosing the associated symptoms and pinpointing the failure mechanism of the degraded component. Prognosis aims to estimate the future evolution of this specific failure mechanism by estimating the component or the equipment’s remaining useful life (RUL). When they are combined, these activities provide valuable information that supports opportunistic maintenance.
The requirements of PdM are situation-based, and symptoms of failures may be categorized as incipient, degraded, and critical [10]. These stages illustrate a qualitative measure of the symptom propagation that reflects the time until system failure, thus indicating the opportunity to perform opportunistic maintenance actions and the relative maintenance intervention required. Hence, the requirements of detection include earliness (incipient, degraded, or critical) and detectability (coverage), while diagnosis requires the ability to diagnose a faulty maintainable item along with its associated failure mechanism, cause, severity, and overall level of damage. The prediction requirements concern the predictive horizon and the precision of the deterioration prognosis and RUL estimate. Therefore, the associated requirements of detection, diagnosis, and prognosis for asset failures with negligible consequences are clearly different from those for failures with unacceptable consequences (i.e., excessive cost, operational unavailability, or health, safety, and environmental (HSE) dangers). Consider two scenarios. Failure of redundant equipment incurs little cost because one piece of equipment can be replaced by another. In contrast, failure in a normally unmanned offshore installation is accompanied by significant consequences and high cost (i.e., planning and resources).
To summarize, PdM requires a transparent connection between the failure modes, mechanisms, symptoms, and sensors to enable detection, diagnosis, and prognosis. Effective PdM has four requirements: (1) the symptoms identified must be clear and easy to track; (2) the diagnosis technique must involve reliable and accurate algorithms that enable detection of the failure mechanism at the preferred stage (incipient, degraded, or critical); (3) the prognosis technique must facilitate reliable and accurate RUL estimation; (4) these aforementioned requirements must be able to manage transient operational characteristics (e.g., fluctuation, change of loading), multiple failures, and failure interactions.
To assess the levels of PdM readiness, the PdM assessment matrix process comprises seven steps:
- Step 1: Determine the system boundary, interfaces, use case scenarios, and architecture.
- Step 2: Determine the critical components and failure modes.
- Step 3: Determine failure mechanisms and related symptoms.
- Step 4: Determine sensors and coverage index.
- Step 5: Determine detection techniques and priority index.
- Step 6: Determine diagnosis techniques and priority index.
- Step 7: Determine prediction techniques and priority index.
3. Results and Discussion
3.1. PdM Assessment of Case Study
The use of centrifugal compressors became popular in the 1960s, mainly because of their efficiency and low maintenance cost (compared to reciprocating compressors) [74]. The centrifugal compressor is considered a highly complex rotating system, given its components and typical transient operational behavior. The basic aim of the system is to pressurize a fluid to enable transportation or storage.
3.1.1. Step 1: System Boundary, Interfaces, Use Case Scenarios, and Architecture
In the context of the O&G industry, centrifugal compressors are used to enable the transportation of natural gas through subsea pipelines. An electric motor drives the centrifugal compressor by rotating the rotor. During operation, the gas is fed to the rotor and its rotating impellers. When the gas hits the rotating impellers, this accelerates the velocity of the gas and increases its kinetic energy. Next, the high-velocity gas is discharged into the diffusor (gas path with increasing radius), reducing its velocity and converting the recently introduced kinetic energy into static pressure.
3.1.2. Step 2: Critical Components and Failure Modes
The empirical case study data for failures experienced during operation show the maintainable items of rotor and bearings are two of the most critical components with associated failure modes of looseness (LOO) and vibration (VIB), respectively.
3.1.3. Step 3: Failure Mechanisms and Related Symptoms
After critical failure modes are identified, the associated symptoms that enable detection, tracking, and prediction of the underlying failure mechanisms (that if allowed to develop, result in the failure mode) must be determined. This includes identifying the relevant descriptors measuring the related symptom [75]. Such descriptors can be unprocessed raw data or processed data in terms of the mean or (exponential) moving average, etc. [9]. ISO 13379-1 [8] highlights the importance of selecting a good descriptor for detection purposes.
To give an example, this means the looseness (failure mode) of a rotor caused by a mechanical failure (failure mechanism) that increases the system’s vibration (measurable symptom) can be visualized through the average vibration level in the time domain (descriptor).
3.1.4. Step 4: Sensor and Coverage Index
In this step, the sensors and their coverage index must be identified. The sensor coverage index highlights the connection between sensor parameters and the failure modes and mechanisms. It expresses the relative value a specific parameter can detect in terms of failure mechanisms connected to a certain failure mode. It is estimated by dividing the sum of failure mechanisms detected by the sensor under study by the total number of failure mechanisms associated with the specific failure mode.
The centrifugal compressor under study has sensors monitoring health indicators (i.e., vibration and bearing temperature), process indicators (i.e., pressure, temperature, gas composition), and performance indicators (i.e., speed and polytrophic efficiency).
3.1.5. Step 5: Detection Techniques and Priority Index
The assessment of the detection effectiveness of each monitoring technique is supported by two measures, detectability percentage and detection earliness, as shown in the priority index in Table 3. These refer to how many cases were detected compared to all the cases and their earliness of detection, respectively. The ranking is based on the detection failure stage (incipient, degraded, or critical) and how easily the specific failure mode is detected. The detection level is a product of both earliness and detectability.
3.1.6. Step 6: Diagnosis Techniques and Priority Index
The priority index depicted in Table 4 allows the abilities of specific diagnosis techniques to be quantified. This supports identification of the most suitable approach to detect and diagnose specific failure modes of the system under study. As shown, the priority index proposes quantifying the diagnosis by the following two attributes: (1) informativeness of failure mechanism(s) and cause(s) diagnosed, and (2) ability to diagnose the maintainable item(s) supported by individual qualitative descriptions. Respectively, these quantities involve ranking the relevant information about the failure mechanism, severity, and overall level of damage offered by the diagnosis, and the ability to diagnose the maintainable item(s), whether this concerns normal or abnormal behavior, only damaged components, or deterioration levels for all components. The diagnosis level for the specific technique under study is estimated as the product of these two quantities.
3.1.7. Step 7: Prediction Techniques and Priority Index
The last step of the PdM assessment matrix is to determine the most suitable prediction technique using the priority index. First, prognosis is all about predicting the future behavior of the component under study by estimating its RUL [75]. To determine the best out of several possible prediction techniques, we propose using the priority index shown in Table 5. As seen, the table scores each specific prediction technique in two categories: predictive horizon and precision of deterioration prognosis and RUL prediction. More specifically, these refer to the time horizon within which the specific prognosis technique is able to predict the RUL (week, month, or months ahead), and the associated precision and accuracy of this prognosis and RUL estimate (variation in months, month, or week), respectively. The specific prognosis level is estimated by multiplying the quantitative rankings of the predictive horizon by the precision of deterioration prognosis and RUL prediction.
The PdM index at the component level can be estimated as the product of the coverage and levels of detection, diagnosis, and prognosis. Furthermore, underlining the most suitable condition parameters and analyses enables detection, diagnosis, and prognosis.
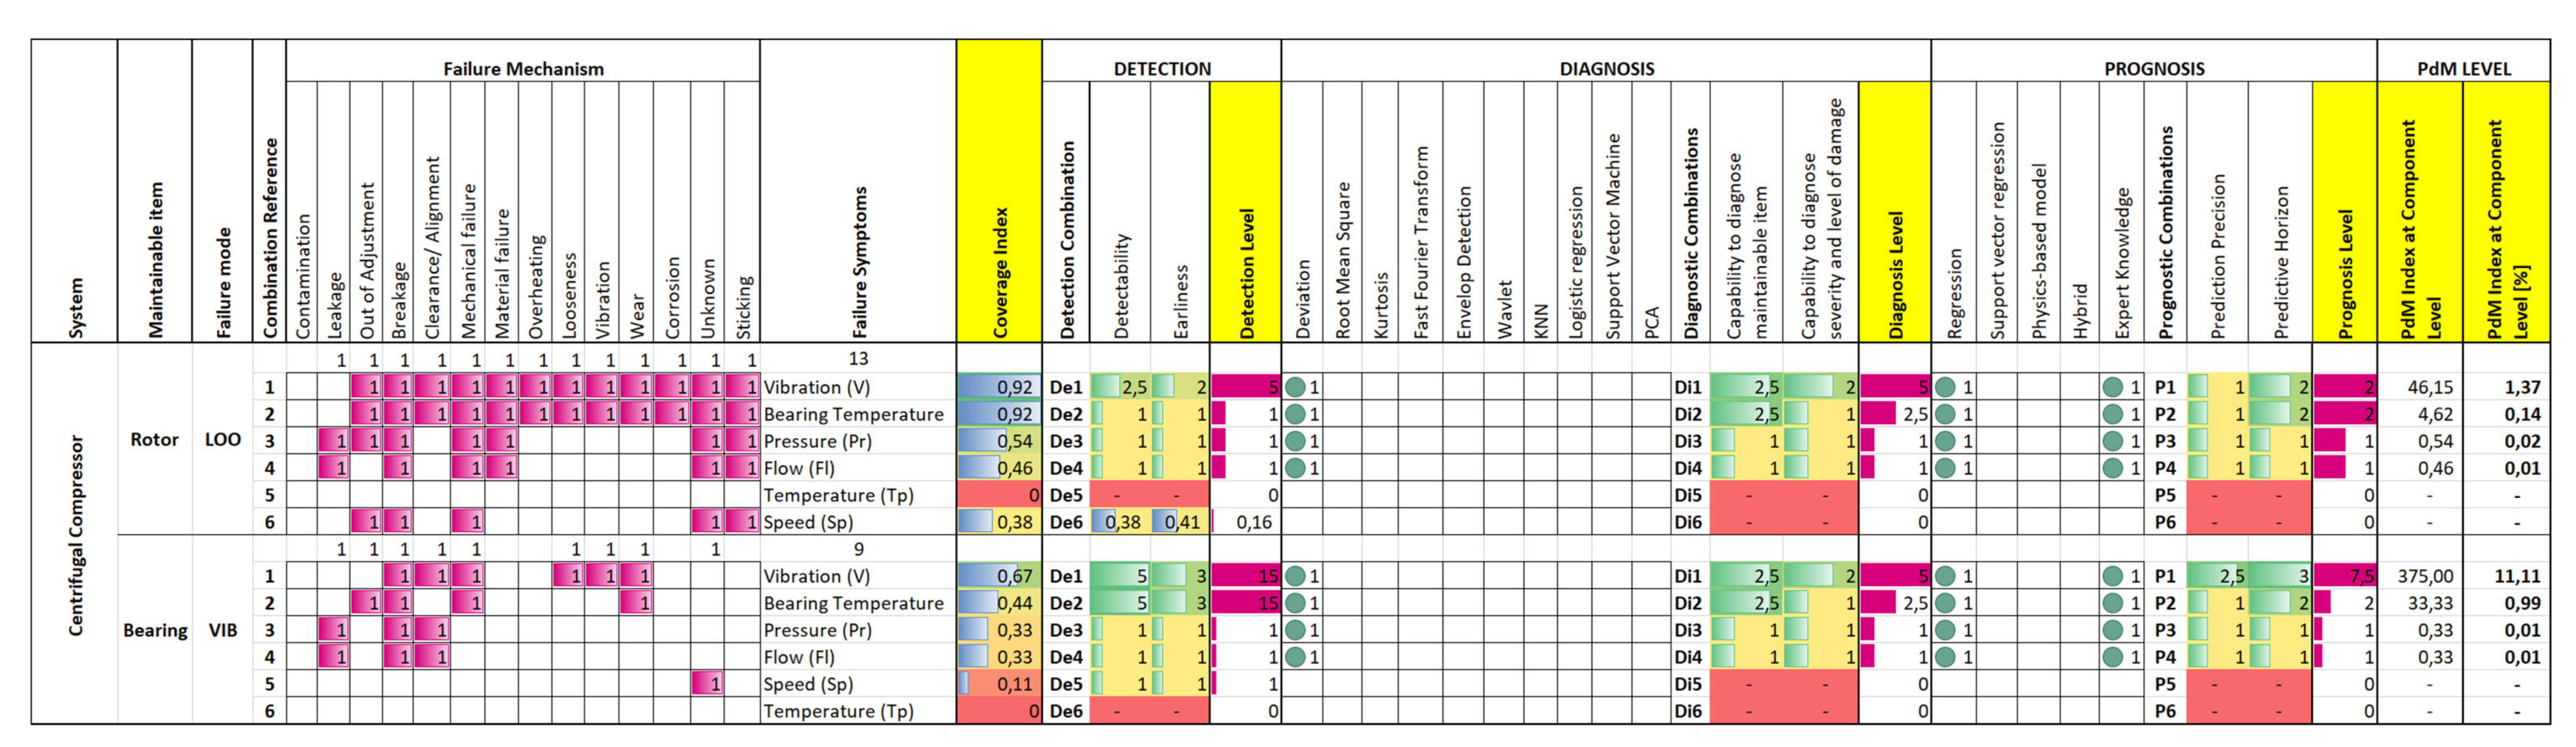
The final PdM assessment matrix covering the entire seven-step process is presented in Figure 1. In this case, the assigned values of the sensor coverage and the levels of detection, diagnosis, and prognosis are based on the literature review (Section 2.1) and the empirical case study data.
The final PdM assessment matrix for the case study clearly shows the connection between the coverage indexes of different failure symptoms associated with failure mechanisms and failure modes. It also shows the opportunities and limitations associated with the trending of one monitoring parameter at a time to detect, diagnose, and predict the equipment’s state. Finally, the PdM index level demonstrates that the trending of the vibration signal has the ability to enable the detection, diagnosis, and prediction of the failure modes studied: rotor looseness and bearing vibration.
The PdM assessment matrix process above is generalized in the following six steps:
- Step 1:
- Fill the first matrix that includes failure mechanism and failure symptoms. Then, determine the potential symptoms for each failure mechanism. In this case, 1 is assigned if the symptom is valid for the failure mechanism, and 0 is given if the symptom is not valid.
- Step 2:
- Estimate the coverage index for each failure symptom (sensor) by dividing the sum of failure mechanisms detected by the specific symptom under study by the total number of failure mechanisms associated with the specific failure mode. For example, the symptom of vibration can detect 11 out of 13 failure mechanisms associated with looseness (failure mode) of rotor (component), which offers a coverage index of 92% (12/13 = 0.92).
- Step 3:
- Estimate the effectiveness of the detection technique, which covers detectability (how accurate) and detection earliness (how early). In this step, the detection priority index in Table 3 is used to assign the relevant category based on technician experience and sensor manufacturer. For example, vibration sensor provides medium detectability (score 2.5) and medium earliness (score 2), which results in a total detection level of 5 (2.5 × 2 = 5).
- Step 4:
- Estimate the effectiveness of the diagnosis technique, which covers the diagnostic ability and diagnostic informativeness. In this step, the diagnosis priority index in Table 4 is used to assign the relevant category based on technician experience and diagnosis solution providers. For example, the studied compressor is monitored by a vibration sensor that is tracked over time to identify deviations in sensor output. Thus, this diagnosis technique is assigned to offer a medium level of diagnosis ability (score 2.5) and a medium level of diagnostic informativeness (score 2), which results in a total diagnosis level of 5 (2.5 × 2 = 5).
- Step 5:
- Estimate the effectiveness of the prognosis technique, which covers the prediction precision and predictive horizon. In this step, the prognosis priority index in Table 5 is used to assign the relevant category based on technician experience and prognosis solution providers. For example, the studied compressor is monitored by a vibration sensor, and two prognosis methods are used (regression and expert knowledge). Thus, this prognosis technique combination is assigned to offer a low level of prediction precision (score 1) and a medium level of predictive horizon (score 2), which results in a total prediction level of 2 (1 × 2 = 2).
- Step 6:
- Estimate the overall predictive maintenance effectiveness index by multiplying the coverage index (i.e., relative value) with the detection level (0–15), diagnosis level (0–15), and prognosis level (0–15). For example, the designed PdM specifications for the studied compressor scores 46 (0.92 × 5 × 5 × 2 = 46) out of 3375 (1 × 15 × 15 × 15 = 3375). Therefore, the PdM effectiveness percentage for the studied case is assigned a value of 1.37% (46/3375 = 0.0137).
3.2. PdM Assessment of Centrifugal Compressor in Industry 4.0
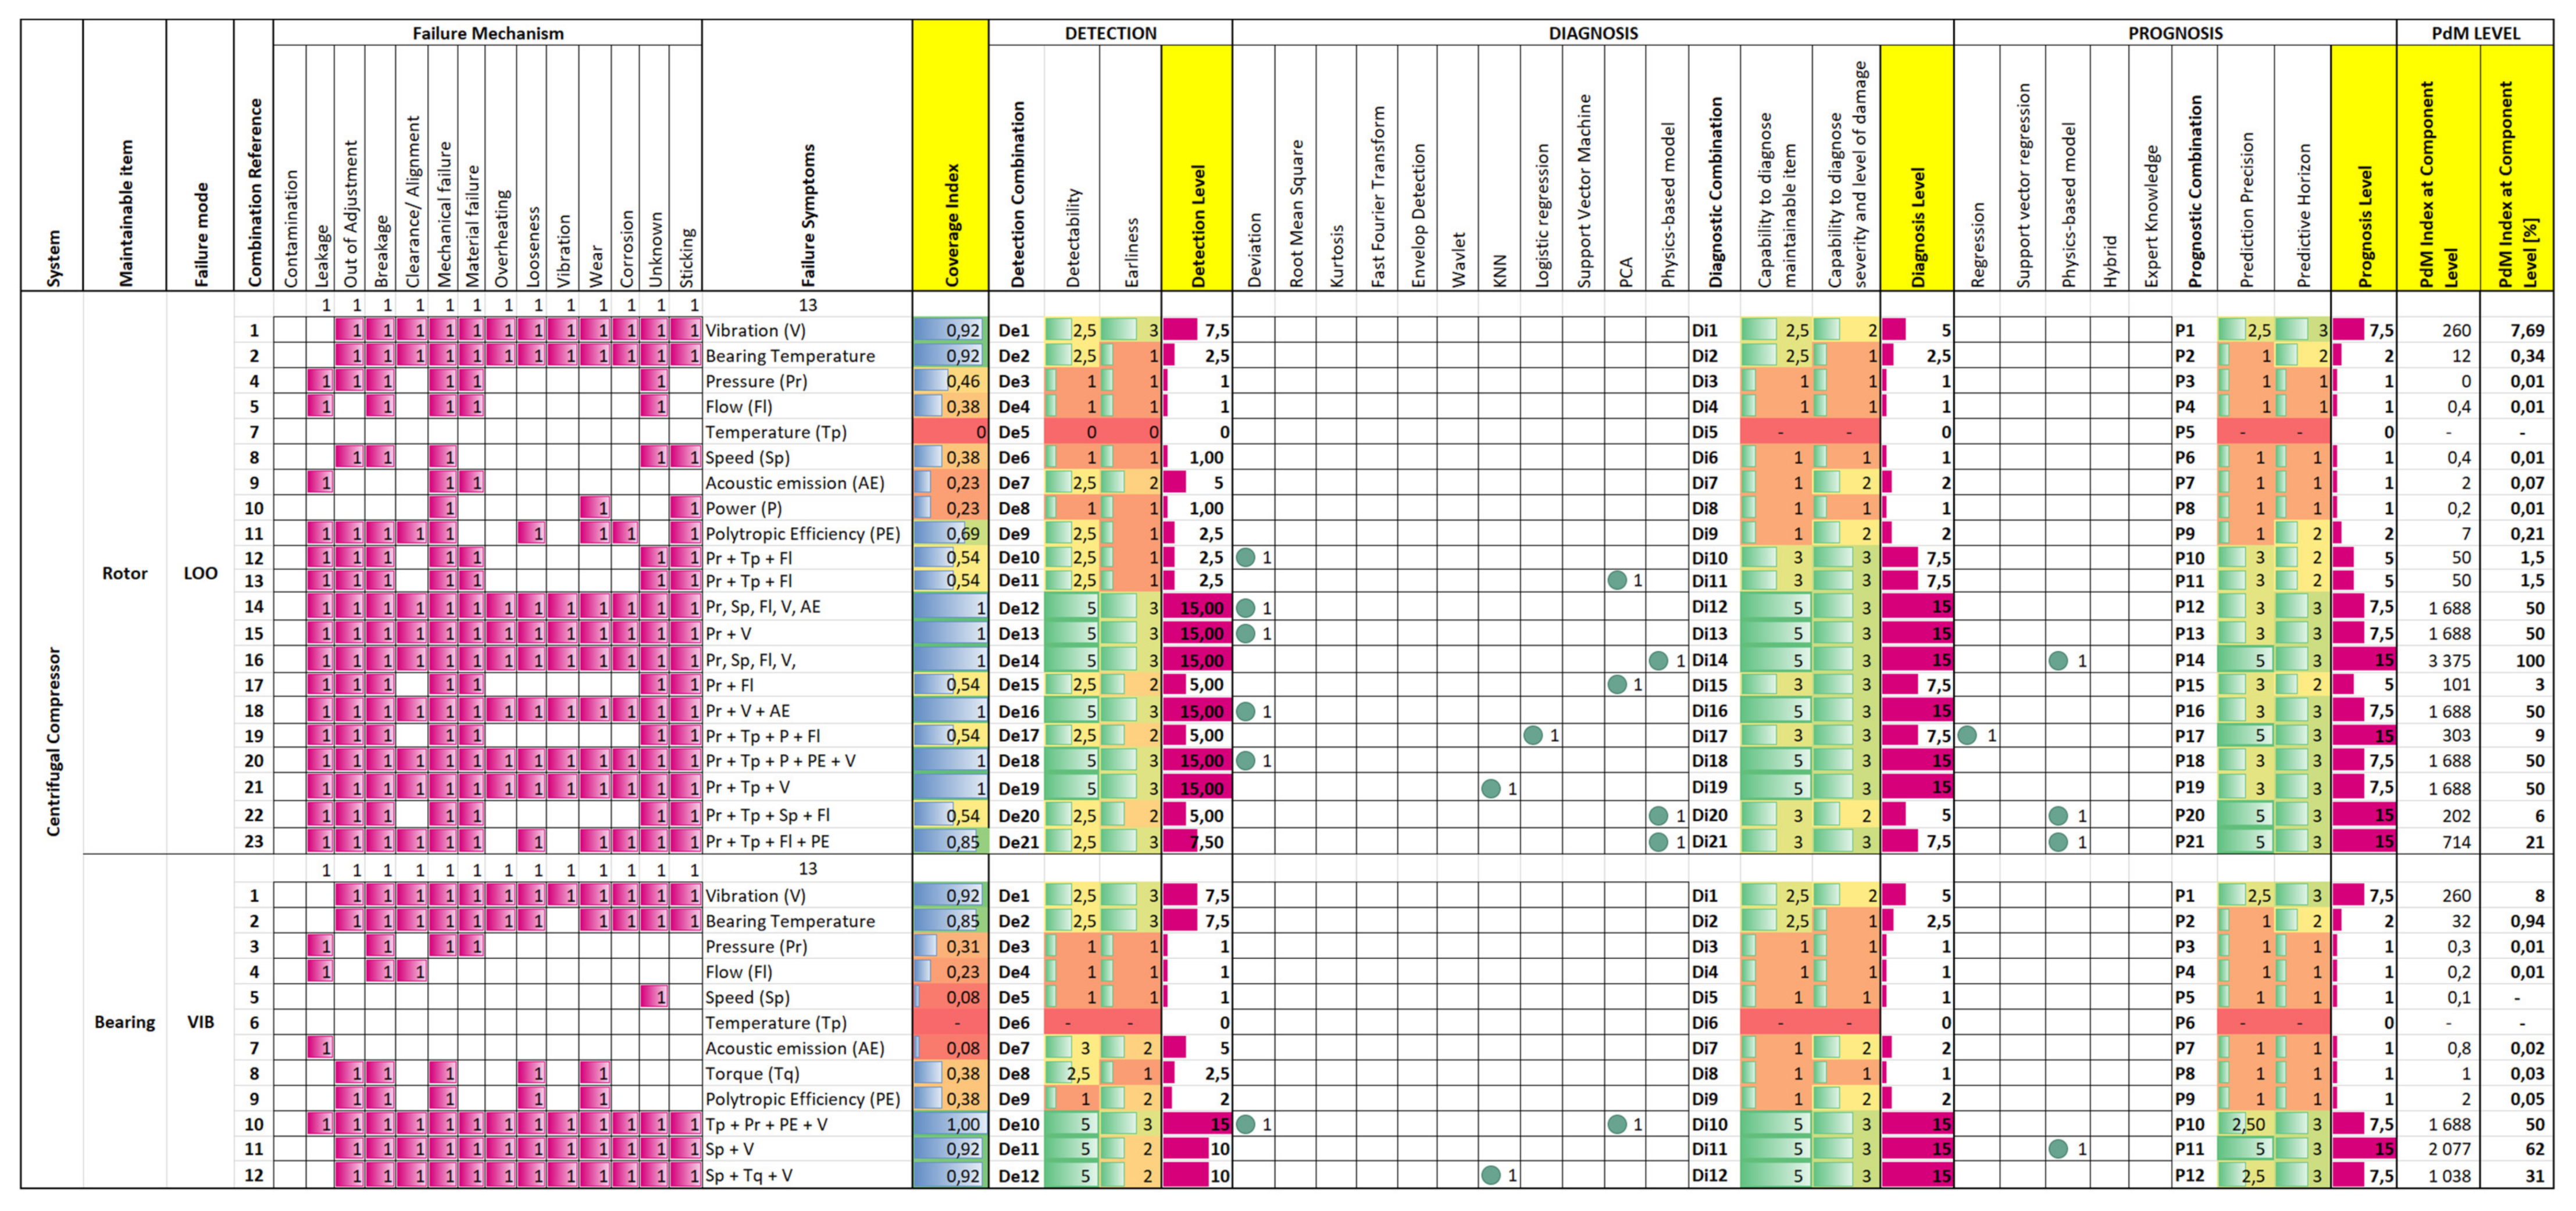
The expected enhancements in terms of detection, diagnosis, and prognosis offered by Industry 4.0 and its emerging technologies (CPS, IoT, big data, cloud computing) are already highlighted in this paper. Nevertheless, since the case study examines a single parameter, these possible enhancements have not been demonstrated. Therefore, a final PdM assessment matrix for centrifugal compressors in Industry 4.0, based on the detailed literature review in Section 2.1, is depicted in Figure 2.
As the Figure 2 shows, the final PdM assessment matrix for centrifugal compressors in Industry 4.0 highlights the connection between combining several sensor signals (i.e., multivariate analysis) and the ability to detect, diagnose, and predict the future evolution of failures. It also addresses the different levels of diagnosis and prognosis offered by specific applicable data analysis techniques. Finally, it demonstrates that the symptom combination of pressure, speed, flow, and vibration modelled using a model-based approach is the best approach to detect, diagnose, and predict rotor looseness, while the combination of symptoms for speed and vibration analyzed using a model-based approach is most suitable to detect, diagnose, and predict bearing vibration.
4. Conclusions
PdM needs to be incorporated with opportunistic maintenance to avoid shutdowns due to failures, unintended maintenance events, and high levels of service (repair or replacement due to damage spread from the faulty unit to the entire system). Knowing the failure symptoms, measuring techniques, and diagnostic analytics is not sufficient to determine the required technical specifications, even though monitoring technology has evolved over time, and a new method of FMSA was introduced by ISO 13379-1 [8] to identify both the critical symptoms and descriptors of failure mechanisms. FMSA is used to estimate the monitoring priority, and this helps to determine the critical monitoring specification. However, current FMSA cannot determine the effectiveness of technical specifications that are essential for predictive maintenance such as detection techniques (capability and coverage), diagnosis (fault type, location, and severity), or prognosis (precision and predictive horizon).
This paper proposes a novel PdM assessment matrix to cover these gaps. This includes priority indexes that enable the efficiency of detection, diagnosis, and prognosis techniques to be compared using qualitative descriptions with quantitative values. The PdM assessment matrix enables (1) identification of the most suitable PdM solution for the generic system under study, (2) assessment of the levels of the existing monitoring solution, and (3) determination of how an existing monitoring solution can achieve higher levels of PdM.
The proposed PdM assessment matrix is demonstrated in the case study of a centrifugal compressor and validated using empirical data provided by the case study company. The example highlights the entire process from the identification of critical components and failure modes to the incorporation of PdM to detect, diagnose, and predict the failure modes under study. It also highlights gaps in sensor coverage, potential superfluous sensors, and the optimal monitoring solution (i.e., sensor combinations and techniques for detection, diagnosis, and prognosis). The results clearly demonstrate the limitations of simple data analysis and the trending of single parameters, especially considering the levels of detection, diagnosis, and prognosis of failure mechanisms and failure modes.
As a supplement, the paper develops a PdM assessment matrix based on the literature and considering Industry 4.0 technologies. It reinforces industrial expectations about the potential to improve current levels of detection, diagnosis, and prognosis and shows improvements may occur with the application of multivariate analysis.
Several advanced diagnosis and prognosis techniques are not yet utilized in this industrial case, which shows a gap between what is available in literature and what is applied in industry, specifically, in this case study. Therefore, more case studies shall be conducted to study if the gap is case-specific or exists at the sector level. However, the proposed PdM assessment matrix can clearly help maintenance engineers at the design phase to determine and assess their selected technical solutions (combination of sensors, detection, and diagnosis and prognosis techniques).
The developed PdM assessment matrix is generalizable due to several considerations: (1) standardized and industrially well-known definitions are used, e.g., failure modes, mechanisms, and symptoms, (2) it adopts the maintenance data definitions of ISO 14224, (3) it involves well-known stakeholders and their opinion in deciding about monitoring technique effectiveness, and (4) it includes well-known techniques presented in literature. However, it is important to highlight that since humans are involved in the PdM assessment matrix process (e.g., the categorization matrices in Table 3, Table 4 and Table 5), the assigned values are somewhat subjective, case-specific, and based on human experience. Therefore, it is recommended that testing and validation be conducted for all these advance diagnosis and prognosis techniques to determine their diagnostic and prognosis probabilities based on an objective experimental approach.
Author Contributions
Conceptualization, H.N. and I.E.-T.; Data curation, H.N.; Formal analysis, H.N.; Funding acquisition, I.E.-T.; Investigation, H.N.; Methodology, H.N. and I.E.-T.; Project administration, H.N.; Resources, I.E.-T.; Supervision, I.E.-T.; Validation, H.N.; Writing—original draft, H.N. and I.E.-T.; Writing—review & editing, H.N. and I.E.-T. All authors have read and agreed to the published version of the manuscript.
Funding
The authors want to thank the University of Stavanger for financial support [Grant Number IN-11626]. They also wish to thank the case study company for providing interesting case study data.
Institutional Review Board Statement
Not applicable.
Informed Consent Statement
Not applicable.
Conflicts of Interest
The authors declare no conflict of interest.
References
- Groba, C.; Cech, S.; Rosenthal, F.; Gossling, A. Architecture of a Predictive Maintenance Framework. In Proceedings of the 6th International Conference on Computer Information Systems and Industrial Management Applications (CISIM’07), Minneapolis, USA, 28–30 June 2007. [Google Scholar] [CrossRef]
- Ruiz-Cárcel, C.; Jaramillo, V.H.; Mba, D.; Ottewill, J.R.; Cao, Y. Combination of process and vibration data for improved condition monitoring of industrial systems working under variable operating conditions. Mech. Syst. Signal. Process. 2016, 66–67, 699–714. [Google Scholar]
- Li, X.; Duan, F.; Mba, D.; Bennett, I. Rotating machine prognostics using system-level models. In Proceedings of the International Conference on Quality, Reliability, Risk, Maintenance, and Safety Engineering (QR2MSE 2016), Jiuzhaigou, Sichuan, China, 25–28 July 2016. [Google Scholar]
- World Economic Forum. Digital Transformation Initiative Oil and Gas. Industry; World Economic Forum: Geneva, Switzerland, 2017. [Google Scholar]
- IEC60706-2. Maintainability of equipment-Part 2-Maintainability requirements and studies during the design and development phase. Int. Electrotech. Comm. 2006, 2. [Google Scholar]
- NORSOK Z-008. Risk based maintenance and consequence classification. NORSOK Stand. Nor. 2017, 4. [Google Scholar]
- IEC 60812. Failure modes and effects analysis (FMEA and FMECA). Int. Electrotech. Comm. 2018, 3. [Google Scholar]
- ISO13379-1. Condition Monitoring and Diagnostics of Machines—Data Interpretation and Diagnostics Techniques—Part 1: General Guidelines; International Organization for Standardization: Geneva, Switzerland, 2012. [Google Scholar]
- ISO-17359. Condition monitoring and diagnostics of machines General guidelines. Geneva Int. Organ. Stand. 2018, 3, 1–29. [Google Scholar]
- El-Thalji, I. Predictive Maintenance (PdM) Analysis Matrix: A tool to determine technical specications for PdM ready-equipment. In Computational Methods in Offshore Technology; University of Stavanger: Stavanger, Norway, 2019. [Google Scholar]
- Tranfield, D.; Denyer, D.; Smart, P. The modern approach to industrial maintenance management. Br. J. Manag. 2003, 14, 207–222. [Google Scholar] [CrossRef]
- Yexley, C. Condition monitoring of process gas compressors. Noise Vib. Control. Worldw. 1989, 20, 13–17. [Google Scholar]
- Mathioudakis, K.; Tsalavoutas, A. Identification of Mechanical Alterations from Their Effect on Performance of a Radial Compressor. In Proceedings of the AMSE 1995 International Gas Turbine and Aeroengine Congress and Exposition, Volume 5: Manufacturing Materials and Metallurgy, Ceramics, Structures and Dynamics; Controls, Diagnostics and Instrumentation, Education, IGTI Scholar Award, Houston, Texas, USA, 5–8 June 1995; p. V005T15A003. [Google Scholar] [CrossRef]
- Aretakis, N.; Mathioudakis, K. Radial compressor fault identification using dynamic measurement data. ASME 1996, 78767, V005T15A009. [Google Scholar]
- Aretakis, N.; Mathioudakis, K. Classification of radial compressor faults using pattern-recognition techniques. Control. Eng. Pract. 1998, 6, 1217–1223. [Google Scholar] [CrossRef]
- Bently, D.E.; Goldman, P. Vibrational Diagnostics of Rotating Stall in Centrifugal Compressors. Orbit 2000, 21, 32–40. [Google Scholar]
- Kushner, F.; Richard, S.J.; Strickland, R.A. Critical Review of Compressor Impeller Vibration Parameters for Failure Prevention. Tex. AM Univ. Turbomach. Lab. 2000. [Google Scholar] [CrossRef]
- Venturini, M. Development and Experimental Validation of a Compressor Dynamic Model. J. Turbomach. 2004, 127, 599–608. [Google Scholar] [CrossRef]
- Venturini, M. Simulation of Compressor Transient Behavior through Recurrent Neural Network Models. J. Turbomach. 2005, 128, 444–454. [Google Scholar] [CrossRef]
- Liang, Y.W.; Yen, C.L.; Xu, S.D.; Liaw, D.C. Detection and diagnosis of compressors’ instabilities: A mixed model-based and signal-based approach. Int. J. Electr. Eng. 2005, 12, 151–158. [Google Scholar]
- Morini, M.; Pinelli, M.; Venturini, M. Acoustic and Vibrational Analyses on a Multi-Stage Compressor for Unstable Behavior Precursor Identification. In Proceedings of the ASME Turbo Expo 2007: Power for Land, Sea, and Air, Montreal, QC, Canada, 14–17 May 2007; 47934, pp. 1415–1423. [Google Scholar]
- Galindo, J.; Serrano, J.R.; Climent, H.; Tiseira, A. Experiments and modelling of surge in small centrifugal compressor for automotive engines. Exp. Therm. Fluid Sci. 2008, 32, 818–826. [Google Scholar] [CrossRef]
- Yang, W.; Tavner, P.J. Empirical mode decomposition, an adaptive approach for interpreting shaft vibratory signals of large rotating machinery. J. Sound Vib. 2009, 321, 1144–1170. [Google Scholar] [CrossRef]
- Hafaifa, A.; Laaouad, F.; Laroussi, K. Fuzzy logic approach applied to the surge detection and isolation in centrifugal compressor. Autom. Control. Comput. Sci. 2010, 44, 53–59. [Google Scholar] [CrossRef]
- Haifa, A.; Daoudi, A.; Laroussi, K. Modelling and Control of Surge in Centrifugal Compression Based on Fuzzy Rule System. Stud. Inform. Control. 2010, 19, 347–356. [Google Scholar]
- Hafaifa, A.; Daoudi, A.; Laroussi, K. Application of Fuzzy Diagnosis in Fault Detection and Isolation to the Compression System Protection. Control. Intell. Syst. 2011, 39, 151. [Google Scholar] [CrossRef]
- Hafaifa, A.; Rachid, B.; Mouloud, G. Modelling of surge phenomena in a centrifugal compressor: Experimental analysis for control. Syst. Sci. Control. Eng. 2014, 2, 632–641. [Google Scholar] [CrossRef]
- Zanoli, S.M.; Astolfi, G.; Barboni, L. Applications of Fault Diagnosis techniques for a multishaft centrifugal compressor. In Proceedings of the 18th Mediterranean Conference on Control and Automation, MED’10, Marrakech, Morocco, 23–25 June 2010; pp. 64–69. [Google Scholar]
- Zanoli, S.M.; Astolfi, G.; Barboni, L. Principal Component Analysis based on ANOVA Test for Multishaft Centrifugal Compressor Fault Detection and Diagnosis. IFAC Proc. Vol. 2010, 43, 90–96. [Google Scholar] [CrossRef]
- Kyriazis, A.; Helmis, I.; Aretakis, N.; Roumeliotis, I.; Mathioudakis, K. Gas turbines compressor fault identification by utilizing fuzzy logic-based diagnostic systems. In Proceedings of the 9th European Conference on Turbomachinery: Fluid Dynamics and Thermodynamics, ETC 2011, Istanbul, Turkey, 21–25 March 2011; pp. 865–878. [Google Scholar]
- Zanoli, S.M.; Astolfi, G. Faults Diagnosis for a centrifugal machine using the Mahalanobis distance. In Proceedings of the 8th IFAC Symposium on Fault Detection, Supervision and Safety of Technical Processes (SAFEPROCESS), Mexico City, Mexico, 29–31 August 2012. [Google Scholar]
- Zanoli, S.M.; Astolfi, G.; Marczyk, J. Complexity-based methodology for Fault Diagnosis: Application on a centrifugal machine. IFAC Proc. Vol. 2012, 45, 51–56. [Google Scholar] [CrossRef]
- Hafaifa, A.; Guemana, M.; Daoudi, A. Vibrations supervision in gas turbine based on parity space approach to increasing efficiency. J. Vib. Control. 2013, 21, 1622–1632. [Google Scholar] [CrossRef]
- Magara, Y.; Yamaguchi, K.; Miura, H.; Takahashi, N.; Narita, M. Natural Frequency Shift in a Centrifugal Compressor Impeller for High-Density Gas Applications. J. Turbomach. 2013, 135, 011014. [Google Scholar] [CrossRef]
- Li, H.; Zhang, X.; Xu, F. Experimental investigation on centrifugal compressor blade crack classification using the squared envelope spectrum. Sensors 2013, 13, 12548–12563. [Google Scholar] [CrossRef] [Green Version]
- Li, H.; Zhang, X.; Zhang, X.; Yang, S.; Xu, F. Pressure Pulsation Signal Analysis for Centrifugal Compressor Blade Crack Determination. Math. Probl. Eng. 2014, 2014, 862065. [Google Scholar] [CrossRef]
- Vagani, M.; Engeda, A.; Cave, M.J. Prediction of impeller rotating stall onset using numerical simulations of a centrifugal compressor. Part 1: Detection of rotating stall using fixed-flow transient simulations. Proc. Inst. Mech. Eng. Part A J. Power Energy 2013, 227, 403–414. [Google Scholar] [CrossRef]
- Vagani, M.; Engeda, A.; Cave, M.J. Prediction of impeller rotating stall onset using numerical simulations of a centrifugal compressor. Part 2: Evaluation of mass-flow fluctuations at rotor–stator interfaces. Proc. Inst. Mech. Eng. Part A J. Power Energy 2013, 227, 415–425. [Google Scholar] [CrossRef]
- Alavinia, S.M. Surge avoidance in gas compressor via fault diagnosis. In Proceedings of the 2015 IEEE International Conference on Electrical, Computer and Communication Technologies (ICECCT), Coimbatore, India, 5–7 March 2015; pp. 1–9. [Google Scholar]
- Xenos, D.P.; Cicciotti, M.; Bouaswaig, A.E.F.; Thornhill, N.F.; Martinez-Botas, R. Modeling and Optimization of Industrial Centrifugal Compressor Stations Employing Data-Driven Methods. In Proceedings of the ASME Turbo Expo 2014: Turbine Technical Conference and Exposition, Volume 3B: Oil and Gas Applications, Organic Rankine Cycle Power Systems, Supercritical CO2 Power Cycles, Wind Energy, Düsseldorf, Germany, 16–20 June 2014; p. V03BT25A004. [Google Scholar]
- Xenos, D.P.; Thornhill, N.F.; Cicciotti, M.; Bouaswaig, A.E.F. Preprocessing of raw data for developing steady-state data-driven models for optimizing compressor stations. In Proceedings of the 2014 UKACC International Conference on Control (CONTROL), Loughborough, UK, 9–11 July 2014; pp. 438–443. [Google Scholar]
- Cicciotti, M.; Xenos, D.P.; Bouaswaig, A.E.F.; Thornhill, N.F.; Martinez-Botas, R.F. Online Performance Monitoring of Industrial Compressors Using Meanline Modelling. In Proceedings of the ASME Turbo Expo 2014: Turbine Technical Conference and Exposition. Volume 2D: Turbomachinery, Düsseldorf, Germany, 16–20 June 2014; p. V02DT42A003. [Google Scholar]
- Cicciotti, M.; Xenos, D.P.; Bouaswaig, A.E.; Thornhill, N.F.; Martinez-Botas, R.F. Physical modelling of industrial multistage centrifugal compressors for monitoring and simulation. Proc. Inst. Mech. Eng. Part C J. Mech. Eng. Sci. 2015, 229, 3433–3448. [Google Scholar] [CrossRef]
- Orkisz, M.; Lipnicki, P. Rotating compressor surge detection using variable speed drive signals. In Proceedings of the 2014 International Symposium on Power Electronics, Electrical Drives, Automation and Motion, Ischia, Italy, 18–20 June 2014; pp. 455–460. [Google Scholar]
- Gowid, S.; Dixon, R.; Ghani, S. A novel robust automated FFT-based segmentation and features selection algorithm for acoustic emission condition based monitoring systems. Appl. Acoust. 2015, 88, 66–74. [Google Scholar] [CrossRef]
- Xenos, D.P.; Cicciotti, M.; Kopanos, G.M.; Bouaswaig, A.E.F.; Kahrs, O.; Martinez-Botas, R.; Thornhill, N.F. Optimization of a network of compressors in parallel: Real Time Optimization (RTO) of compressors in chemical plants—An industrial case study. Appl. Energy 2015, 144, 51–63. [Google Scholar] [CrossRef] [Green Version]
- Xenos, D.P.; Kopanos, G.M.; Cicciotti, M.; Thornhill, N.F. Operational optimization of networks of compressors considering condition-based maintenance. Comput. Chem. Eng. 2016, 84, 117–131. [Google Scholar] [CrossRef] [Green Version]
- Cortinovis, A.; Mercangöz, M.; Stava, T.O.; Van de moortel, S.; Lunde, E. Dynamic Time to Surge Computation for Electric Driven Gas Compressors during Voltage Dips. IFAC PapersOnLine 2016, 49, 949–954. [Google Scholar] [CrossRef]
- Wu, X.; Liu, Y.; Liu, R.; Zhao, L. Surge detection methods using empirical mode decomposition and continuous wavelet transform for a centrifugal compressor. J. Mech. Sci. Technol. 2016, 30, 1533–1536. [Google Scholar] [CrossRef]
- Lu, Y.; Wang, F.; Jia, M.; Qi, Y. Centrifugal compressor fault diagnosis based on qualitative simulation and thermal parameters. Mech. Syst. Signal. Process. 2016, 81, 259–273. [Google Scholar] [CrossRef]
- Cho, S.; Shin, J.-H.; Jun, H.-B.; Hwang, H.-J.; Ha, C.; Hwang, J. A Study on Estimating the Next Failure Time of Compressor Equipment in an Offshore Plant. Math. Probl. Eng. 2016, 2016, 8705796. [Google Scholar] [CrossRef]
- Al-Busaidi, W.; Pilidis, P. Investigation of Efficiency Deterioration Causes in Process Centrifugal Compressor Operation. J. Fail. Anal. Prev. 2016, 16, 19–36. [Google Scholar] [CrossRef]
- Li, H.; He, C.; Jiang, D.; Wang, X. Blade Incipient Crack Determination for Centrifugal Compressor Based on Pressure Pulsation Signal Feature Extraction. In Proceedings of the ASME Turbo Expo 2016: Turbomachinery Technical Conference and Exposition, Volume 2D: Turbomachinery, Seoul, Korea, 13–17 June 2016; p. V02DT44A005. [Google Scholar]
- Li, H.; He, C.; Zhou, Q.; Lu, F. Blade Incipient Crack Determination for Centrifugal Compressor Based on CWT-Stochastic Resonance Method. In Proceedings of the ASME Turbo Expo 2017: Turbomachinery Technical Conference and Exposition, Volume 7B: Structures and Dynamics, Charlotte, NC, USA, 26–30 June 2017; p. V07BT35A014. [Google Scholar]
- Munari, E.; Morini, M.; Pinelli, M.; Spina, P.R. Experimental Investigation and Modeling of Surge in a Multistage Compressor. Energy Procedia 2017, 105, 1751–1756. [Google Scholar] [CrossRef]
- Golmoradi, M.; Ebrahimi, E.; Javidan, M. Compressor fault diagnosis based on SVM and GA. Vibroengineering Procedia 2017, 12, 49–53. [Google Scholar] [CrossRef] [Green Version]
- Golmoradi, M.; Ebrahimi, E.; Javidan, M. Fault diagnosis of compressor based on decision tree and fuzzy inference system. Vibroengineering Procedia 2017, 12, 54–60. [Google Scholar] [CrossRef] [Green Version]
- Zaza, G.; Hammou, A.D.; Benchatti, A.; Saiah, H. Fault Detection Method on a Compressor Rotor Using the Phase Variation of the Vibration Signal. Int. J. Eng. 2017, 30, 1176–1181. [Google Scholar]
- Jun, H.-B.; Kim, D. A Bayesian network-based approach for fault analysis. Expert Syst. Appl. 2017, 81, 332–348. [Google Scholar] [CrossRef]
- Safiyullah, F.; Sulaiman, S.A.; Naz, M.Y.; Jasmani, M.S.; Ghazali, S.M.A. Prediction on performance degradation and maintenance of centrifugal gas compressors using genetic programming. Energy 2018, 158, 485–494. [Google Scholar] [CrossRef]
- Zhang, Y.; Zheng, S.; Chen, Q.; Fang, J. Surge Detection Approach for Magnetically Suspended Centrifugal Compressors Using Adaptive Frequency Estimator. IEEE Trans. Ind. Electron. 2018, 65, 5733–5742. [Google Scholar] [CrossRef]
- Engelberth, T.; Krawczyk, D.; Verl, A. Model-based method for condition monitoring and diagnosis of compressors. Procedia Cirp. 2018, 72, 1321–1326. [Google Scholar] [CrossRef]
- He, C.; Li, H.; Zhao, X. Weak characteristic determination for blade crack of centrifugal compressors based on underdetermined blind source separation. Measurement 2018, 128, 545–557. [Google Scholar] [CrossRef]
- Li, H.; He, C.; Malekian, R.; Li, Z. Weak Defect Identification for Centrifugal Compressor Blade Crack Based on Pressure Sensors and Genetic Algorithm. Sensors 2018, 18, 1264. [Google Scholar] [CrossRef] [PubMed] [Green Version]
- Li, X.; Duan, F.; Loukopoulos, P.; Bennett, I.; Mba, D. Canonical variable analysis and long short-term memory for fault diagnosis and performance estimation of a centrifugal compressor. Control. Eng. Pract. 2018, 72, 177–191. [Google Scholar] [CrossRef]
- Li, X.; Duan, F.; Sattar, T.; Bennett, I.; Mba, D. Canonical Variable Analysis for Fault Detection, System Identification and Performance Estimation. In Proceedings of the 7th conference on Design and Modeling of Mechanial System (SMSM’2017), Hammamet, Tunisia, 27–29 March 2018. [Google Scholar] [CrossRef]
- Li, Q.; Wang, W.; Weaver, B.; Shao, X. Active rotordynamic stability control by use of a combined active magnetic bearing and hole pattern seal component for back-to-back centrifugal compressors. Mech. Mach. Theory 2018, 127, 1–12. [Google Scholar] [CrossRef]
- Sharma, S.; García-Tíscar, J.; Allport, J.M.; Jupp, M.L.; Nickson, A.K. Impact of Impeller Casing Treatment on the Acoustics of a Small High Speed Centrifugal Compressor. In Proceedings of the ASME Turbo Expo 2018: Turbomachinery Technical Conference and Exposition, Volume 2B: Turbomachiner, Oslo, Norway, 11–15 June 2018; p. V02BT43A010. [Google Scholar]
- Shu, M.; Yang, M.; Martinez-Botas, R.F.; Deng, K.; Shi, L. Unsteady Responses of the Impeller of a Centrifugal Compressor Exposed to Pulsating Backpressure. J. Eng. Gas Turbines Power 2019, 141, 041005. [Google Scholar] [CrossRef]
- Zeng, J.; Chen, K.; Ma, H.; Duan, T.; Wen, B. Vibration response analysis of a cracked rotating compressor blade during run-up process. Mech. Syst. Signal. Process. 2019, 118, 568–583. [Google Scholar] [CrossRef]
- Han, T.; Liu, C.; Wu, L.; Sarkar, S.; Jiang, D. An adaptive spatiotemporal feature learning approach for fault diagnosis in complex systems. Mech. Syst. Signal. Process. 2019, 117, 170–187. [Google Scholar] [CrossRef]
- OREDA. Offshore and Onshore Reliability Data Handbook—Topside Equipment. In Sintef NTNU 2015, 6th ed.; DNV GL: Trondheim, Norway, 2015; Volume 1. [Google Scholar]
- Georgiou, G. PoD Curves, their derivation, applications and limitations. Insight Non Destr. Test. Cond. Monit. 2007, 49, 409–414. [Google Scholar] [CrossRef]
- Boyce, M.P. Centrifugal Compressor: A Basic Guide; PennWell Books: Tulsa, OK, USA, 2003. [Google Scholar]
- ISO13372. Condition Monitoring and Diagnostics of Machines—Vocabulary; International Organization for Standardization: Geneva, Switzerland, 2012. [Google Scholar]
Figure 1.
Snapshot of final PdM assessment matrix based on the case study.

Figure 2.
Snapshot of PdM assessment matrix for centrifugal compressors in Industry 4.0.


Table 1.
Search in Scopus showing the number of relevant hits.
| Search Keyword (Scopus) | No. of Hits | Relevant Hits |
|---|---|---|
| ALL (compressor AND fault) AND (LIMIT-TO (DOCTYPE, “re”)) | 104 | General hits; not specifically for centrifugal compressor |
| (ALL (compressor)) AND ((centrifugal)) AND (fault AND detection) AND (LIMIT-TO (SUBJAREA,“ENGI”)) | 323 | 64 relevant hits regarding centrifugal compressor |
Table 2.
A summary of state-of-the-art centrifugal compressor monitoring (i.e., predictive maintenance) and analyses.
Table 2.
A summary of state-of-the-art centrifugal compressor monitoring (i.e., predictive maintenance) and analyses.
| Reference | Maintainable Item | Failure Mechanism | Data Type | Measurement Type | Data Processing | Analysis | |||||||||||||||||||||||||||||||||||||||
|---|---|---|---|---|---|---|---|---|---|---|---|---|---|---|---|---|---|---|---|---|---|---|---|---|---|---|---|---|---|---|---|---|---|---|---|---|---|---|---|---|---|---|---|---|---|
| Diagnosis | Prognosis | ||||||||||||||||||||||||||||||||||||||||||||
| Overall Equipment Efficiency | Rotor | Blade/Impeller | Bearing | Seal | Valve | Magnetic Bearing | Variable Speed Drive | Diffusor | Sensor | Surge | Stall | Clearance | Bearing Defect | Oil Whirl | Leakage | Fouling | Wear | Misalignment | Looseness | Fluid Excitation | Unbalance | Internal Blockage | Crack | Simulation | Experimental | Industrial | Machine Performance | Fluid/Gas Performance | Vibration | Acoustic Emission | Strain Gauges | Pre-Processing | Statistical | Frequency Domain | Time/Frequency | Rule-based, Fuzzy Logic | Pattern Recognition | Random Forest, Principal Component Analysis | Neural Network | Logistic Regressions | Support Vector Machines | Data-driven | Model-Based | Hybrid Approach | |
| [12] | |||||||||||||||||||||||||||||||||||||||||||||
| [13] | x | x | x | x | x | x | x | x | x | ||||||||||||||||||||||||||||||||||||
| [14,15] | x | x | x | x | x | x | x | x | x | x | x | ||||||||||||||||||||||||||||||||||
| [16] | x | x | x | x | x | x | x | x | x | ||||||||||||||||||||||||||||||||||||
| [17] | x | x | x | x | x | x | x | x | |||||||||||||||||||||||||||||||||||||
| [18] | x | x | x | x | x | x | |||||||||||||||||||||||||||||||||||||||
| [19] | x | x | x | x | x | x | x | x | x | ||||||||||||||||||||||||||||||||||||
| [20] | x | x | x | x | x | x | x | x | x | ||||||||||||||||||||||||||||||||||||
| [21] | x | x | x | x | x | x | x | x | x | x | |||||||||||||||||||||||||||||||||||
| [22] | x | x | x | x | x | x | x | ||||||||||||||||||||||||||||||||||||||
| [23] | x | x | x | x | x | x | x | x | x | x | x | ||||||||||||||||||||||||||||||||||
| [24,25,26,27] | x | x | x | x | x | x | x | ||||||||||||||||||||||||||||||||||||||
| [28,29] | x | x | x | x | x | x | x | x | |||||||||||||||||||||||||||||||||||||
| [30] | x | x | x | x | x | x | x | x | x | x | x | ||||||||||||||||||||||||||||||||||
| [31,32] | x | x | x | x | x | x | x | x | x | x | x | x | x | ||||||||||||||||||||||||||||||||
| [33] | x | x | x | x | x | x | x | x | |||||||||||||||||||||||||||||||||||||
| [34] | x | x | x | x | x | x | x | ||||||||||||||||||||||||||||||||||||||
| [35,36] | x | x | x | x | x | x | x | x | x | x | |||||||||||||||||||||||||||||||||||
| [37,38] | x | x | x | x | x | x | x | x | x | ||||||||||||||||||||||||||||||||||||
| [39] | x | x | |||||||||||||||||||||||||||||||||||||||||||
| [40,41] | x | x | x | x | x | x | x | x | x | ||||||||||||||||||||||||||||||||||||
| [42,43] | x | x | x | x | x | x | x | x | |||||||||||||||||||||||||||||||||||||
| [44] | x | x | x | x | x | x | x | x | |||||||||||||||||||||||||||||||||||||
| [45] | x | x | x | x | x | x | x | ||||||||||||||||||||||||||||||||||||||
| [46,47] | x | x | x | x | x | x | x | x | |||||||||||||||||||||||||||||||||||||
| [48] | x | x | x | x | x | x | x | ||||||||||||||||||||||||||||||||||||||
| [49] | x | x | x | x | x | x | |||||||||||||||||||||||||||||||||||||||
| [50] | x | x | x | x | x | x | x | x | x | ||||||||||||||||||||||||||||||||||||
| [51] | x | x | x | x | x | x | x | x | |||||||||||||||||||||||||||||||||||||
| [52] | x | x | x | x | x | x | x | x | |||||||||||||||||||||||||||||||||||||
| [53,54] | x | x | x | x | x | x | x | ||||||||||||||||||||||||||||||||||||||
| [55] | x | x | x | x | x | x | x | ||||||||||||||||||||||||||||||||||||||
| [56,57] | x | x | x | x | x | x | x | x | x | ||||||||||||||||||||||||||||||||||||
| [58] | x | x | x | x | x | x | x | x | x | x | x | ||||||||||||||||||||||||||||||||||
| [59] | x | x | x | x | x | x | x | x | x | x | |||||||||||||||||||||||||||||||||||
| [60] | x | x | x | x | x | x | x | x | |||||||||||||||||||||||||||||||||||||
| [61] | x | x | x | x | x | x | x | x | x | x | |||||||||||||||||||||||||||||||||||
| [62] | x | x | x | x | x | x | |||||||||||||||||||||||||||||||||||||||
| [63,64] | x | x | x | x | x | x | x | x | |||||||||||||||||||||||||||||||||||||
| [65,66] | x | x | x | x | x | x | x | x | x | x | x | ||||||||||||||||||||||||||||||||||
| [67] | x | x | x | x | x | x | x | x | x | x | |||||||||||||||||||||||||||||||||||
| [68] | x | x | x | x | x | x | x | x | x | ||||||||||||||||||||||||||||||||||||
| [69] | x | x | x | x | x | x | x | x | |||||||||||||||||||||||||||||||||||||
| [70] | x | x | x | x | x | x | x | ||||||||||||||||||||||||||||||||||||||
| [71] | x | x | x | x | x | x | x | x | x | x | |||||||||||||||||||||||||||||||||||
Table 3.
Detection priority index.
| Detectability | |||
|---|---|---|---|
| Earliness | Low (1) | Medium (2.5) | High (5) |
| Low (1) | 1 (Not covered) | 2.5 | 5 |
| Medium (2) | 2 | 5 (Partially covered) | 10 |
| High (3) | 3 | 7.5 | 15 (Full cover) |
Table 4.
Diagnosis priority index.
| Ability to Diagnose the Maintainable Item(s) | |||
|---|---|---|---|
| Informativeness of Failure Mechanism(s) and Cause(s) Diagnosed | Low (1) | Medium (2.5) | High (5) |
| Low (1) | 1 (Abnormal) | 2.5 | 5 |
| Medium (2) | 2 | 5 | 10 |
| High (3) | 3 | 7.5 | 15 (Full diagnosis of all maintainable items and failure mechanisms) |
Table 5.
Prognosis priority index.
| Precision of Deterioration Prognosis and RUL Prediction | |||
|---|---|---|---|
| Predictive Horizon | Low (1) | Medium (2.5) | High (5) |
| Low (1) | 1 | 2.5 | 5 |
| Medium (2) | 2 | 5 | 10 |
| High (3) | 3 | 7.5 | 15 (Full accuracy and predictive horizon) |
Publisher’s Note: MDPI stays neutral with regard to jurisdictional claims in published maps and institutional affiliations. |
© 2021 by the authors. Licensee MDPI, Basel, Switzerland. This article is an open access article distributed under the terms and conditions of the Creative Commons Attribution (CC BY) license (http://creativecommons.org/licenses/by/4.0/).
Share and Cite
MDPI and ACS Style
Nordal, H.; El-Thalji, I. Assessing the Technical Specifications of Predictive Maintenance: A Case Study of Centrifugal Compressor. Appl. Sci. 2021, 11, 1527. https://0-doi-org.brum.beds.ac.uk/10.3390/app11041527
AMA Style
Nordal H, El-Thalji I. Assessing the Technical Specifications of Predictive Maintenance: A Case Study of Centrifugal Compressor. Applied Sciences. 2021; 11(4):1527. https://0-doi-org.brum.beds.ac.uk/10.3390/app11041527
Chicago/Turabian StyleNordal, Helge, and Idriss El-Thalji. 2021. "Assessing the Technical Specifications of Predictive Maintenance: A Case Study of Centrifugal Compressor" Applied Sciences 11, no. 4: 1527. https://0-doi-org.brum.beds.ac.uk/10.3390/app11041527
Note that from the first issue of 2016, this journal uses article numbers instead of page numbers. See further details here.