Article

Life Cycle Energy Consumption and Carbon Dioxide Emissions of Agricultural Residue Feedstock for Bioenergy

1
Department of Tractors and Agricultural Machines, Operating and Maintenance, Mykolayiv National Agrarian University, 54020 Mykolaiv, Ukraine
2
Institute of Environmental Engineering and Biotechnology, University of Opole, 45-040 Opole, Poland
3
Department of Information System and Technology, Poltava State Agrarian Academy, 36003 Poltava, Ukraine
4
Faculty of Management, Czestochowa University of Technology, 42-201 Czestochowa, Poland
5
Department of Technology, Faculty of Natural Sciences, Matej Bel University, 974 01 Banská Bystrica, Slovakia
*
Author to whom correspondence should be addressed.
Submission received: 3 February 2021 / Revised: 18 February 2021 / Accepted: 19 February 2021 / Published: 24 February 2021

Abstract

:
The depletion of fossil fuels and climate change concerns are drivers for the development and expansion of bioenergy. Promoting biomass is vital to move civilization toward a low-carbon economy. To meet European Union targets, it is required to increase the use of agricultural residues (including straw) for power generation. Using agricultural residues without accounting for their energy consumed and carbon dioxide emissions distorts the energy and environmental balance, and their analysis is the purpose of this study. In this paper, a life cycle analysis method is applied. The allocation of carbon dioxide emissions and energy inputs in the crop production by allocating between a product (grain) and a byproduct (straw) is modeled. Selected crop yield and the residue-to-crop ratio impact on the above indicators are investigated. We reveal that straw formation can consume between 30% and 70% of the total energy inputs and, therefore, emits relative carbon dioxide emissions. For cereal crops, this energy can be up to 40% of the lower heating value of straw. Energy and environmental indicators of a straw return-to-field technology and straw power generation systems are examined.

1. Introduction

Since the Industrial Revolution, the world economy has developed on fossil fuel consumption [1]. Our modern civilization relies heavily on fossil fuels (their annual consumption is around 82% of the primary energy consumption) [2]. Their combustion emits greenhouse gasses are causing an increase in the average temperature in the atmosphere. However, extending a prosperous civilization requires energy consumption [3].
Climate changes are worse than expected earlier [4]. In 2017, human-induced warming exceeded 1 °C above the pre-industrial level. The Paris Agreement of 2015 was aimed to achieve a balance between anthropogenic emissions and the removals of these gasses. The above agreement supports efforts to limit the temperature increase to below 1.5 °C [5]. To meet this ambition, it is necessary to reduce carbon dioxide emissions from the burning of fossil fuels using large-scale renewable energy supply systems. This direction corresponds to the UN’s Sustainable Development Goal 7: ”Ensure access to affordable, reliable, sustainable and modern energy for all” [6].
A primary purpose of the UN climate policy is to hold the anthropogenic global warming to below 2 °C. The power generation sector emits at least 30% of the total greenhouse gas emissions [7]. In 2018, the European Commission put forward an initiative to achieve net-zero emissions by 2050 [8]. The Commission called for studying the sustainability of biomass power supply systems. Use of agricultural residues is one of the solutions to this problem.
Bioeconomy strategies have been developed by a number of countries [9]. This concept is a spotlight of numerous researches [10]. Currently, the 100% renewable energy concept is accepted by a number of countries such as Sweden, Denmark, Bangladesh, Vietnam, Hawaii in the United States, etc. [11,12]. Hansen et al. [11] analyzed the status and perspective on 100% renewable energy systems.
Many countries have approved political phase-out decisions regarding nuclear and coal-fired plants [13,14,15]. An alternative to these energy resources is renewable energy biomass. This enables the expansion of renewable power generation.
Since 2009, bioenergy has been promoted by the European Union (EU) as a low-carbon source [16]. The EU strategy is aimed at increasing renewable energy consumption and the reduction in the greenhouse gas emissions [17,18]. Biomass consumption for heat and power generation is increasing [19]. Agricultural residues enable some of this growth [20].
Lehtveer and Fridahl applied a dynamic optimization model to analyze the role of biomass feedstock in the European power generation system in the context of emissions targets for 2050 [21].
The large-scale application of wind and solar power plants has resulted in a number of challenges such as power quality, power balance, flow, stability, etc. [22]. These technologies are variable in the short and long terms. In power supply systems, biomass-based power plants could be used to complement wind and solar power plants and to improve the power stability situation [23].
Agricultural residues are sources of bioenergy worldwide because of their renewability and carbon neutrality. They can be used to generate electricity (direct burning) [20,24,25,26], biogas production [27,28], for conversion to bioethanol [29], and to produce solid fuels [30]. The use of agricultural crop residues has environmental benefits compared with fossil fuels [31,32,33,34]. The use of straw as a source of bioenergy complies with the renewable energy directive of the EU for the period 2021–2030 [35]. Straw is a byproduct of cereal and other crops. Off-field straw could be converted into energy resources such as biogas, bioethanol, heat, and electricity. A detailed understanding of the straw production system is essential to the proper evaluation of energy and environmental indicators [36].
Life cycle energy consumption and carbon dioxide emissions are currently critical information for the development of appropriate energy policy [37,38]. Currently, greenhouse gas emissions are drawing significant attention [39,40]. The energy and environmental indicators of power generation are highly dependent on fuel production and its pathway. A life cycle analysis should cover all upstream stages: from crop cultivation (energy resource extraction) to use. Energy and environmental assessment considers all kind of energy resources such as fuels, electricity, and energy used to produce fertilizers, herbicides, other chemicals, and machinery [41,42].
Energy inputs and the corresponding carbon dioxide emissions for wood and wheat straw productions were studied for conditions in Canada [43]. In this report, the total carbon footprint for straw was calculated by the proportion of straw yield to overall biomass yield (grain and straw). Mishra et al. [44] used the proportional yield of wheat straw to determine the total energy inputs for the production of straw.
Nguyen et al. [45] considered the following system boundary: the straw is collected by machines (a roller baler, self-propelled balers, and self-propelled gathering machines). In this study, direct energy (diesel fuel consumed by machines) and indirect energy (manufacturing and maintenance of the machines) were taken into account. This method provides objective information from the moment the harvest begins. However, it does not consider the process of growing a crop.
Said et al. [46] analyzed a straw-to-energy chain. The chain comprised the following stages: straw collection, transportation, and energy generation. Energy inputs and carbon dioxide emissions were studied. The energy consumption included direct and indirect energy consumption associated with the straw collection and transportation [24,47]. They reported that the energy consumption of straw collection ranged between 1.73 and 2.52 MJ/kg [46]. Shang et al. [48] used the same methodology as Said et al. [46]. However, a product (grain) and a byproduct (straw) have different energy equivalents. This means that their formation needs different energy inputs and, therefore, the mass (yield) indicator does not provide an objective picture of the energy consumption for the production of straw and the carbon dioxide emissions.
In some research, the energy and greenhouse gas emissions analysis was based on organic feedstock transportation [49,50,51]. A number of researchers such as Migo-Sumagang et al. [52], Nguyen et al. [53], Shafie et al. [24], etc., used the following method: crop production costs are allocated between a product (grain) and a byproduct (straw) in terms of economic value. The allocation factor is applied in the crop production stage and calculated by the formula [52,53,54,55]
A F = Y s S p r Y s S p r + Y g G p r
where Yg is the yield of grain, kg/ha; Spr is the price of straw, EUR/kg; Ys is the yield of straw, kg/ha; Gpr is the price of grain, EUR/kg.
Then the energy inputs and the greenhouse gas emissions in the total crop production are multiplied with the allocation factor of straw. There are three primary types of allocation: mass, energy, and economic [54]. Here, there are three methods used to find the embodied energy and greenhouse gas emissions of straw:
  • taking into account only the collection and transportation of straw (no cultivation stage);
  • the mass allocation (the proportion of straw yield to overall biomass yield);
  • the economic allocation (the proportion of straw costs to the overall costs of a product and a byproduct).
In our opinion, for biomass-based power generation projects, the energy and environmental indicators must be analyzed. Therefore, the allocation should be performed by the use of energy allocation. However, this type of allocation has not been sufficiently studied.
The purpose of this study was to develop a systematic and effective method for evaluating the embodied energy and the greenhouse gas emissions in straw production that can be used as a scientific basis for future strategies and policy development. The objectives of this research were:
  • to develop a mathematical model for finding the allocation of the total energy inputs and, therefore, the carbon dioxide emissions between grain and straw;
  • to determine the energy inputs into the straw formation;
  • to compare the mass and energy allocation indicators;
  • to explore the impact of energy and the carbon dioxide emissions associated with straw formation on the power generation indicators such as energy-specific costs and specific carbon dioxide emissions;
  • to compare energy and the carbon footprint indicators for different pathways of straw utilization: power generation and the substitution of mineral fertilizers.
This research is based on previous studies of alternative fuel markets [56,57,58] and agricultural feedstock availability analysis [59,60].

2. Materials and Methods

A systematic literature review was conducted in this study to gather required data from scientific sources. A number of relevant criteria were applied to analyze the information collected.

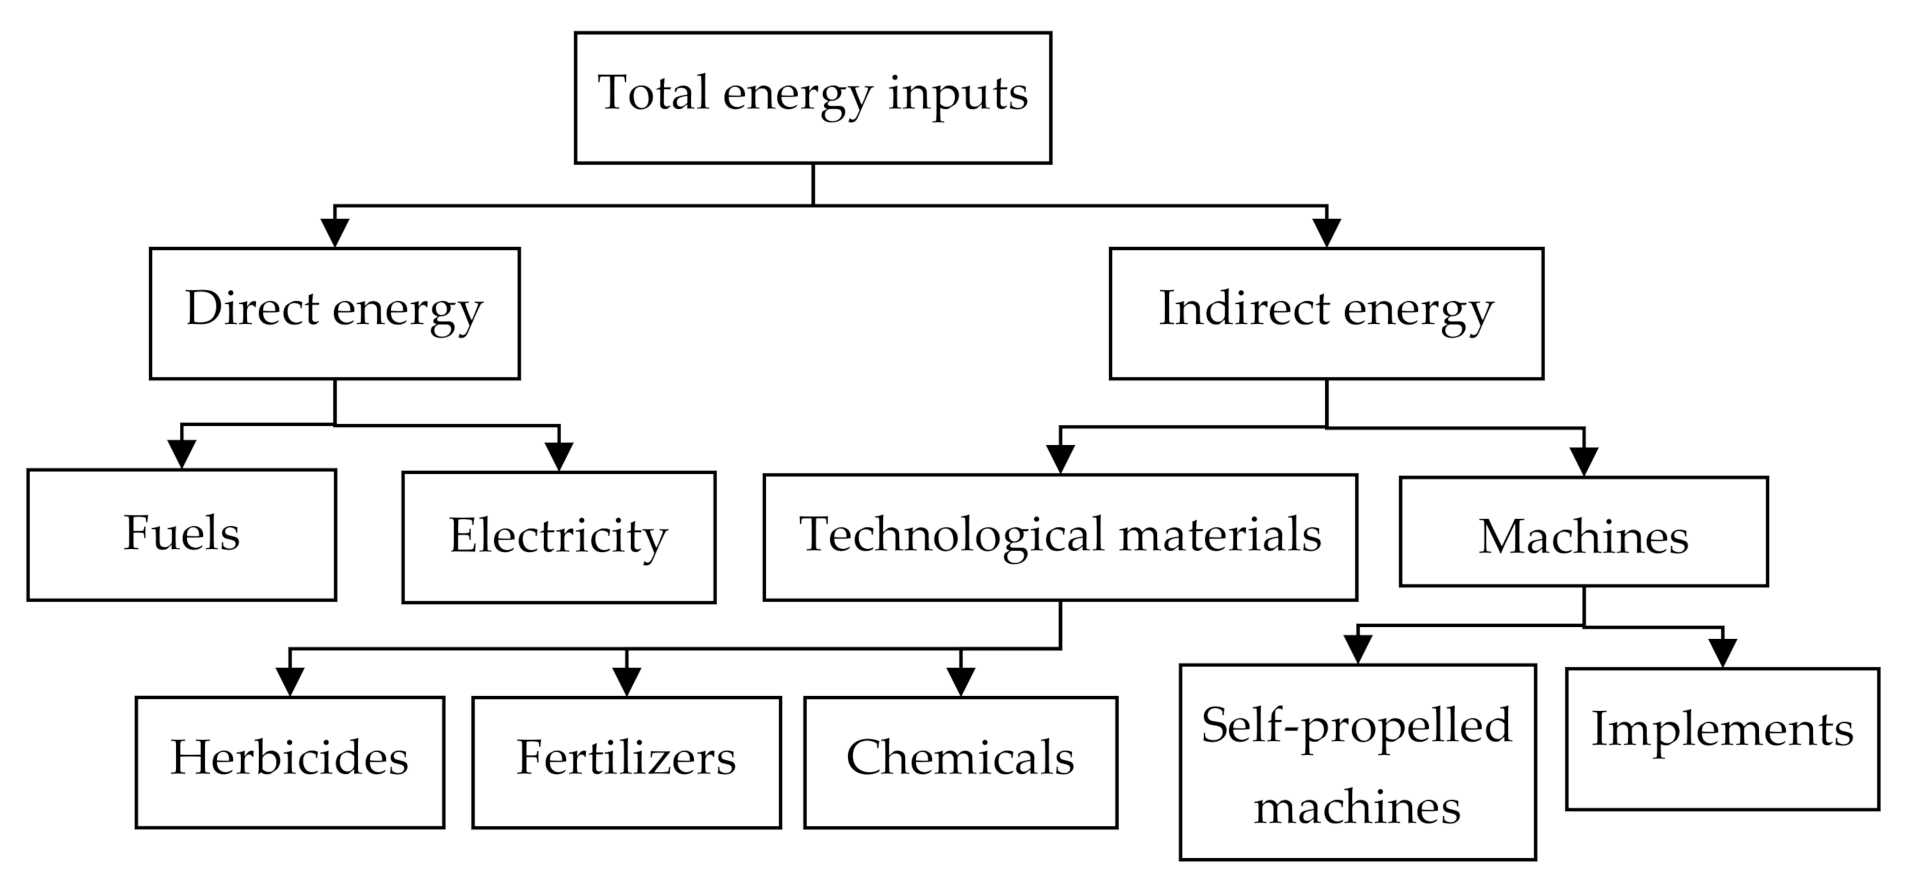
2.1. Embodied Energy

Energy requirements in agricultural production were divided into three groups: direct and indirect (two subgroups) (Figure 1). A direct energy flow included the energy of fuels and the electricity that are used by machines. An indirect energy flow consisted of two subgroups. The first was the energy used in the production processes of fertilizers, herbicides, and other chemicals. The second subgroup was the energy used in the manufacturing processes of farm machinery.
The direct energy is determined as:
D E = i = 1 n B i E E f i + E E e W ,   MJ / ha ,
where Bi is the fuel consumption of the ith type, kg/ha; EEfi is the energy equivalent (embodied energy) of the ith fuel, MJ/kg; W is the electricity consumption, kWh/ha; n is the number of fuels; EEe is the energy equivalent (embodied energy) of electricity, MJ/kWh.
The indirect energy of the first subgroup is equal to:
I D E 1 = j = 1 m M i E E j ,   MJ / ha ,
where Mj is the mass consumption of jth chemical, kg/ha; EEj is the energy equivalent of jth chemical, MJ/kg; m is the number of chemicals.
The manufacturing energy requirements for farm machinery depend on a number of factors such as a certain machinery’s mass, use lifetime, etc., and can be computed by a formula:
I D E 2 = k = 1 l E M M k M M k U L T k O F C k ,   MJ / ha ,
where EEMj is the embodied energy of kth machinery, MJ/kg; MMk is the mass of kth machinery, kg; ULTk is the utilization lifetime of kth machinery, h; OFCk is the operation field capacity of kth machinery, ha/h; l is the number of machinery.
The total energy inputs are:
T E i n p u t = D E + I D E 1 + I D E 2 ,   MJ / ha .
The embodied energy (or energy equivalents) of main fuels, chemicals, and machinery are presented in Table 1. They are used to determine the indirect energy inputs.
The embodied energy of electricity can be presented in different units such as MJ/MJ or MJ/kWh. Consumers usually measure electricity in kWh. However, some sources of information express embodied energy in MJ/MJ. To simplify subsequent calculations, in this study, we converted MJ/MJ to MJ/kWh. For this conversion, we assumed that 1 kWh = 3.6 MJ.

2.2. Energy Output Flow

Energy output flow (EOF) of crop production is the energy generated by a product and a byproduct. For cereal crops, EOF is calculated as the sum of the calorific values of grains and straw:
E O F = Y g L H V g + Y s L H V s ,   MJ / ha ,
where LHVg is the specific calorific value of grain, MJ/kg; LHVs is the lower heating value of straw, MJ/kg.
The yield of straw is calculated based on the grain yield and a residue-to-crop ratio:
Y s = Y g R C R ,   kg / ha ,
where RCR is the residue-to-crop ratio of a certain crop.

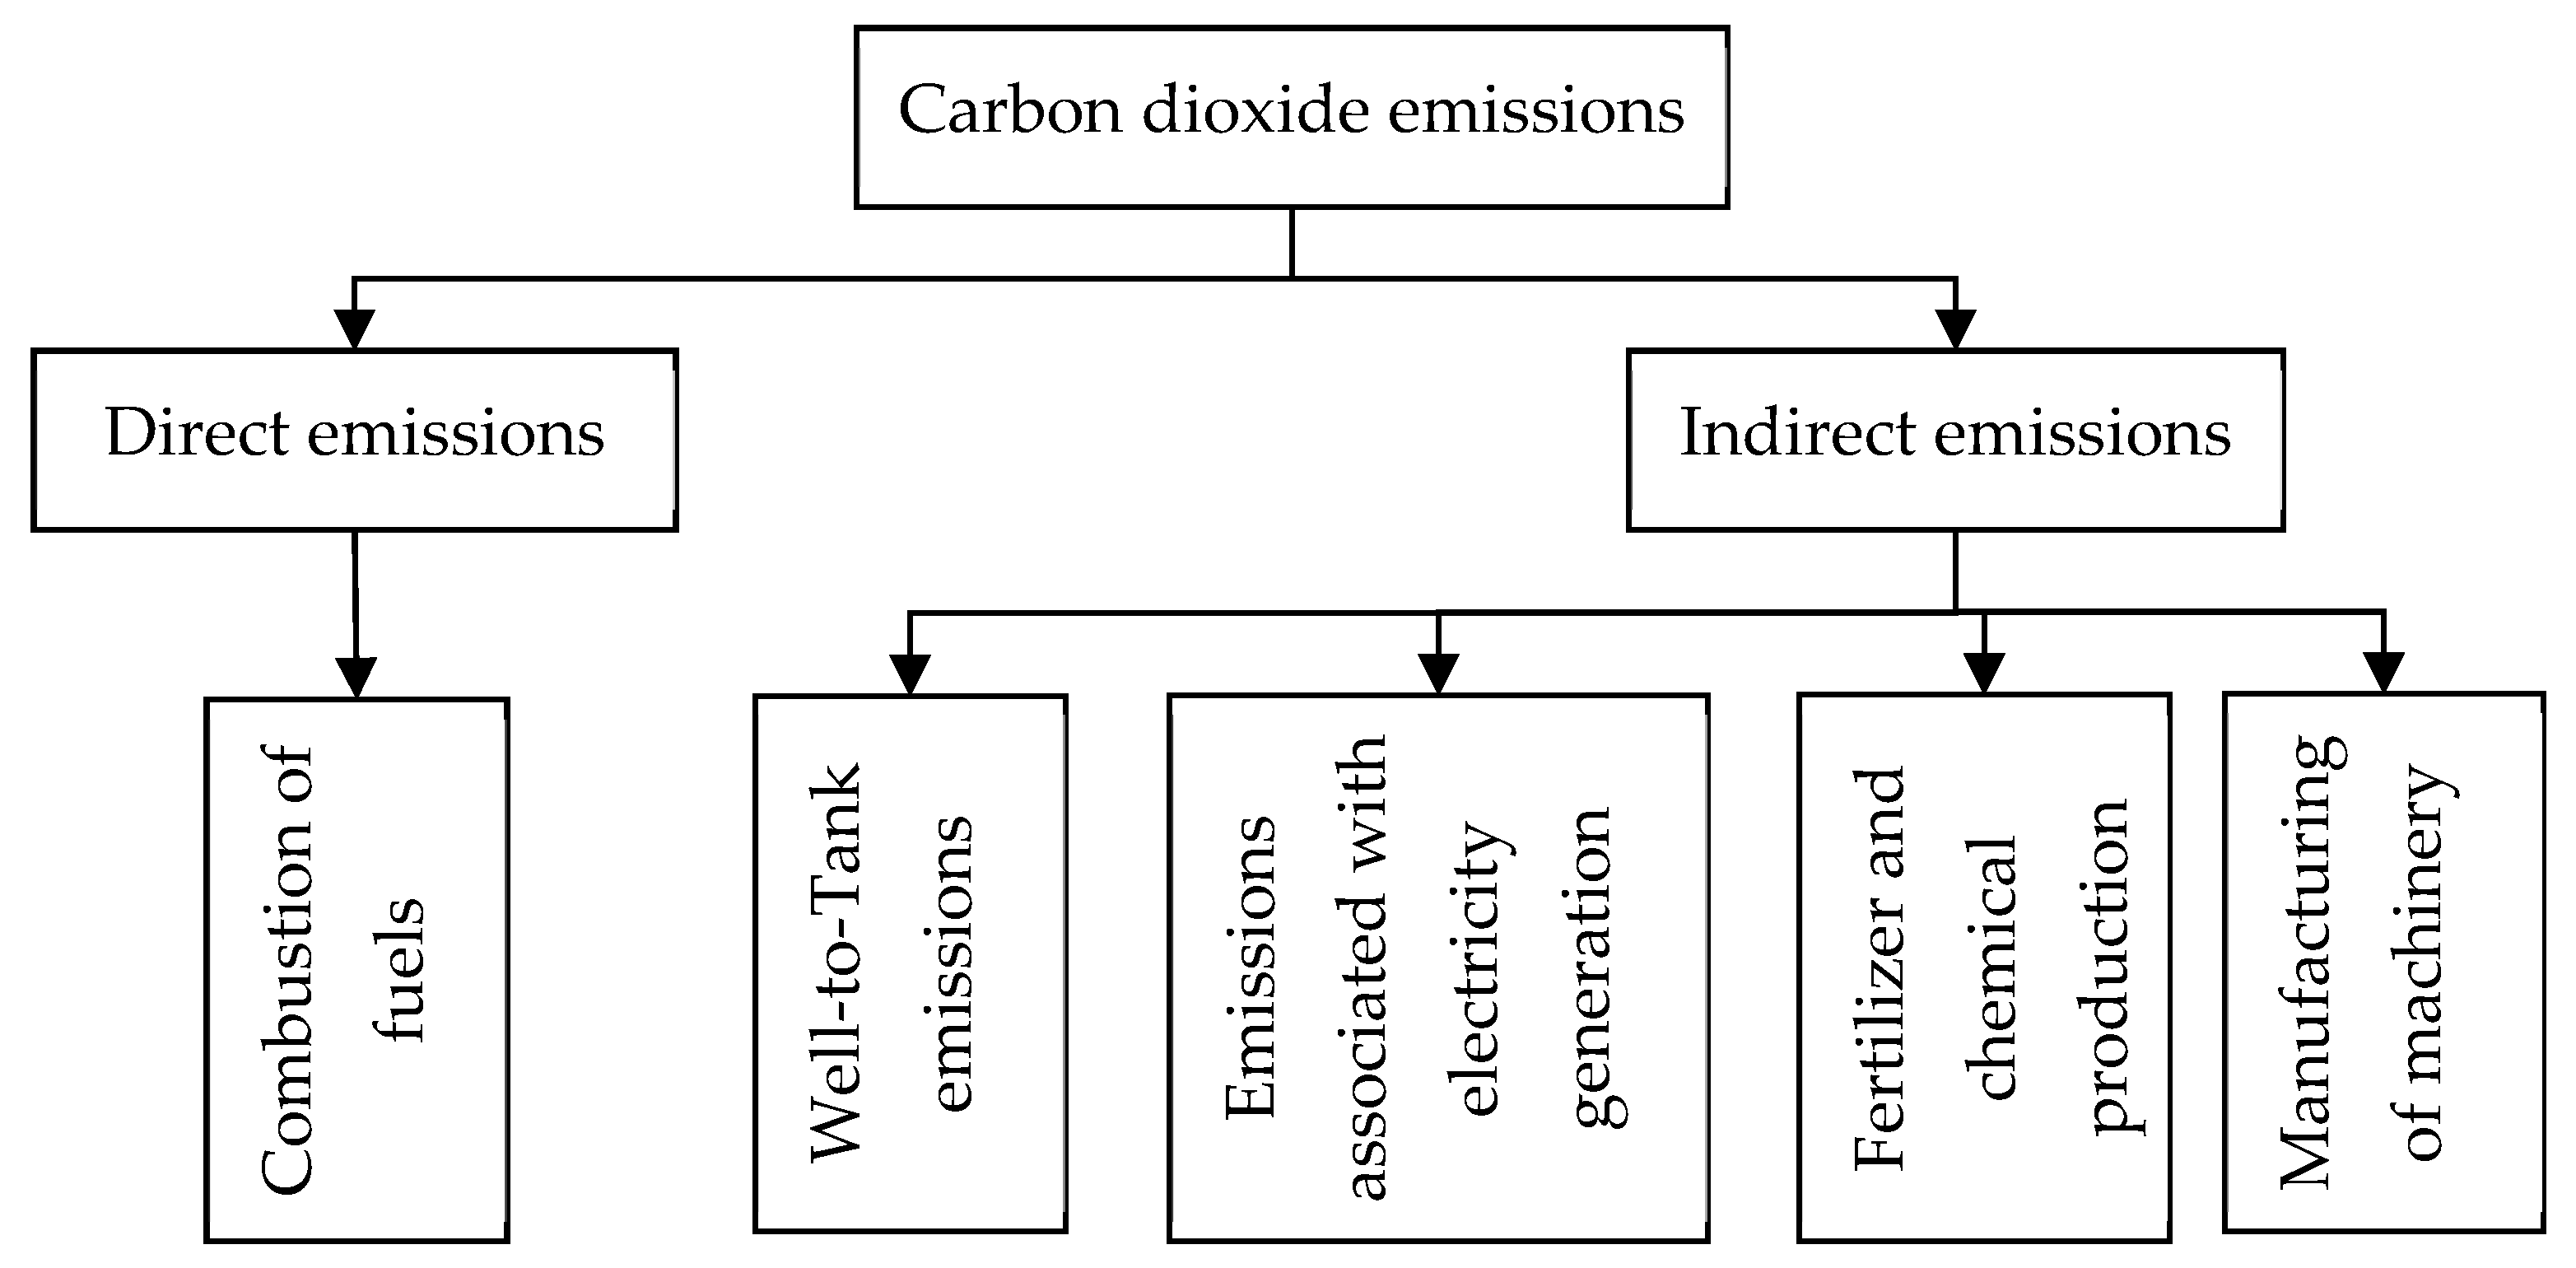
2.3. Carbon Dioxide Emissions

Carbon dioxide emissions occur due to the combustion of fuels, well-to-tank emissions (extraction of raw material, refinery, transportation, etc.), the emissions associated with electricity generation (from fuel production to electricity generation, distribution, and transportation), and the production of machinery, fertilizers, and chemicals (Figure 2).
The carbon emissions caused by fuels are formed by the following components: the fuel consumption per hectare, the carbon content in the vehicle fuel, and the well-to-tank (WTT) emissions of a certain fuel. For standard diesel fuel, WTT-based carbon dioxide emissions vary from 6.7 to 24 g CO2/MJ [67]. This corresponds to the following range: from 0.284 to 1.020 kg CO2/kg. Thereby, well-to-wheel (WTW) emissions caused by the use of diesel fuel is equal to:
W T W = i = 1 n B i C C i 11 3 + W T T i ,   kg / ha ,
where CCi is the carbon content in ith type of fuel, kg/kg; WTTi is the well-to-tank carbon dioxide emissions of ith type of fuel, kg CO2/kg.
The carbon dioxide emissions from electricity generation are determined by the following formula [68,69]:
C D E G = W E F e ,   kg   CO 2 / ha ,
where EFe is the emission factor, kg CO2/kWh.
During the chemical (fertilizer, pesticides, etc.) production process, carbon dioxide is emitted. Its quantity is computed by:
C D F = i = 1 n M F i C D E i ,   kg   CO 2 / ha ,
where MFi is the consumption of ith chemical, kg/ha; CDEi is the carbon dioxide emission during the production process of ith chemical, kg CO2/kg.
The manufacturing and assembly of agricultural machinery result in carbon dioxide emissions. Their specific values are equal to:
C D M = k = 1 l C D M k M M k U L T k O F C k ,   kg   CO 2 / ha ,
where CDMk is the specific carbon dioxide emission during the manufacturing and assembly of the kth machinery, kg CO2/kg.
The total carbon dioxide emissions are:
C D E T = W T W + C D E G + C D F + C D M ,   kg   CO 2 / ha .

3. Results

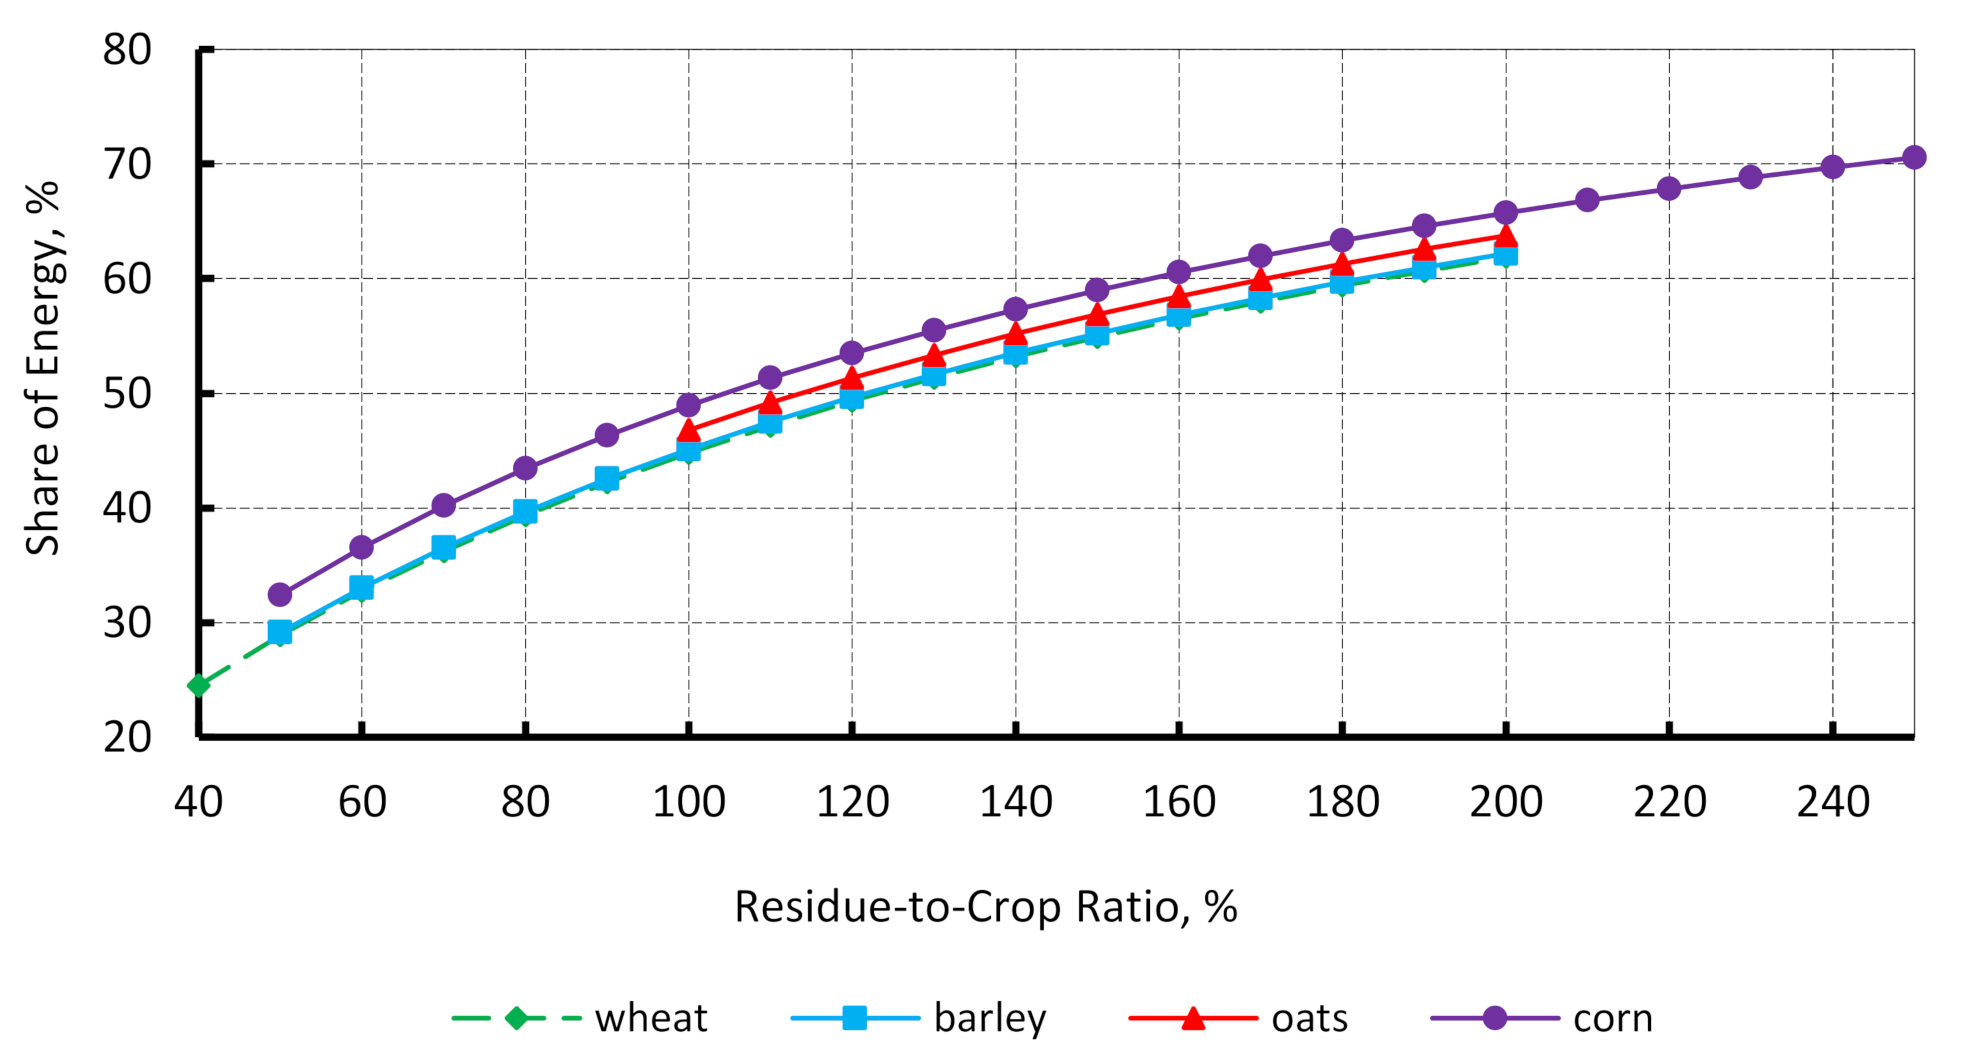
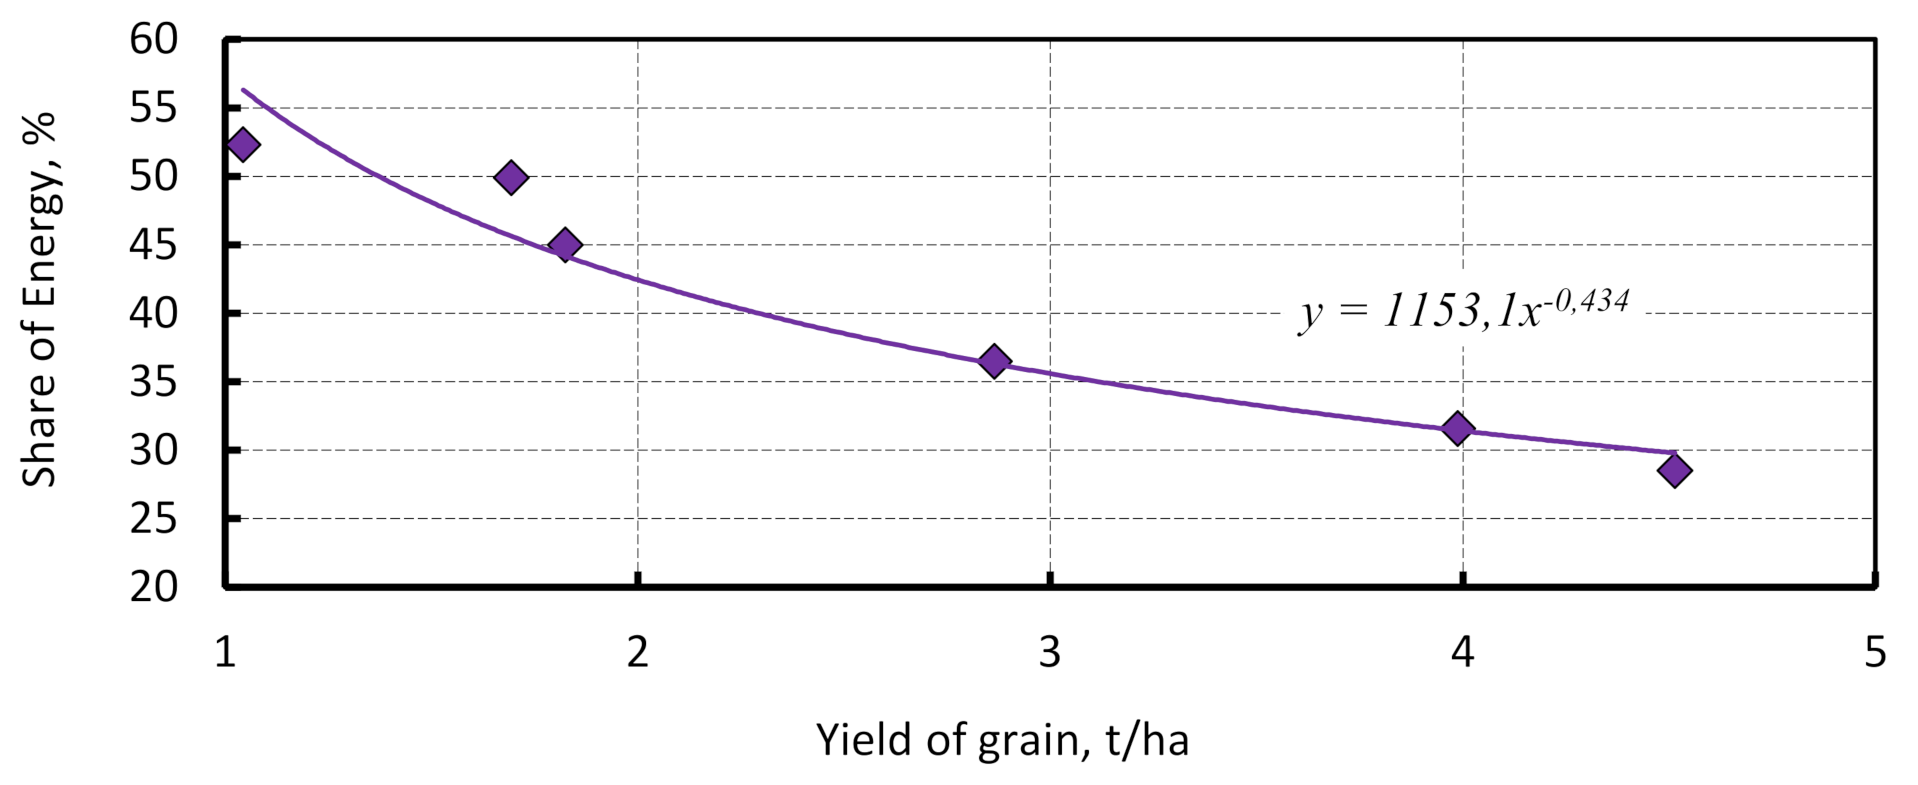
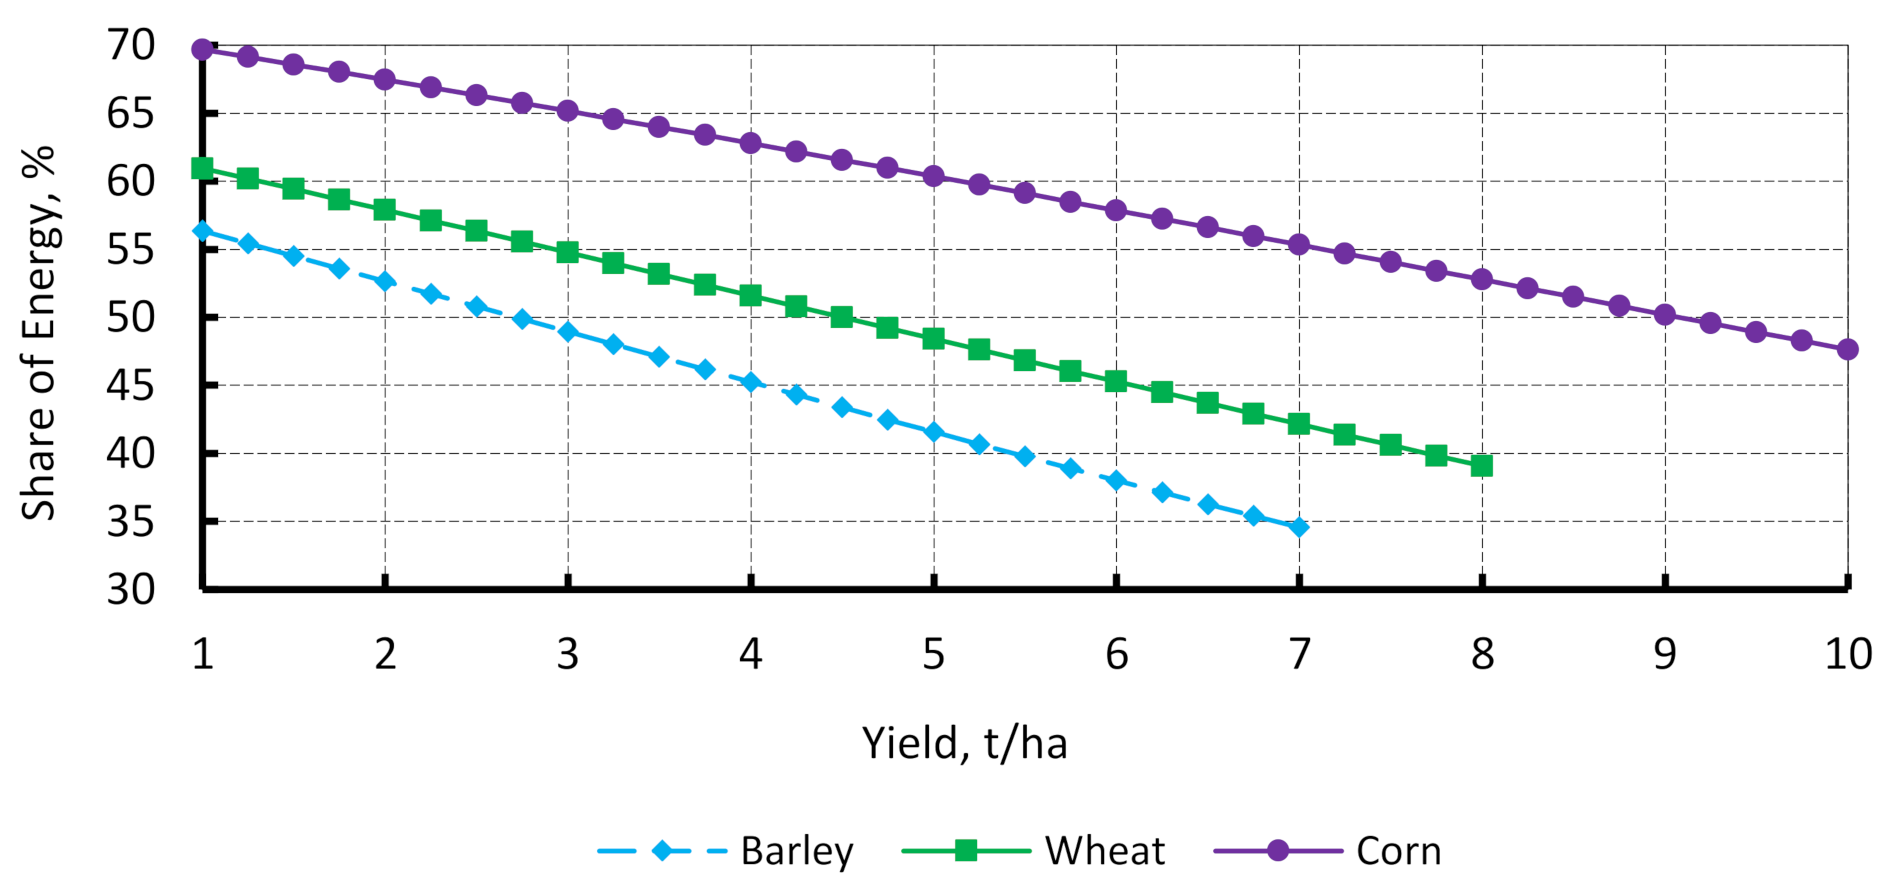
3.1. Allocation of Energy Inputs between Grains and Straw

The input energy creates the harvest, including grains and straw. Therefore, the energy must be allocated between grain and straw formation. We suggest carrying out this division, considering the energy value of each part of the harvest obtained. The total energy output is formed by the product (grain) and a by-product (straw):
E o u t = E G o u t + E S o u t ,   MJ / ha ,
where EGout is the energy content of grain, MJ/ha; ESout is the energy content of straw, MJ/ha.
The straw formation requires the following amount of energy:
E S F = E S o u t E o u t T E i n p u t ,   MJ / ha .
The share of energy, which is used for the straw formation, is computed as
S R = E S o u t E S o u t + E G o u t = Y g R C R L H V s Y g R C R L H V s + Y g L H V g .
After the transformation of Equation (15), we obtained the following expression:
S R = R C R L H V s R C R L H V s + L H V g ,  
or:
S R = R C R R C R + L H V g L H V s .
A residue-to-crop ratio is not constant, and it depends on the yield [70,71]:
R C R = a exp b Y g ,  
where a and b are the parameters.
Scarlat et al. [71] suggested an exponential relationship between the residue-to-crop ratio and the crop yield. Parameters a and b were estimated on the basis of data published by researchers [71,72,73].
If we use Equation (18), then the share of energy is:
S R = a exp b Y g a exp b Y g + L H V g L H V s .  

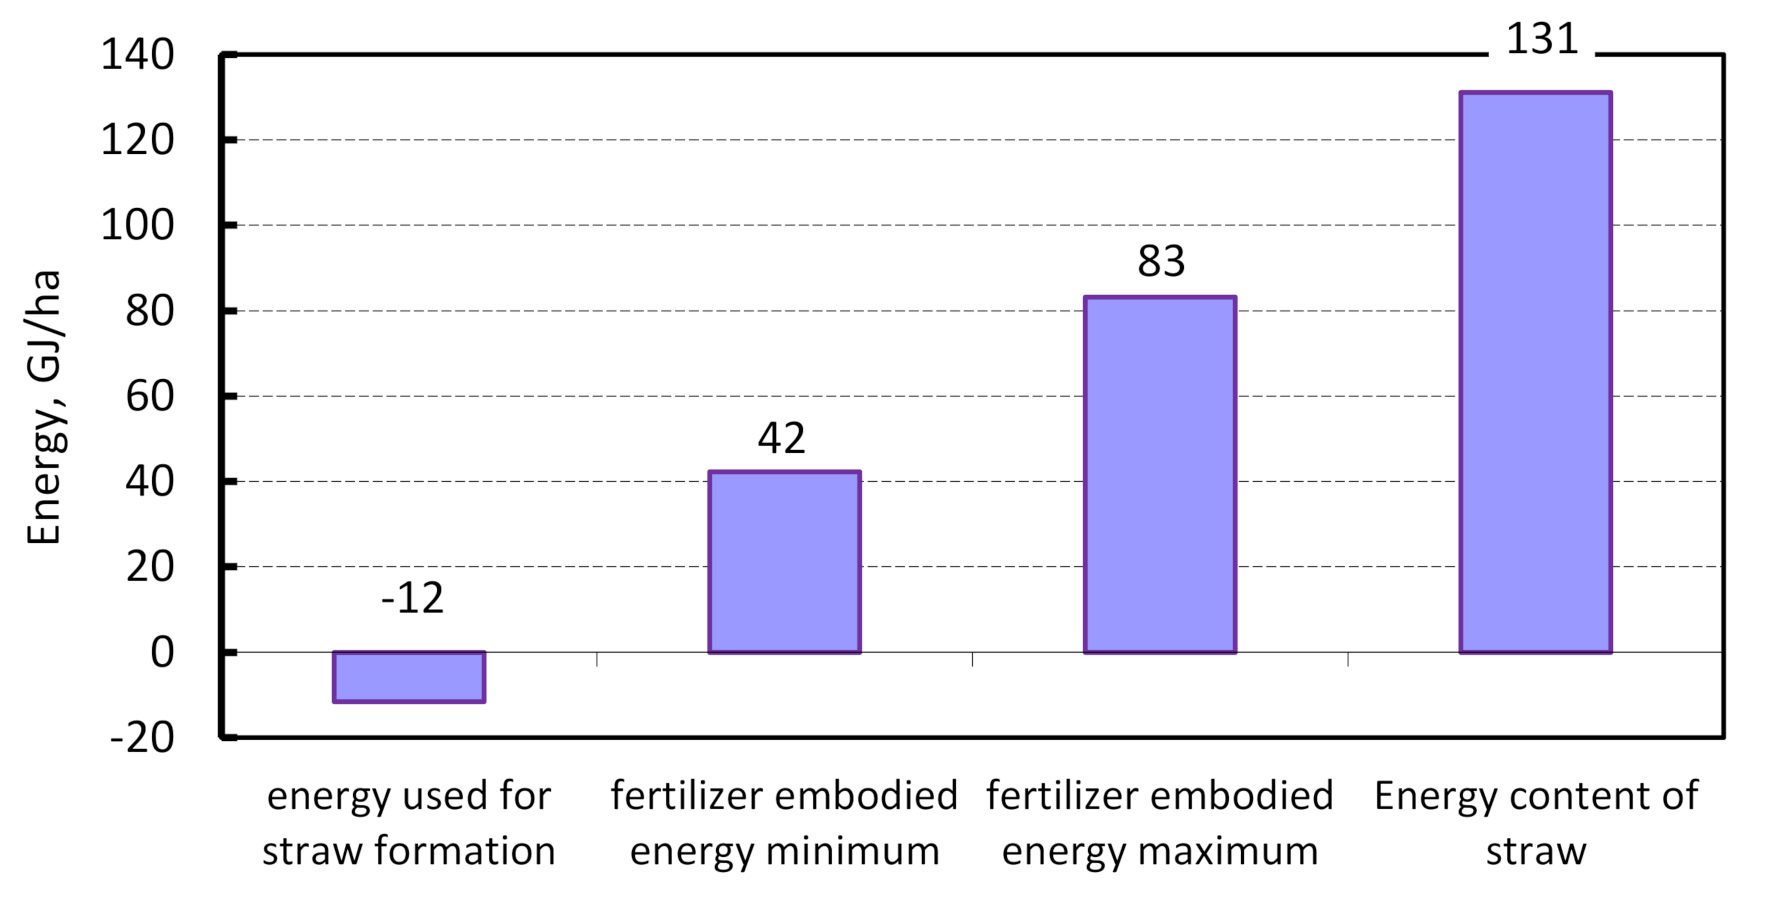
3.2. Energy Input into Straw Formation

The data on the RCRs and the energy parameters per crop type are presented in Table 2 [70,71,74,75].
In this study, the residue-to-crop ratios and the shares of energy used for the straw formation are expressed in percent. The results of our calculations are shown in Figure 3. The shares of energy used for straw formation range from 24% to 70% of the total energy inputs.
The SR indicators for the actual data of wheat production reported in some articles are presented in Figure 4 [76,77,78,79,80]. The increase in yield results in the decrease in the SR.
The impact of crop yield on the SR was studied using Equation (18). RCR functions for wheat, barley, and corn were taken from the results found by Bentsen et al. [70]. Our calculations showed that the share of energy used for straw formation has a significant dependence on the yield and type of crop (Figure 5). Corn has a higher value than other cereal crops.
The energy consumption for straw formation and the energy consumption for straw collection were compared. Nguyen et al. [45] reported that the energy consumption for straw collection ranged from 0.37 to 0.588 MJ per kg of straw. Ou et al. [50] reported about 0.4256 MJ per kg of straw. However, if the energy consumption for straw formation is taken into account, the embodied energy ranges from 1.1 to 6.2 MJ/kg. Therefore, the energy consumption for straw formation may be up to 10-fold the energy consumption for straw collection, and it should be taken into account in an energy analysis of straw use.

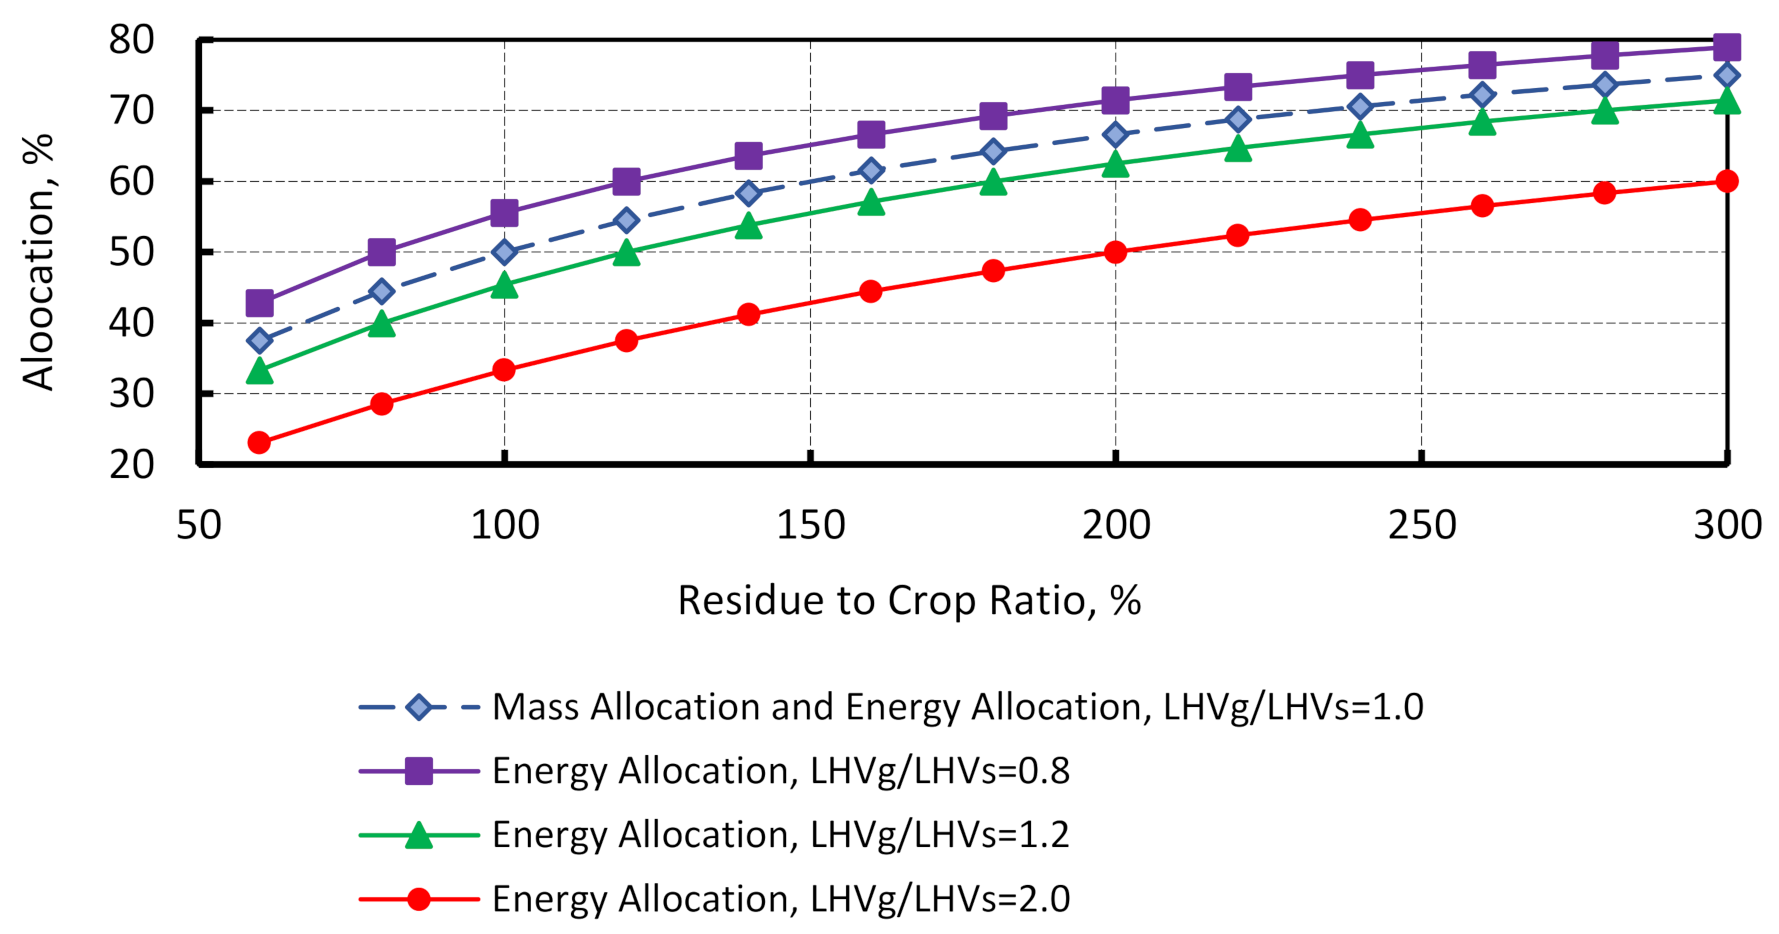
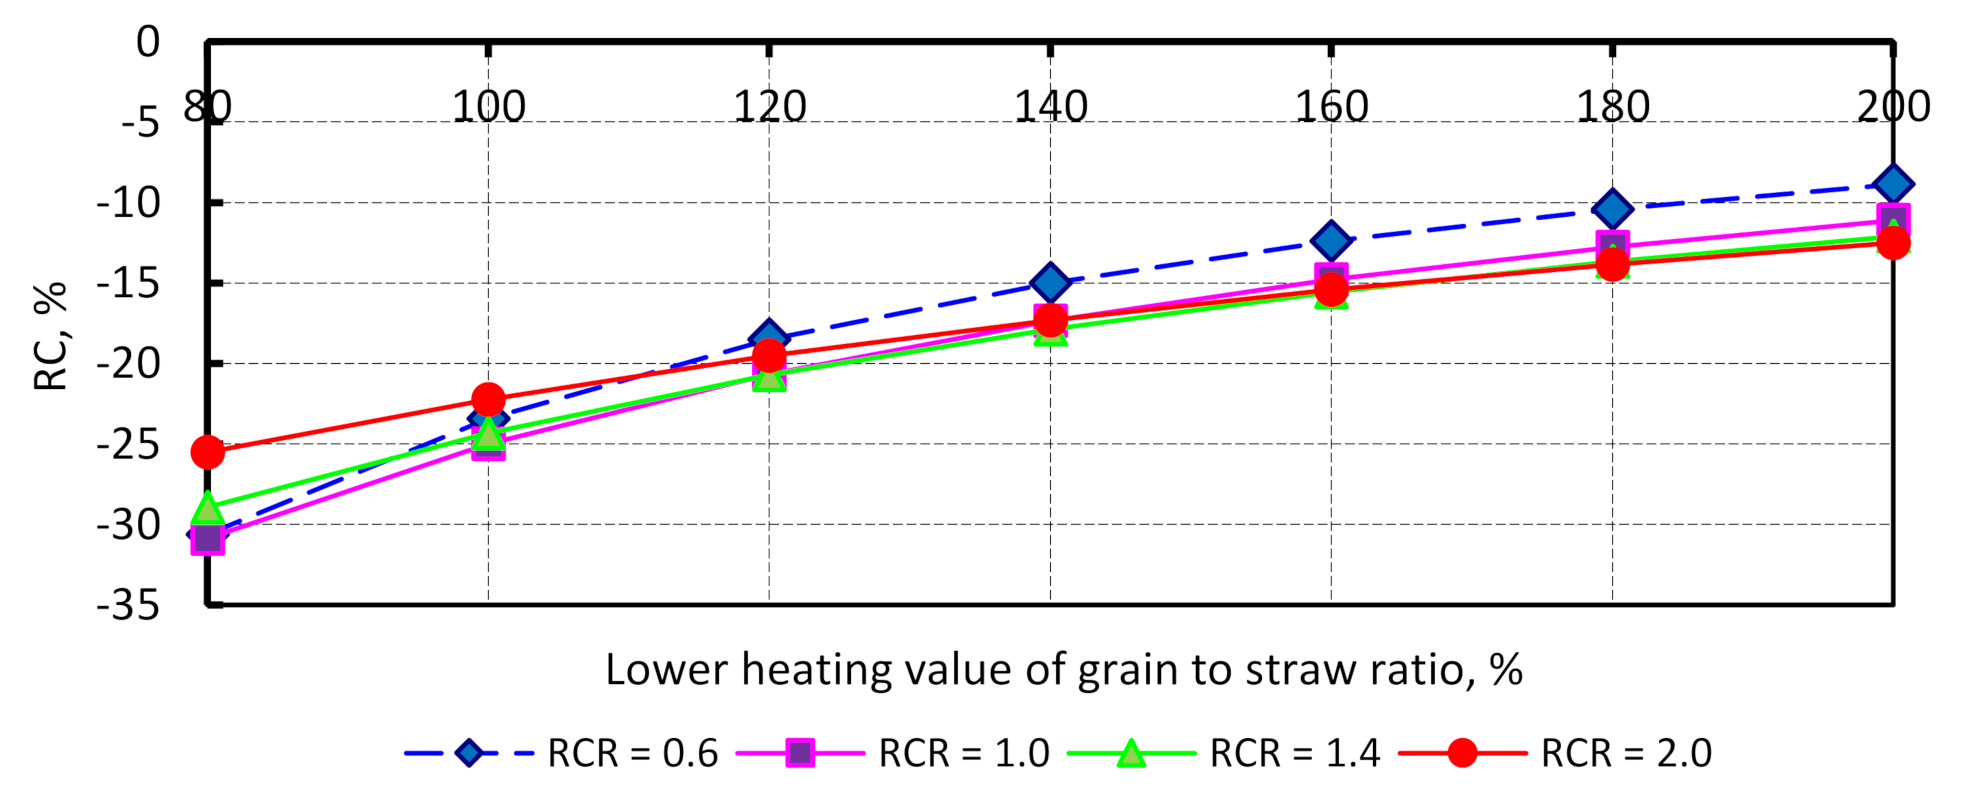
3.3. Comparison of Mass and Energy Allocation Indicators

The mass allocation indicator is calculated by the following formula:
M A = R C R R C R + 1
This expression resembles Equation (17), which is used to determine the energy allocation indicator. The only difference is that the energy allocation indicator takes into account lower heating values of grain and straw. Based on Figure 6, it is apparent that the mass allocation indicator can be considered as a special case of the energy allocation indicator.
We took the derivative of Equation (17) with respect to the lower heating value of the grain-to-straw ratio and found the rate of change:
R C = 100 ( S R ) L H V g L H V s = 100 R C R R C R + L H V g L H V s L H V g L H V s = 100 R C R R C R + L H V g L H V s 2
The results of our calculations are presented in Figure 7. The shape of the graph (Figure 7) depicts that the increase in the lower heating value of the grain-to-straw ratio results in a decrease in the rate of change of the energy allocation indicator.

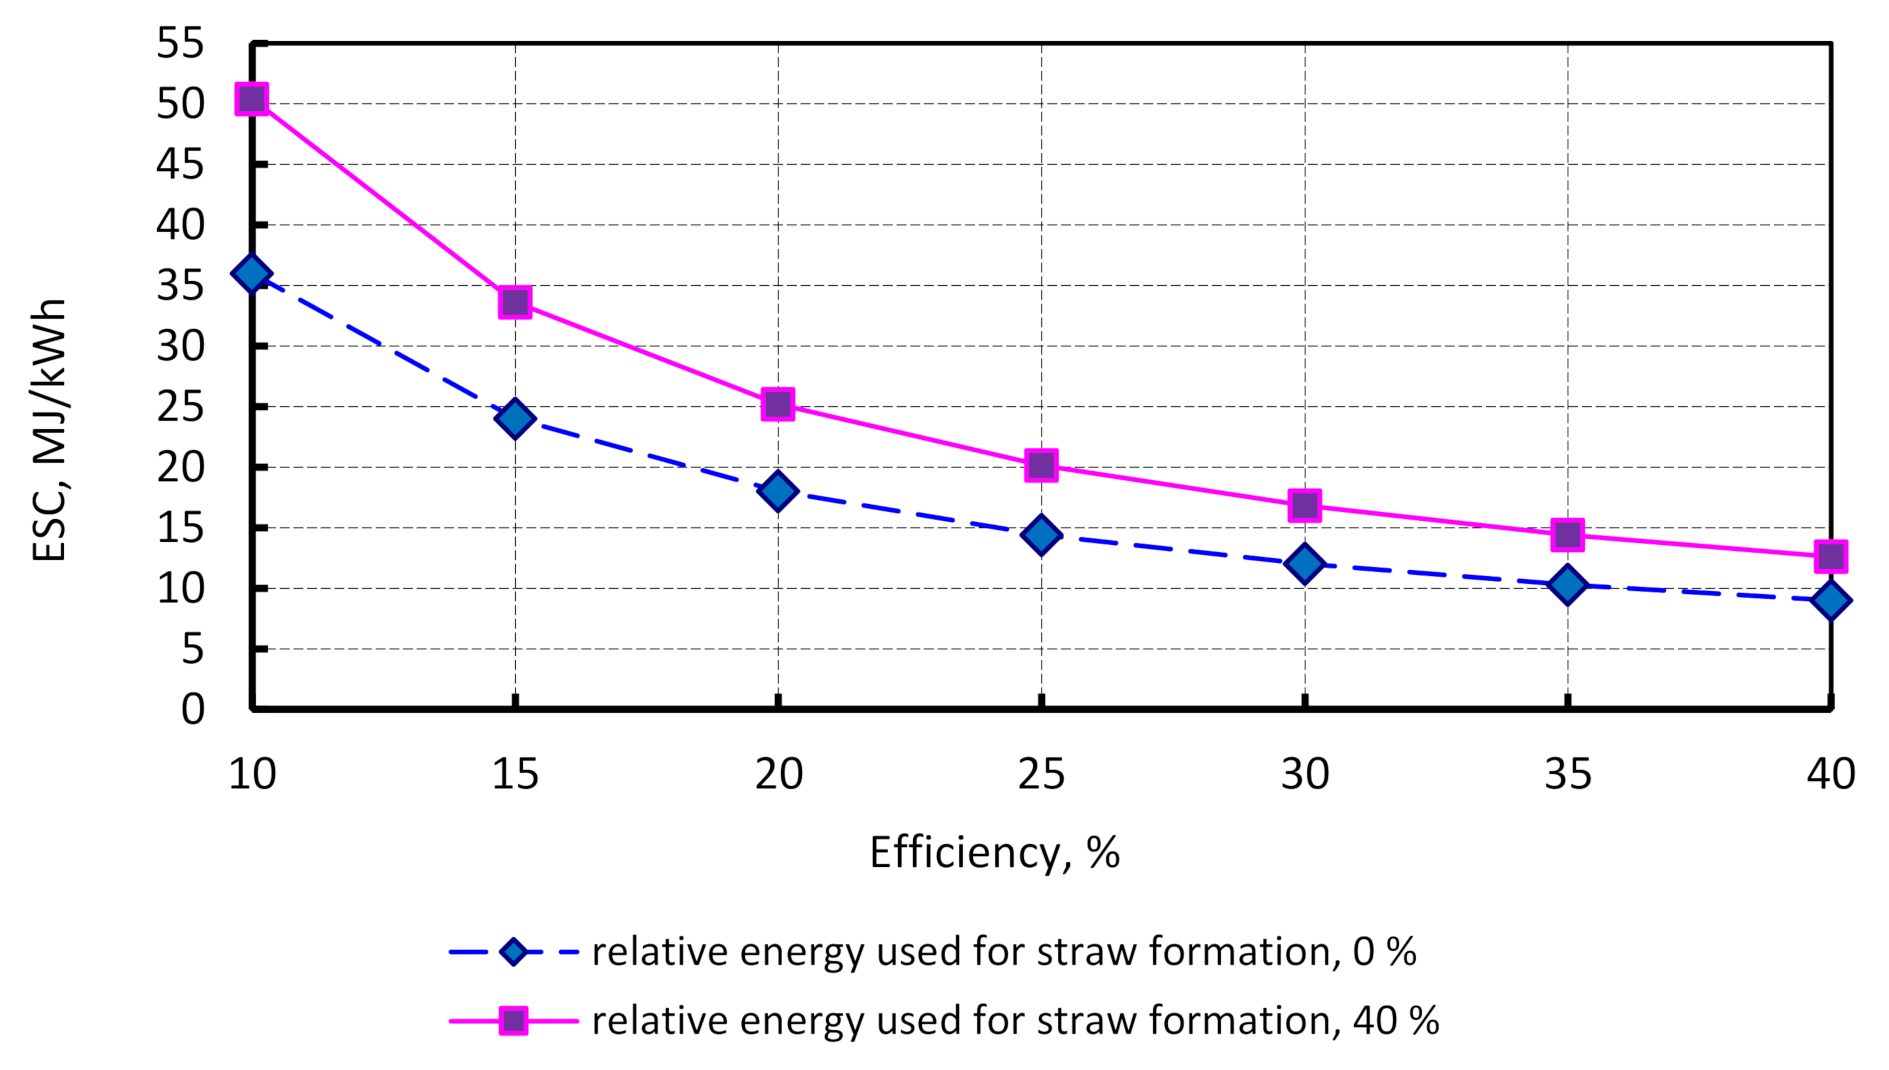
3.4. Power Generation: Energy Specific Costs and Carbon Dioxide Emissions Associated with Straw Formation

The carbon dioxide emissions of straw-fired power generation can be expressed as:
C D E = 3.6 η e L H V s E F s ,   kg   CO 2 / kWh ,
where ηe is the efficiency of power generation; EFs is the carbon dioxide emission factor associated with straw formation, kg CO2/kg.
And the saving of carbon dioxide emissions compared with a fossil fuel power plant can be expressed as:
S C D E = E F c f 3.6 η e L H V s E F s ,   kg   CO 2 / kWh ,
where EFcf is the carbon dioxide emissions factor (fossil fuel), kg CO2/kWh.
The carbon dioxide emissions factor associated with straw formation was calculated for conventional wheat production technology used in Ukraine. The following initial data were used: the yield of grain—4110 kg/ha; the yield of straw—5138 kg/ha; the total carbon dioxide emissions—1747.9 kg CO2/ha; the share of energy that is used for straw formation—0.5. Our calculations showed that the carbon dioxide emissions factor associated with straw formation is around 0.17 kg CO2/kg. It results in 0.146 kg carbon dioxide emissions per kWh for a straw-fired power plant.
Energy specific costs (ESC) are the energy-input-to-electricity-production ratio:
E S C = L H V s + Δ H W s ,   MJ / kWh ,
where ΔH is the energy used for straw formation, MJ/kg; Ws is the quantity of electricity generated by one kilogram of straw, kWh/kg.
One kilogram of straw generates:
W s = η e L H V s 3.6 ,   kWh / kg .
Then, the required energy specific costs are:
E S C = 3.6 L H V s + Δ H η e L H V s = 3.6 η e 1 + Δ H L H V s ,   MJ / kWh .
Energy specific costs were calculated for the following conditions:
  • The efficiency ranges from 10% to 40%.
  • The relative energy used for straw formation (100 ΔH/LHVs, %) has two meanings: 0% (energy for straw formation is not taken into account) and 40% (maximum possible value for biomass direct-fired power plants).
Figure 8 presents the results of our computation. This figure depicts that the increase in the efficiency results in a decrease in the influence of the embodied energy of straw on the absolute energy specific costs.

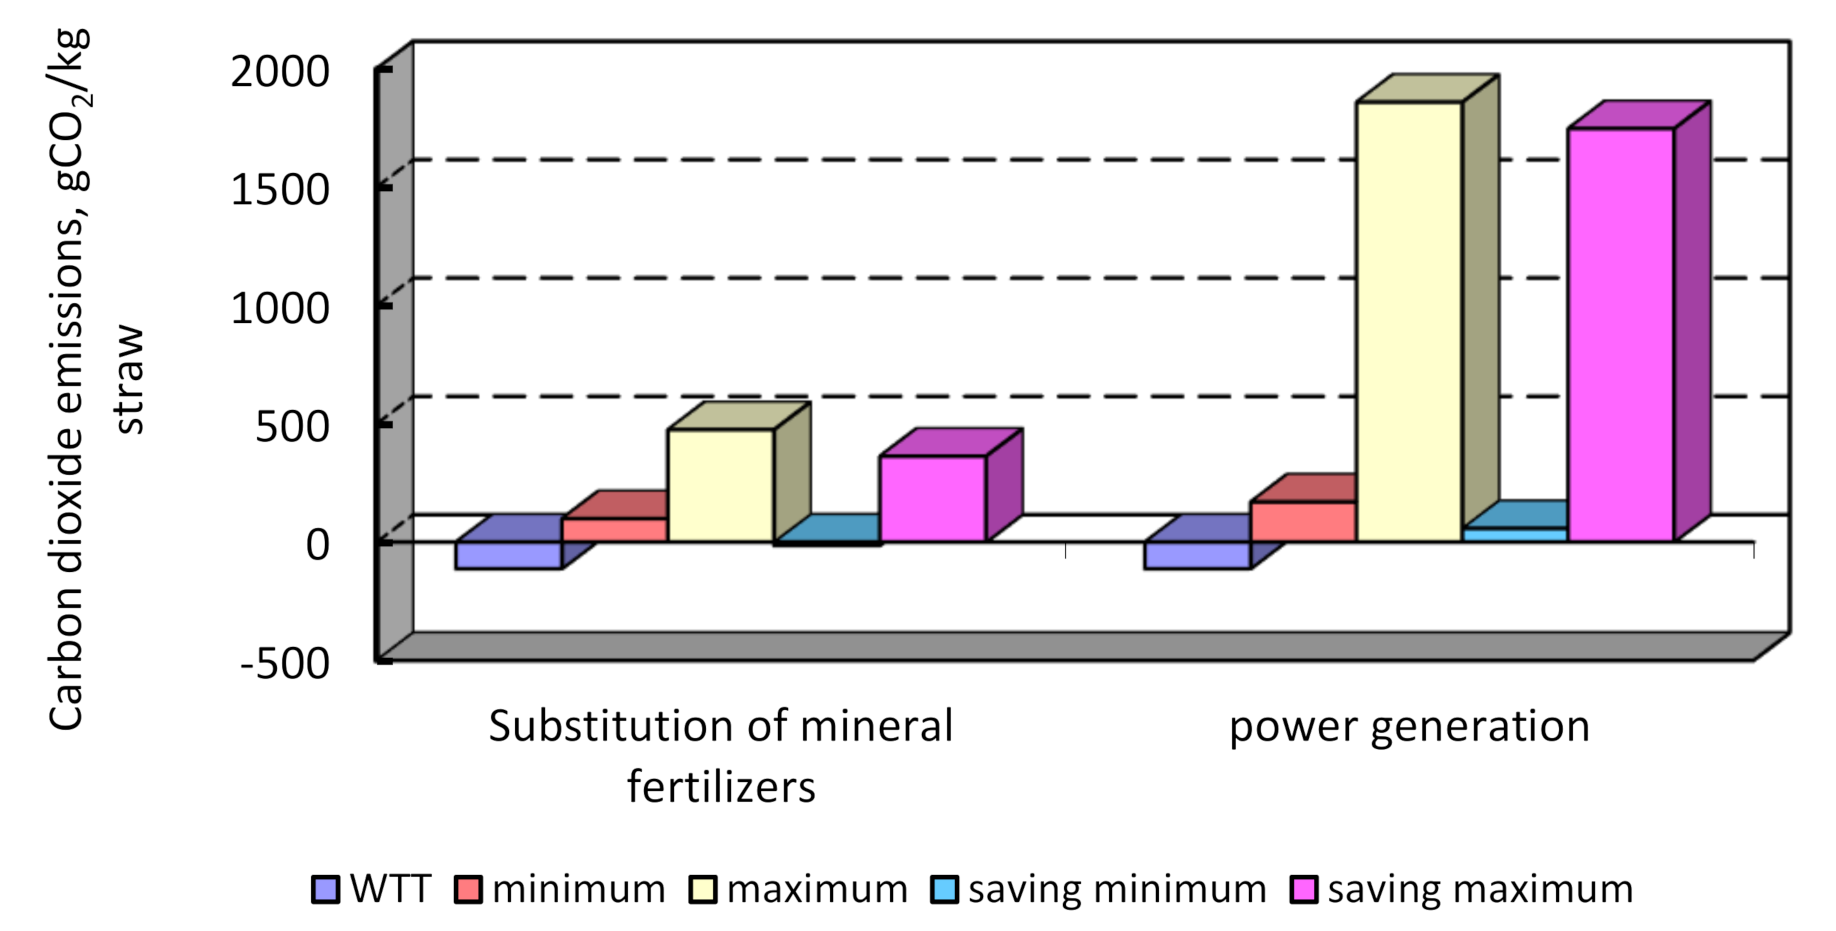
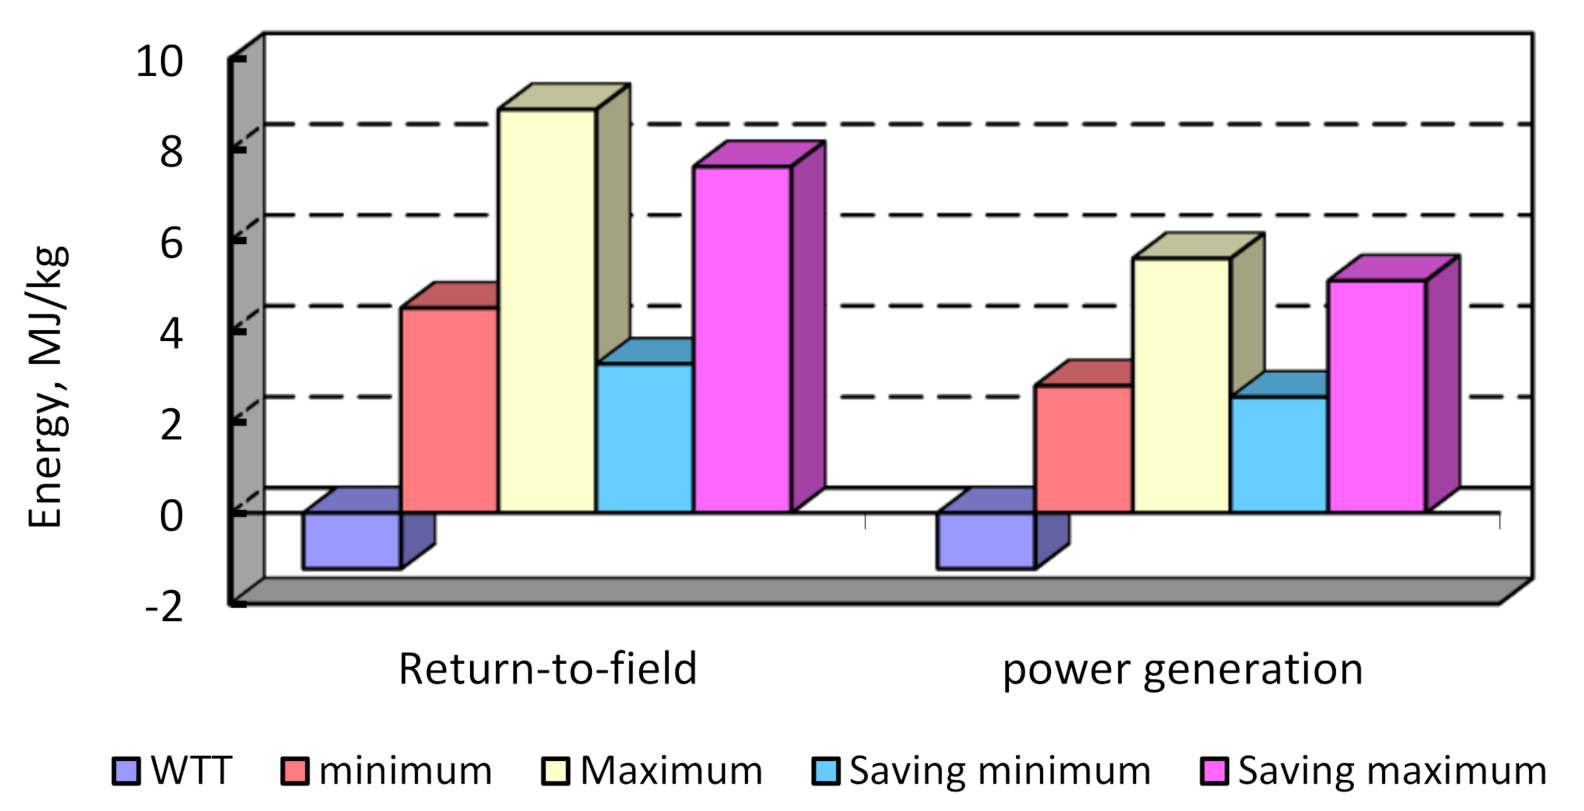
3.5. Power Generation or Biofertilizer: Energy and Carbon Dioxide Footprint Comparison

There are some forms of straw use, such as straw-to-energy and straw return-to-field. Liu et al. [51] studied the benefits of straw return-to-field. Straw retained in arable lands can increase organic nitrogen, phosphates, and potassium, which enhance crop yield [81,82,83]. Researchers found a number of disadvantages of straw return-to-field technology, such as nitrous emissions, methane emissions, and the possible reduction in crop yield (in the case of high levels of straw retained) [84,85,86,87,88].
In this study, we evaluated the environmental and energy indicators of straw use as biofertilizers compared with power generation.
Crop residues can be used for power generation and use as fertilizers. The use of agricultural residues as a substitute for mineral fertilizers can reduce the energy consumption and carbon dioxide emissions of agricultural practice. That is why the comparison of different pathways for crop residues is of scientific and practical interest.
The use of crop residues as fertilizers saves the following amount of energy:
F E S = i = 1 n N G i E E q i 100 Δ H ,   MJ / kg ,
where NGi is the content of the ith nutrient component in a crop residue, %; EEqi is the energy equivalent of the ith nutrient component, MJ/kg.
An organic fertilizer produced from crop residues can reduce carbon dioxide emissions caused by the production process of mineral fertilizers as such:
C D E F S = i = 1 n N G i C D F P i 100 C D E T S R Y s ,   kgCO 2 / kg ,
where CDFPi is the carbon dioxide emissions caused by the production of the ith nutrient component in a mineral fertilizer, kg CO2/kg.
The carbon dioxide emissions and energy used by the production process of mineral fertilizers are presented in Table 3 [62,63,64].
As an example, corn stover was considered. Corn stover has the following composition of nutrient components: nitrogen—5.95; phosphorus—0.56; potassium—7.91 g/kg [89]. In our study, we used the data reported by Kim et al. [90,91]. The energy used for straw formation is around 8.81% of the total energy potential of straw (Figure 9). The embodied energy of mineral fertilizers substituted by straw is at least four-fold compared with the energy used for straw formation. Therefore, the use of straw for energy generation is more energy-efficient.
Carbon dioxide emissions were analyzed too. The total carbon dioxide emissions of corn production are around 1895 kg CO2/ha. The energy associated with straw formation is 1048 kg CO2/ha of straw. Therefore, WTT is equal to 0.112 kg CO2/kg. In our calculation, the following emission factor (power generation) was assumed: average—0.578; minimum—0.146; maximum—1.593 kg CO2/kWh [90]. Our study revealed that the use of straw for power generation saves more carbon dioxide emissions compared with the straw return-to-field technology (Figure 10).
Energy saving was analyzed too. The straw return-to-field technology can reduce primary energy consumption in the range of 3.28 to 7.65 MJ/kg. Straw for power generation can produce electricity in the range of 2.55 (the electricity efficiency is 20%) to 5.11 MJ/kg (the electricity efficiency is 40%) (Figure 11).

4. Conclusions

Agricultural residues including straw play a significant role in renewable energy supply systems. The use of agricultural residues can mitigate climate changes. They can also complement unstable renewable power technologies such as solar and wind in electricity generation systems. This study of energy and the environmental evaluation of straw as a fuel for generating power resulted in the following findings:
The energy consumption of straw production accounts for 30–70% of the total energy inputs. This value depends on the yield and species of crop.
The use of straw for power generation has better energy and environmental indicators compared with the return-to-field technology (biofertilizer production).
Energy allocation provides the opportunity to account for the effects of the agricultural byproduct (straw) production on the energy and ecological indicators of power generation.
The authority should take into account the environmental protection and energy efficiency indicators when designing straw use policies and strategies. From the perspective of carbon dioxide emissions mitigation, straw-to-electricity is superior to the straw return-to-field strategy.
This study provides a framework for the energy allocation of energy inputs and, therefore, carbon dioxide emissions between a product and a byproduct.
There are some limitations in the present study. Bioelectricity is generated by straw-fired power plants; however, there are different environmental-friendly and energy-effective technologies for straw use, such as the production of biogas, bioethanol, construction materials, etc. In addition, there are problems associated with the high cost of transporting and storing straw, as well as the use of advanced technologies for power generation, including biomass gasification). They can be the topics of future research explorations.

Author Contributions

Formal analysis and methodology, V.H., A.K., A.B., and J.S.; Conceptualization, V.H., A.K., A.B., and J.S.; Investigation, V.H. and A.K; Supervision, V.H.; Writing—original draft, V.H., A.K., A.B., and J.S.; Review and Editing, A.K. All authors have read and agreed to the published version of the manuscript.

Funding

This research received no external funding.

Institutional Review Board Statement

Not applicable.

Informed Consent Statement

Not applicable.

Data Availability Statement

Not applicable.

Acknowledgments

The authors would like to thank the reviewers for their detailed and helpful comments. Special thanks to A. Rashedi for his help in proofreading this publication.

Conflicts of Interest

The authors declare no conflict of interest.

References

  1. Giampietro, M.; Ulgiati, S. Integrated Assessment of Large-Scale Biofuel Production. Crit. Rev. Plant Sci. 2005, 24, 365–384. [Google Scholar] [CrossRef]
  2. Organisation for Economic Co-operation and Development. World Energy Balances 2019; OECD Publishing: Paris, France, 2019. [Google Scholar] [CrossRef]
  3. Harjanne, A.; Korhonen, J.M. Abandoning the concept of renewable energy. Energy Policy 2019, 127, 330–340. [Google Scholar] [CrossRef] [Green Version]
  4. Allen, M.; de Coninck, H.; Dube, O.P.; Hoegh-Guldberg, O.; Jacob, D.; Jiang, K.; Revi, A.; Rogelj, J.; Roy, J.; Shindell, D.; et al. Technical summary. In Global Warming of 1.5 °C; Intergovernmental Panel on Climate Change: Geneva, Switzerland, 2018; Available online: https://www.ipcc.ch/site/assets/uploads/sites/2/2019/05/SR15_TS_High_Res.pdf (accessed on 1 February 2021).
  5. Adoption of the Paris Agreement. FCCC/CP/2015/L.9/Rev.1, Paris, France. 2015. Available online: https://unfccc.int/resource/docs/2015/cop21/eng/l09r01.pdf (accessed on 14 December 2020).
  6. United Nations. Transforming Our World: The 2030 Agenda for Sustainable Development; United Nations: New York, NY, USA, 2015; Available online: https://sdgs.un.org/2030agenda (accessed on 14 December 2020).
  7. Climate Analysis Indicator Tool. World Resources Institute. 2015. Available online: https://ledsgp.org/resource/climate-analysis-indicators-tool/?loclang=en_gb (accessed on 14 December 2020).
  8. A Clean Planet for All: A European Strategic Long-Term Vision for A Prosperous, Modern, Competitive and Climate Neutral Economy. EUR-Lex, Document 52018DC0773; European Commission: Brussels, Belgium, 2018; Available online: https://eur-lex.europa.eu/legal-content/EN/TXT/?uri=CELEX%3A52018DC0773 (accessed on 14 December 2020).
  9. Svazas, M.; Navickas, V.; Krajnakova, E.; Nakonieczny, J. Sustainable supply chain of the biomass cluster as a factor for preservation and enhancement of forests. J. Int. Stud. 2019, 12, 309–321. [Google Scholar] [CrossRef]
  10. Popp, J.; Kovács, S.; Oláh, J.; Divéki, Z.; Balázs, E. Bioeconomy: Biomass and biomass-based energy supply and demand. New Biotechnol. 2021, 60, 76–84. [Google Scholar] [CrossRef] [PubMed]
  11. Hansen, K.; Breyer, C.; Lund, H. Status and perspectives on 100% renewable energy systems. Energy 2019, 175, 471–480. [Google Scholar] [CrossRef]
  12. REN21. Renewable 2018—Global Status Report; REN21: Paris, France, 2018; Available online: https://www.ren21.net/wp-content/uploads/2019/05/gsr_2019_full_report_en.pdf (accessed on 14 December 2020).
  13. Jewell, J.; Vinichenko, V.; Nacke, L.; Cherp, A. Prospects for powering past coal. Nat. Clim. Chang. 2019, 9, 592–597. [Google Scholar] [CrossRef]
  14. Rentier, G.; Lelieveldt, H.; Kramer, G.J. Varieties of coal-fired power phase-out across Europe. Energy Policy 2019, 132, 620–632. [Google Scholar] [CrossRef]
  15. Fraunholz, C.; Hladik, D.; Keles, D.; Möst, D.; Fichtner, W. On the long-term efficiency of market splitting in Germany. Energy Policy 2021, 149, 111833. [Google Scholar] [CrossRef]
  16. Directive 2009/28/EC, On the Promotion of the Use of Energy from Renewable Sources and Amending and Subsequently Repealing Directives 2001/77/EC and 2003/30/EC. EUR-Lex, Document 32009L0028; European Commission: Brussels, Belgium, 2015; Available online: https://eur-lex.europa.eu/legal-content/EN/ALL/?uri=CELEX%3A32009L0028 (accessed on 1 February 2021).
  17. A Framework Strategy for a Resilient Energy Union with a Forward-Looking Climate Change Policy; European Commission: Brussels, Belgium, 2015; Available online: https://eur-lex.europa.eu/legal-content/EN/TXT/?uri=CELEX:52015DC0080 (accessed on 1 February 2021).
  18. A Policy Framework for Climate and Energy in the Period from 2020 to 2030. EUR-Lex, Document 52014DC0015; European Commission: Brussels, Belgium, 2014; Available online: https://eur-lex.europa.eu/legal-content/EN/TXT/?uri=COM:2014:15:FIN (accessed on 1 February 2021).
  19. Giuntoli, J.; Agostini, A.; Caserini, S.; Lugato, E.; Baxter, D.; Marelli, L. Climate change impacts of power generation from residual biomass. Biomass Bioenergy 2016, 89, 146–158. [Google Scholar] [CrossRef]
  20. Elbersen, B.; Startisky, I.; Hengeveld, G.; Schelhaas, M.J.; Naeff, H.; Bottcher, H. Atlas of EU Biomass Potentials. Spatially Detailed and Quantified Overview of EU Biomass Potential Taking into Account the Main Criteria Determining Biomass Availability from Different Sources. 2012. Available online: https://ec.europa.eu/energy/intelligent/projects/sites/iee-projects/files/projects/documents/biomass_futures_atlas_of_technical_and_economic_biomass_potential_en.pdf (accessed on 1 February 2021).
  21. Lehtveer, M.; Fridahl, M. Managing variable renewables with biomass in the European electricity system: Emission targets and investment preferences. Energy 2020, 213, 118786. [Google Scholar] [CrossRef]
  22. Sinsel, S.R.; Riemke, R.L.; Hoffmann, V.H. Challenges and solution technologies for the integration of variable renewable energy sources—A review. Renew. Energy 2020, 145, 2271–2285. [Google Scholar] [CrossRef]
  23. Kluts, I.; Wicke, B.; Leemans, R.; Faaij, A. Sustainability constraints in determining European bioenergy potential: A review of existing studies and steps forward. Renew. Sustain. Energy Rev. 2017, 69, 719–734. [Google Scholar] [CrossRef] [Green Version]
  24. Shafie, S.M.; Masjuki, H.; Mahlia, T. Life cycle assessment of rice straw-based power generation in Malaysia. Energy 2014, 70, 401–410. [Google Scholar] [CrossRef]
  25. Shafie, S.; Mahlia, T.; Masjuki, H. Life cycle assessment of rice straw co-firing with coal power generation in Malaysia. Energy 2013, 57, 284–294. [Google Scholar] [CrossRef]
  26. Sun, Y.; Cai, W.; Chen, B.; Guo, X.; Hu, J.; Jiao, Y. Economic analysis of fuel collection, storage, and transportation in straw power generation in China. Energy 2017, 132, 194–203. [Google Scholar] [CrossRef]
  27. Chen, Y.; Hu, W.; Feng, Y.; Sweeney, S. Status and prospects of rural biogas development in China. Renew. Sustain. Energy Rev. 2014, 39, 679–685. [Google Scholar] [CrossRef]
  28. Feng, F.; Song, G.; Shen, L.; Xiao, J. Environmental benefits analysis based on life cycle assessment of rice straw-based synthetic natural gas in China. Energy 2017, 139, 341–349. [Google Scholar] [CrossRef]
  29. Wang, L.; Littlewood, J.; Murphy, R.J. Environmental sustainability of bioethanol production from wheat straw in the UK. Renew. Sustain. Energy Rev. 2013, 28, 715–725. [Google Scholar] [CrossRef] [Green Version]
  30. Song, S.; Liu, P.; Xu, J.; Chong, C.; Huang, X.; Ma, L.; Li, Z.; Ni, W. Life cycle assessment and economic evaluation of pellet fuel from corn straw in China: A case study in Jilin Province. Energy 2017, 130, 373–381. [Google Scholar] [CrossRef]
  31. Lu, W.; Zhang, T. Life-Cycle Implications of Using Crop Residues for Various Energy Demands in China. Environ. Sci. Technol. 2010, 44, 4026–4032. [Google Scholar] [CrossRef] [PubMed]
  32. Nguyen, T.L.T.; Hermansen, J.E.; Mogensen, L. Environmental performance of crop residues as an energy source for electricity production: The case of wheat straw in Denmark. Appl. Energy 2013, 104, 633–641. [Google Scholar] [CrossRef]
  33. Hu, J.; Lei, T.; Wang, Z.; Yan, X.; Shi, X.; Li, Z.; He, X.; Zhang, Q. Economic, environmental and social assessment of briquette fuel from agricultural residues in China—A study on flat die briquetting using corn stalk. Energy 2014, 64, 557–566. [Google Scholar] [CrossRef]
  34. Soam, S.; Borjesson, P.; Sharma, P.K.; Gupta, R.P.; Tuli, D.K.; Kumar, R. Life cycle assessment of rice straw utilization practices in India. Bioresour. Technol. 2017, 228, 89–98. [Google Scholar] [CrossRef] [PubMed]
  35. Directive (EU) 2018/2001 of the European Parliament and of the Council of 11 December 2018 on the Promotion of the Use of Energy from Renewable Sources (Recast). 2018. Available online: https://eur-lex.europa.eu/legal-content/EN/TXT/PDF/?uri=CELEX:32018L2001&from=EN (accessed on 14 December 2020).
  36. Jordan, C.F. An Ecosystem Approach to Sustainable Agriculture; Springer: Berlin/Heidelberg, Germany, 2013; ISBN 978-94-007-9717-8. [Google Scholar]
  37. Jaramillo, P.; Samaras, C.; Wakeley, H.; Meisterling, K.W. Greenhouse gas implications of using coal for transportation: Life cycle assessment of coal-to-liquids, plug-in hybrids, and hydrogen pathways. Energy Policy 2009, 37, 2689–2695. [Google Scholar] [CrossRef]
  38. De Haes, H.A.U.; Heijungs, R. Life-cycle assessment for energy analysis and management. Appl. Energy 2007, 84, 817–827. [Google Scholar] [CrossRef]
  39. Lean, H.H.; Smyth, R. CO2 emissions, electricity consumption and output in ASEAN. Appl. Energy 2010, 87, 1858–1864. [Google Scholar] [CrossRef]
  40. Atkins, M.J.; Morrison, A.S.; Walmsley, M.R. Carbon Emissions Pinch Analysis (CEPA) for emissions reduction in the New Zealand electricity sector. Appl. Energy 2010, 87, 982–987. [Google Scholar] [CrossRef] [Green Version]
  41. Johansson, T.B.; Nakicenovic, N.; Patwardhan, A.; Gomez-Echeverri, L. Global Energy Assessment; Cambridge University Press: Cambridge, UK, 2012. [Google Scholar] [CrossRef]
  42. Romanelli, T.L.; Nardi, H.D.S.; Saad, F.A. Material embodiment and energy flows as efficiency indicators of soybean (Glycine max) production in Brazil. Engenharia Agrícola 2012, 32, 261–270. [Google Scholar] [CrossRef] [Green Version]
  43. Fix, J.; Tynan, S.; Kissinger, M. Carbon Footprint Analysis for Wood & Agricultural Residue Sources of Pulp. Final Report. 2011. Available online: https://www1.agric.gov.ab.ca/$Department/deptdocs.nsf/all/sag13757/$FILE/Final_Report_CFA.pdf (accessed on 14 December 2020).
  44. Mishra, A.; Kumar, A.; Ghosh, S. Energy assessment of second generation (2G) ethanol production from wheat straw in Indian scenario. 3 Biotech 2018, 8, 142. [Google Scholar] [CrossRef] [PubMed]
  45. Van Nguyen, H.; Nguyen, C.D.; Van Tran, T.; Hau, H.D.; Nguyen, N.T.; Gummert, M. Energy efficiency, greenhouse gas emissions, and cost of rice straw collection in the mekong river delta of vietnam. Field Crop. Res. 2016, 198, 16–22. [Google Scholar] [CrossRef] [Green Version]
  46. Said, N.; Alblawai, A.; Hendy, I.; Daiem, M.A. Analysis of Energy and Greenhouse Gas Emissions of Rice Straw to Energy Chain in Egypt. BioResources 2020, 15, 1510–1520. [Google Scholar] [CrossRef]
  47. Suardi, A.; Bergonzoli, S.; Alfano, V.; Scarfone, A.; Pari, L. Economic Distance to Gather Agricultural Residues from the Field to the Integrated Biomass Logistic Centre: A Spanish Case-Study. Energies 2019, 12, 3086. [Google Scholar] [CrossRef] [Green Version]
  48. Shang, X.; Song, S.; Yang, J. Comparative Environmental Evaluation of Straw Resources by LCA in China. Adv. Mater. Sci. Eng. 2020, 2020, 1–16. [Google Scholar] [CrossRef] [Green Version]
  49. Weisser, D. A guide to life-cycle greenhouse gas (GHG) emissions from electric supply technologies. Energy 2007, 32, 1543–1559. [Google Scholar] [CrossRef]
  50. Ou, X.; Xiaoyu, Y.; Zhang, X. Life-cycle energy consumption and greenhouse gas emissions for electricity generation and supply in China. Appl. Energy 2011, 88, 289–297. [Google Scholar] [CrossRef]
  51. Liu, B.; Wu, Q.; Wang, F.; Zhang, B. Is straw return-to-field always beneficial? Evidence from an integrated cost-benefit analysis. Energy 2019, 171, 393–402. [Google Scholar] [CrossRef]
  52. Migo-Sumagang, M.V.P.; Maguyon-Detras, M.C.; Gummert, M.; Alfafara, C.G.; Borines, M.G.; Capunitan, J.A.; Van Hung, N. Rice-Straw-Based Heat Generation System Compared to Open-Field Burning and Soil Incorporation of Rice Straw: An Assessment of Energy, GHG Emissions, and Economic Impacts. Sustainability 2020, 12, 5327. [Google Scholar] [CrossRef]
  53. Nguyen, V.H.; Topno, S.; Balingbing, C.; Nguyen, V.C.N.; Röder, M.; Quilty, J.; Jamieson, C.; Thornley, P.; Gummert, M. Generating a positive energy balance from using rice straw for anaerobic digestion. Energy Rep. 2016, 2, 117–122. [Google Scholar] [CrossRef]
  54. Agri-Footprint 2.0 Part 1: Methodology and Basic Principles. 2015. Available online: https://www.agri-footprint.com/wp-content/uploads/2016/08/Agri-footprint-2.0-Part-1-Methodology-and-basic-principles.pdf (accessed on 19 December 2020).
  55. PRé Consultants. SimaPro Tutorial. 2016. Available online: https://www.pre-sustainability.com/download/SimaPro8Tutorial.pdf (accessed on 1 February 2021).
  56. Goncharuk, A.G.; Havrysh, V.I.; Nitsenko, V.S. National features for alternative motor fuels market. Int. J. Energy Technol. Policy 2018, 14, 226. [Google Scholar] [CrossRef]
  57. Kalinichenko, A.; Havrysh, V. Environmentally Friendly Fuel Usage: Economic Margin of Feasibility. Ecol. Chem. Eng. S 2019, 26, 241–254. [Google Scholar] [CrossRef] [Green Version]
  58. Kalinichenko, A.; Havrysh, V.; Atamanyuk, I. The Acceptable Alternative Vehicle Fuel Price. Energies 2019, 12, 3889. [Google Scholar] [CrossRef] [Green Version]
  59. Kalinichenko, A.; Havrysh, V.; Hruban, V. Heat Recovery Systems for Agricultural Vehicles: Utilization Ways and Their Efficiency. Agriculture 2018, 8, 199. [Google Scholar] [CrossRef]
  60. Jiang, Y.; Havrysh, V.; Klymchuk, O.; Nitsenko, V.; Balezentis, T.; Streimikiene, D. Utilization of Crop Residue for Power Generation: The Case of Ukraine. Sustainability 2019, 11, 7004. [Google Scholar] [CrossRef] [Green Version]
  61. Aguilera, E.; Guzmán, G.I.; Infante-amate, J.; García-ruiz, R.; Herrera, A.; Villa, I. Embodied Energy in Agricultural Inputs. Incorporating a Historical Perspective. DT-SEHA 15. 2015. Available online: http://hdl.handle.net/10234/141278 (accessed on 5 December 2020).
  62. Skowrońska, M.; Filipek, T. Life cycle assessment of fertilizers: A review. Int. Agrophysics 2014, 28, 101–110. [Google Scholar] [CrossRef]
  63. Ledgard, S.F.; Boyes, M.; Brentrup, F. Life Cycle Assessment of Local and Imported Fertilisers Used on New Zealand Farms. In Adding to the Knowledge Base for the Nutrient Manager; Massey University: Auckland, New Zealand, 2011; Occasional Report No. 24. Christensen; Available online: https://www.massey.ac.nz/~flrc/workshops/11/Manuscripts/Ledgard_2011.pdf (accessed on 1 February 2021).
  64. Wood, S.; Cowie, A. A Review of Greenhouse Gas Emission Factors for Fertiliser Production. June 2004. For IEA Bioenergy Task 38. Available online: https://www.sciencetheearth.com/uploads/2/4/6/5/24658156/2004_wood_a_review_of_greenhouse_gas_emission_factors.pdf (accessed on 1 February 2021).
  65. Veiga, J.P.S.; Romanelli, T.L.; Gimenez, L.M.; Busato, P.; Milan, M. Energy embodiment in Brazilian agriculture: An overview of 23 crops. Sci. Agricola 2015, 72, 471–477. [Google Scholar] [CrossRef]
  66. Todde, G.; Murgia, L.; Caria, M.; Pazzona, A. A Comprehensive Energy Analysis and Related Carbon Footprint of Dairy Farms, Part 2: Investigation and Modeling of Indirect Energy Requirements. Energies 2018, 11, 463. [Google Scholar] [CrossRef] [Green Version]
  67. Eriksson, M.; Ahlgren, S. LCAs of Petrol and Diesel—A Literature Review; Swedish University of Agricultural Science: Uppsala, Sweden, 2013; Available online: https://pub.epsilon.slu.se/10424/17/ahlgren_s_and_eriksson_m_130529.pdf (accessed on 1 February 2021).
  68. Havrysh, V.; Kalinichenko, A.; Mentel, G.; Mentel, U.; Vasbieva, D.G. Husk Energy Supply Systems for Sunflower Oil Mills. Energies 2020, 13, 361. [Google Scholar] [CrossRef] [Green Version]
  69. Havrysh, V.; Hruban, V.; Sadovoy, O.; Kalinichenko, A.; Taikhrib, K. Sustainable Energy Supply Based on Sunflower Seed Husk for Oil mills. In Proceedings of the International Conference on Modern Electrical and Energy Systems (MEES), Kremenchuk, Ukraine, 23–25 September 2019. [Google Scholar] [CrossRef]
  70. Bentsen, N.S.; Felby, C.; Thorsen, B.J. Agricultural residue production and potentials for energy and materials services. Prog. Energy Combust. Sci. 2014, 40, 59–73. [Google Scholar] [CrossRef]
  71. Scarlat, N.; Martinov, M.; Dallemand, J.-F. Assessment of the availability of agricultural crop residues in the European Union: Potential and limitations for bioenergy use. Waste Manag. 2010, 30, 1889–1897. [Google Scholar] [CrossRef] [PubMed]
  72. Peltonen-Sainio, P.; Muurinen, S.; Rajala, A.; Jauhiainen, L. Variation in harvest index of modern spring barley, oat and wheat cultivars adapted to northern growing conditions. J. Agric. Sci. 2007, 146, 35–47. [Google Scholar] [CrossRef]
  73. Larsen, S.U.; Bruun, S.; Lindedam, J. Straw yield and saccharification potential for ethanol in cereal species and wheat cultivars. Biomass- Bioenergy 2012, 45, 239–250. [Google Scholar] [CrossRef]
  74. Cardoen, D.; Joshi, P.; Diels, L.; Sarma, P.M.; Pant, D. Agriculture biomass in India: Part 1. Estimation and characterization. Resour. Conserv. Recycl. 2015, 102, 39–48. [Google Scholar] [CrossRef]
  75. Geletukha, G.; Zheliezna, T. Prospects for the Use of Agricultural Residue for Energy Production in Ukraine; Position Paper 7; Bioenergy Association of Ukraine: Kyiv, Ukraine, 2014; Available online: https://uabio.org/wp-content/uploads/2020/04/position-paper-uabio-7-en.pdf (accessed on 1 February 2021).
  76. Ziaei, S.; Mazloumzadeh, S.; Jabbary, M. A comparison of energy use and productivity of wheat and barley (case study). J. Saudi Soc. Agric. Sci. 2015, 14, 19–25. [Google Scholar] [CrossRef] [Green Version]
  77. Ghorbani, R.; Mondani, F.; Amirmoradi, S.; Feizi, H.; Khorramdel, S.; Teimouri, M.; Sanjani, S.; Anvarkhah, S.; Aghel, H. A case study of energy use and economical analysis of irrigated and dryland wheat production systems. Appl. Energy 2011, 88, 283–288. [Google Scholar] [CrossRef]
  78. Shahan, S.; Jafari, A.; Mobli, H.; Rafiee, S.; Karimi, M. Energy Use and Economical Analysis of Wheat Production in Iran: A Case Study from Ardabil Province. J. Agricult. Technol. 2008, 4, 77–88. Available online: http://ijat-aatsea.com/pdf/JUNE_v4_n1_08/IJAT2008_07_Karimi.pdf (accessed on 10 January 2021).
  79. Yildiz, T. An Input-Output Energy Analysis of Wheat Production in Çarşamba District of Samsun Province. J. Agric. Fac. Gaziosmanpasa Univ. 2016, 33, 10–20. [Google Scholar] [CrossRef]
  80. Kardoni, F.; Parande, S.; Jassemi, K.; Karami, S. Energy Input-output Relationship and Economical Analysis of Wheat Production in Khuzestan Province of Iran. Int. J. Agronom. Plant. Product. 2013, 4, 2187–2193. Available online: https://www.semanticscholar.org/paper/Energy-Input-output-Relationship-and-Economical-of-Kardoni-Parande/be3b7368a7a7a95c0e75b87fe7af45a1a8b2dbf1 (accessed on 10 January 2021).
  81. Bakht, J.; Shafi, M.; Jan, M.T.; Shah, Z. Influence of crop residue management, cropping system and N fertilizer on soil N and C dynamics and sustainable wheat (Triticum aestivum L.) production. Soil Tillage Res. 2009, 104, 233–240. [Google Scholar] [CrossRef]
  82. Zhang, X.; Xin, X.; Zhu, A.; Zhang, J.; Yang, W. Effects of tillage and residue managements on organic C accumulation and soil aggregation in a sandy loam soil of the North China Plain. Catena 2017, 156, 176–183. [Google Scholar] [CrossRef]
  83. Yin, H.; Zhao, W.; Li, T.; Cheng, X.; Liu, Q. Balancing straw returning and chemical fertilizers in China: Role of straw nutrient resources. Renew. Sustain. Energy Rev. 2018, 81, 2695–2702. [Google Scholar] [CrossRef]
  84. Chen, Y.; Xin, L.; Liu, J.; Yuan, M.; Liu, S.; Jiang, W.; Chen, J. Changes in bacterial community of soil induced by long-term straw returning. Sci. Agricola 2017, 74, 349–356. [Google Scholar] [CrossRef]
  85. Shan, J.; Yan, X. Effects of crop residue returning on nitrous oxide emissions in agricultural soils. Atmos. Environ. 2013, 71, 170–175. [Google Scholar] [CrossRef]
  86. Dankevych, L.; Leonova, N.; Dragovoz, I.; Patyka, V.; Kalinichenko, A.; Wlodarczyk, P.; Wlodarczyk, B. The synthesis of plant growth stimulators by phytopathogenic bacteria as factor of pathogenicity. Appl. Ecol. Environ. Res. 2018, 16, 1581–1593. [Google Scholar] [CrossRef]
  87. Naser, H.M.; Nagata, O.; Tamura, S.; Hatano, R. Methane emissions from five paddy fields with different amounts of rice straw application in central Hokkaido, Japan. Soil Sci. Plant Nutr. 2007, 53, 95–101. [Google Scholar] [CrossRef] [Green Version]
  88. Zhu, L.; Hu, N.; Yang, M.; Zhan, X.; Zhang, Z. Effects of Different Tillage and Straw Return on Soil Organic Carbon in a Rice-Wheat Rotation System. PLoS ONE 2014, 9, e88900. [Google Scholar] [CrossRef] [PubMed] [Green Version]
  89. Karlen, D.L.; Kovar, J.L.; Birrell, S.J. Corn Stover Nutrient Removal Estimates for Central Iowa, USA. Sustainability 2015, 7, 8621–8634. [Google Scholar] [CrossRef] [Green Version]
  90. Kim, S.; Dale, B.E.; Jenkins, R. Life cycle assessment of corn grain and corn stover in the United States. Int. J. Life Cycle Assess. 2009, 14, 160–174. [Google Scholar] [CrossRef]
  91. Technical Annex to the SEAP: The Emission Factors. Available online: https://www.ces-med.eu/publications/technical-annex-seap (accessed on 2 February 2021).
Figure 1. Energy expenditure of agricultural operations.
Applsci 11 02009 g001
Figure 2. Carbon dioxide emissions.
Applsci 11 02009 g002
Figure 3. The share of energy associated with straw formation.
Applsci 11 02009 g003
Figure 4. Share of energy for wheat.
Applsci 11 02009 g004
Figure 5. The share of energy associated with straw formation.
Applsci 11 02009 g005
Figure 6. Comparison of mass and energy allocation indicators (share of energy for straw formation).
Applsci 11 02009 g006
Figure 7. Derivative of energy allocation indicator.
Applsci 11 02009 g007
Figure 8. Energy specific costs.
Applsci 11 02009 g008
Figure 9. Energy parameter of straw production and utilization.
Applsci 11 02009 g009
Figure 10. Carbon dioxide emissions saving.
Applsci 11 02009 g010
Figure 11. Straw utilization: energy transformation efficiency.
Applsci 11 02009 g011
Table 1. Embodied energy in the main inputs.
InputUnitValueReference
Fuels:
Diesel fuelMJ/kg56.8[61]
PetrolMJ/kg60.2[61]
Natural gasMJ/kg54.6[61]
Electricity:
Coal power plantMJ/MJ
MJ/kWh *
3.14
11.30
[61]
Natural gas power plantMJ/MJ
MJ/kWh *
2.66
9.36
[61]
Nuclear power plantMJ/MJ
MJ/kWh *
3.26
11.74
[61]
Hydro power plantMJ/MJ
MJ/kWh *
1.05
3.78
[61]
Solar power plantMJ/MJ
MJ/kWh *
1.17
4.21
[61]
Wind power plantMJ/MJ
MJ/kWh *
1.05
3.78
[61]
Fertilizers:
NitrogenMJ/kg52.02–121.21[61,62,63,64]
P2O5MJ/kg12.60–63.02[61,62,63,64]
K2OMJ/kg6.70–16.77[61,62,63,64]
Manure:MJ/kg
Poultry manureMJ/kg0.30[61]
Cattle manureMJ/kg16.1[61]
pigMJ/kg19.4[61]
layerMJ/kg11.9[61]
broilerMJ/kg17.9[61]
Chemicals
PesticidesMJ/L447–820[61]
HerbicidesMJ/L454.20[65]
InsecticidesMJ/L184.20[65]
FungicidesMJ/L97.10[65]
Machinery:
TractorMJ/kg138[61]
ImplementMJ/kg69[66]
* calculated by authors.
Table 2. Residue-to-crop ratios and energetic parameters of selected crops.
CropResidue-to-Crop RatioLower Heating Value of Straw, MJ/kgCalorific Value of Grain, MJ/kg
Rapeseed1.1–1.727.7–29.014.7–19.1
Wheat0.8–1.815.0–18.113.7–19.1
Rye1.7–1.7515.0–18.113.6–19.1
Oats1.0–2.015.0–18.112.9–19.1
Barley0.9–1.815.0–18.113.4–19.1
Corn0.7–2.016.113.9–14.5
Sunflower1.0–3.016.025.0
Table 3. Carbon dioxide emissions and energy used by production processes.
Fertilizer ProductPrimary ComponentPercentage (by Weight)Primary Energy Consumption, MJ/kg (Primary Component)Carbon Dioxide Emissions, g CO2/kg (Primary Component)
Ammonium nitrateN33.590.30–121.212298–7108
UreaN4652.02–112.17913–4018
AmmoniaN82 1491–2637
Single superphosphateP2161.90−238–1051
Triple superphosphateP4816.50–63.02−416–1083
Potassium chlorideK6016.77583
Publisher’s Note: MDPI stays neutral with regard to jurisdictional claims in published maps and institutional affiliations.

