1. Introduction
One of the recent innovations in geological prospecting, which first influenced the theory and practice of applied geology, is unmanned aerial systems that allow airborne geophysical surveys to be performed at low altitudes and with a terrain drape. Over the past few years magnetic prospecting methods [
1,
2,
3,
4], then gamma surveys [
5,
6,
7] have become widely used, they are often combined with lidar scans, multi or hyperspectral surveys [
8,
9,
10,
11,
12,
13]. Now it is obvious that in difficult natural conditions, with poor pedestrian permeability of the landscape and highly rugged terrain, the informativeness of low-altitude UAV geophysics methods may even surpass both traditional ground and traditional aerogeophysical works [
2,
5]. Namely, such environmental conditions characterize previously underexplored, currently promising areas. UAV surveys are significantly cheaper than terrestrial geophysical work and more accessible than classical airborne geophysics, which is cost-effective only in large volumes. The advantage of UAV geophysics over traditional airborne geophysics in terms of data informativeness is associated with the ability to significantly reduce the altitude and survey speed without risking the aircraft crew even in mountainous conditions, which significantly increases the contrast of geophysical anomalies, which, as is known, rapidly decay with altitude. As a result, to date, at least in Russia and neighboring countries, whose legislation allows for a simplified procedure for the operation of unmanned systems of the light (less than 30 kg) class, UAV-aeromagnetic and gamma-survey, performed with a step between profiles of 50 or 100 m, almost completely displaced land-based methods from the market. It should be noted that there is a trend towards expanding the range of methods, and the integration of several UAV-geophysical methods on one object, which is implemented both by sequential surveys with different payloads, for example, [
9,
12,
13], and by placing several sensors on one UAV [
10,
11]. Integration of several payloads is not always possible for technical or methodological reasons, but it allows one to increase productivity and reduce the cost of work. An integration of several methods of geological prospecting makes it possible to characterize the geological setting from various angles, various methods of geophysical exploration are objectively characterized by different depths, detail, and other parameters. Expansion of the set of available methods makes it possible to more reasonably solve traditional geological problems, or solve new classes of problems.
The existing technologies of UAV-magnetic and gamma-ray imaging are very effective in geological and geophysical mapping, which is especially important at the early stages of geological prospecting of license sites, but they do not allow successfully solving the problems of studying a geological section to the depth. Gamma surveys have ‘no depth’, and magnetic prospecting is limited in terms of creating detailed geophysical sections or 3D models of the geological environment, especially since the geological environment is not always contrasting in the presence of magnetic minerals. To study the geological environment both in plan and in depth, methods of electromagnetic prospecting are widely used, studying the parameters of electrical resistivity, chargeability and other geoelectric characteristics of rocks and ores [
14,
15,
16]. Moreover, the most important task of electrical prospecting at the present stage of geology, when the objects of search are often hidden bodies, are soundings, which make it possible to reconstruct the deep structure of the geological environment in the form of geophysical sections or 3D models of the distribution of geoelectric parameters [
17,
18]. In such tasks, the information content, detail, and other capabilities of electrical prospecting methods are significantly superior to magnetic prospecting methods. In this regard, the widely used complexes of geophysical methods, implemented both in the traditional aerial version and in the ground, usually include magnetic, gamma-survey, and some version of electromagnetic sounding method [
18,
19]. However, despite the widespread use of electrical prospecting methods in the ground and traditional aerial versions, the UAV systems for electrical prospecting known on the market are still limited by Very Low Frequency (VLF) [
20,
21] and Ground Penetrating Radar (GPR) [
22,
23] technologies. Such methods do not provide depths of more than a few meters, a maximum of tens of meters, and VLF methods, which depend on the signal of remote radio stations of long-distance navigation systems, often do not provide the possibility of inversion, for reasons discussed below.
In connection with all of the above, the task of creating a new technology for UAV-electromagnetic sounding, which would make it possible to perform detailed areal electromagnetic sounding and study the geological environment at a depth of at least 100–150 m, is very urgent and in demand on the geological prospecting market. It is important that the unmanned system should be classified as a light UAV class, otherwise using it in Russian Federation will become almost impossible. This paper describes the developed unmanned aerial system for UAV-TEM and the surveying technique, gives an example of using the first working prototype of the created unmanned system at one of the promising areas for uranium in the mountains of Eastern Siberia (Russia). Based on the obtained field data, the system’s sensitivity was modeled, the results of which prove the high prospects of application of created UAS in various geological situations. The potential economic efficiency of the created version of the UAV-TEM was also evaluated. In our opinion, the results obtained convincingly prove the possibility of creating UAV systems for TEM electromagnetic sounding and their potentially high geological and economic efficiency.
2. Theoretical Foundations and Main Problems of Creating Technologies for UAV-Based Electromagnetic Prospecting
Why is it so difficult to create a system for electromagnetic sounding based on lightweight UAVs? Indeed, if such systems have been successfully used for a long time in the classical aero version, then why have the UAV versions still not appeared and have not become widespread? This section is devoted to a discussion of these issues, for this purpose, below are brief information on a number of classical methods of electrical exploration used in geological exploration.
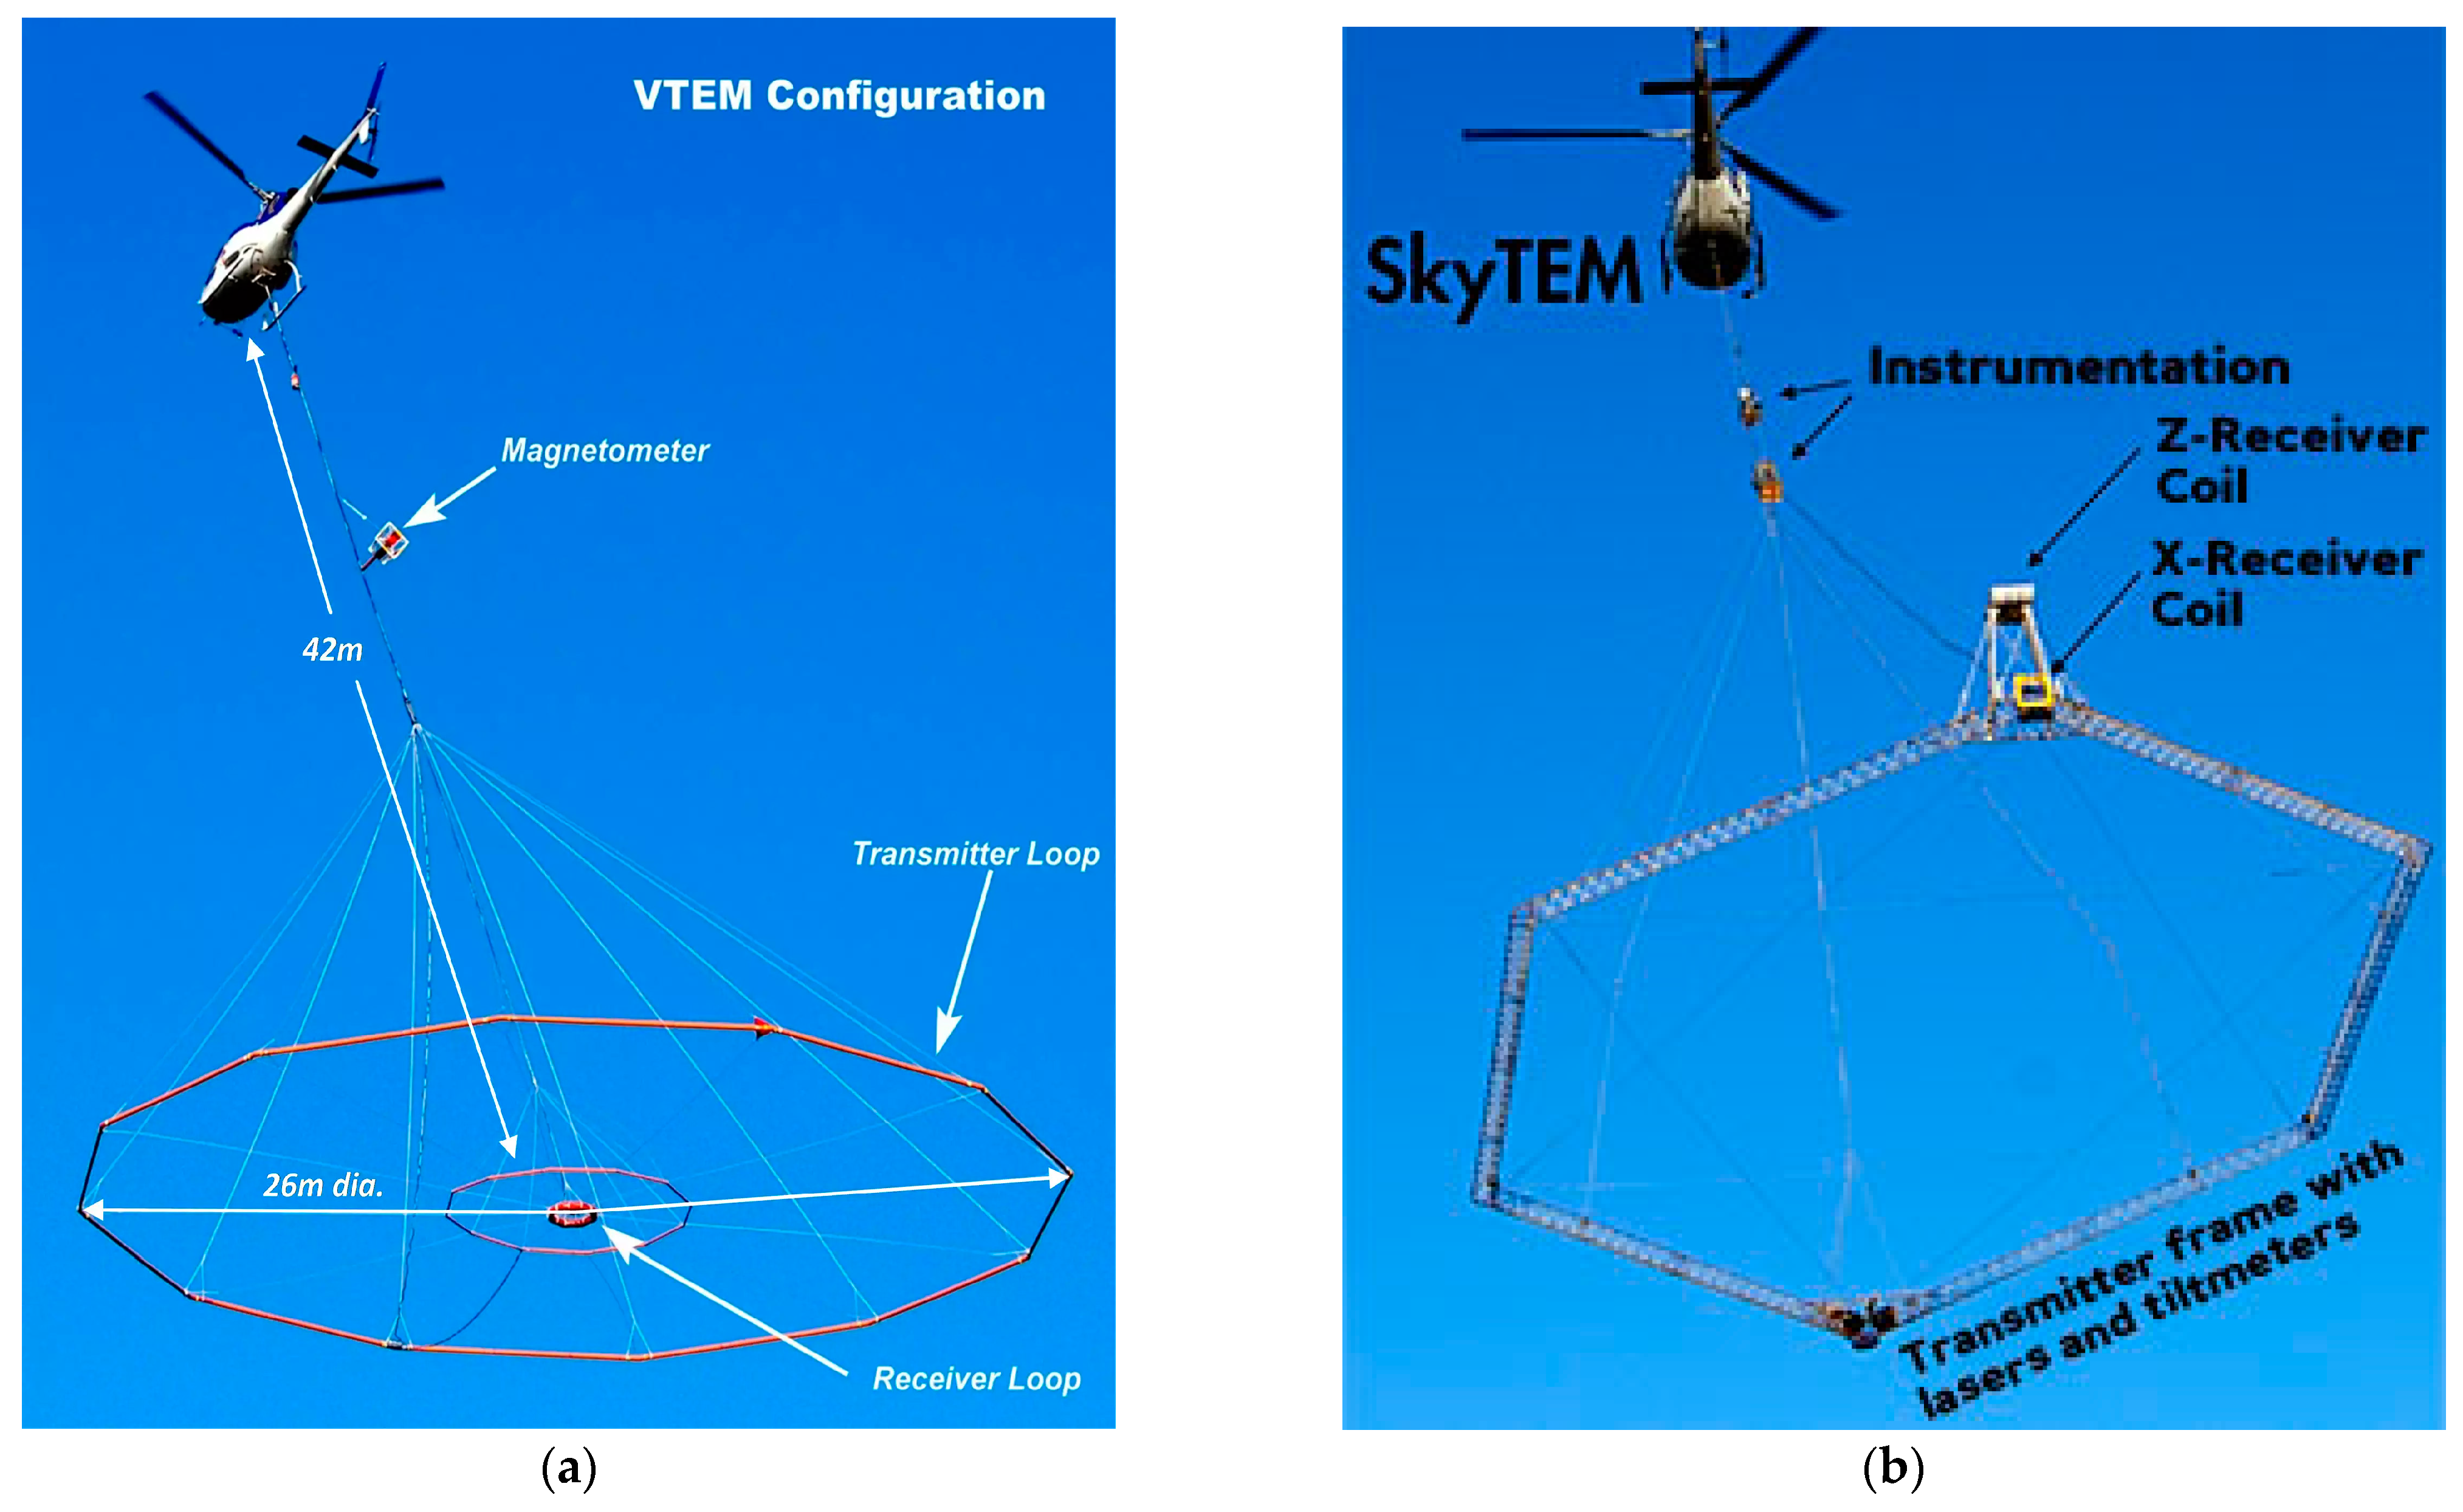
An important difference between the methods of electrical prospecting and the methods of magnetic and gamma surveys is that the methods of electrical prospecting are not passive (with the exception of magnetotelluric methods), but record the “response” of the geological environment to the artificially generated electromagnetic field in it. Common electrical prospecting systems designed to be carried by helicopters [
18,
19], Figure 2, are very large and heavy, because generator and transmitter antenna should be onboard to excite an alternating or pulsed quasi-constant electromagnetic field in the geological environment. The generator current in this case can reach 250 A, it is obvious that even the electric generator itself cannot be light and compact, even without taking into account other components of the electrical prospecting system.
Methods of electromagnetic sounding, which can be implemented without the use of galvanic grounding of the receiving line, are based on studying the propagation of a secondary electromotive force in rocks. Measurements can be carried out both ground and the air, since it is a dielectric. For measurements, magnetic and electrical antennas of various types are used, oriented in space to measure separately the vertical and horizontal components of the EM field. By studying the amplitude and phase parameters of the secondary field in frequency domain or transient in the time domain, it becomes possible to calculate various geoelectric characteristics of rocks below the measurement point, primarily the electrical resistivity, and even to model the probable distribution of parameter values at depth. Comparing adjacent measurement points along one survey line, it is possible to build a geological section, and comparing points along several neighboring survey lines—a 3D model of the distribution of geoelectrical parameters.
There are two classes of electromagnetic sounding methods that are usually implemented in the aerial variant—the frequency domain electromagnetic sounding (FDEM) analog to methods and the time domain electromagnetic sounding TDEM methods. The above-mentioned VLF systems theoretically provide the possibility of frequency sounding, provided that the measuring system provides simultaneous measurement of the amplitude and phase parameters of the EM field at several frequencies. The inversion of the frequency sounding data is based on the principle of the skin effect, the dependence of the penetration depth of electromagnetic waves on their frequency—the lower it is, the greater the penetration depth. Having a set of several frequencies it is possible to calculate the apparent resistivity section [
16]. The VLF methods, which first appeared in the ground and airborne versions in the 60 s of the 20th century [
24], use a simple plane wave model in the far zone, and the source of the field in the geological environment is the fields of long-distance radio communication and navigation systems in the range 10–30 kHz, mostly military [
25]. This is convenient since there is no need to carry the transmitter loop using the UAV. However, evaluating the rationality of using such methods for our task, one should note significant and at the same time fundamental limitations. With the development of satellite communication systems, VLF-navigation systems are gradually being decommissioned, for example, the Omega system (USA) has not functioned since 1997; two of the five transmitters of the Alpha (USSR) system were turned off in 2014, and the rest are turned on periodically and unpredictably for civil services [
26]. As a result, the presence of stations with a good signal level in a specific area, often remote from the infrastructure, and with constant availability for the entire period of geological work, is not guaranteed. In addition, as the number of stations decreases, the available set of frequencies also decreases; it becomes insufficient for frequency inversion. Work on the VLF method in both ground and airborne and UAV versions was mainly carried out at the same frequency, in order to map the distribution of the derivatives of the electrical resistance of the upper part of the section over the area, so the VLF methods played a role electrical profiling operations, not sounding. This is due to the shallow depth of VLF methods—the depth of propagation of electromagnetic waves into the geological environment also depends on the resistance of rocks, with a low resistance, the depth of VLF methods does not exceed 10–20 m, with a high one it can reach 40–50 m [
24,
25,
27]. When searching for hidden deposits, this is not enough, and data inversion in exploration cases at such a depth is often meaningless. In this regard, this method does not even theoretically allow solving the problem of sounding to depths of 100 or more meters, but it can be successfully used together with magnetic and gamma surveys at the first stage of geophysical mapping in the variant of electrical profiling operations. In our opinion, this option will be used quite often in the UAV version. It should be noted that the FDEM methods used in the traditional aero or ground version are not limited by only the VLF version, however, in this case, they require heavy generator system on the aircraft and therefore their direct copying to the UAV option is not possible.
The TEM methods based on the phenomenon of electromagnetic induction provide significantly greater possibilities for deep sounding. The traditional version of TEM methods is as follows: on the aircraft (or at the operators during ground surveys) there is a generator and a current switch that generates rectangular current pulses of a given duration and then a given pause. An ungrounded transmitter loop is used as a source of the electromagnetic field—a copper wire closed to the generator, laid in the form of a square (for ground surveys) or round (for aerial surveys,
Figure 1) loops ranging in size from a few meters to hundreds of meters. A pulsed magnetic field is formed around the loop. According to Faraday’s law, a change in the magnetic field over time leads to the appearance of eddy electric currents in conductive rocks. Eddy currents in the ground propagate according to the law of diffusion. At the moment of switching off the current in the generator loop, an almost mirror-image current ring appears directly under the loop. Then, this current ring gradually begins to sink to a depth and simultaneously expand, covering an ever larger volume of rocks. As a result, eddy currents are completely attenuated due to heat losses. The position of the current ring depends on both time and conductivity. The rate of immersion and expansion of the eddy current is determined only by the electrical conductivity of rocks; the higher the electrical conductivity (lower resistance), the slower the current sinks and dissipates. This creates sounding effect. The eddy current creates a secondary magnetic field around itself, which also changes in time and space. This magnetic field creates an induction effect in the receiving magnetic antenna (or loop) on the earth’s surface. The intensity of the signal in the receiving antenna and the rate of its attenuation over time depends on the distribution of electrical conductivity in the ground.
Measurements are carried out using a measuring loop or frame. The curves of the transient of the secondary electromagnetic field (EMF) in the rocks below the measurement point are recorded and studied in the time domain [
14]. The depth of the TEM methods depends on the current in the transmitter loop, the moment (size) of the receiving loop, the maximum recording time of the receiving signal, and ranges from 10 meters to several kilometers. The problem for TEM methods is the complexity of reconstructing precisely the first meters (or tens of meters) of the geological section, since the current in the transmitter loop is not switched off instantly and at early times the influence of the current pulse is superimposed on the useful signal. This problem can be solved by measuring the current decay in transmitter and then taking into account the effect of the impulse in the modeling [
28]. However, usually the early times are simply ignored during processing, which leads to the skipping of the upper part of the section.
In the airborne TEM version, the transmitter and receiver loops are located in axial alignment. As shown on the
Figure 1, transmitter loop with a diameter of up to several tens of meters and a corresponding power source are used for deep sounding. This configuration cannot be implemented in a light unmanned system. In the ground TEM version, workers move the receiving and transmitter loops between the survey points, and the power source can be transported by off-road vehicles. Receiving loops are usually used both coaxial (inside the transmitter loop) and spaced (receiving loops are out of the transmitter loop), so several measurements can be carried out with one transmitter loop at the same time. There are options for measurements in the near and far zones from a transmitter. Measurements in the near zone leads to increase in the locality and detail of the study. The productivity of ground surveys in forest ranges from a few to the first tens of sounding points per day, while the cost of one sounding point is up to
$100. High time and financial costs limit the possibility of performing areal soundings with dense measurements.
Obviously, the use of UAV systems should lead to multiple reduction in the cost and time of geophysical surveying in comparison with ground surveying, even if the landscape-morphological situation is not very complex, otherwise their use is not economically justified. At the same time, the time for deploying an unmanned complex is usually longer than a ground one. What is the minimum distance from the take-off point is it necessary to be able to move away with UAV-electromagnetic soundings in order for such a complex to be of practical importance? With the first prototype, the issue was solved empirically. The authors began to develop and apply UAV-geophysical systems, first for scientific purposes, and then in geological exploration for a long time, when UAV systems had significantly reduced flight time in compare to modern models. The operating radius of the first versions of complexes for magnetic prospecting and gamma-spectrometry did not exceed the first hundred meters and gradually increased over the years. Systems with a range of hundreds of meters could be used only for scientific purposes, but when the operating radius reached about 1.5–1.7 km, it turned out that it was already possible to successfully solve commercial problems with reducing the cost of work by half compared to the ground-based survey. With such a radius, it is possible to obtain with each take-off point about of several square kilometers of dense survey per day. This is an excellent result in terms of performance compared to land surveys. Therefore, this minimum range of the UAV system was taken as one of the basic characteristics of the complex being created for electrical exploration.
Another problem of aerial electrical exploration is the need to accurately maintain the horizontal position of the measuring loop, since its oscillations affect the measurement results of the vertical component of the EM field. This problem is especially significant in difficult terrain conditions. Manned aviation in mountainous areas performs a scheme with a significant simplification of the relief, however, our position in relation to low-altitude UAV surveys is unambiguous—such surveys should be carried out at a minimum height and with accurate flow around the relief. This problem is engineering, not scientific, but very important because it determines the possibility of obtaining high quality data.
Taking into account the above, a lightweight complex for the UAV-TEM was created, the design features and methods of application are described below.
3. Developed Drone System for TEM
The main geological task that needs to be solved with the help of UAV electrical prospecting was detailed areal electromagnetic sounding, which would allow relatively quickly and cheaply obtaining large amounts of data suitable for solving inverse problems in the class of 3D models. The idea is to replace the ground survey, not the aerial. To do this, it needs to get closer to the level of terrestrial surveying detail. The ground-based version of sounding is quite expensive, and therefore usually areal 3D electrical prospecting will be carried out in separate, most promising parts of the license areas identified at the previous stages of geological prospecting. Recently, it can be integrated with UAV surveys.
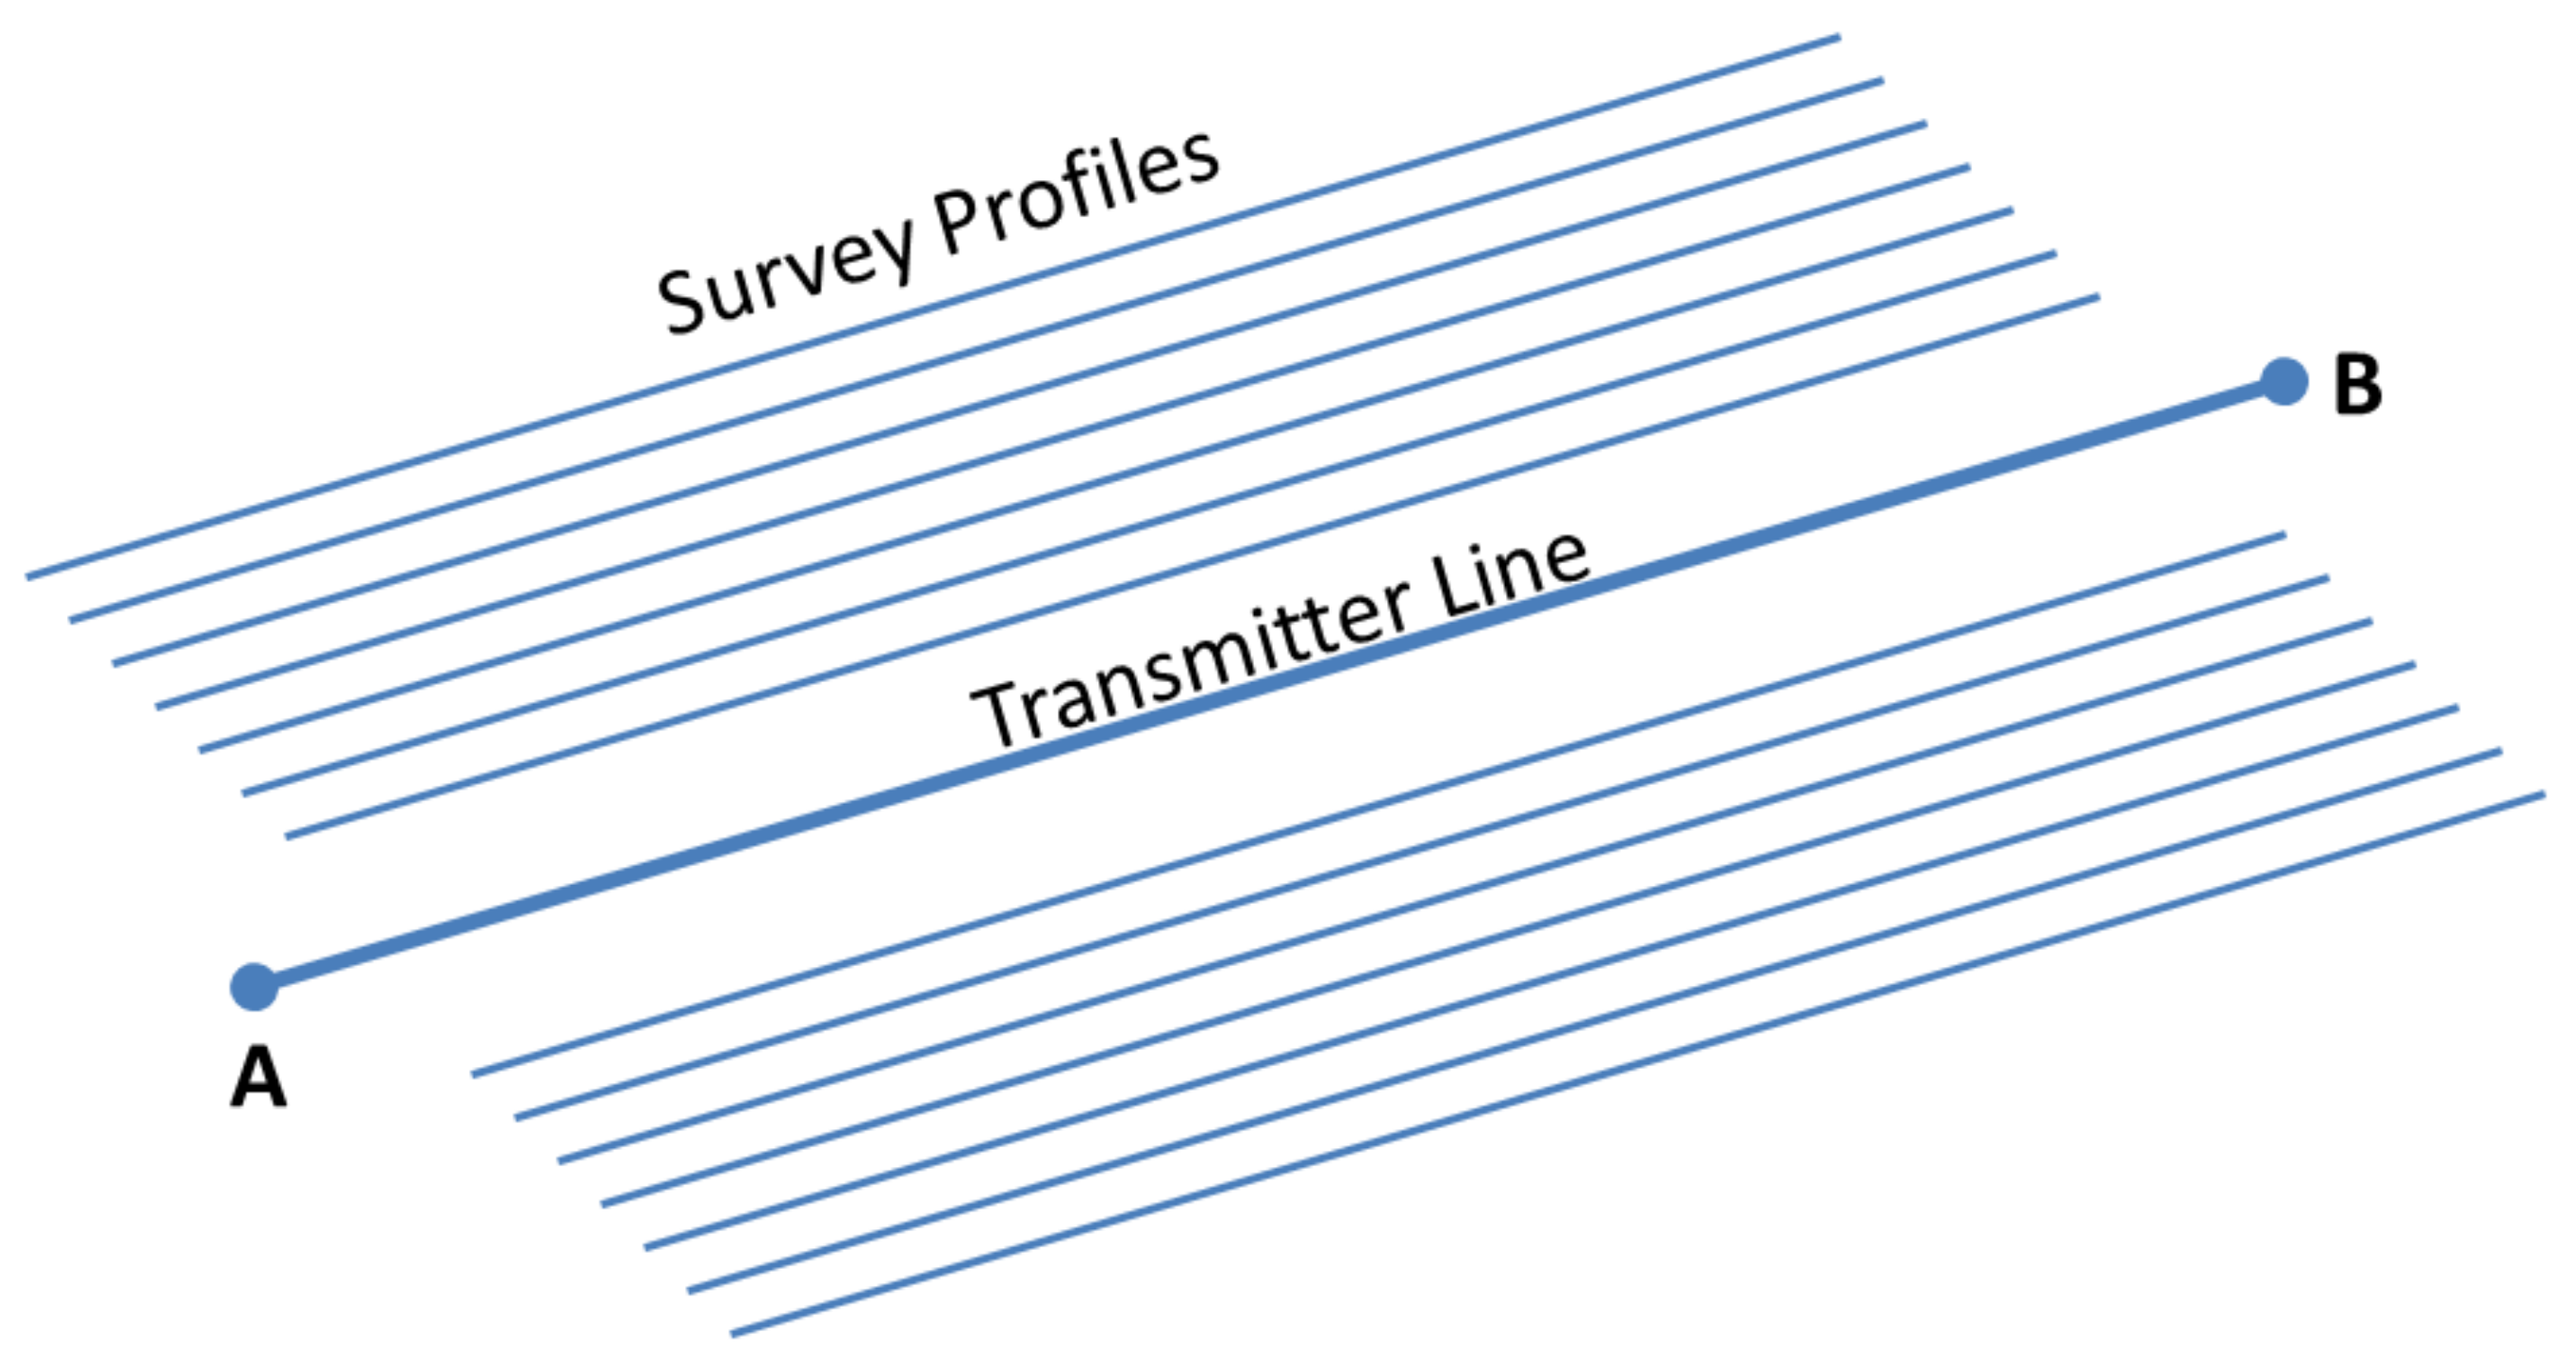
This task needs a large operating radius. Therefore, a line-to-loop survey was implemented, where the power source is a long line, since such a current source provides an acceptable operating radius, but the measuring system is an induction loop, since such a sensor can measure without contact with the ground. This measurement geometry is atypical, since usually the transmitter and receiver are of the same type—“line–line” or “loop–loop”. The power source is placed on the ground, while the measurement system is on the aircraft (
Figure 2). The transmitter is a galvanically grounded power line with length up to several kilometers long. The signal is bipolar current pulses with a pause. The survey lines are parallel to transmitter line and located at a distance of 40 to 100 m from each other.
When the transmitter is stationary, and the measuring system moves across the area, a number of ground-based electrical prospecting methods are implemented, but all solutions known on the market are of the “line-to-line” type, where both the measuring line and the power supply are galvanically grounded. The authors are not aware of serial line-to-loop systems. Many methodological issues of surveying by the “line–loop” array, and even from the air, have been poorly studied, and therefore the development of the UAV system was carried out by trial and error method.
The first working prototype of the system, the survey results of which are discussed in this work, to optimize the development process, was created with the widespread use of technologies from other developments of the authors—the unmanned airborne geophysical complex SibGIS UAS [
2,
5,
10,
11] and the electrical prospecting system MARS for ground electrical exploration works by the ‘electromagnetic soundings with induced polarization (EMS-IP)’ method [
17]. In this regard, the prototype had a number of drawbacks of a purely technical nature, later easily eliminated.
The developed hardware and software complex consists of:
airmobile part, including an unmanned vehicle, a sensor, a meter unit and a recorder (
Figure 3);
the ground part, the solution of the power source is of primary interest;
software for data processing.
3.1. Aeromobile Part
3.1.1. Measuring System
First of all, it was necessary to create a compact and lightweight measuring system for towing by a light UAV, which makes it possible to carry out surveys by the TEM method.
The measuring system consists of an induction sensor, a measuring unit, and a recorder.
Instead of receiving loop induction sensors are used—analogs of loops with dimensions 50 × 50 and 20 × 20 m. These and similar sensors can be used as part of systems for ground-based TEM imaging. Structurally, the sensors are rigid square frames less than 1 × 1 m in size, and have the following characteristics (
Table 1).
The mass of sensors is quite large for light UAVs, but in the future, due to the use of lightweight modern materials and the housing of the meter unit, it can be reduced by 1–1.2 kg without any problems. Depending on the geological task (high detail in the upper part of the section or depth), you can choose one of two sensors.
For towing and stabilization of the sensor in flight, a suspension system was developed (
Figure 3), which prevented it from twisting around its axis, dampened jerks and vibrations, and also ensured the horizontal position of the induction sensor at the UAV’s cruising speed. The suspension design was empirically developed as a result of two months of testing and improvement of several options. The length was 5 m. The sensor was mounted on three semi-rigid braces of various lengths to the central platform where the meter unit, recorder with GNSS antenna, and batteries for powering the measuring system are located. The weight of the suspension was about 1 kg and could be reduced by at least 200 g due to the use of lighter and thinner structural elements.
The meter unit used in all works in 2020 was borrowed almost unchanged from the MARS complex developed by the authors, designed for ground-based surveying by the method of electromagnetic sounding and induced polarization (EMS-IP). It is a block of four (for a four-channel meter) independent successive approximation analog-to-digital converters (ADCs) with parameters 100 kHz/18 bits. It is possible to record data simultaneously on all channels with different gains, which will increase the dynamic range of the recorded signal. The block weighs about 600 g. This weight will be reduced by half by changing the metal case and durable connectors. Surveying by the EMS-IP method is performed in start-stop mode, not in continuous mode, in line-line geometry with galvanic ground, and is focused to work with induced polarization effects. In this regard, this ADC and current switch was a number of disadvantages in terms of using for UAV-TEM. First, in the existing version of the ADC unit, continuous measurement was not implemented, and half of time spent to save the measurement. This led to a twofold decrease in the received data per unit of time, which is very important for a fast-moving UAV system. Secondly, the firmware of the ADC and power unit assumed the recording of rather long time intervals, since the IP effects appear at the late times of the secondary EMF decay. For methods without galvanic grounding, including UAV-TEM, recording of later times is completely useless, since the signal decay rate is much higher, and it makes no sense to record noise. The ADC operating mode (and, accordingly, the current switch in the transmitter line) was as follows: positive current pulse, pause, negative pulse, pause—all for 0.125 s, that is, one accumulation contains a signal for 0.5 s. In other words, the operating mode of the current switch provided a measurement frequency of 2 Hz, but in fact the recording was carried out at a frequency of 1 Hz, since half of the time is spent on recording the measured values. For comparison, in the VTEM system, the measurement frequency reached 30 Hz, the high measurement frequency in airborne electrical survey systems allowed it to a large extent to solve the problems of filtering interference, eliminate the effects of the measuring loop tilt, and increase the measurement accuracy due to the possibility of averaging a larger amount of observed data for each survey station. However, the elimination of the noted shortcomings of our meter unit was not a significant problem, but only represents an ordinary technical problem, which nevertheless required some time to create a new version of the equipment. In part, it was already solved by making a new firmware for the ADC unit and the current switch: after analyzing the field data, the maximum duration of the recording time steps was determined, and the pulse frequency was increased. It turned out that by refusing to record later times, it is possible to increase the pulse frequency by at least a hundred times. Thus, in the current version of the ADC and current switch, the pulses frequency already reached 100 Hz, and after the completion of the manufacture of a new version of the equipment with continuous recording, it reached 200 Hz. Taking into account the significantly lower flight speed of the UAV compared to the helicopter, the data density even exceeded the classical manned TEM systems. It is important to note that the decision to start testing with an a priori imperfect meter unit was quite deliberate—if the authors achieved a sufficiently high-quality result for solving geological problems even with such a meter, then its simple improvement would allow us to create a system with very impressive characteristics.
The data logger was similar to those used in other versions of the SibGIS UAS complex and is an x86-compatible microcomputer with original software for data collection. High-precision satellite synchronization of the current switch and the meter unit was provided, as well as a similar binding of the measurement results to spatial coordinates. The weight of the recorder, GNSS antenna and battery was 0.5 kg.
Thus, the total weight of the entire payload could exceed 7 kg, which is a serious challenge for unmanned light vehicles. In fact, serial UAVs, even of fairly high (by Russian standards) price categories, such as the DJI Matrice 600 PRO or T-Motor M1200, cannot lift such a load.
3.1.2. UAV
To perform geophysical surveys at low altitudes and in conditions of difficult terrain, original multi-rotor systems with electric batteries were used. They are quite simple to manufacture in the conditions of university workshops, are cheap to operate, are characterized by a significantly lower noise level compared to systems with internal combustion engines, and a high ratio the mass of the payload to the mass of the carrier. In this case, a typical version of the UAV from the SibGIS UAS complex was used. It was developed specifically for geophysical surveys in difficult conditions of geological expeditions [
2], which is a hexacopter with a frame diagonal of 1 m (
Figure 3). For several years of operation of these UAVs, their design has been brought to the maximum degree of strength, ease of maintenance, low operating costs, and minimization of electromagnetic interference of the carrier. For example, UAVs of this design can withstand a fall with the engines turned off from a height of 40 m onto a surface with at least some vegetation (not bare stones) without damaging the main structural elements, while only propellers and specially weakened elements manufactured by 3D printing, and can be replaced in the field in 5 min. A high-precision magnetometer ceases to feel any influence of carrier interference at a distance of about 3.5 m below the UAV frame. It should be noted that UAVs were originally designed for a payload mass of up to 4.5 kg (a spectrometer with a CsI 8 × 10 cm detection unit or the overhauser magnetometer and a CsI 3 × 15 cm spectrometer at the same time) [
2,
10,
11], but they are also capable of carrying a larger payload with a reduction in flight time. In the case described in the article and at this stage of the development of the UAV-TEM method, there was no need of a flight time of more than 20 min, since during this time, at a UAV cruising speed of 7–8 m per second (~ 25 km/h), it was possible to get the operating radius 2.5 km, taking into account the time spent on takeoff, landing, flying in and out of the survey profile. This was significantly higher than the previously justified value of 1.7 km and allowed us to survey areas of at least 5 square kilometers using one take-off point, which was not only sufficient for experimental work, but also, in our opinion, is quite economically profitable. The UAV was equipped with RTK GNSS system and a laser altimeter that recorded a series of beam reflections, which measureed the distance to the ground, rather than to vegetation. These solutions ensured high accuracy of marching mission and data georeferencing.
The main problem of the used design of the UAV-system in this case was the weight of the UAV and the towed system are almost the same. In that case the center of gravity of the whole system is floating. UAV is able to move such a load for the required time, but it turned out that it is very difficult for the carrier to stabilize its flight after turns, as well as to start and stop. The high-quality data could be received after the UAV reaches cruising speed and stabilizes the measuring system. In this regard, in the central part of the geophysical sections, arrived in
Section 4 of this article, where the UAV begins and ends its flight along the survey lines, the replacements are discarded shooting areas. This could be avoided by dividing the flight missions in such a way that they went 150–200 m beyond the surveying area, this distance would be enough for acceleration. However, a better solution was to reduce the payload mass, in the next field season it will be reduced to about 5 kg, as described in the previous section.
3.2. Power Supply
As already noted, in contrast to the classic version of ground-based or airborne TEM, the created complex uses not a loop as a current source in the geological environment, but a transmitter line, galvanically grounded at the ends. Depending on the geological task and natural conditions, its length may be different, but in typical ore tasks it is 2–4 km, which theoretically allows surveying over an area of more than 10 square kilometers. A line of such a length of geophysical power cable, coiled of 2 × 500 m, is quite easy to deliver to the work area, and it can be deployed by three of men even in the forest. For grounding, steel electrodes are used, usually 10–15 pieces for each end of the transmitter line (
Figure 4a).
To generate bipolar current pulses in the transmitter, the MARS current switch with a maximum power of 5 kW is used. It implements the possibility of satellite synchronization with the recorder (
Figure 4).
The current was provided by a diesel or gasoline generator of the appropriate capacity. A gasoline generator is much lighter (less than 100 kg) and is used when it is necessary to reduce the weight and size of the system to optimize its transportation, but a diesel generator is preferable because it works better under heavy load.
The weight of the components of the power supply: switch 15 kg, 1 km of power cable—74 kg, electrode—1.5 kg.
The weight and size parameters of the entire unmanned system were as follows. The wardrobe trunk with the UAV was a cube with a side of 70 cm and weighing about 30 kg. The charging station (for three 6S batteries) and UAV batteries (set of 4 pcs 28 Ah for continuous operation) wer two small cases weighing about 5 and 12 kg. The current switch was about half the size of the UAV wardrobe trunk. All of the above equipment, both the aeromobile part and the power supply, could fit into an ordinary mid-size SUV. If necessary, it could be transported across the area on a light all-terrain vehicle such as Argo or Tinger (in whole or in parts, depending on the size all-terrain vehicle), or along the rivers on a rubber boat. This provided a low cost of mobilizing the UAS to the area, and the possibility of its use even in the absence of roads in the area.
4. Survey Technique and Data Preprocessing
To perform a survey using the UAV-TEM method, minimum two persons (usually 3) is required, since one person will not be able to ensure either the safety of the UAV complex landing in the space often limited due to vegetation, or the deploying and grounding of the transmitter line.
The main positions of the UAV-TEM technique are set out below. They are described exactly in the version that was used when obtaining the data presented in
Section 5 of this article.
To perform low-altitude geophysical survey, it was necessary to have a sufficiently accurate digital relief model of the work area, at a constant altitude over which the UAV will fly. The digital elevation model (DEM) can be obtained immediately before the start of the UAV-TEM by the method of lidar scanning from the UAV, or it can be created in advance based on the available satellite or topographic data. The example in
Section 5 uses a 10 m pixel DEM generated from Intermap NextMap data. The digital elevation model must be accurate enough to avoid an accident and ensure the required data quality. So, for UAV magnetic prospecting, the regulatory framework of the Russian Agency for Subsoil Use established the maximum vertical accuracy of the DEM no more than 10% of the relative height of the UAV above the terrain, i.e., for example, when surveying at an altitude of 50 m under the sensor of the measuring system, the DEM error was considered acceptable ±5 m (according to the LE90 criterion). For other types of UAV-geophysical survey, which are not yet provided with approved methods, including UAV-TEM, authors adhered to the same requirements.
Upon arrival of the field team at the survey point, first of all, deploying and grounding of the transmitter line, installation of a current switch and a generator, checking the operation of the power supply, assessing the quality of grounding were performed. The actual coordinates of the transmitter groundings (AB) were recorded using the GNSS navigator. The time for deploying and rolling the transmitter, depending on its length and conditions, could range from tens of minutes to the first hours, usually this process was carried out in parallel with the preparation of the UAV for takeoff and checking the measuring system.
The coordinates of the transmitter and the take-off point were entered into the QGIS project. After that, using the module ‘SibGIS Flight Planner’ [
2], arrays of flight mission points were created parallel to the power line, with a given distance between mission points, speed, height. The height of the survey was taken taking into account vegetation, and in this case it was 40 m under the sensor.
The flight mission was loaded into the UAV flight controller. The measuring system was launched, connection to the recorder was carried out via Wi-Fi. UAV take-off and landing was carried out in manual mode, since the heavy measuring system and gusts of wind could destabilize the UAV. The flight was on autopilot. The flight speed was set at 7.5 m/s. Geophysical measurements were made automatically, the results were recorded in the recorder’s memory along with the exact satellite time. In the used version of the ADC unit and recorder, the data array from each flight task was one file, which was subsequently divided into fragments corresponding to the coordinates of individual survey points.
After the completion of the mission, the UAV battery was replaced, and the actions of the previous point were repeated.
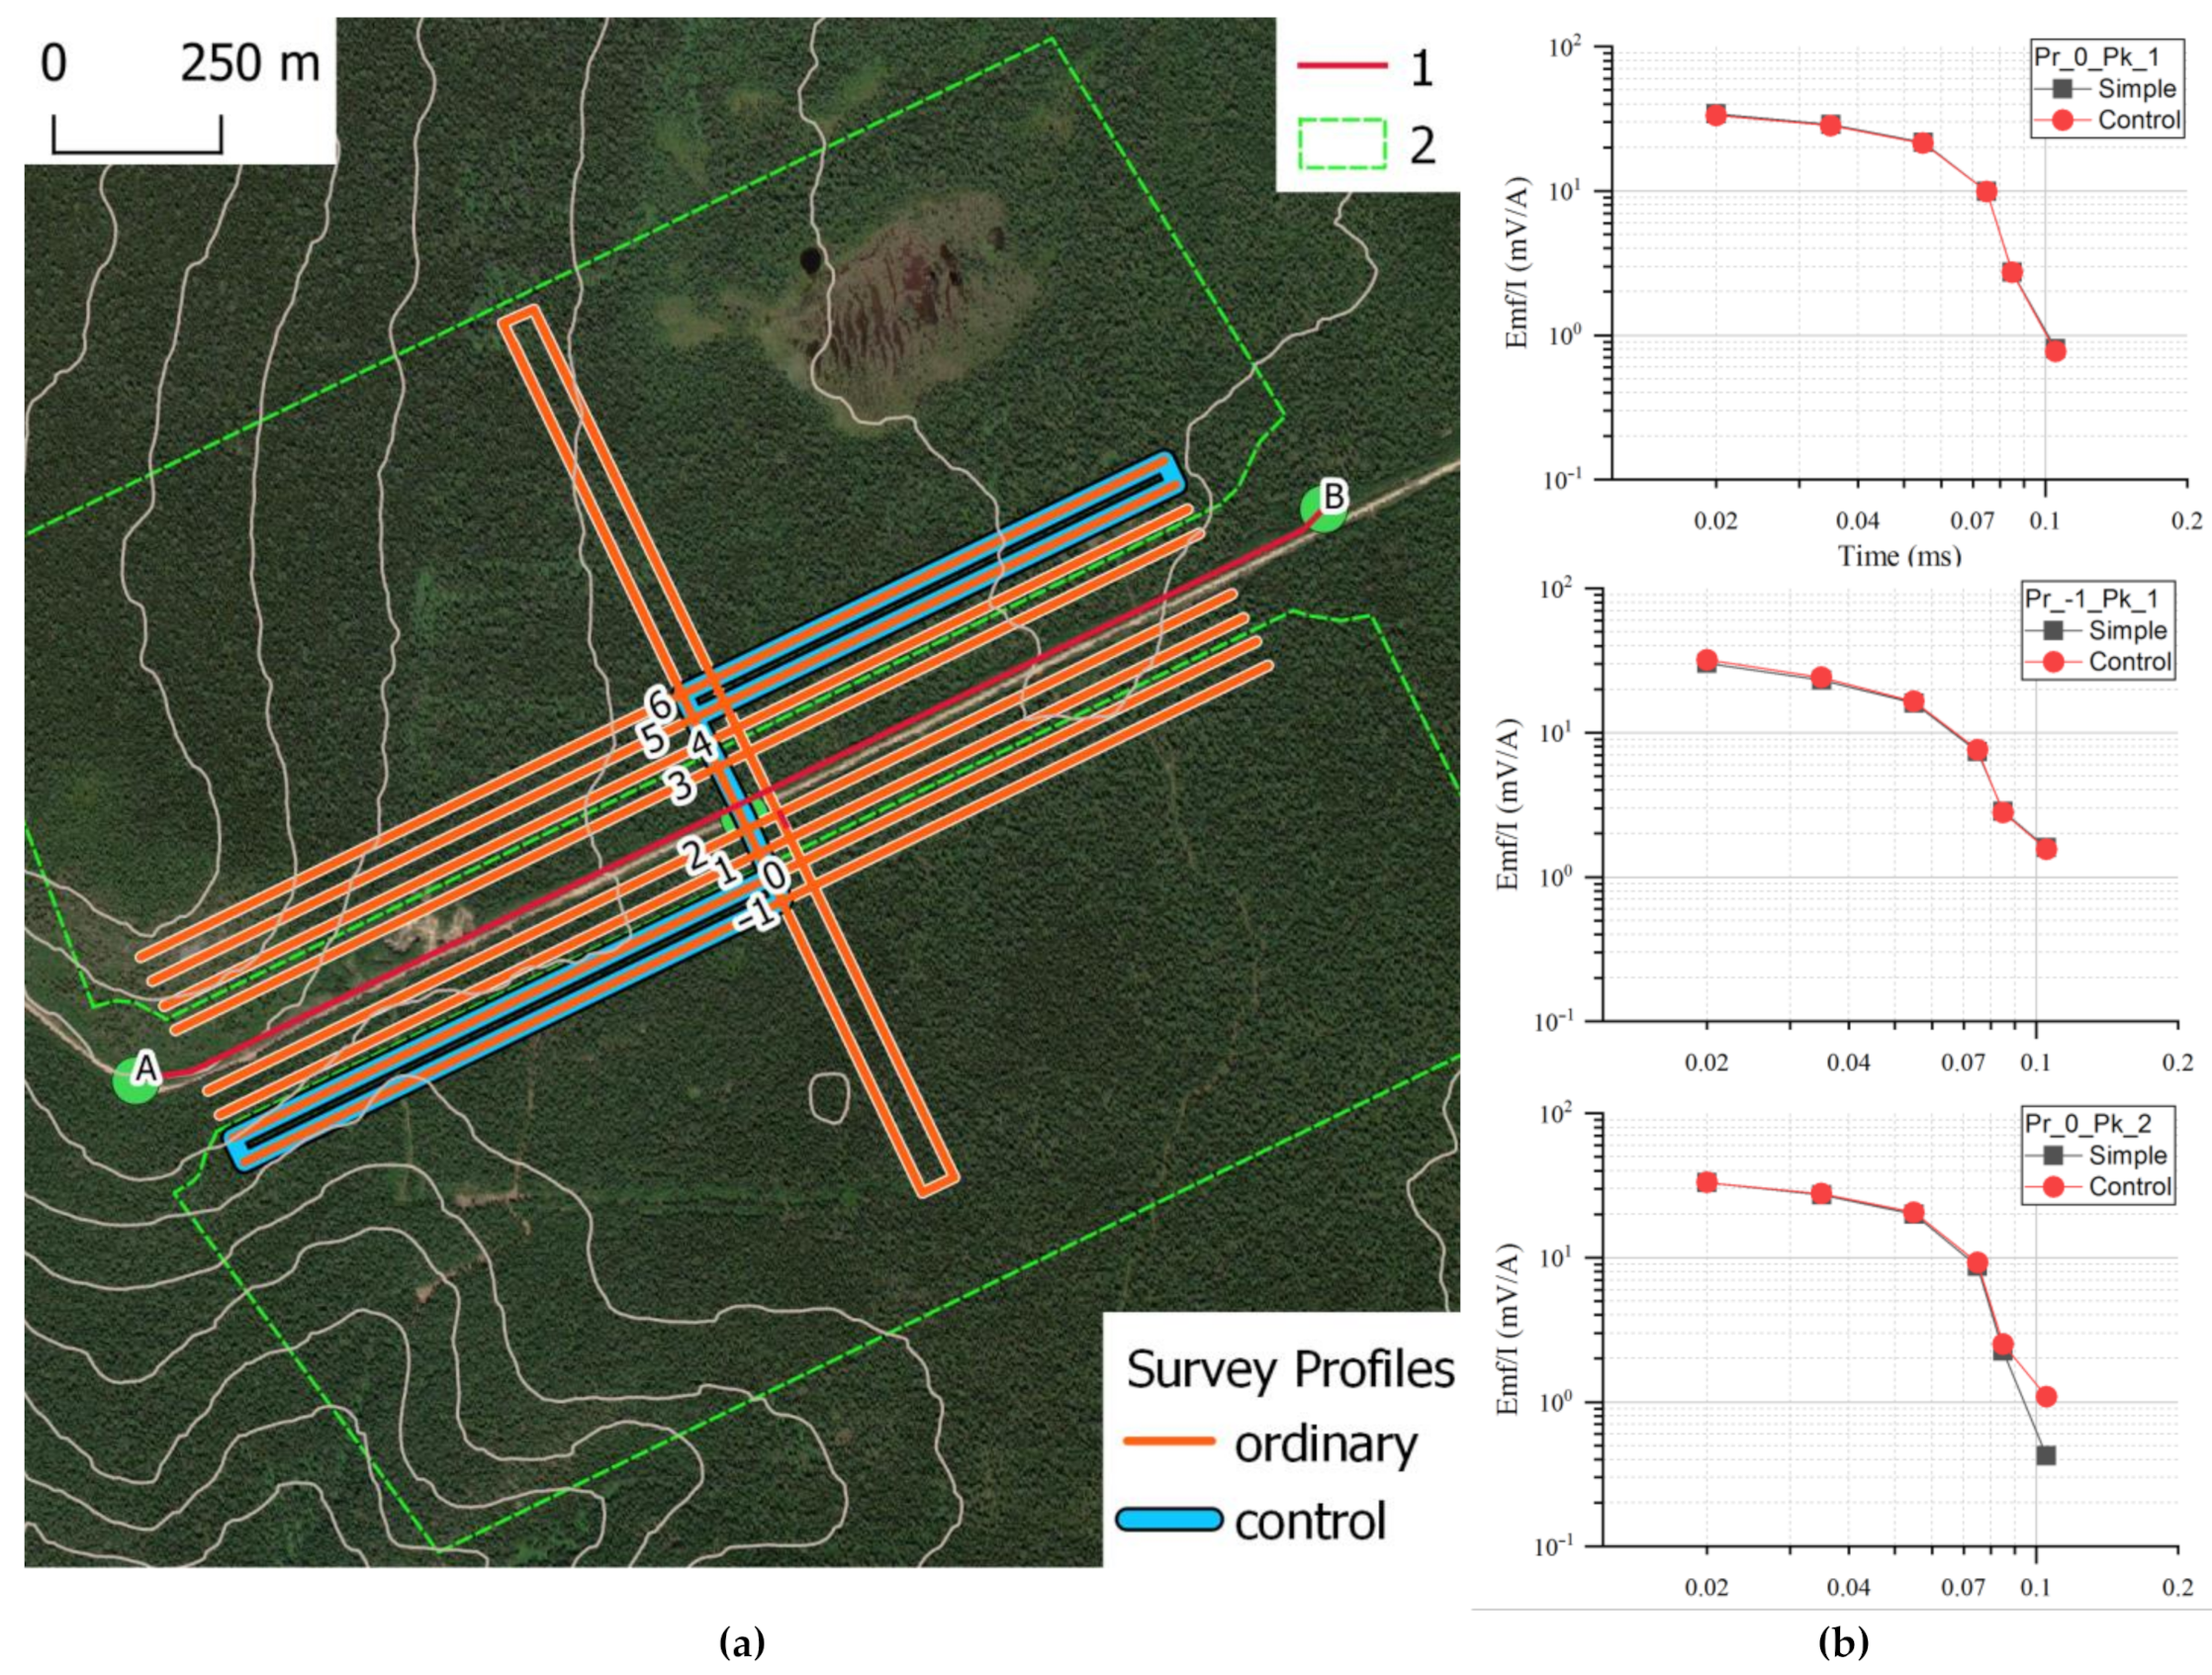
After the completion of the row survey, a control route was taken to assess the quality of the data. Subsequently, during office processing, the convergence of the EMF curves recorded during routine and control measurements was evaluated (Figure 8b).
The export of data and their primary processing was carried out according to the following column (
Figure 5).
The division of the file with data from the whole flight mission into transient records (TR), related to individual measurement points, was carried out over specified time ranges, and was based on data from a GPS receiver.
Suppression of industrial noise was carried out to filter noise with a frequency of 50 Hz and its derivatives from the used alternator. The filtering procedure was based on a differentiating digital filter [
29].
Allocation of recessions is a software feature of hardware and software system “MARS” operation. One accumulation contained a signal for 0.5 s (positive pulse, pause, negative pulse, pause), which must be divided into separate TRs.
When ground (start-stop) worked by TEM methods using a receiving ungrounded frame, the suppression of the trend was not required, but when the receiving loop moveed in space, the EMF of the Earth’s magnetic field was induced on it, which must be suppressed.
Robust smoothing in a 2D sliding window was performed using the Hampel M-estimate, where the window length was the ADC counts in transient and the window width was neighbor transients. Several filters with different window sizes and different falloff time ranges were used for processing (
Figure 6) [
30]. After using robust smoothing in a 2D sliding window (
Figure 6a,b), decays noise level was reduced (
Figure 6c), because of which the sounding curve had less noise (
Figure 6d).
Integration into the sounding curve—the procedure of data integration into time bins allowed one to significantly compress the occupied volumes of information in comparison with the primary data and increase the signal-to-noise ratio. Based on the pre-calculated time mesh, the M-estimate was calculated using the Hampel function in a two-dimensional window with a window width equal to the number of transients.
Binding of coordinates for sounding curves. Each sounding curve was snapped to its corresponding geographic coordinates.
The final processing of the obtained data to create maps, sections and 3D models of resistances can be performed using any software for working with TEM data, including 1D and 3D inversion environments. The results presented in the next section were obtained by the 1D-inversion method in the MARS 1D software package developed by the authors [
31,
32,
33].
5. An Example of UAV-TEM Application: A Case of Mapping Structural Discordance and Tectonics
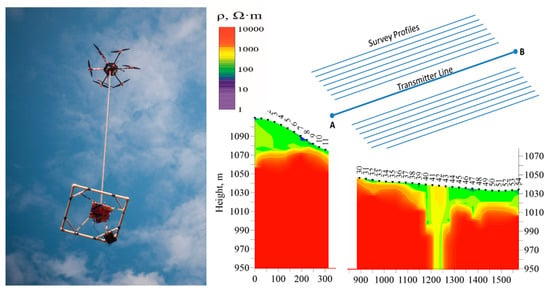
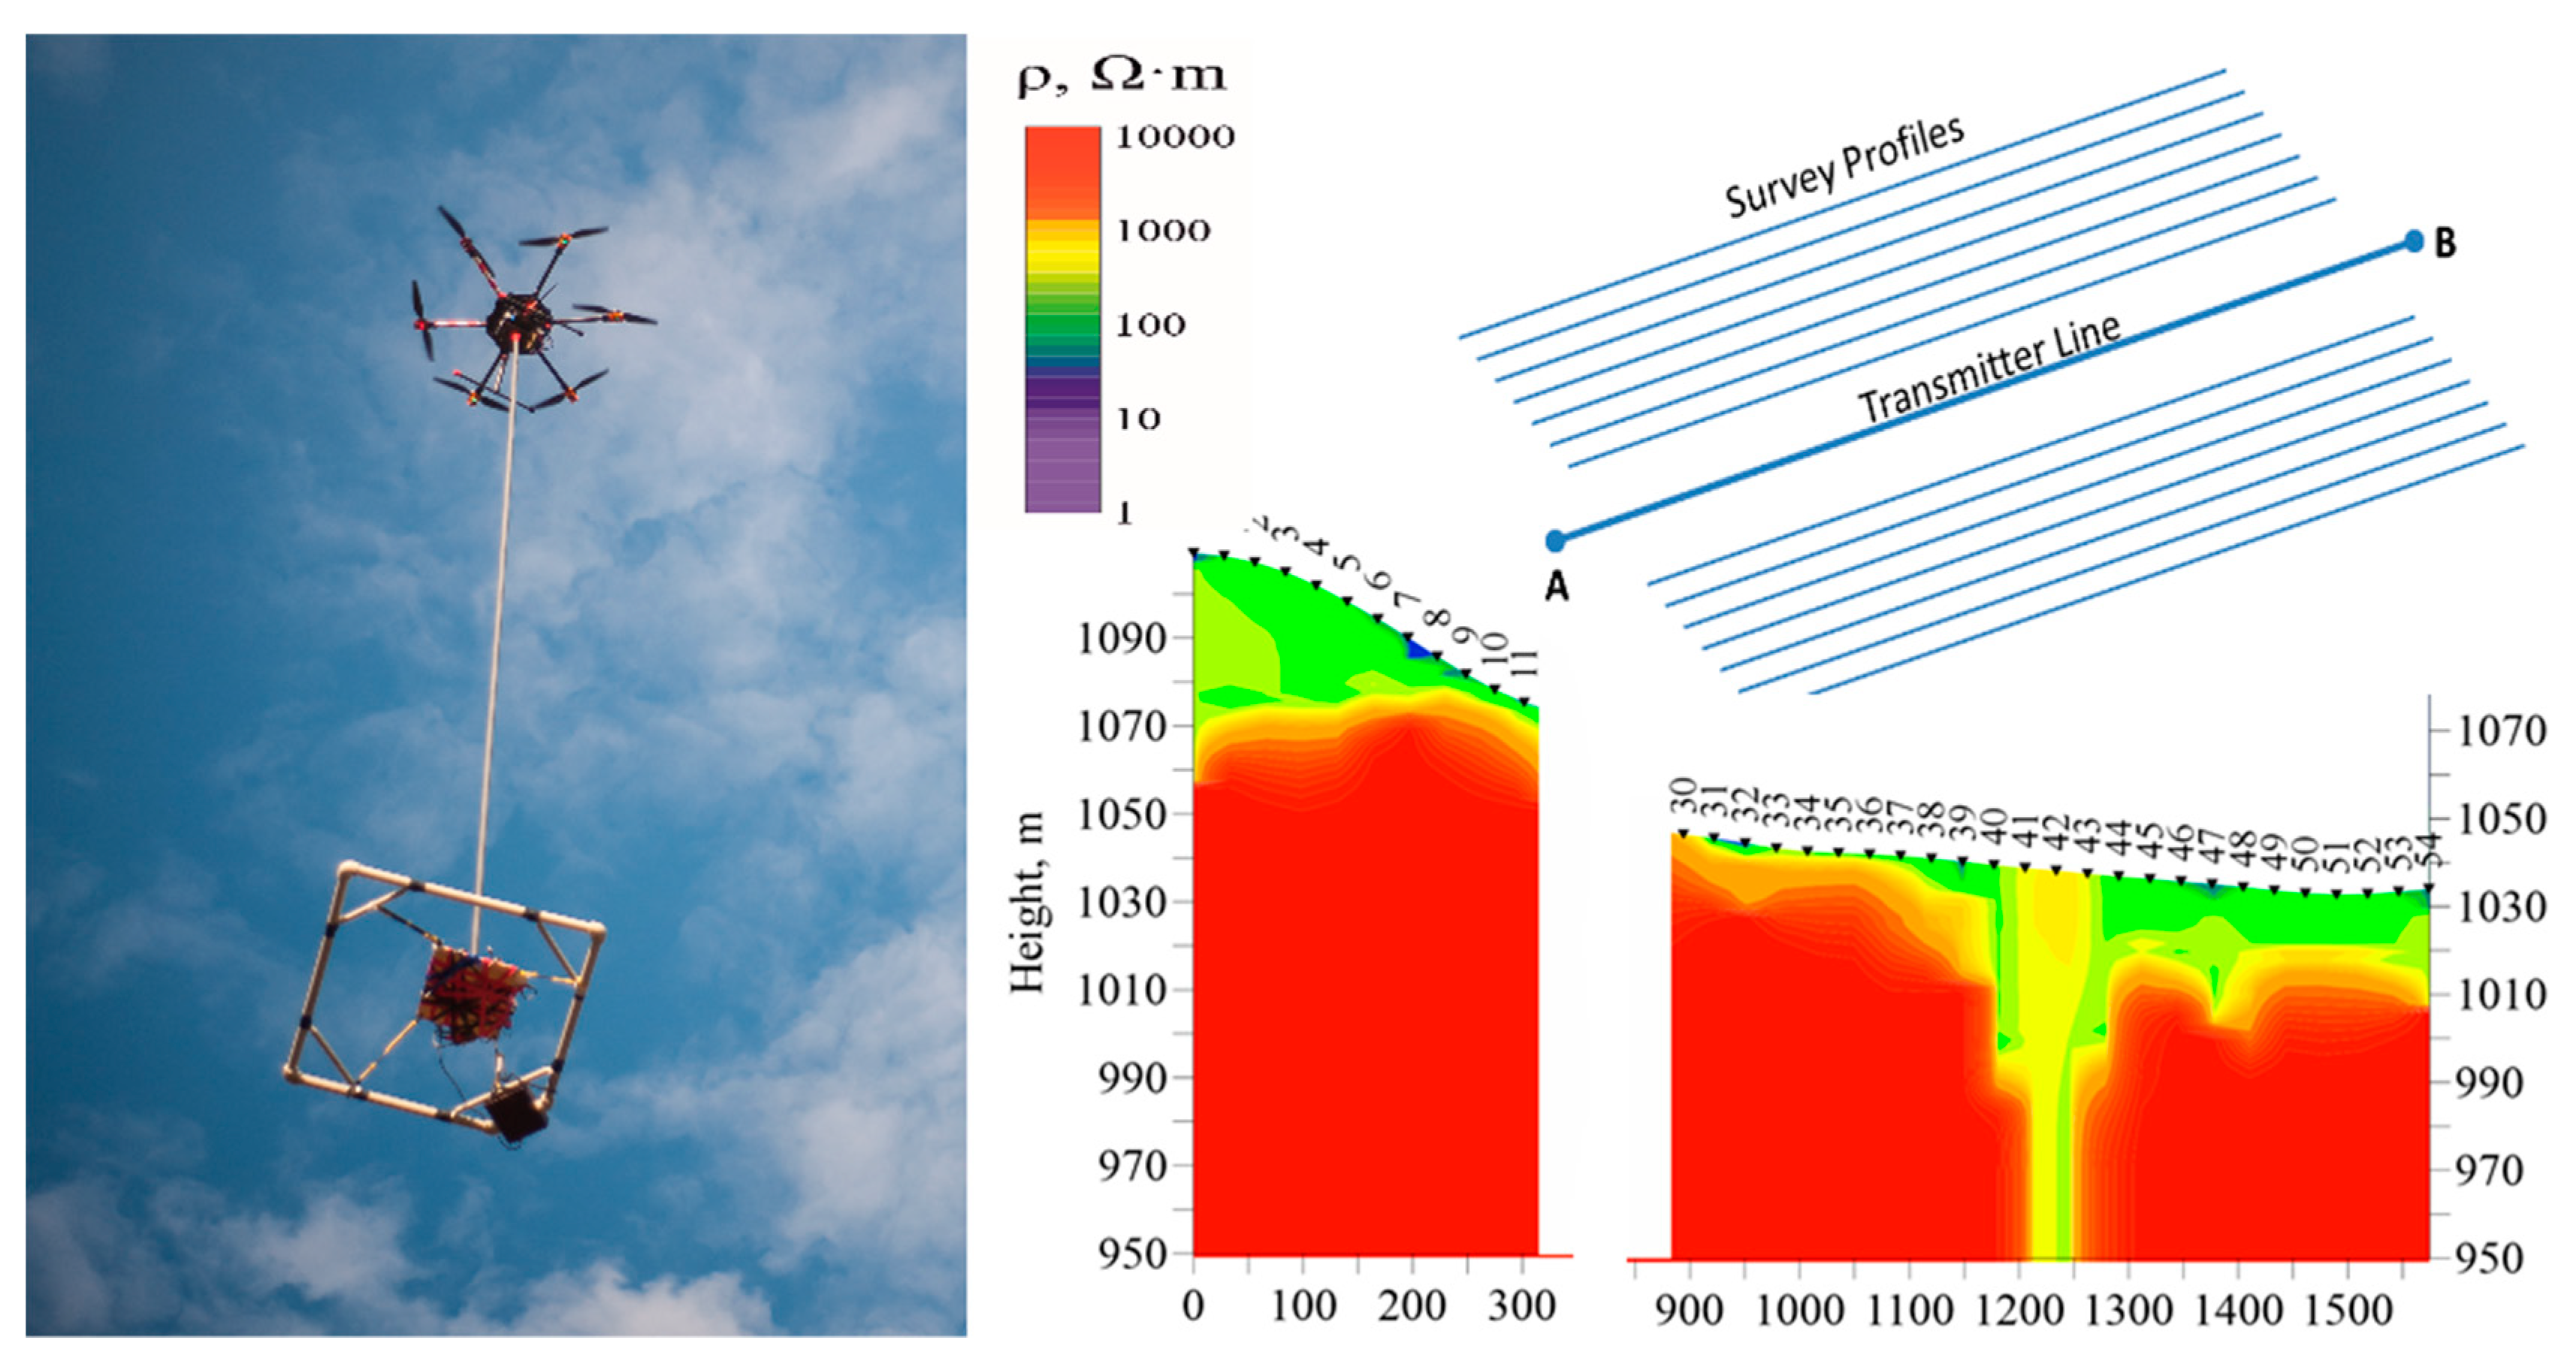
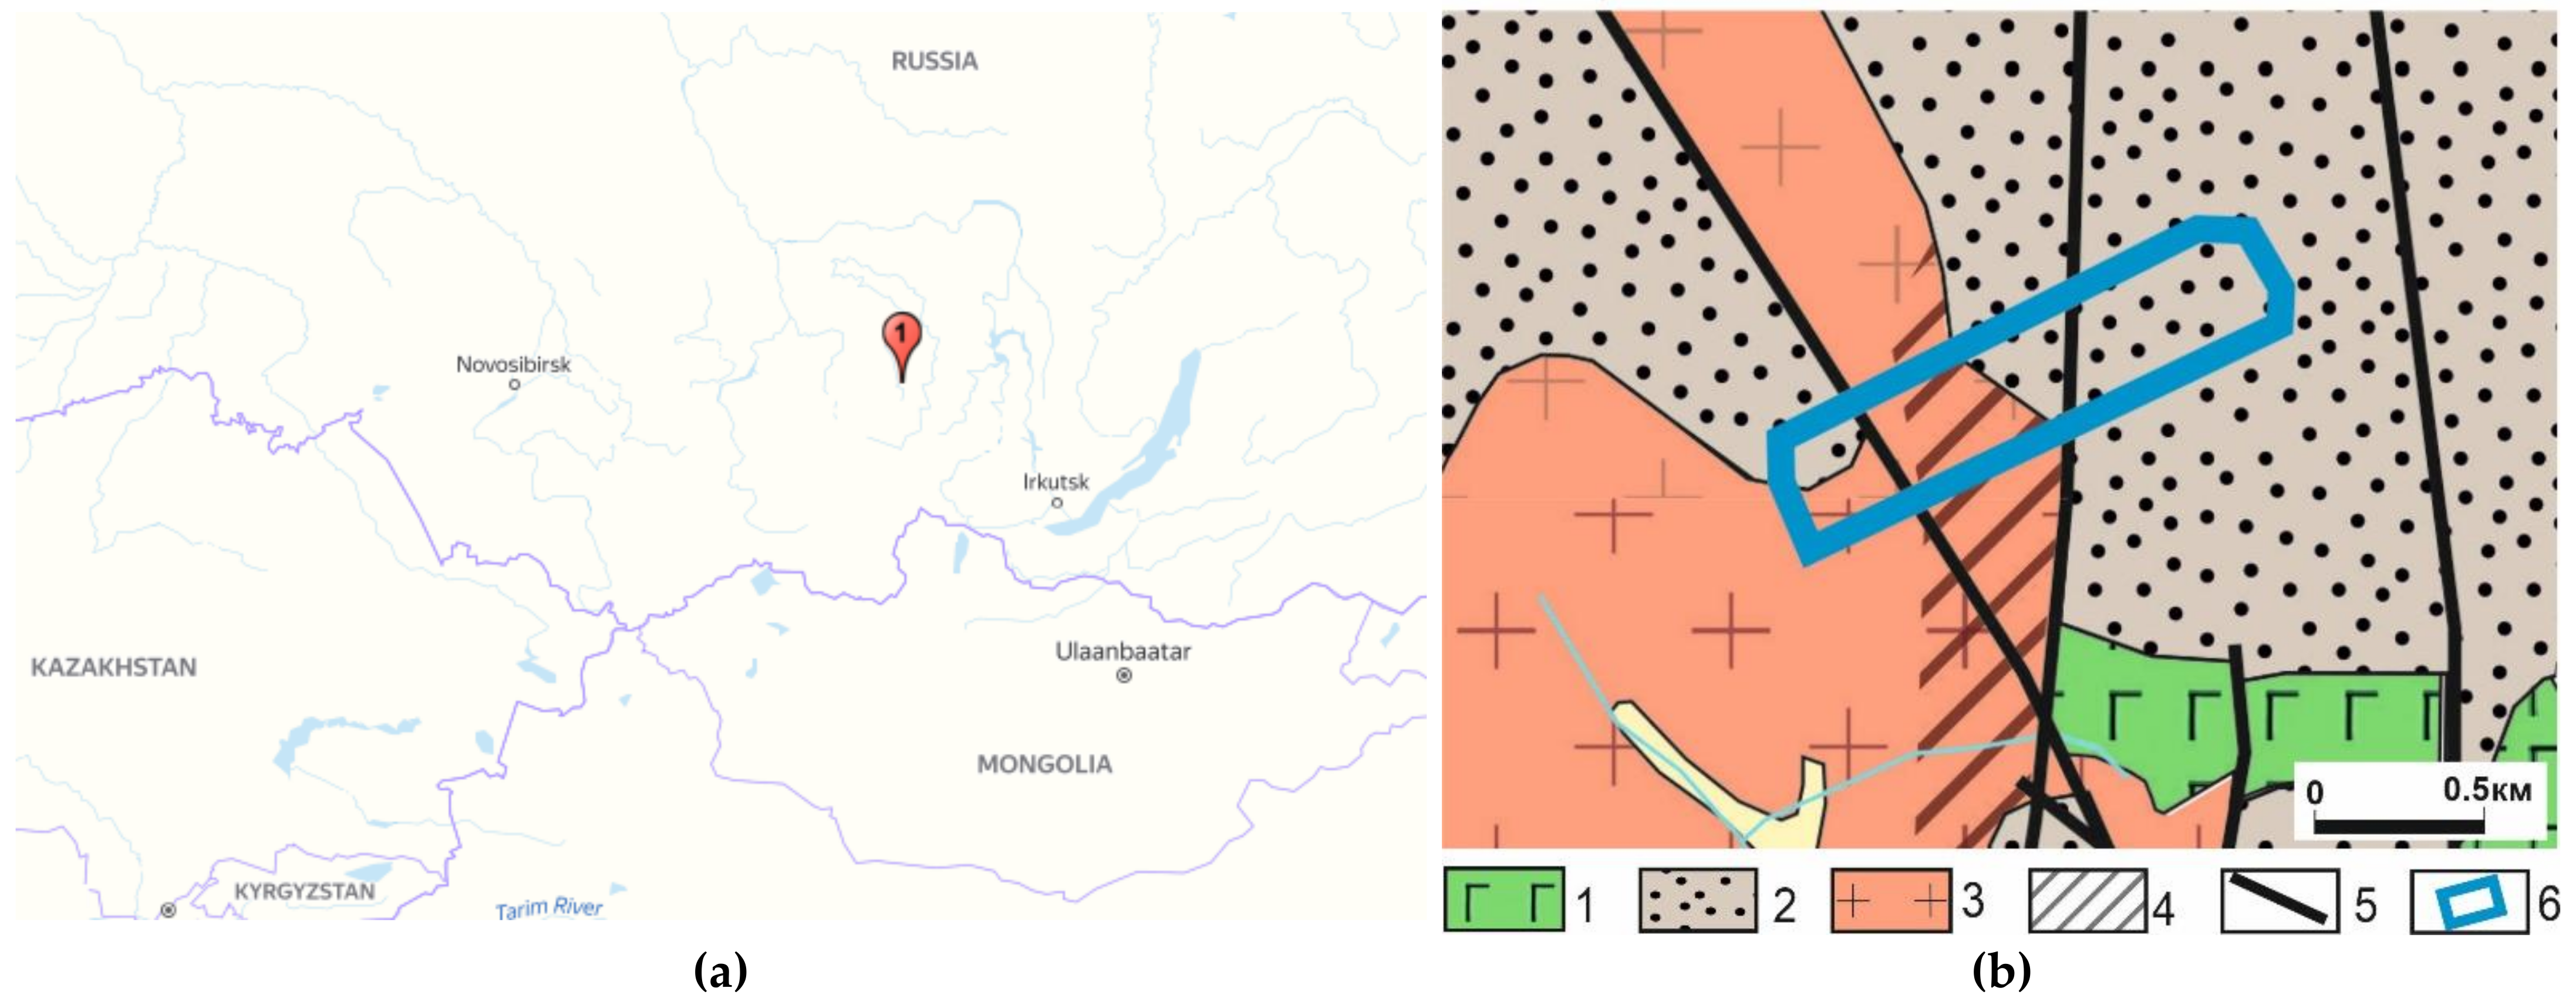
The area is located within one of the promising uranium provinces of Eastern Siberia (Russia), in the foothills of the Eastern Sayan (
Figure 7). The area is overgrown with dense forest, pedestrian permeability is difficult due to steep slopes, rocky talus (on the satellite image they appear in white under the crowns of trees) and thickets of bushes. Difference in height at the area from 980 to 1070 m.
There are no exact coordinates of the area boundaries, because uranium in Russia is a strategic mineral. The features of the geological structure of the area are described in more detail in the previous publications of the authors [
5], in this work the geological situation at a specific area of work will be briefly described (
Figure 7b).
The fieldwork area is formed by rocks of two stratigraphic units—a granite basement and a partially eroded cover, metasedimentary deposits (sandstones). According to logging data on already drilled areas within the study area, the resistance of sandstones is significantly lower than resistance of granites. Electrical prospecting using the UAV-TEM method was carried out in order to clarify a priori ideas about the geological structure of the area, since the basic cartographic materials are very inaccurate—for the entire territory of Russia there are maps only at a scale of 1:200,000, real geological boundaries, zones of tectonic disturbances, etc. may differ significantly, especially given the low degree of bedrock exposure. According to the geological map, it is expected that in the central part of the area the cover of sandstones is eroded to the granite basement, and the thickness of the cover, marked at the western and eastern boundaries, increases in the directions to the northwest and southeast. However, since the sedimentary cover corresponds to elevated relief forms (which is noticeable in the western part), and the eastern part is in the lowland, it seems that in fact the boundary of the stratigraphic unconformity is not located in the area, but east of it, or the thickness of the cover in this location is minimal. An error in determining the position of geological boundaries of several hundred meters is quite possible, given the scale of the geological map. However, in this regard, it became necessary to more accurately map the boundary of the structural unconformity between the granite basement and the sandstone cover, as well as to clarify the scheme of tectonic faults. Due to difficult pedestrian traffic and problems with galvanic grounding, it was decided to perform this task using the developed UAV-TEM complex.
A dirt road runs along the center of the area. A transmitter line 2 km long was deployed along it. The current strength was 0.87 A, a 4 kW gasoline generator was used, 15 electrodes were grounded at each end of the transmitter line.
The survey was carried out at a speed of 7.5 m/s at an altitude of 40 m under the sensor, with detailed flow around the relief. The distance between the survey lines is 40 m. Control measurements were carried out along the opposite and orthogonal routes. Orthogonal routes were also necessary to determine the distance at which the maximum departure from the transmitter line is possible for a given installation geometry and current strength. The closest to the transmitter survey line is 30 m away from it. The survey line scheme is shown in
Figure 8.
The survey was completed in fo4ur hours, excluding the time required to deploy the transmitter. The total volume of the survey was over 20 km, taking into account the control and orthogonal lines.
The curves of transient processes (sounding curves) were reduced to a grid of 15 × 40 m, that is, at a flight speed of 7.5 m/s, only two actual records of the transient curves were averaged per one point of the final vector layer. However, it turned out that due to the high stability of the platform with an induction sensor (when the UAV had already reached cruising speed), the curves of ordinary and control observations had a fairly good convergence at times up to 100–130 μs (
Figure 8b), despite the fact that they were represented by only a few units of points (due to the low sampling rate of the ADC). Thus, the achieved sounding depth in this case was about 100–120 m. The measurement data obtained at the time of acceleration and deceleration of the UAV, or after its turn on the survey line, mostly turned out to be substandard, since it was difficult for the UAV to quickly stabilize a load with a floating center of gravity, comparable to its weight. Areas with substandard data were excluded from processing. They included the central part of the section, where the UAV flew in and out on missions, and the three nearest to the transmitter survey lines (No.1,2,3), where the influence of the transmitter was too strong. On survey line 4, the the quality of the data was the worst found acceptable for processing. (
Figure 8a and Figure 10a). Thus, it turned out that the closest survey line must not be closer than 70–80 m to the transmitter line. In fact, only five of eight survey lines turned out to be suitable for processing (
Figure 8, Figure 10 and Figure 11).
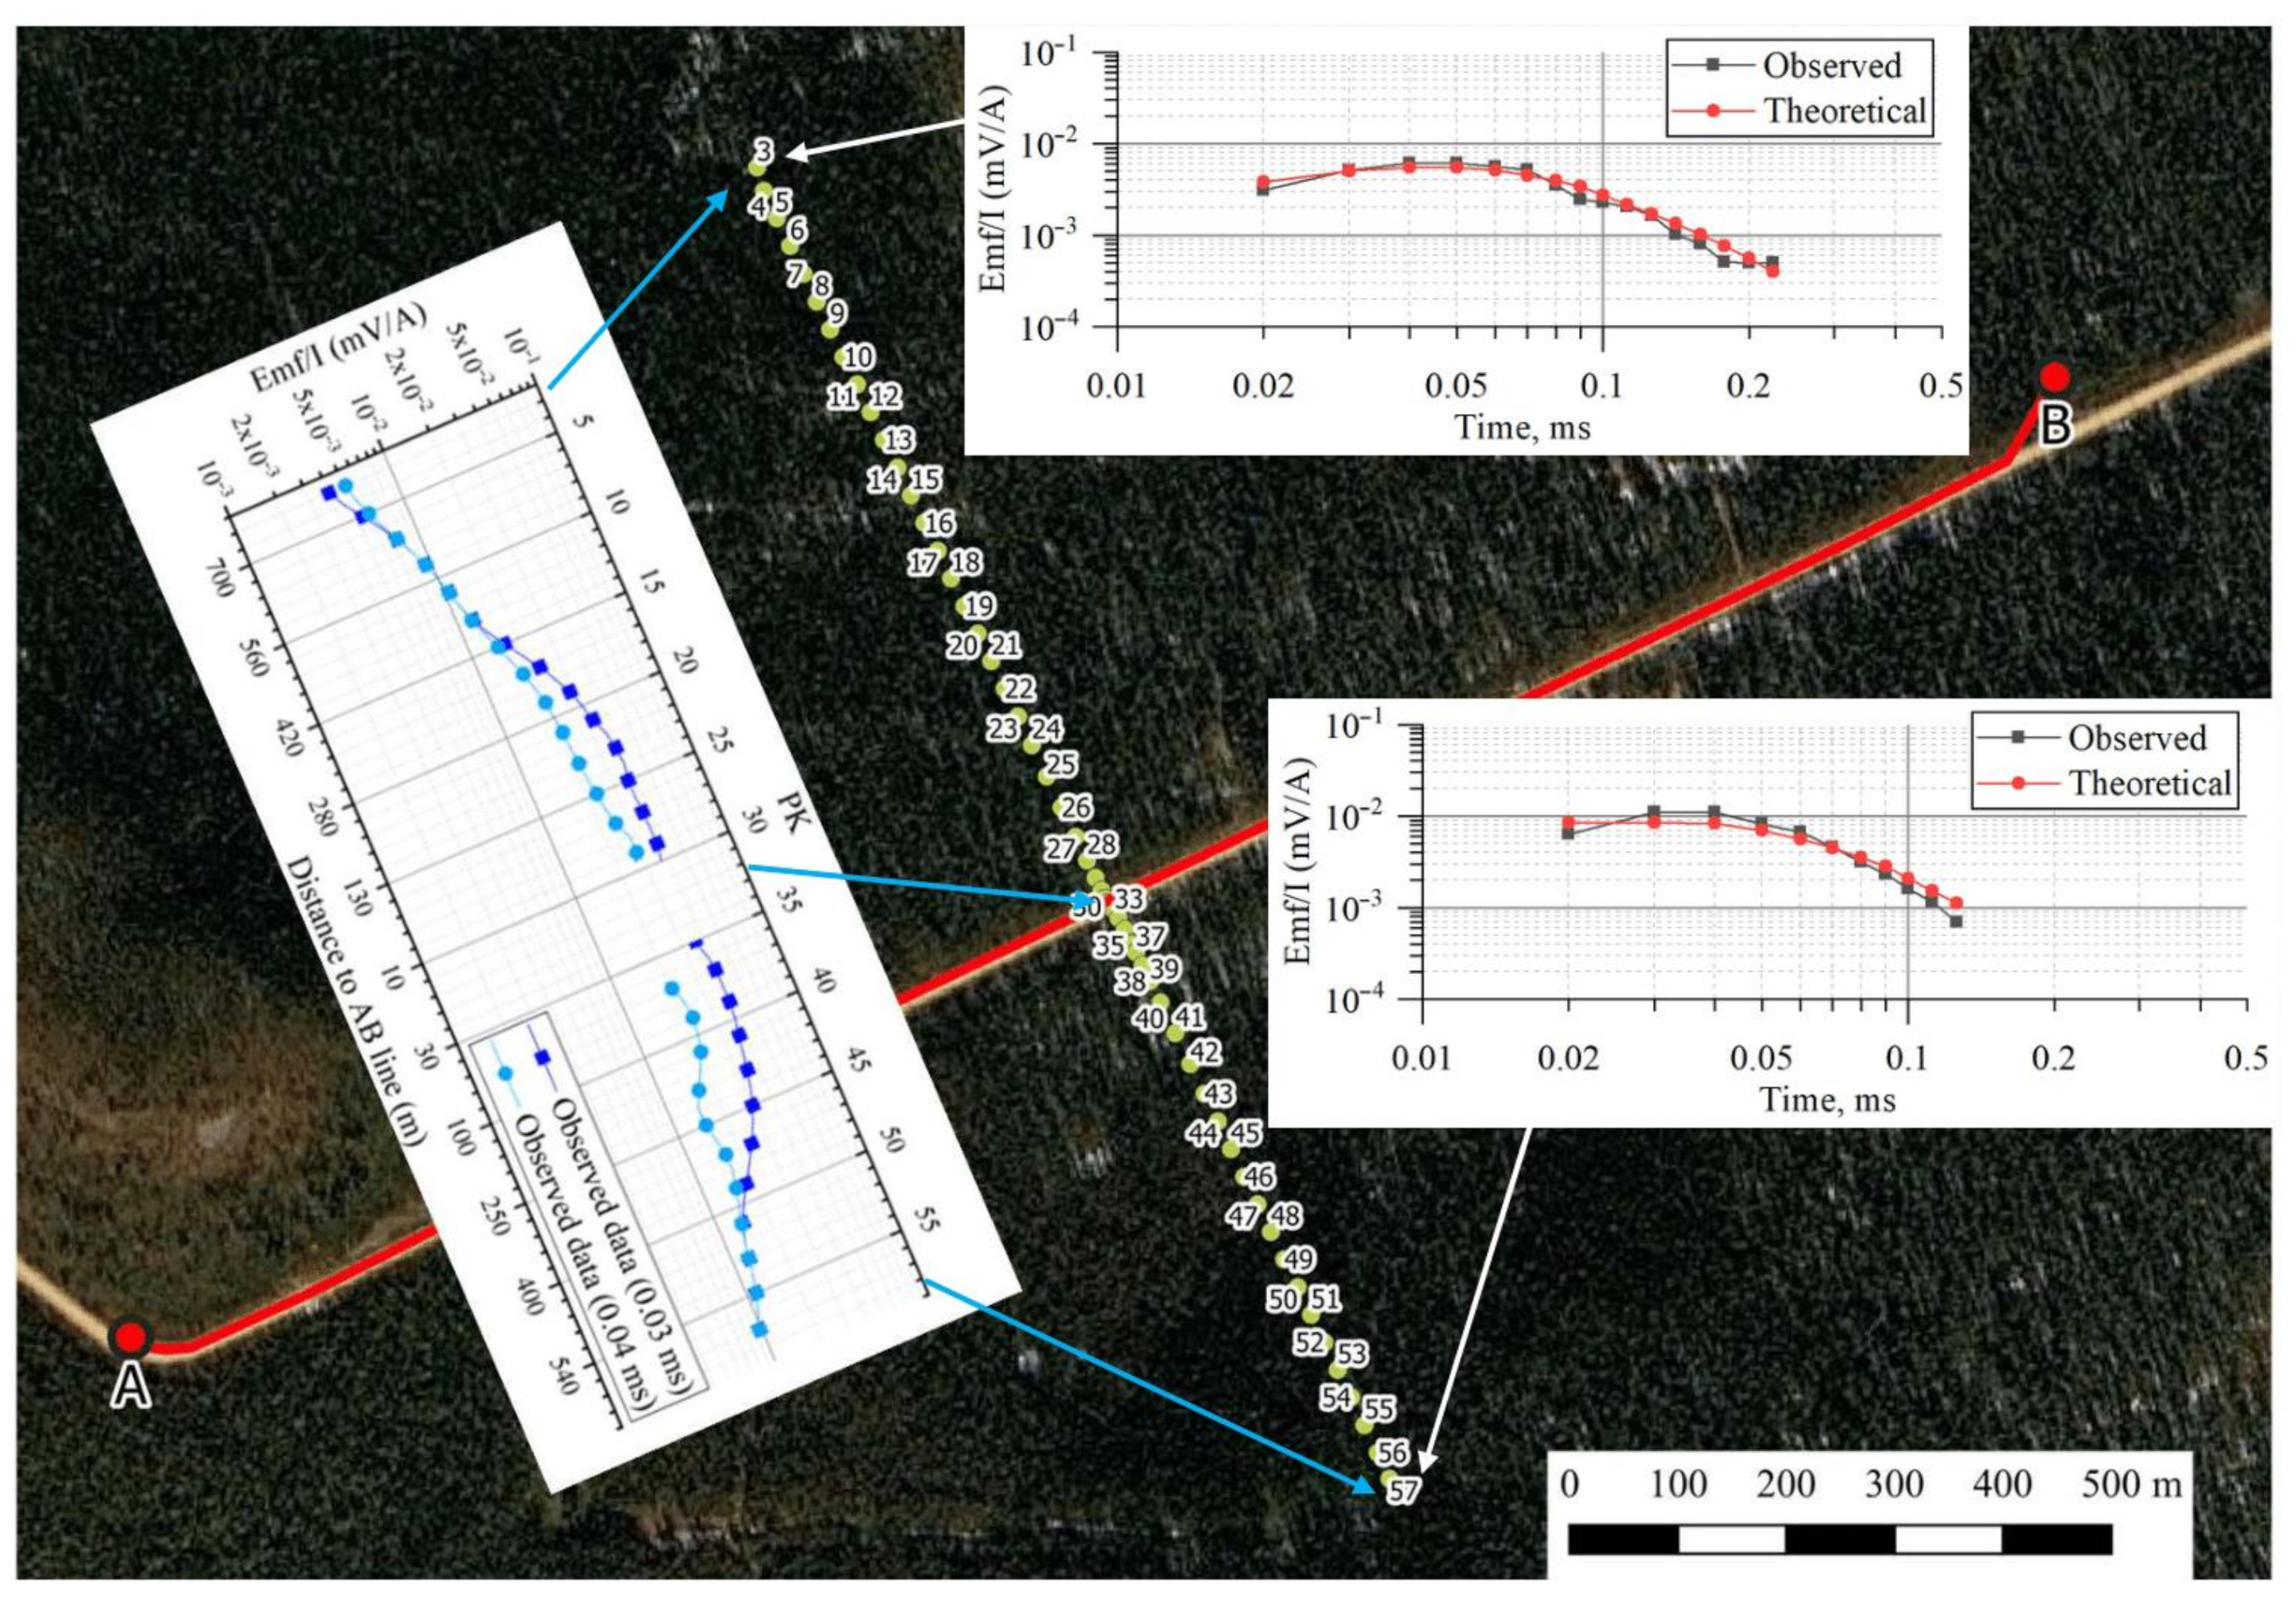
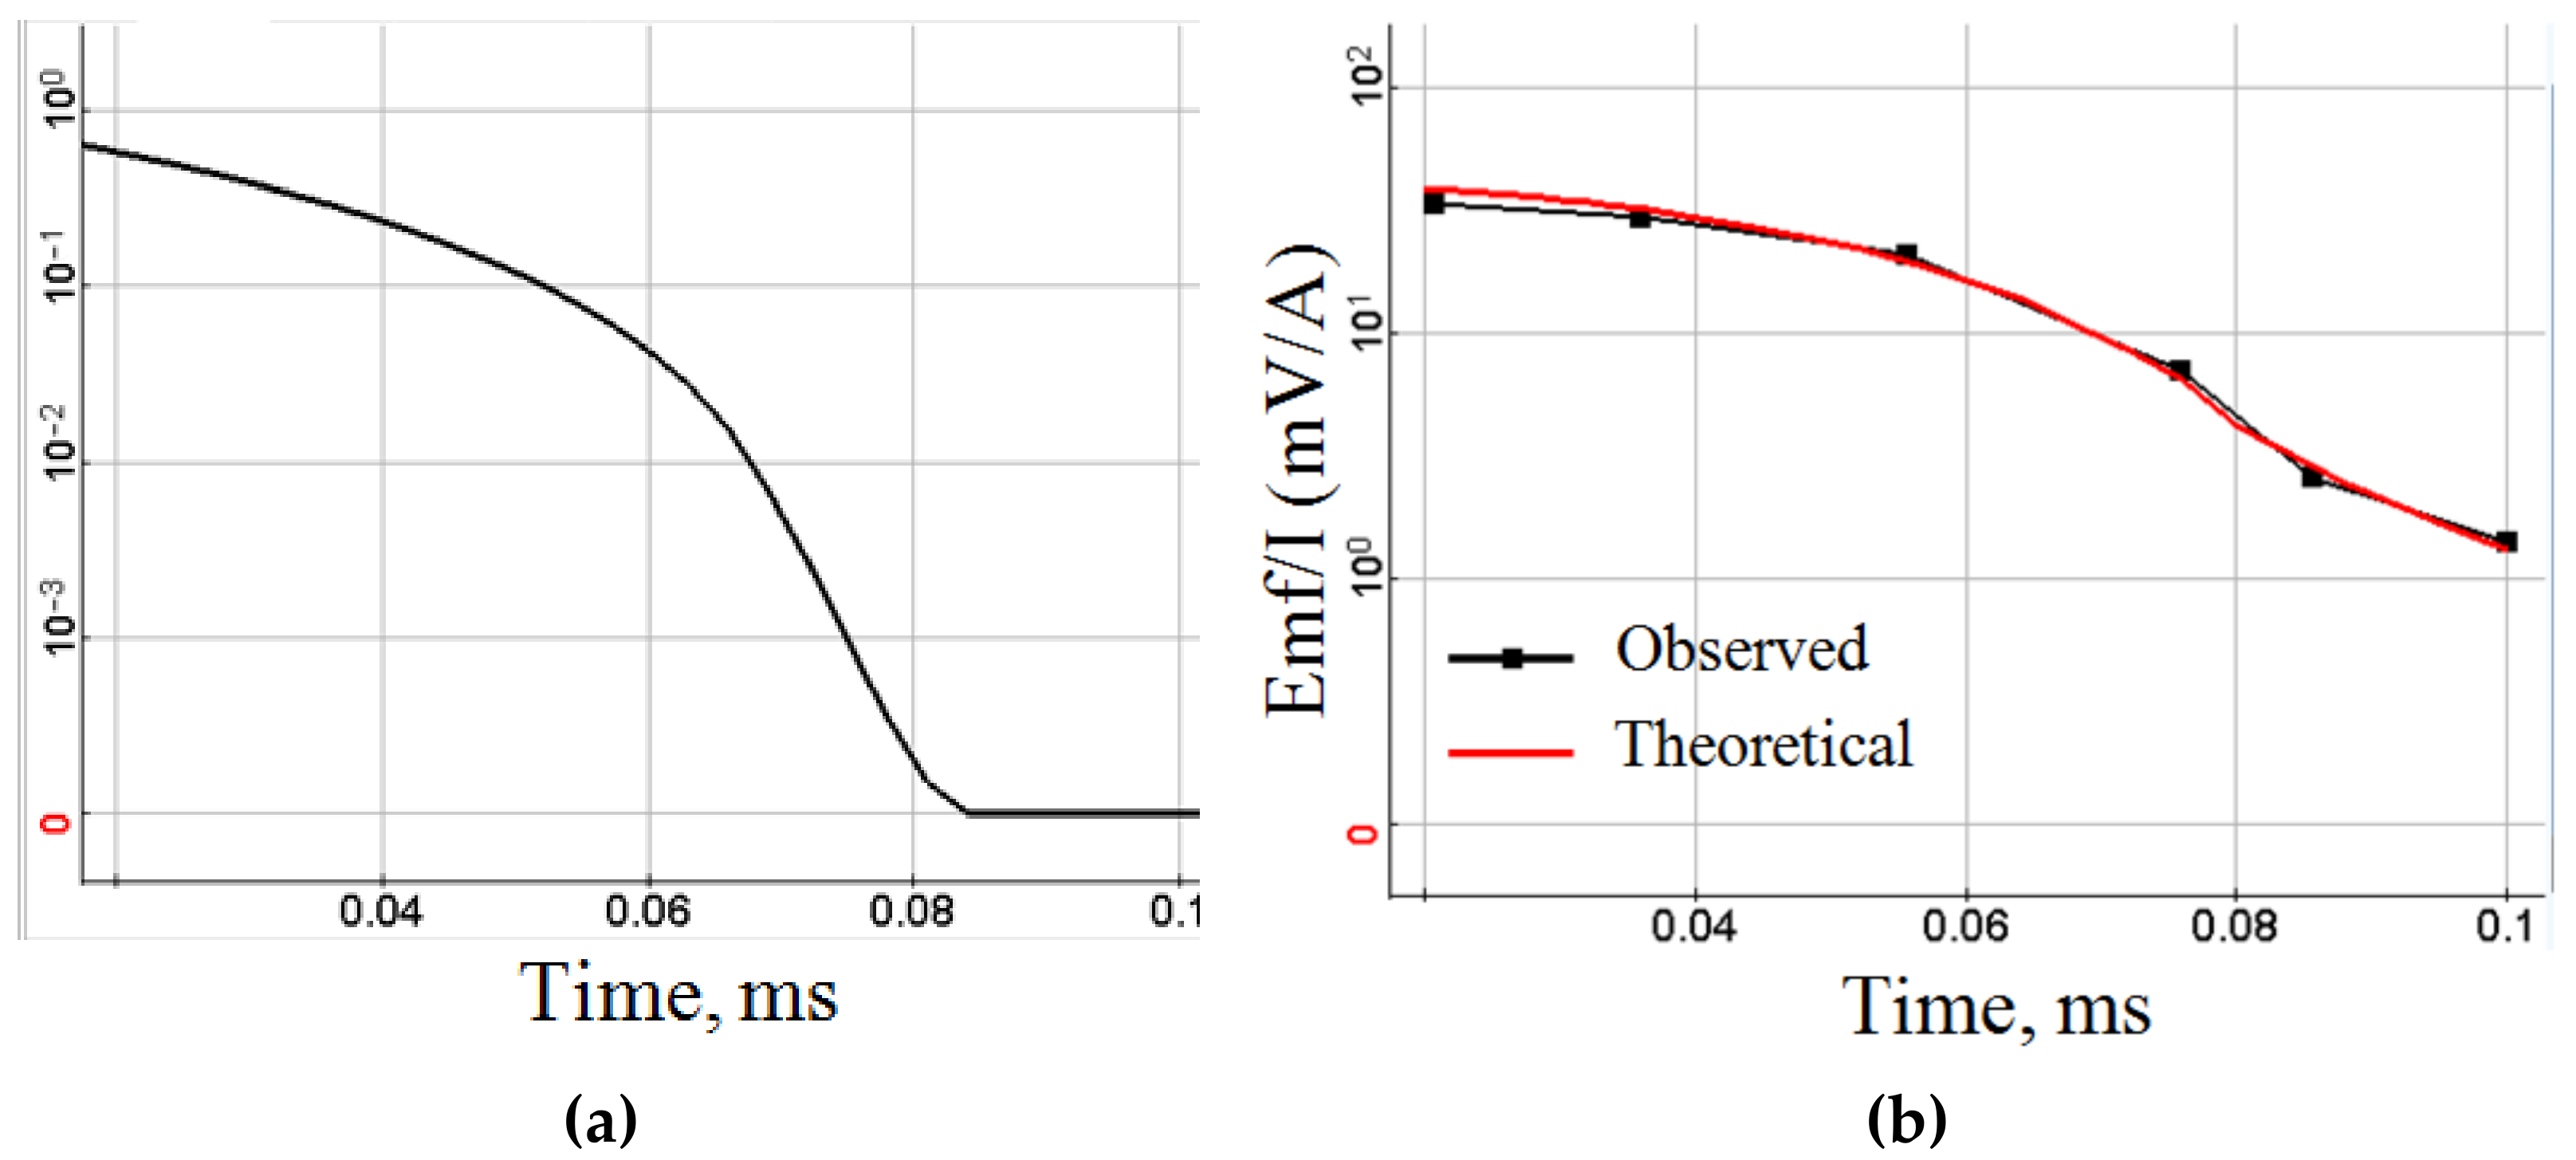
An important parameter of the effectiveness of the developed UAV-TEM technology is the maximum allowable distance to which the UAV can move away from the transmitter line, since the survey area that can be performed using one take-off point depends on this parameter. The orthogonal lines were about 600 and 800 m long.
Figure 9 shows the measured sounding curves for points at their ends, as well as a graph of signal changes at time delays of 0.03 and 0.04 milliseconds. It is shown that the level of the recorded signal at the extreme points was not less than 0.005 mV/A, it was possible to invert obtained curves with sufficient accuracy. The obtained results proved that at a distance of at least half the length of the transmitter line, suitable signal was registered for processing, even in case of low current in the transmitter.
Therefore, the developed complex allowed us to perform a survey on a rectangular area with a short side length slightly less than the transmitter line length, and a long side length not less than the short side length. For simplicity, let us assume that this is a square, since it was not established at what distance the signal will be lost due to the insufficient length of the orthogonal survey lines. We should have made them longer, but authors did not think that with the current strength achieved, it was possible to obtain high-quality data at a distance of more than 500–600 m, the result obtained turned out to be better than expected. Thus, for example, with a transmitter length of 2 km, a survey could be performed on a square area of 1.8 by 1.8 km (3.2 km2), and with a length of 4 km—14.4 km2. An acquisition made a little before reaching the ends of the transmitter line, since in areas near the ground there were strong effects from field inhomogeneity. Classical land surveys with line-to-line arrays were carried out in the geometry of the mean gradient, only in the central third of the length of the transmitter line, and at a similar distance from it. This was very irrational, but it was done to simplify data processing. However, the Mars1D inversion environment allows modeling and taking into account the induction effects from the transmitter. It allowed us to perform a survey of the full length of the line and even beyond it, but at a distance of the first hundred meters from the ground points, the influence of the electrical grounding of the transmitter was too significant. It was possible to perform the UAV-TEM outside the ends of the line, but this further complicated the processing, and since there were no data confirming this position in this article, let us dwell on the fact that the maximum survey line length for the UAV-TEM was slightly less than the length of the transmitter line.
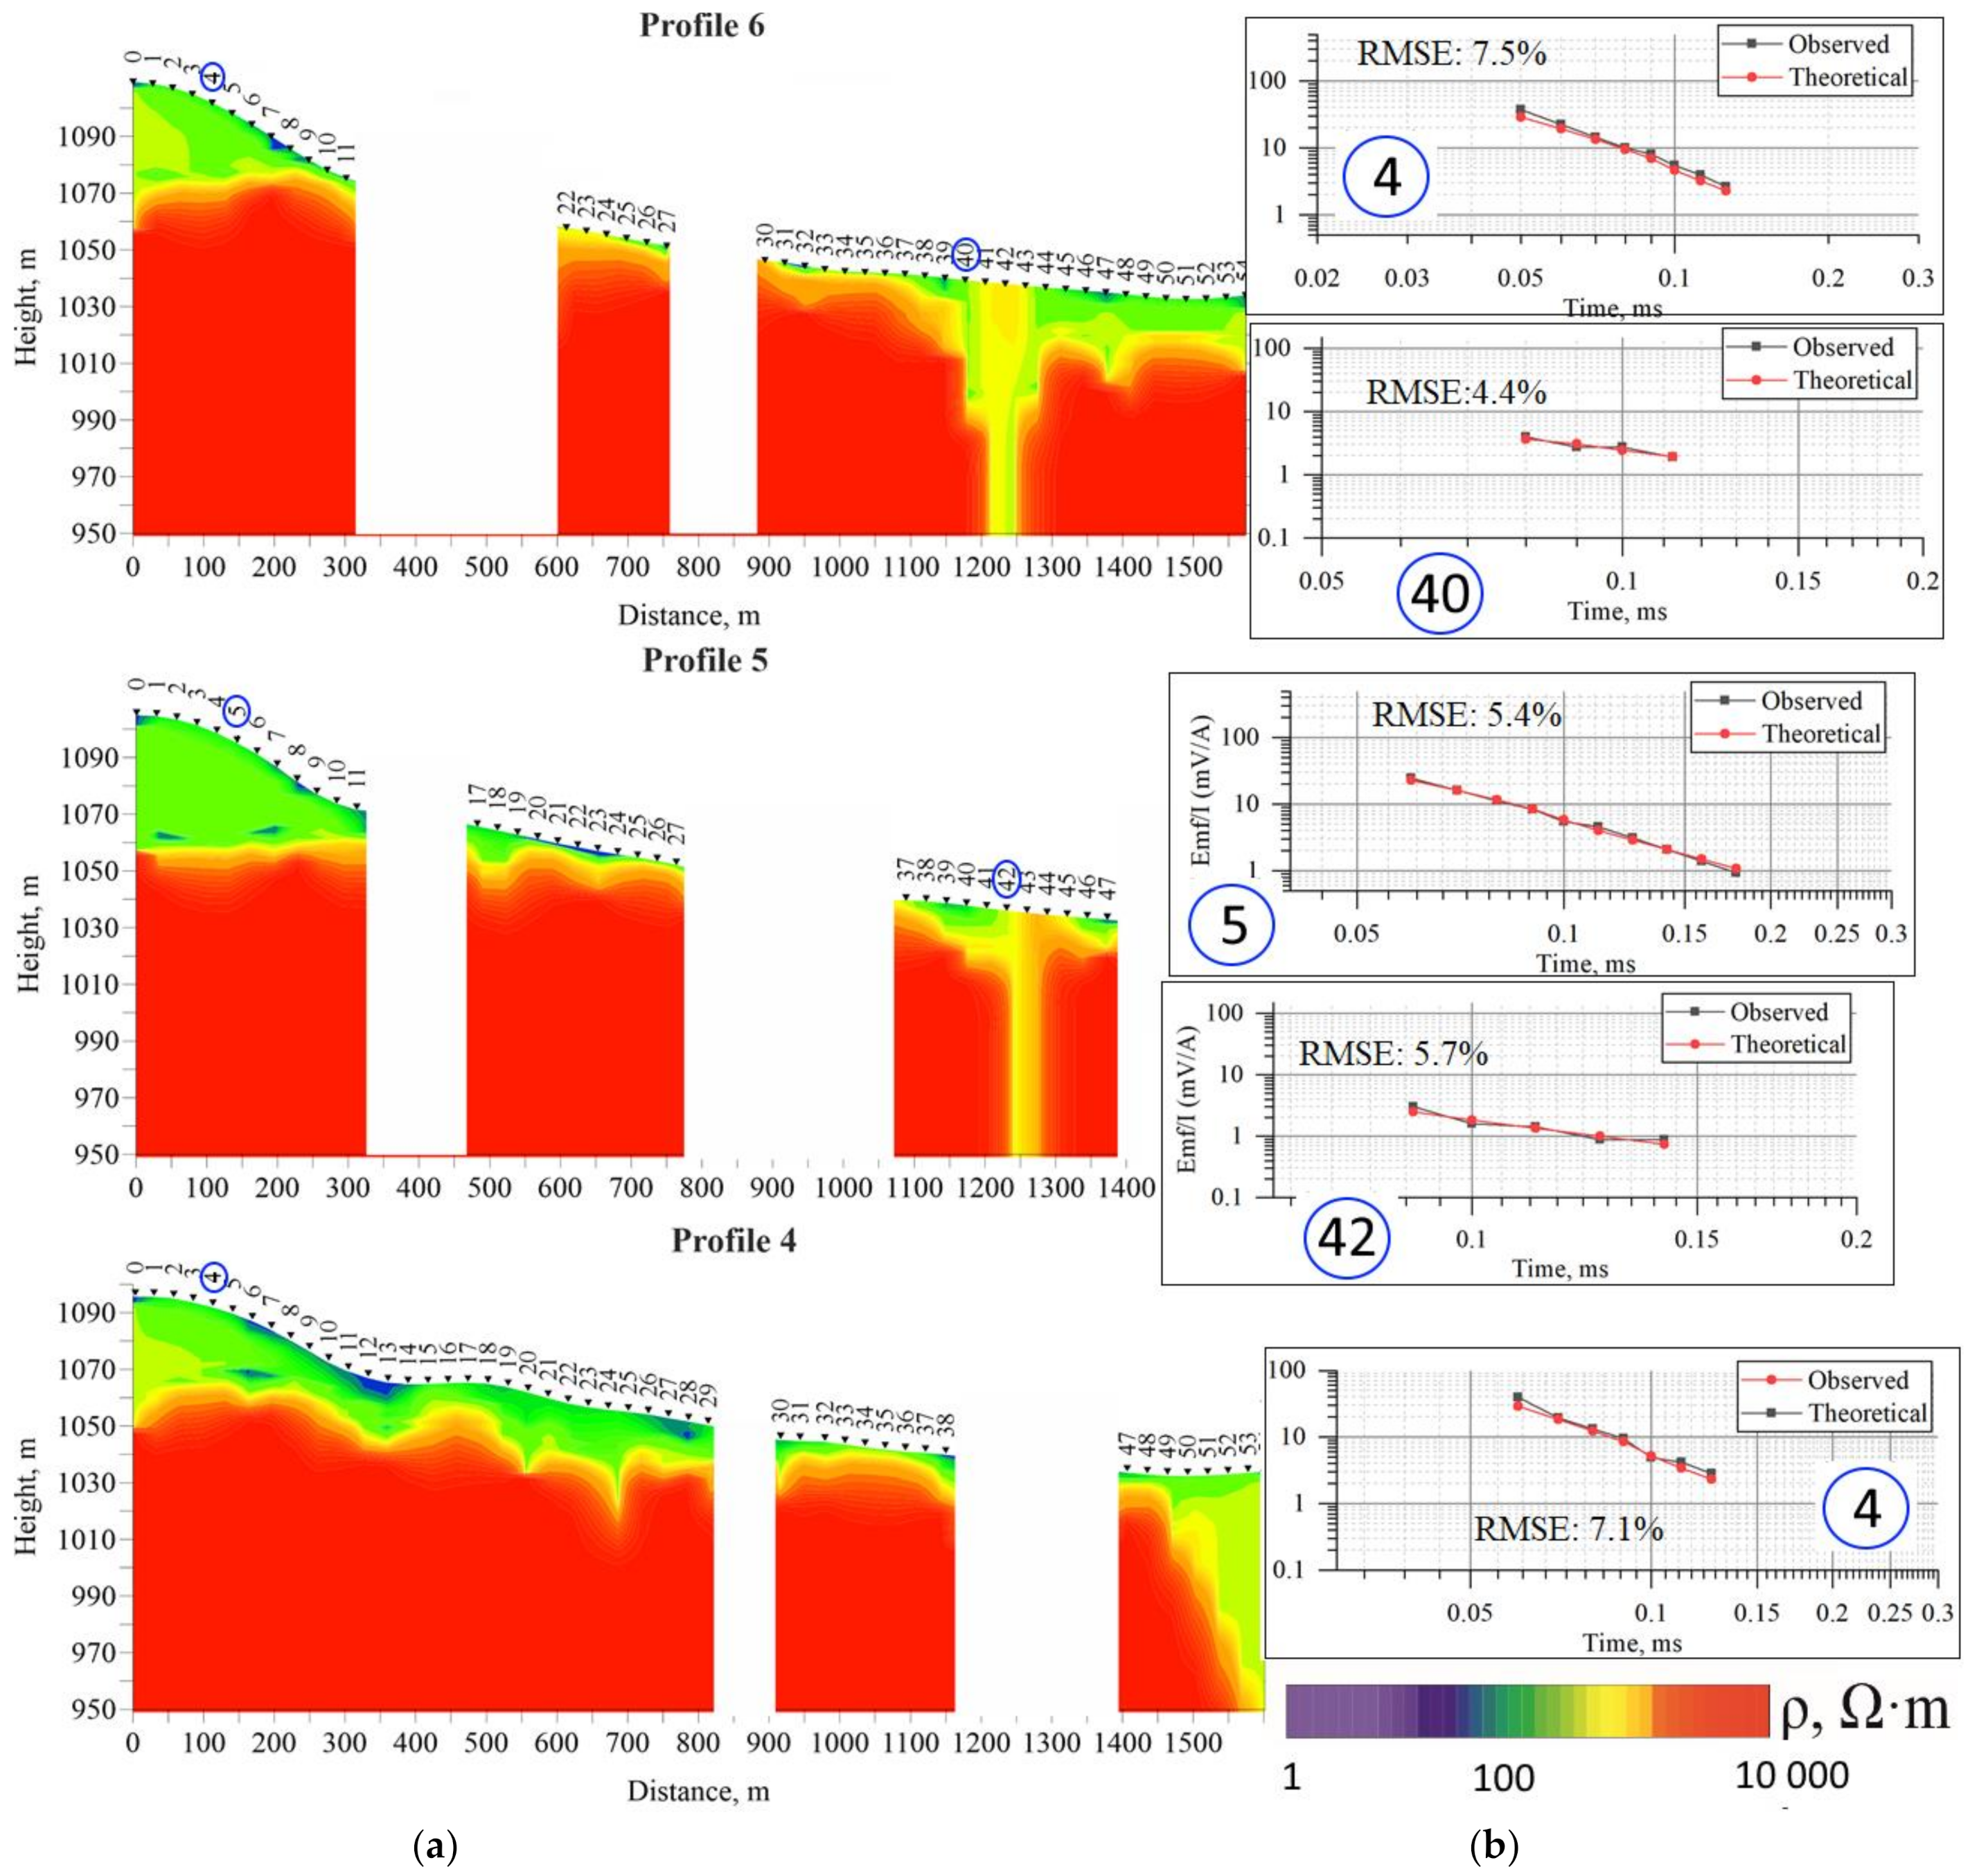
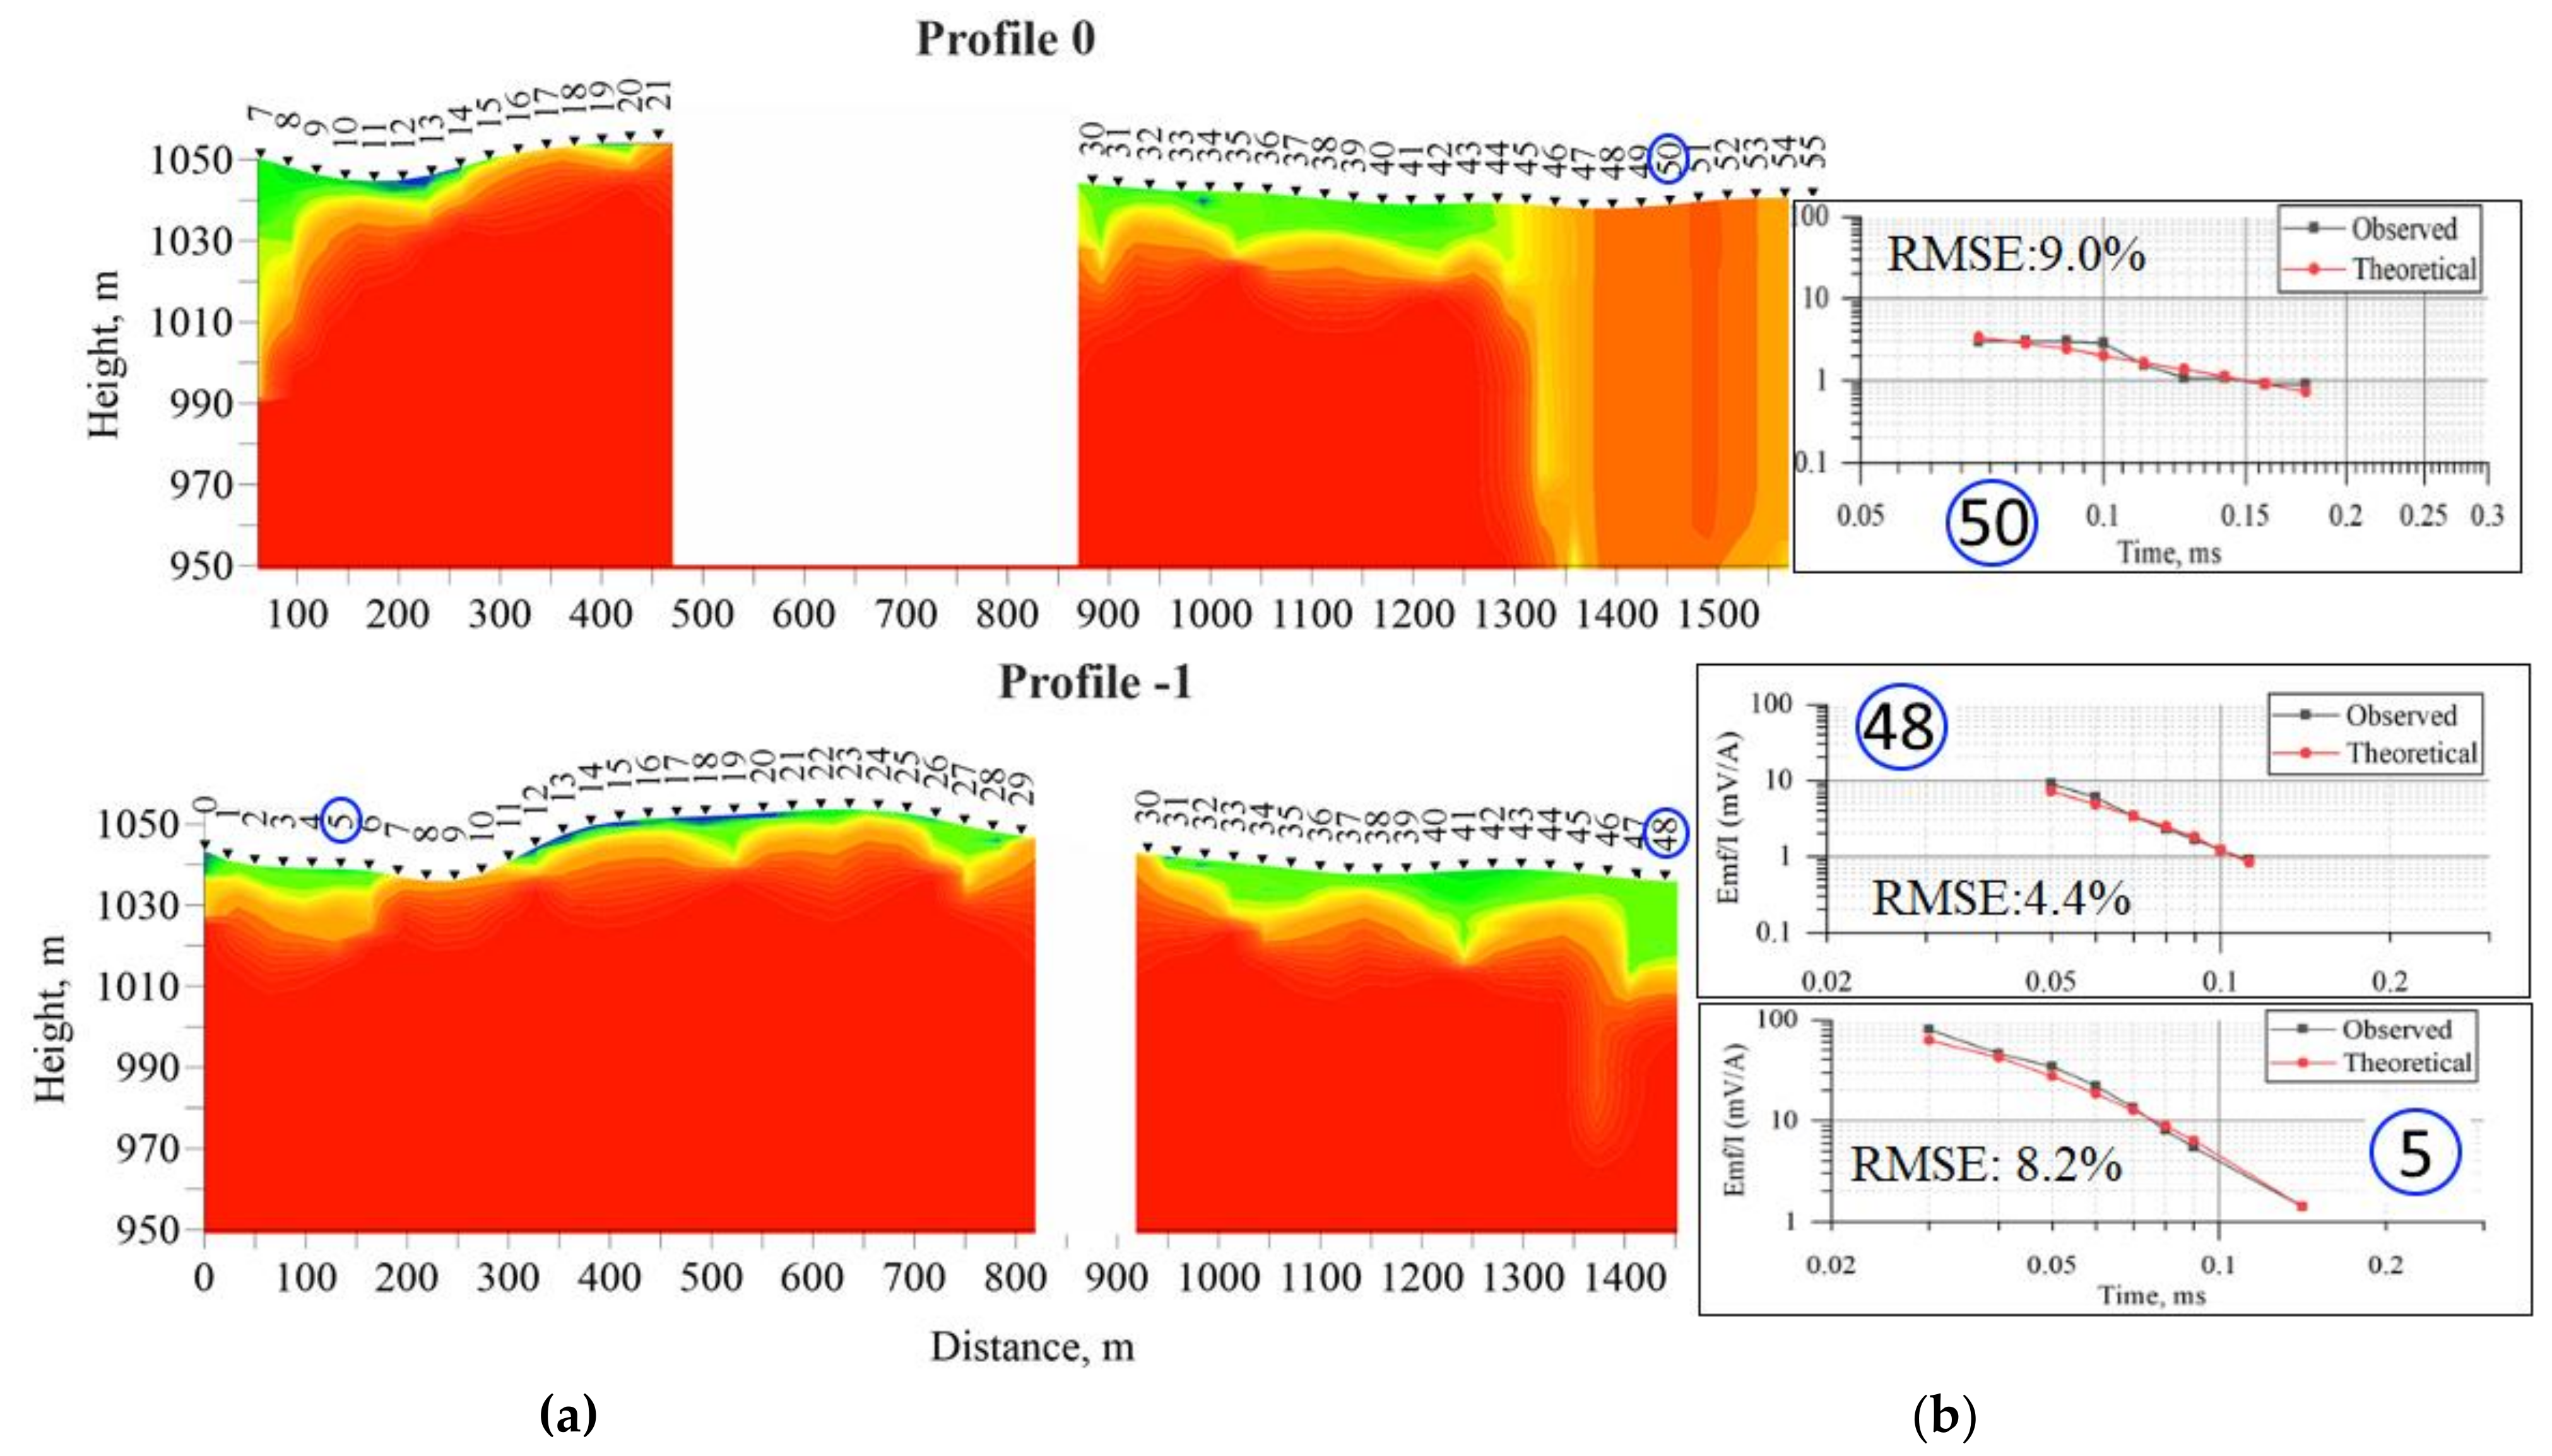
Based on the survey results, an inversion was performed in the class of 1D-models and geophysical sections were built according to the electrical resistivity parameter (
Figure 10 and
Figure 11). In addition to the sections and to substantiate the correctness of the solution of the inverse problem, measured and fitted curves for the characteristic sections of the section are given with an estimate of their convergence. It is important to note that the Mars1D software package does not allow one to take into account the inductive characteristic of the sensor and the shape of the current decay in the transmitter line after the pulse is off during modeling. Mars1D was developed for a line-to-line array with an emphasis on working with late times, when the effects of induced polarization, and therefore the early times were not taken into account in processing and the recorded time range was small—on average from 50 to 140 µs. Despite this, as well as the small number of points on the transient curve, suitable data for processing and inversion were obtained, and even characterized by a fairly good convergence of the observed and model curves fitted as a result of inversion (
Figure 10b and
Figure 11b).
The obtained sections allowed us to draw the following conclusions about the geological situation at the area. As expected, in the eastern part of the area, the sandstone cover most likely began to appear only on the northernmost survey lines and its thickness is insignificant. On the other hand, at this edge of the area, an anomaly was noticeable, typical for dislocation with a break in continuity (profiles 0 points 45–54, and profile 4, points 49–54) of the sub latitudinal direction. It should also appear on the −1 survey line, but the eastern part (points 49–54) of this survey line fell on the area after the UAV’s turn, and therefore the data in this place were discarded. However, at the last good measurement point (48), there iwass also a tendency for the resistance to decrease. On the geological map, a little to the south of the area, a tectonic disturbance that is suitable in the direction is noted, which was not traced to the boundaries of the area, but most likely was actually present. Another element, which can be interpreted as discontinuous tectonics, but of a significantly lesser thickness, was noticeable on survey lines 5 (points 42–43) and 6 (points 41–43), located to the north of the transmitter line. At the same time, the western part of the area was mapped by the predecessors quite accurately—in the western part of survey line 0 (points 7,8), a sedimentary cover began to appear with reduced values of resistivity, and then on survey lines 4,5,6 (points from zero to 10–15) its thickness increased synchronously with an increase in the elevation of the relief. The maximum depth of the structural unconformity boundary within the study area reached approximately 60 m and was located on the northwestern edge (profile 6 and 7 points 0,1). As a result, clarifying changes were made to the a priori geological map (
Figure 12).
Thus, despite the shortcomings of the used prototype, the main one of which was the long time for stabilization of the measuring platform after UAV maneuvers, leading to the loss of some data, and the low frequency of pulses, it should be recognized that this technology, even in its current form, allowed obtaining data suitable for solving real geological problems. Even taking into account the discarded data (which could have been avoided by taking out the sections of turns, acceleration and deceleration of the UAV beyond the studied area), several hundred sounding points were obtained in 4 h. For comparison, in the case of terrestrial survey using the TEM method in conditions of dense forest, it is usually impossible to complete more than a few points, the maximum is the first tens of points per day. Based on this, we believe that the cost-effective price of UAV-TEM surveying should be half the price of terrestrial TEM surveying.
6. Modeling the Sensitivity of UAV-TEM Technology Based on the Obtained Data
Electromagnetic survey data obtained in a real case allows one to assess the sensitivity of the created UAS and simulate the effectiveness of its application in other geological situations.
Using the methods and 3D modeling programs developed by the authors [
28,
34,
35], a preliminary analysis of obtained data was carried out, the approximate front of the current decay in the transmitter line and the possible range of signal measurement were determined.
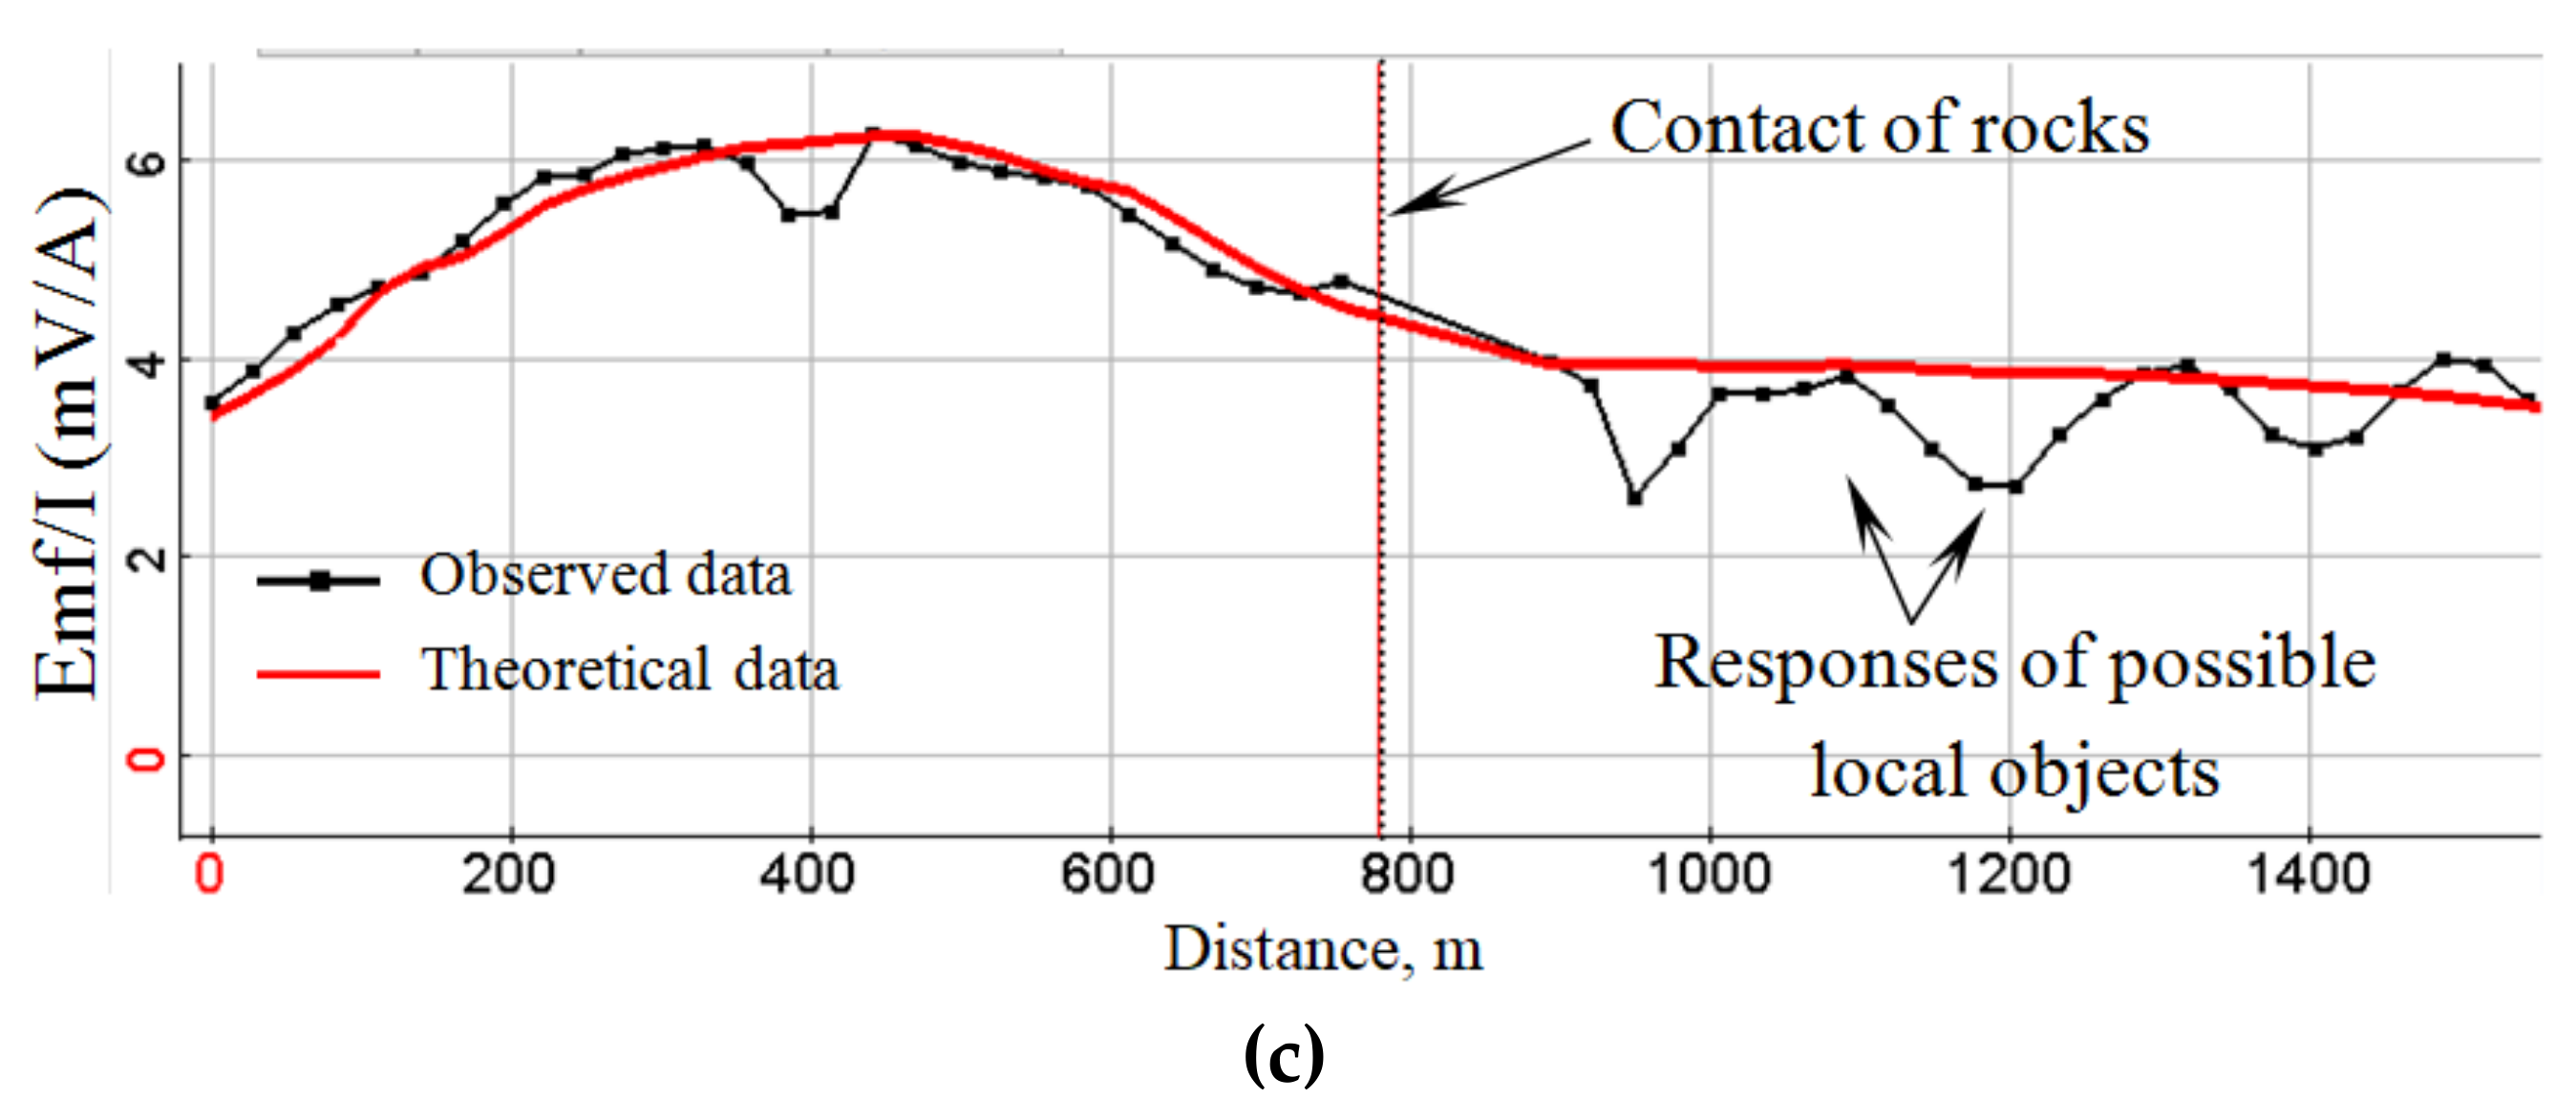
Figure 13 shows a graph of changes in the signal along survey line 3, which shows that in the range of 50–140 μs, this technology allowed us to confidently map the contact of environments.
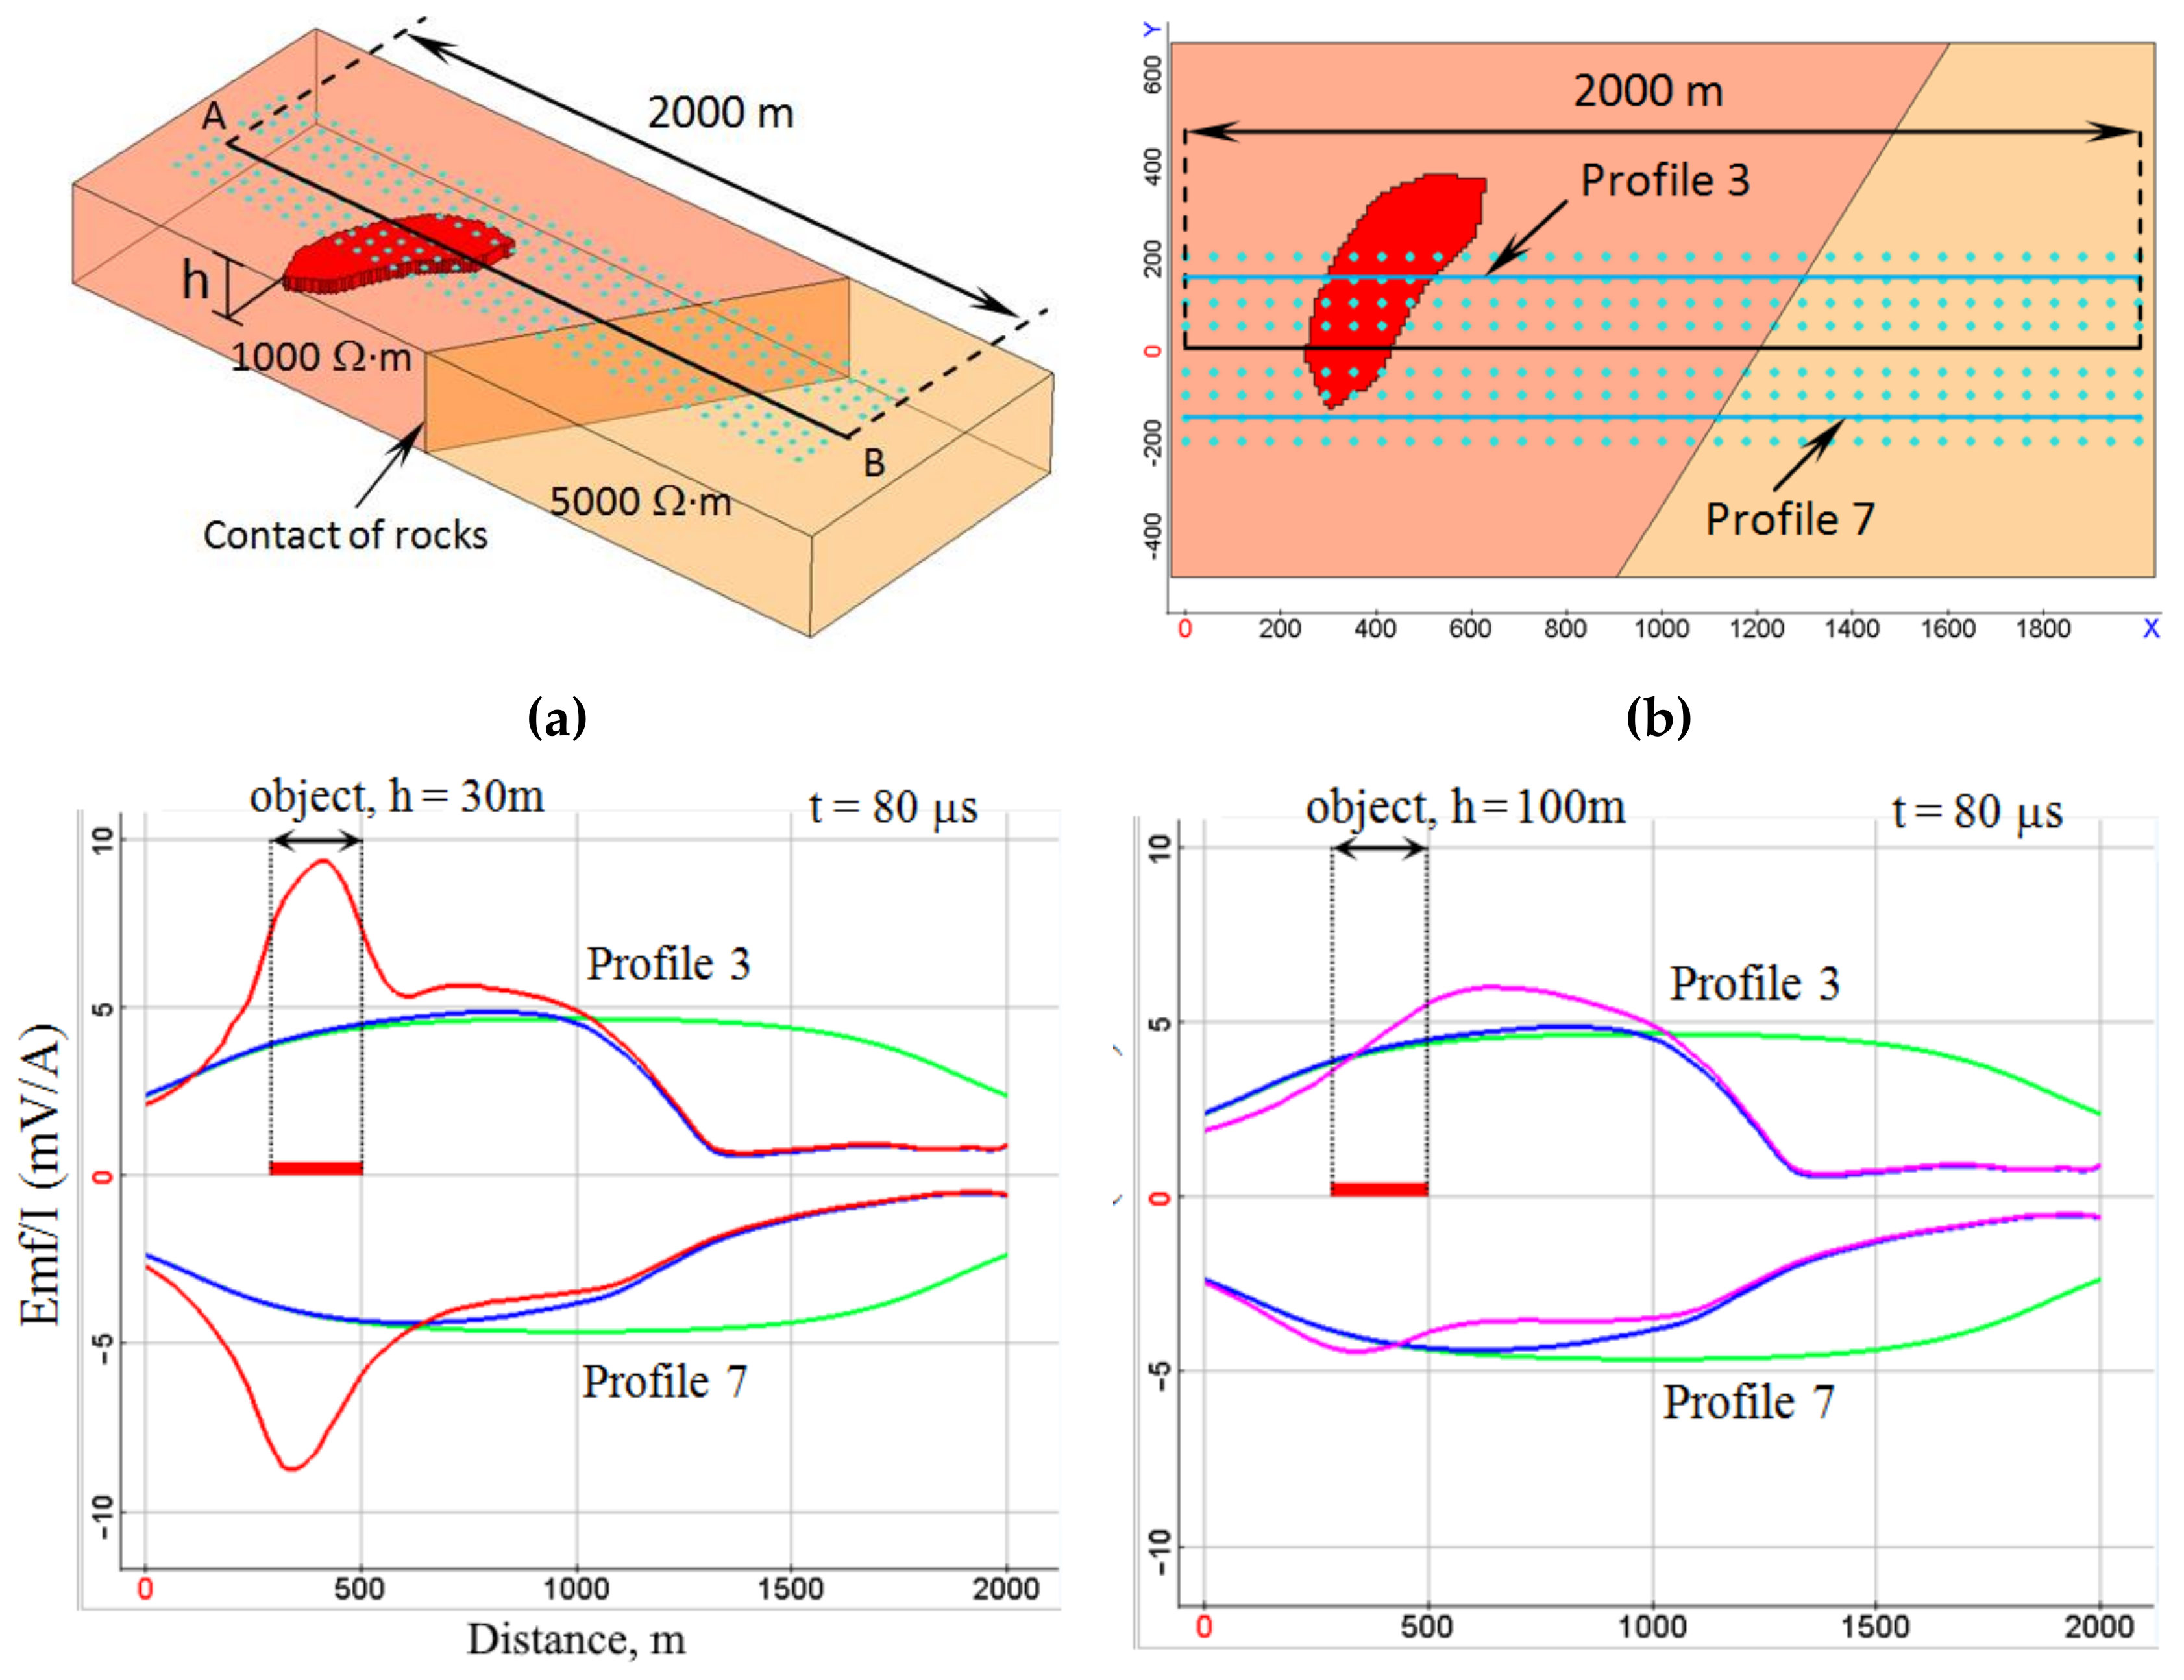
After that, 3D modeling was carried out in order to study the resolution of the measuring system, taking into account the characteristics obtained in practice. A three-dimensional model of the geological environment was created, which is a contact of rocks with different resistance (1000 Ω·m and 5000 Ω·m), and containing a local conducting object with a resistance of 5 Ω·m and dimensions of about 200 × 400 × 20 m, which corresponds, for example, to a concentration of sulfide minerals (
Figure 14a,b). Modeling was carried out for two depths of the object: h = 30 m and h = 100 m. The results of modeling the data obtained using the UAV-TEM technology for this geological environment are shown in
Figure 14c–f in the form of graphs of changes in the measured signal at time delays of 80 μs and 150 μs along two survey lines. The survey lines were located on different sides of the transmitter line and therefore the signals along them had different signs. Survey line 3 intersected the projection of the local object, but survey line 7 did not. In
Figure 14c–f bold red line on the abscissa axis shows the interval of intersection of survey line 3 with the projection of the object.
The signal clearly shows an anomaly from both the separation of environment with different electrical resistance, and from a local conducting object located both at a depth of 30 m and at a depth of 100 m. At the same time, a sufficiently high anomaly is observed both above the survey line that intersects the object (its projection) and above the survey line that does not cross the object. For a deep object, even the magnitude of the anomaly is approximately the same on these survey lines. In addition, at a time delay of 80 μs, the anomaly manifests itself on the side of the deep object. This is particularly problematic when using 1D inversion, but not particularly difficult when using geometric 3D inversion [
28,
35]. Thus, it is shown that the developed UAS allows solving the problems of geological mapping and searching for local inhomogeneities not only in the case considered in
Section 5, but also in the general case.
7. Further Improvements
The results described in the article were obtained, in fact, by a working prototype, not by a market-level system. After the completion of the tests, a plan for improving the system was developed, taking into account all the identified shortcomings of the methodology and technology.
First, the measuring system should be lightened to improve the UAV weight to payload ratio from 1:1 to 2:1. This will lead to a much faster stabilization of the measurement system after stopping or turning the UAV, and greatly reduce the problem of data loss after turns, and during deceleration or acceleration. After that, a suitable distance will be determined by which the route missions should be extended outside the study area. It is important that after reducing the weight of the measuring system by 1.5–2 kg, a power reserve appears, which allows one to implement simultaneously with the UAV-TEM other methods of low-altitude geophysical surveys or other types of remote sensing. To keep the center of gravity closer to UAV the measuring systems should be rigidly attached to the UAV frame, and it is desirable to conduct the survey along a dense network and at low altitude. First of all, these are gamma spectrometry and lidar scans. The combination of several survey methods on one UAV will further increase the economic and geological effect of the technology.
Second, a new meter unit is being developed that supports simultaneous measurements and recording. As shown in Chapters 5 and 6, there no needs to register the EMF decay at times later than 100–150 μs, a new firmware has been prepared for the current switch, which increases the frequency of current pulses almost 100 times, from 0.125 s up to 0.001 s. This provides a significant increase in the dense of the data. The possibilities of filtering noise increase, the transient will be stacked with 400–500 decays instead of 6–8 decays (as in
Figure 8b,
Figure 10b,
Figure 11b and
Figure 13b), or it will be possible to set a more detailed exploration network along the survey line.
Third, to clarify the early times of transient after cut off the current in the transmitter line, it is necessary to reliably separate the effects of the current pulse after cut off and the response of the medium. The current cut-off signal in the transmitter line must be measured instrumentally to be taken into account, but not simulated analytically, as is done in this work (
Section 6,
Figure 13). After subtracting the effects of the current turn-off signal and the impulse response of the receiving sensor from the early times of the transient, the transient data will describe the geological environment. This will allow modeling the first meters of the geological section, and will also improve the quality of the inversion in general.
Fourthly, one-dimensional data inversion, as done in this work, is irrational. Inverting the transient response of each observed point is performed by multiple calculations of the direct problem until the minimum convergence between the model and measured sounding curve is achieved. The density of the observations using UAV-system is much higher than the onshore methods which makes the expenditure of human time enormous. In addition, 1D-inversion does not take into account the influence of effects from neighboring points, and one of the most important advantages of the UAV-TEM is the possibility of cost-effectively obtaining a dense survey. More importantly, 1D inversions do not always provides adequate reconstruction of local 3D objects, especially in complex environments in the sections with tectonics. Therefore, the use of three-dimensional inversions is promising for the construction of reliable geoelectric models. It is proposed to use geometric 3D inversions [
34] for traditional technologies of aerial electrical exploration using helicopter platforms. They are based on a joint search for the geometric and physical parameters of the structural parts of the geoelectric model. Currently, these approaches are being adapted to work with “line to loop” array, when the line is grounded transmitter and the loop is receiving sensor, mounted to the UAV. The approaches presented in [
34] allow performing distributed computing, and therefore it will be possible to obtain solutions very quickly, which best reveals the potential of the created UAV-TEM technology.
8. Conclusions
To replace the traditional terrestrial electromagnetic soundings, an electrical prospecting UAV-TEM system was developed. System consists of the airmobile and ground parts, which implements the TEM technology in the “line-loop” array. The source of the electromagnetic field is a galvanically grounded transmitter line up to several kilometers long. A lightweight UAV with an original measuring system, which could be used under the simplified operating procedure of the Russian Federal Air Transport Agency, can survey on a square area with a side length approximately equal to the length of the transmitter line. It is premature to consider the described technology as a solution to the market level, however, it has been shown that in its current form it can be successfully used to solve geological problems in real conditions. The ways of further improvement are described in the article and represent purely engineering problems.
The data obtained in real, moreover, rather difficult conditions are presented. A case of geophysical mapping in the search for uranium deposits in the foothills of the Eastern Sayan (Siberia, Russia) is considered. On this example, a rational surveying technique, advantages and problems of the created technology are considered. The design of the suspension of the induction sensor and a constant flight speed are important for obtaining high-quality electromagnetic soundings data. It is shown that the UAV-TEM technology makes it possible to carry out electromagnetic sounding to a depth of at least 100 m, at a flight speed of 7.5 m/s, at low altitude and with terrain drape. In 1 day, at least several tens of linear kilometers of surveying can be performed.
Based on the data obtained, modeling was carried out, showing the geological universality of the developed technology.
UAV-TEM allows one to significantly optimize the process of electromagnetic sounding in areas up to the first tens of square kilometers, especially in conditions of difficult pedestrian traffic. While this technology is primarily a replacement for classic ground surveys, it also makes small-volume aerial electro prospecting survey available. Previously, in small, but hard passable areas, it was impossible to carry out electromagnetic soundings, since the mobilization of a traditional airborne TEM system is very expensive. This created problems for scientific research and small businesses.
The advantage of the developed UAV-TEM technology is the cheap acquisition of dense areal data of electromagnetic soundings. At the same time, the processing of data with classical 1D-inversion is very difficult and not optimal from the point of view of the quality of solving the geological problem. An urgent problem is the fast 3D inversion of hundreds and thousands electromagnetic observations, since only this processing option makes it possible to fully realize the advantages of the UAV-TEM technology. To solve this problem, the 3D geometric inversion is adapting to realize the possibility of processing the data obtained by the unconventional line-loop array.
Authors believe that the emergence of UAV-based electromagnetic sounding methods is another important stage in the development of UAV-aerogeology. Now the entire ‘classic triad’ of airborne geophysics methods is implemented in the UAV version, and it is possible to carry out integrated surveys with several sensors on one UAV. It seems that similar to UAV magnetic survey and UAV-gamma survey, UAV-TEM will significantly affect the geophysical exploration market, since such a survey can be at least half the price of a ground survey and several times faster.
9. Patents
SibGIS Tech LLC.; Parshin, A. Aeroelectric prospecting method using lightweight unmanned aerial vehicle. RU Patent 2736956 C1, 09 January 2020.


 ,
, 


