1. Introduction
Currently, society is facing a pandemic known as Coronavirus Disease 2019 (COVID-2019). COVID-19 has generated serious problems around the world: its high contagion rate has caused entire nations to close their borders to prevent its exponential spread. In internal management, most nations with their governments have chosen to decree long quarantines and distancing as the main measures to combat the increase in infections. However, all dispositions and measures on the part of the medical sectors have fallen short of the spread of the virus [
1], to such an extent that the world is waiting for a vaccine to end the pandemic.
While a definitive solution to COVID-19 arrives, society faces the consequences that the pandemic leaves on its way. At the same time that it advances, the weaknesses of our reality are exposed; it is thus that economic problems are the first to emerge, as the confinement has forced the closure of companies and loss of jobs. Furthermore, confinement has considerably changed the way people go about their lives. With this general point of view of the current situation, three factors are presented in which COVID-19 has changed us [
2]. The economic factor, the affective factor, and the academic factor, each of these being a research topic that needs to establish which variables are affected and generate a solution that encompasses the new needs of society [
3]. It is important to understand and accept that society will never be the same again, there is even talk of a new normal. However, in the face of all the problems caused by the virus, people’s adaptability allows creating new scientific and technological advances that allow a positive change in society [
4].
This work focuses on analyzing the academic factor and how the pandemic has specifically affected university students [
5]. Education, like other sectors of society, has gone through several problems that it has had to overcome to maintain its continuity [
6]. At the beginning of the pandemic, universities found quick solutions relying on information and communication technologies (ICT). At the speed with which the confinement was established, the universities integrated videoconferencing platforms into their infrastructures [
7]. These platforms are even used by other sectors to carry out activities such as teleworking that has allowed society not to stop. In the academic part, the synchronous meetings allow in some way to continue with the dynamics of a face-to-face educational model. This being one of the problems to be solved, therefore, universities generally offer students their proposals, based on a face-to-face educational model [
8]. These models that are even treated as traditional education are highly effective, what is mainly due to the fact that learning is generated in relation to the teacher, who has the ability to determine what students should learn and how they should do it [
9].
In theory, the continuity of education by the universities was solved by synchronous sessions; however, the solution was not entirely effective, since direct interaction with the teacher creates personal ties that affect student performance in different subjects. When handling synchronous sessions, this relationship is lost, which directly affects students, because if this change is seen in a pragmatic way, it has gone from a face-to-face educational modality to an online one [
10], where the operation and the educational method is totally different. To address these problems, this work presents a model by which a hybrid education model can be established based on data analysis to detect the needs of students, who are currently studying an online model with methods and resources of a face-to-face model.
This work is divided into the following sections that have been considered key to reach the proposed objectives.
Section 2 defines the materials and method;
Section 3 presents the results obtained from the analysis;
Section 4 presents the discussion of the results obtained;
Section 5 presents the conclusions found in the development of the work.
2. Materials and Methods
For the development of this work, it is important to establish the initial state of university education and mainly the state of learning. In addition, a data analysis method is established that contributes to the identification of patterns in academic data. Also, a model is defined that allows the current educational model to be passed to a hybrid model, considering the existing needs of students.
2.1. Identification of the Problem
The development of academic activities in universities has been compromised by COVID-19. The great contagion capacity that this presents has forced the governments of many countries to decree the confinement of their inhabitants. The consequence is that face-to-face education models look for alternatives that guarantee their continuity [
11]. The immediate reaction of the universities that found themselves in this situation was the integration of videoconferencing platforms that allow the development of synchronous meetings [
12]. This response practically led from a face-to-face modality to an online modality, which brought with it problems which were not detected at the beginning.
The main problem is that the method, resources, and activities remained as in the face-to-face model, where education has the teacher as the main actor and it is he who acts as a bridge between resources and learning [
13]. The interaction that he has with the student in a physical environment allows him to control the greatest number of variables related to his academic performance. For example, identify the interest of students in the class, the time devoted to different activities, identify problems in solving specific topics, etc. When changing physical interaction with synchronous meetings, it is easy to lose control over the above factors. Proof of them are cases that have become public through social networks, where several students have been identified carrying out other activities outside the class.
Although the logical step would be to transform the face-to-face educational model into an online model, this is not entirely true. An online education model requires a lot of preparation and work to be executed. There are universities that have taken years to have an online education model, where the student is the center of learning and resources, and tutors and technology are focused on meeting their needs [
14]. In addition, the main factor in this modality is the disposition and psychological security of the student, as he is the one who chooses this study method. In the absence of these factors, it is important to find another solution that aligns with the new normal that society will face once the pandemic is over [
15].
The new normal and the fact that nothing will ever be the same in society, and even more so in education due to the use of IT, allows proposing new concepts and models in the educational area. One of these models is the hybrid [
16]. The hybrid educational model is not a new idea; however, it is a really valid solution for what is considered an emerging model that is capable of taking the best of the two educational models and translating it into an offer that guarantees learning, something that currently goes through a serious deficiency [
3]. However, moving to this model requires serious analysis based on pre-pandemic and post-pandemic student data [
17]. The data analysis aims to identify the critical variables in student learning in the face-to-face model. For example, little adaptability to the activities proposed by the teacher or even little variety in these, the method used by the teacher is not adequate, etc. In the current modality, it is also important to establish the problems that the student faces [
18].
The appropriate technology that allows this data processing to be carried out are data analysis tools. With data analysis, it is possible to identify the patterns that students present in each educational model and this knowledge to translate it to create a hybrid educational model that adjusts to the student’s needs, guaranteeing learning [
19]. In the development of the method, several concepts that are key for the development of the model and obtaining the results have been reviewed.
2.1.1. Face-to-Face Education Model
It consists of the traditional education method, characterized by the attendance of the participants to a physical place where time and space are shared with other students, receiving mostly teaching/learning through oral communication [
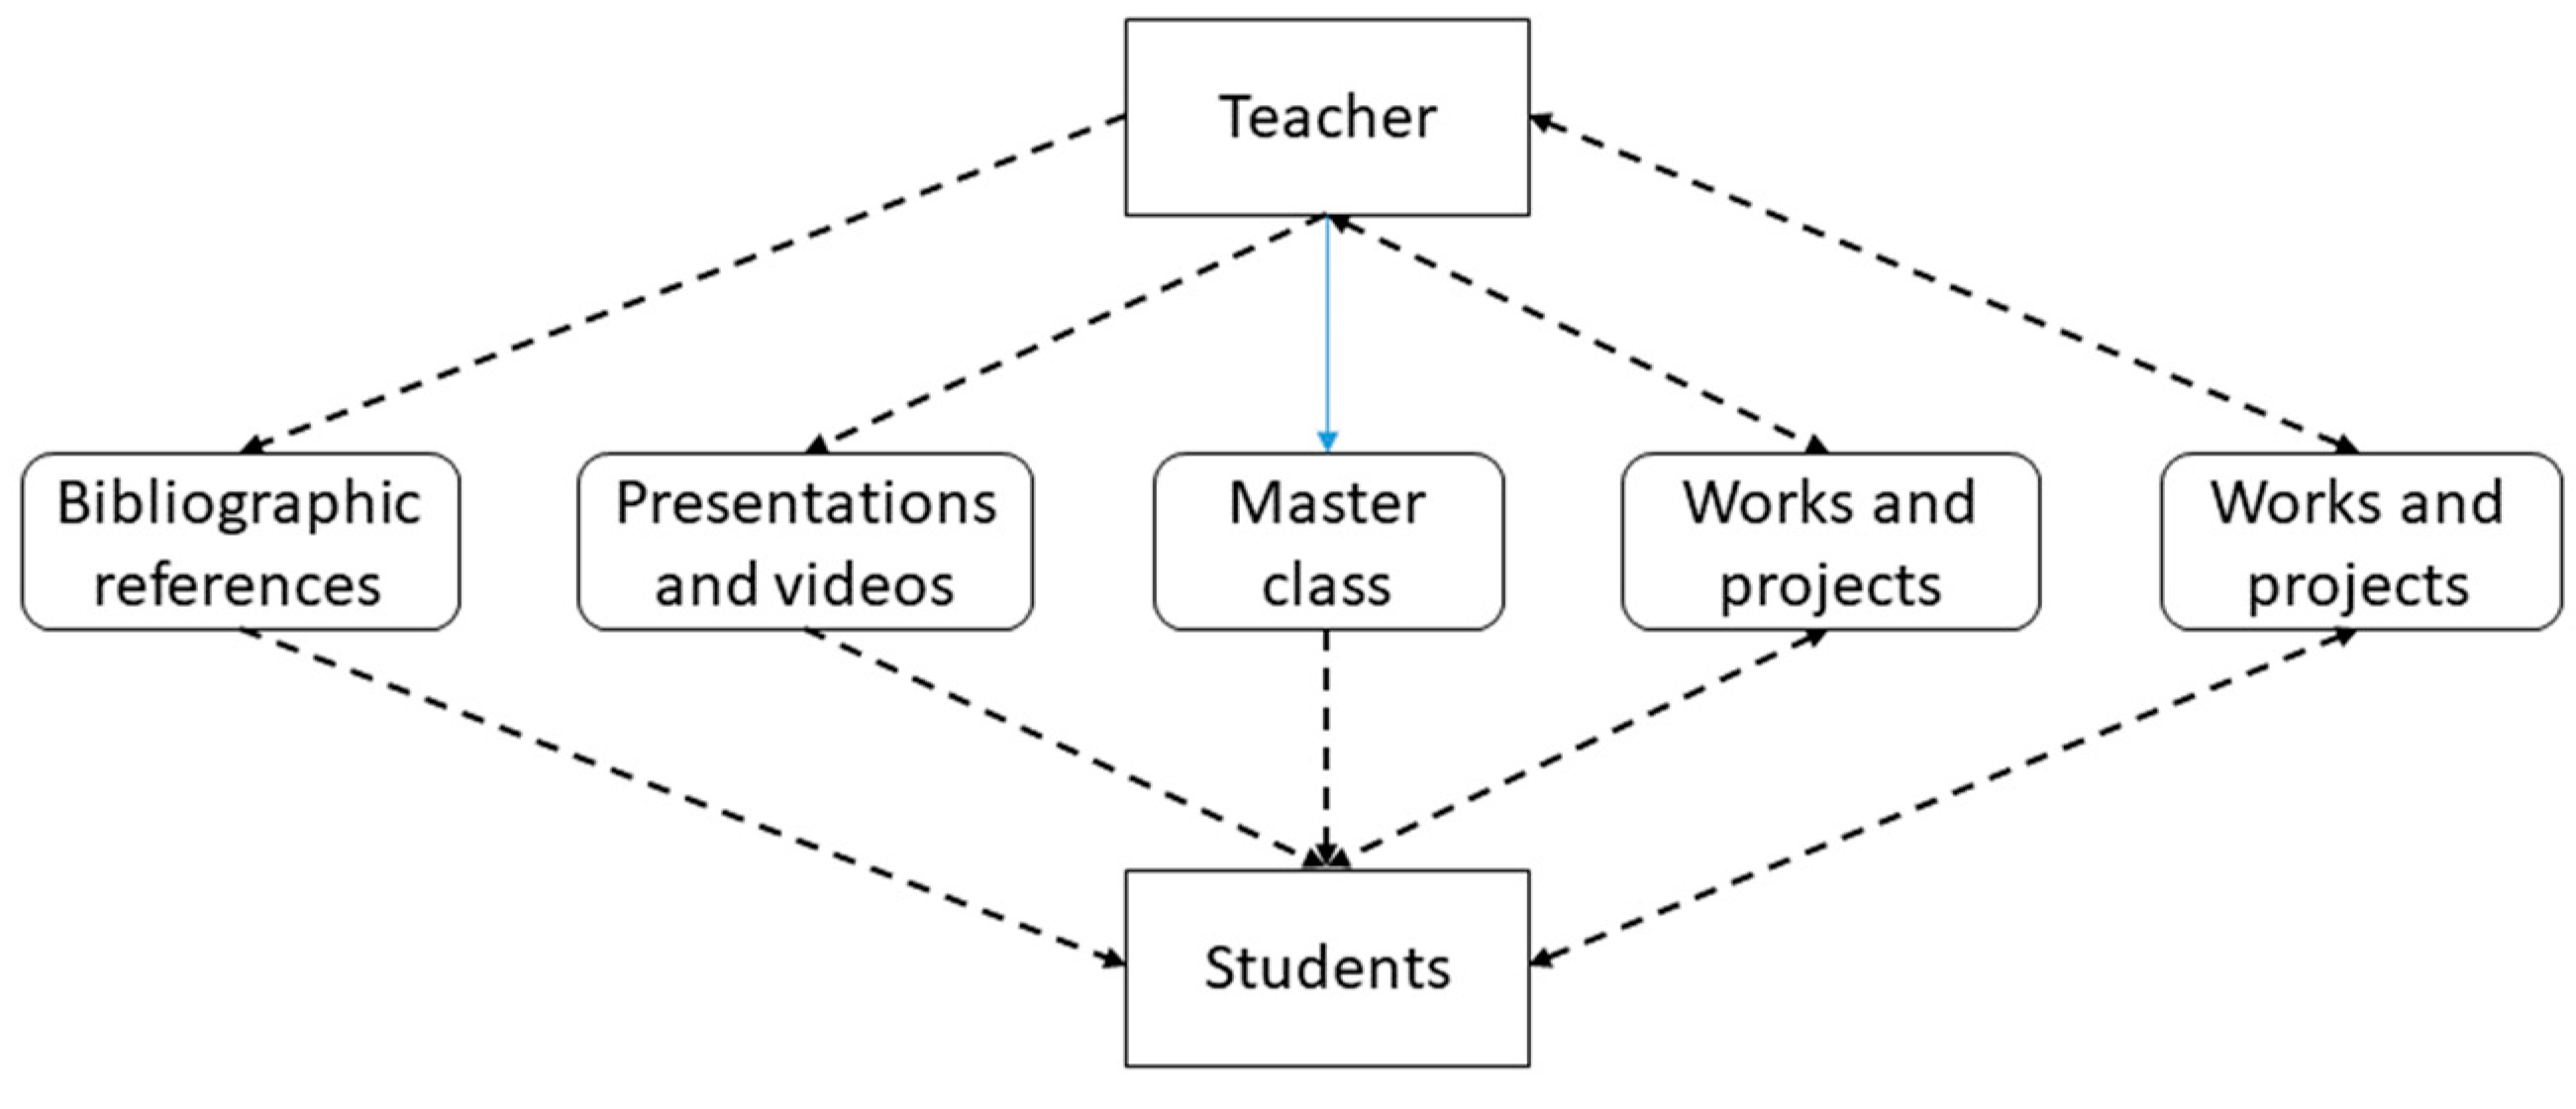
20]. In this model, learning has the teacher as the main actor; it is the teacher who determines what students should learn and how they should do it, as can be seen in
Figure 1. The teacher, through their knowledge and experience, guides the student in their learning. Generally, this interaction creates a teacher–student bond of trust, which determines to a certain extent the interest that the latter generates in the subject. In addition, the teacher contributes directly to the academic monitoring of the student [
21]. By being part of the student’s interaction with the subject, he can control and identify the different deficiencies that exist in relation to learning. The information that he obtains on the student’s performance is a link with the information that the academic monitoring departments manage and can be compared for the benefit of the student [
22].
2.1.2. Online Education Model
The development of ICT has opened up countless possibilities to carry out educational projects in which all people have the opportunity to access quality education regardless of the time or place where they are [
23]. In effect, the access to alternatives that have been put in the hands of the people have eliminated time and distance as an obstacle to teaching and learning. Online education improves distance education by making extensive use of ICT [
24].
In an online education model, the student is the learning center, as shown in
Figure 2. The resources in this modality are worked together with multimedia designers, and academic designers [
25]. The activities are created from an innovative learning approach that seeks to learn through alternatives such as active learning. For this, the work of the teacher, who has knowledge of a specific topic, is integrated into the pedagogical models. With this integration, we work on an education based on competencies.
Online education integrates information technology (IT) with greater intensity [
14,
26]. IT provides a wide variety of tools for designers to generate interactive activities and resources. Similarly, the use of simulators allows teachers and students to replicate real environments in a controlled one.
2.1.3. Analysis of Data
Currently, data analysis is widely used in organizations. It consists of processing the data and presenting the results to improve decision-making [
27]. Through analysis, it is possible to identify patterns in the data and classify them in order to give special treatment to users. These analysis processes are widely used in areas of mass consumption, marketing, social networks, etc. Through analysis, organizations fundamentally seek to identify their customers’ consumption trends and offer them a better service [
28].
The main models of data analysis considered are business intelligence (BI) and Big Data [
29], Big Data being a technology that is monopolizing world interest at the time of decision-making. The ability of Big Data to handle structured and unstructured data places it above BI, as its ability is limited to handling strictly structured data [
30]. The difference is not simply in this capacity; to this is added the processing capacity and the speed at which it obtains results [
31]. The choice of these models depends on the needs that arise in organizations and the volume of the amount of data they handle.
2.2. Data Analysis Model
There are several options for data analysis; it all depends on the needs and resources of the organization. In the first segment are the BI. These analysis models are characterized by offering the extraction, transformation, and loading (ETL) of the data [
32]. This process guarantees the quality of the data with which one works, carrying out an exhaustive cleaning of the information [
33]. The transformation consists of passing the data to the format in which it is working, in addition to the generation of new identifiers if it is the case. The load consists of uploading the data already transformed to a data warehouse, from where it will be consumed by the On-Line Analytical Processing (OLAP) cubes [
34]. In a BI, the use of data mining algorithms is common; data mining allows obtaining knowledge. This knowledge is presented to the interested parties, through dashboards that facilitate decision-making [
35].
Another segment of data analysis that currently has a great penetration in its use is Big Data. Its ability to process large volumes of data, and its independence to work with structured and unstructured data, makes organizations begin to use it to detect trends in their customers [
36]. Big Data is generally part of an architecture that includes the sources that are integrated into the analysis, communication, and exploitation of knowledge. In these analytics architectures, Big Data is integrated as a framework for data processing, through a cluster model [
37]. The cluster contains several nodes, where one acts as a master and two or more function as slaves. The most used frameworks are designed under Apache, which generates an open-source environment.
It is important to point out that, for the application of a data analysis model, the tools to be used must go through the identification of the organization’s needs. For this work a Big Data architecture is used, the necessary requirements analysis, the authors present it in previous works [
38,
39]. This section establishes the necessary infrastructure for the implementation of the framework that is developed in Apache Hadoop [
40]. The scalability of Hadoop allows the analysis to be carried out with the data of the students in a face-to-face education model and contrast it with the data of the new modality by which the students are studying. In this way, it is possible to obtain a guide based on the results of the data analysis to generate a hybrid education modality that guarantees learning [
41].
2.2.1. Data Analysis Architecture
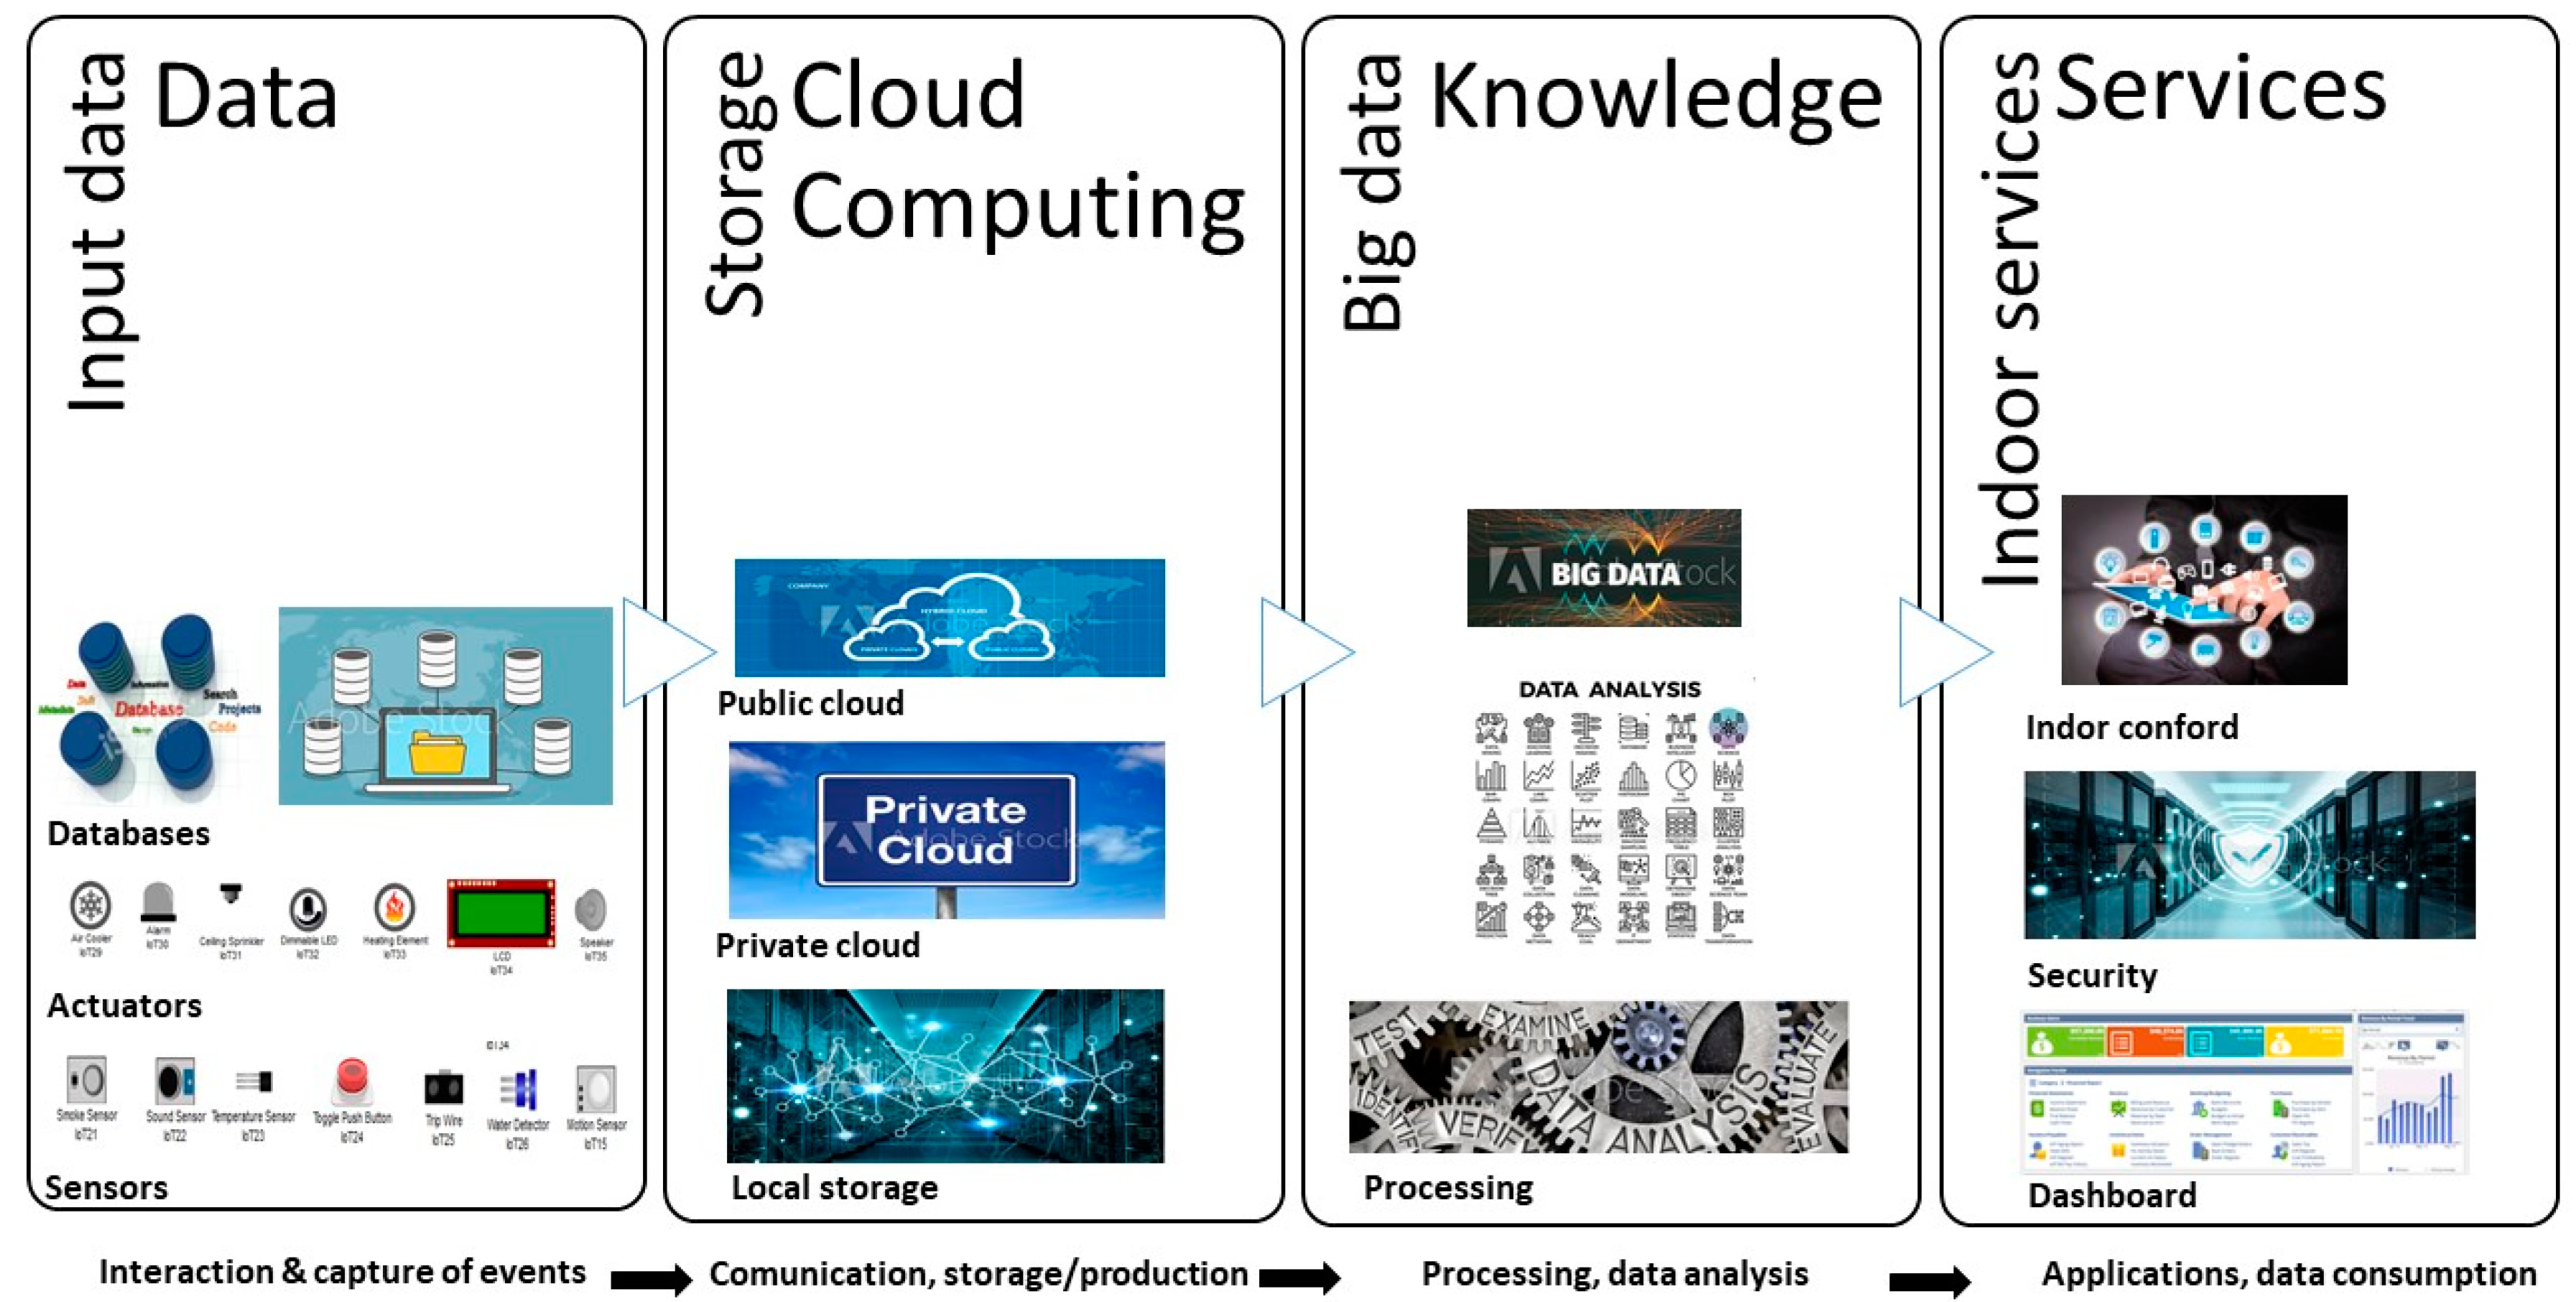
The data analysis architecture used is defined in four interconnected stages. In
Figure 3, see each of the stages and their components. The first stage of the architecture are the data sources that are considered in the analysis. These sources are the databases available to the university participating in this research and which store the information generated in the academic and financial part. These sources are important to determine the student’s situation regarding her performance and if this has any inconvenience, the framework crosses the data from all sources to determine where the problem originates. Other sources are sensor and actuator systems [
42]. The information they generate is specifically from the interaction of students with the university campus. This information is important considering the return of students to campus. The data from these sources are generated by different sensors that are responsible for identifying certain patterns in students such as the places they access, through biometrics, radio frequency identification, video cameras, etc. Other sources that are important today for their contribution to detecting trends are social networks [
43]. Through these, it is possible to determine the acceptance of academic programs or the states that the different careers climb in future sentiment analyses.
The second stage is in charge of the place where the data is stored and its format. There is a great variety of data in a university; these will depend on the type of devices or sources [
44]. Generally, the services that a university has are stored in its own data center. These, when managing a virtualization model, can generate as many servers as their infrastructure allows. The services store their data in databases within local storage [
45]. In addition, there are services that store your data in private or public cloud models. Its implementation depends on its use, for example, the university maintains a private cloud, which is responsible for storing files that are shared between different users [
46]. In the public cloud, services such as Office 365 and various Internet of Things (IoT) device measurement systems are maintained that the university has deployed for the interaction of the campus with the user [
47].
In the knowledge stage, the Hadoop framework is deployed, which takes care of all the data processing. Hadoop is an open-source environment from Apache that allows the data analysis architecture to be highly distributed, functional, and scalable, without depending on the investment of licenses or hardware [
48]. It uses a Java programming language that has several additional applications that empower it, in addition to its own adaptation of the MapReduce programming model for processing large volumes of data, including structured and unstructured [
49]. Hadoop is designed to process large volumes of data in a distributed manner through MapReduce. In addition, thanks to the fact that it works with local, but distributed storage and processing, it allows working with both single-node clusters and thousands of nodes, offering a high level of fault tolerance. It consists mainly of two components: data storage/distribution and data processing [
50].
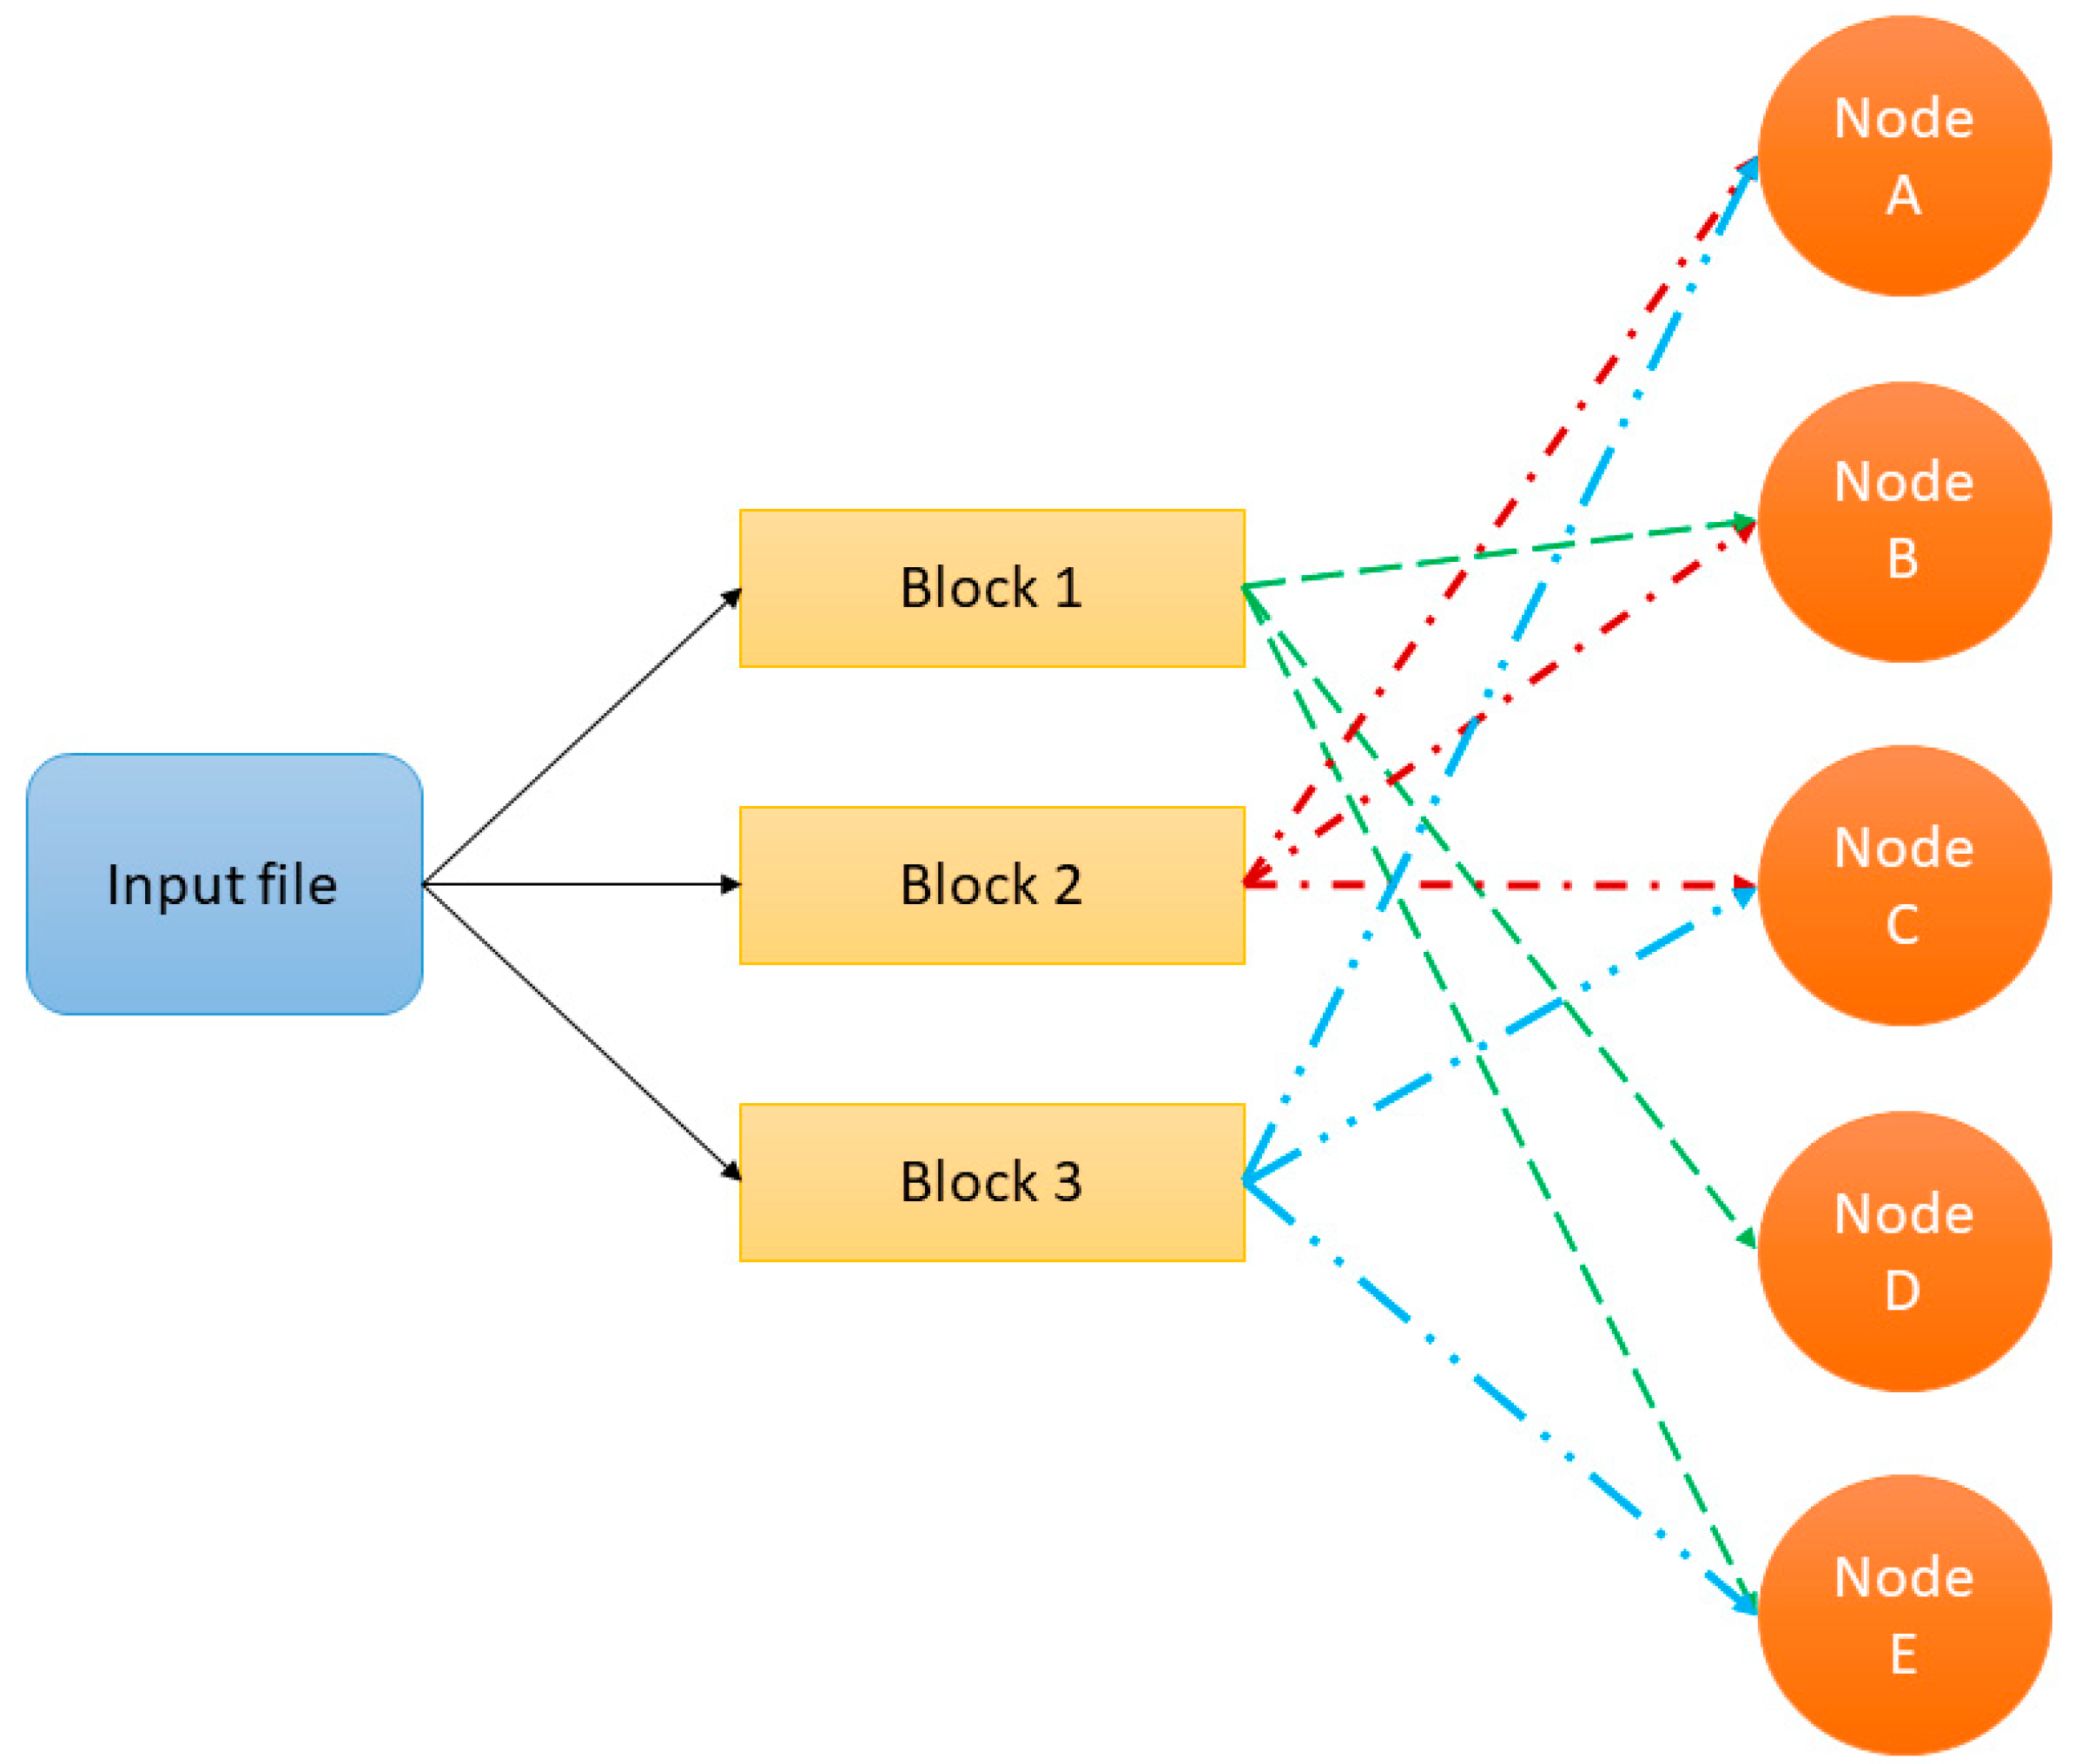
Hadoop Distributed File System (HDFS), is a distributed file system which allows data to be spread through hundreds or thousands of nodes for processing. It provides redundancy, that is, the data is repeated or replicated in several nodes [
51]. In addition, it provides fault tolerance: if a node fails, it is automatically replaced. In its operation, the HDFS file system divides the data into blocks, where each block is replicated in different nodes so that the fall of a node implies the loss of the data it contains [
52]. In this way, the use of programming models such as MapReduce is facilitated, since several blocks of the same file can be accessed in parallel, as can be seen in
Figure 4.
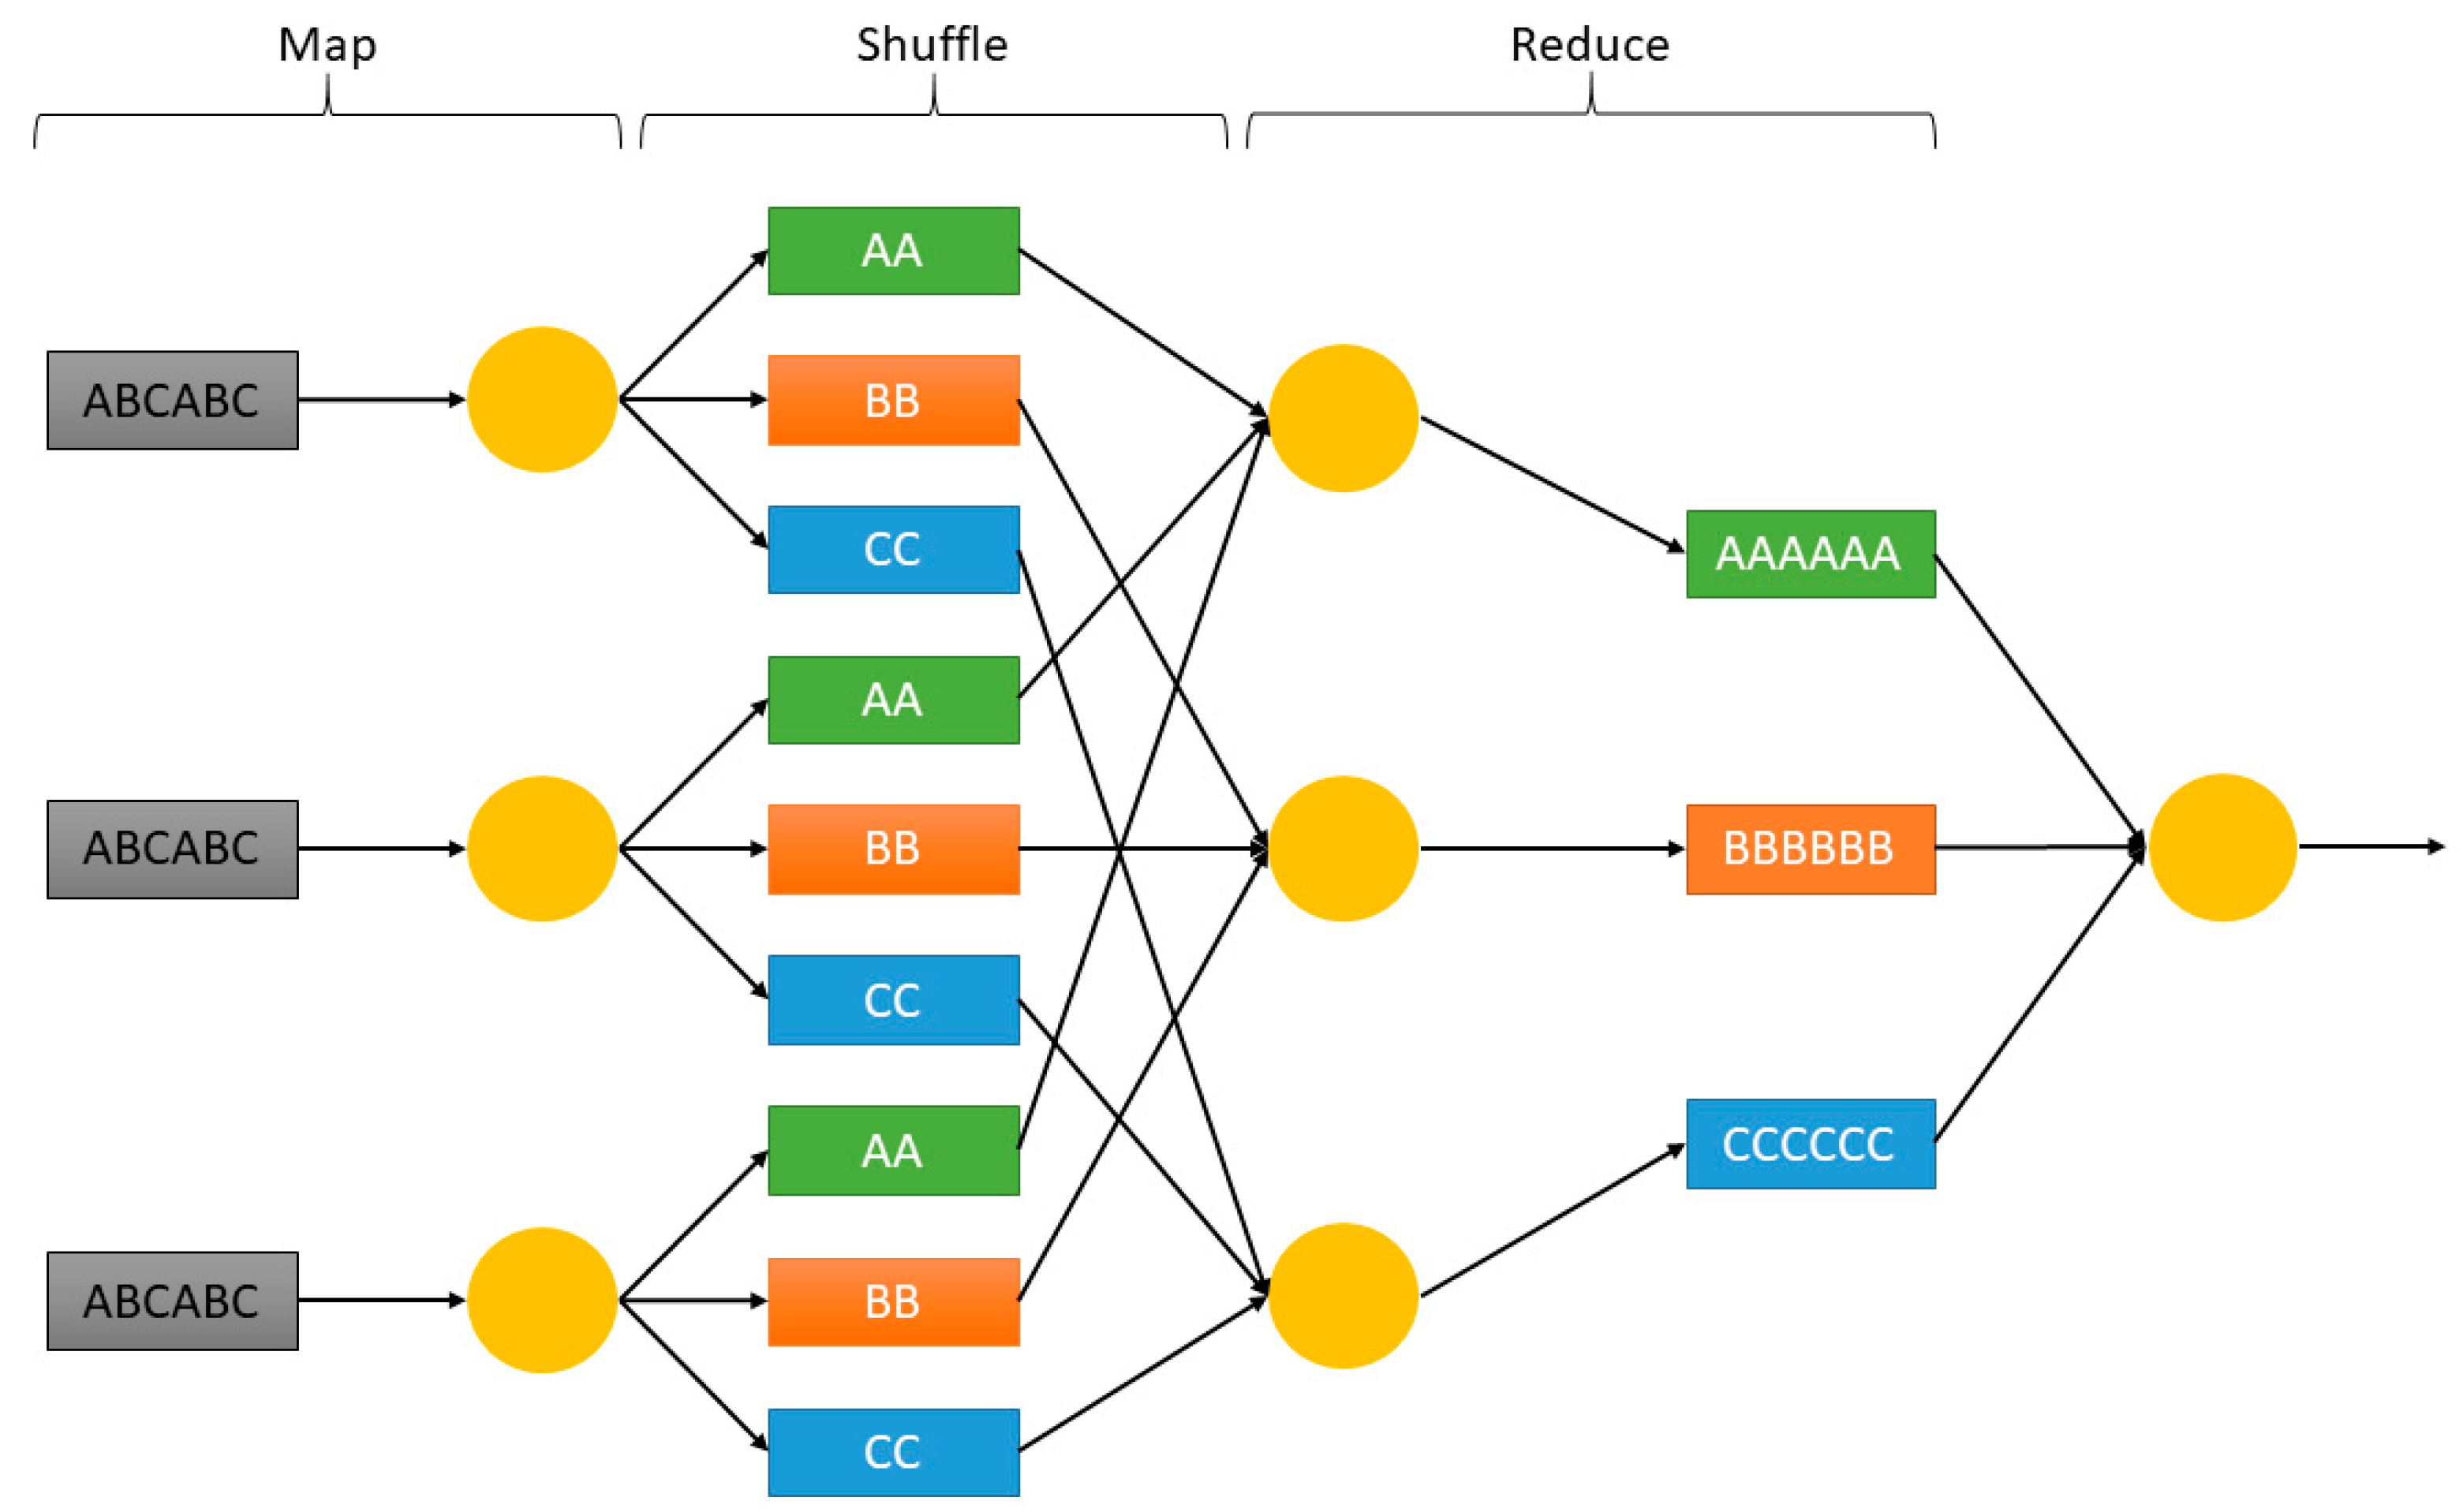
MapReduce allows the development of applications and algorithms under the Java language for the distributed processing of large amounts of data. Within the ecosystem, the applications developed for the MapReduce framework are known as Jobs; these are made up of the following functions [
53]: Map (Mapping), in-charge of the division of the processing units to be executed in each node and their distribution for their execution in parallel. Each call is assigned a list of key/value pairs. Shuffle and sort, mix the results of the previous stage with all the key/value pairs to combine them in a list and in turn, they are sorted by key. Reduce, receive all keys and lists of values, adding them if necessary [
54]. In
Figure 5, see the operation of each of the components.
In the services stage, the results of the previous layer are taken and its exploitation is arranged through dashboards, reports, notifications, etc. The visualization of results must be presented clearly, without ambiguity, in such a way as to guarantee decision-making [
3].
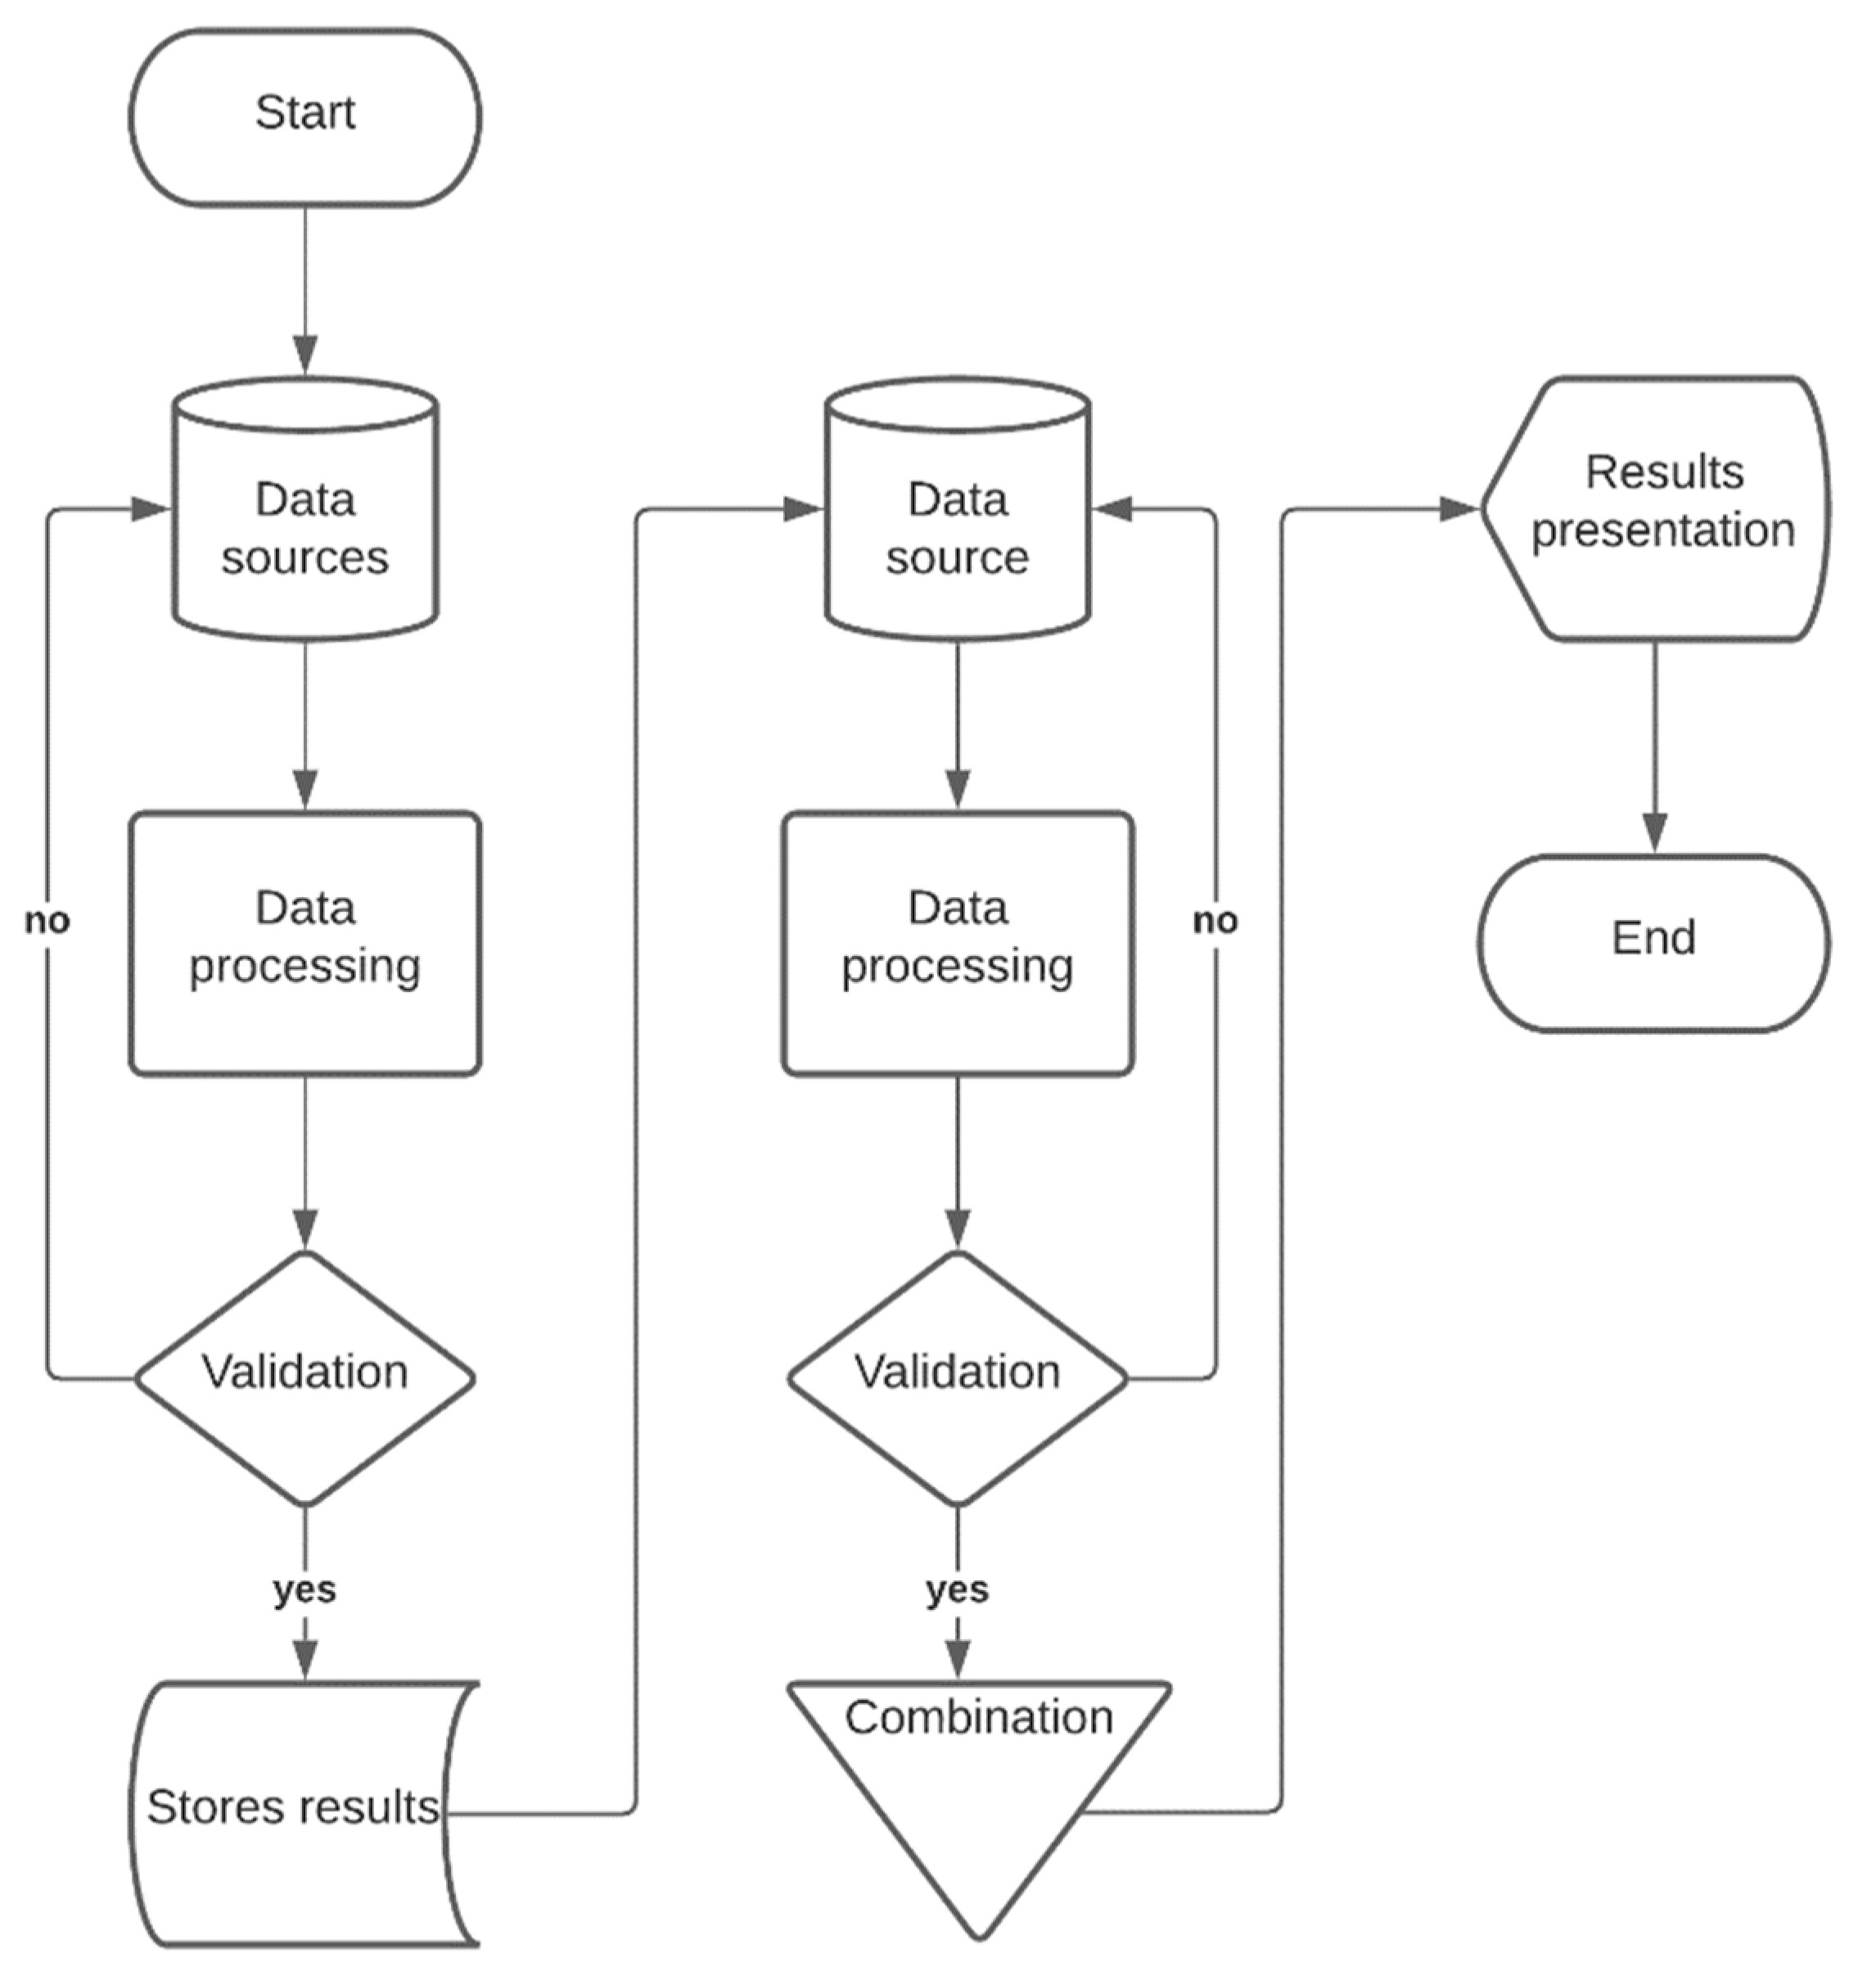
2.2.2. How the Data Analysis Model Works
In
Figure 6, the operation of the data analysis model is described. In the process, it has two parts. In the first, the analysis of educational data of the face-to-face modality is established. These data are available from different sources and dates or pre-pandemic period and must be established. The knowledge generated from this analysis aims to identify the deficiencies or sufficiency of the students at the time of generating learning. Once Hadoop finishes processing and validates the results, if they are as expected, it will continue with the process. Otherwise, it generates a loop and returns to the data sources and it integrates a new source or new data from a system into the process. This process does it, until the results are optimal to be able to get out of the loop. The results that have been validated are stored and the process continues until the next phase.
The framework follows a process similar to the previous stage; however, the data and sources that are considered are post-pandemic. In this analysis, the data contains information about the change that has occurred in student performance. This subject is done under two edges: in the first, the grades are considered and in the second, edge learning is involved. This variation in the analysis is carried out by the indices that the university has detected in quick reviews where a deficiency in learning is exposed without there being a negative change in grades.
The process enters a stage of validation of the results, if any variable is needed, and sources and related data are integrated to adjust the process and results. With the optimized results, they are processed to combine them and establish the existing differences, the results are presented, and the analysis process is finalized. By clearly establishing the differences based on data analysis, the areas in charge have a key input to define what the parameters are to consider in the execution of a hybrid education model.
3. Results
To evaluate the model, we worked with a university of Ecuador, which is made up of four faculties and on average, each faculty consists of five majors. The learning modality is face-to-face with an online modality that offers only master’s programs. The university population reaches 10,000 people, which includes administrative and teaching staff. The population considered for the analysis focuses on the finance career, specifically on students who are studying up to the fourth period of nine that make up the career. This career is considered to be one of those with a lower percentage in the use of IT tools for its development. Therefore, the number of students is reduced to 200, the analysis scenarios involve a radical change in how learning is generated; therefore, it is important to define each of them.
The first scenario is the face-to-face education modality of the university; this is carried out on the university campus. The center of learning is the teacher; it is he who is in charge of student learning. In this modality, the educational resources are mostly tied to the teacher. For example, the design of the syllabus for each subject is carried out by the assigned teacher. In this resource, the expected learning results in the matter, the evaluation mechanisms, and the general agenda are established. The syllabus is intended for the student to know exactly what to do and what is expected of him. This resource is available in the Learning Management System (LMS). In the career that this study is carried out, the LMS acts as a repository, where the teacher uploads the resources and proposes activities for the development of the students. Although, the potential of the LMS is specifically higher and as mentioned above, this career does not have deep use of IT [
55]. Therefore, the resources are designed for the use of the teacher. There are even cases in which there are no resources available in the LMS, but it is solved by the teacher. The activities configured and available for the development of the student can be considered as activities in class or autonomous activities. In addition, there is a space for the generation of evaluations.
All activity that is generated in the LMS helps the analysis to track the development of activities by the student [
56]. However, when considering academic follow-up, the need to include several additional factors arises. For example, in the economic and psychosocial part, these factors are crucial in a face-to-face modality, since it has a degree of affectation in the student that directly affects learning and academic effectiveness. This information is available in the financial and academic systems of the university; therefore, these data are necessary for the analysis. Another important factor is the information that the campus obtains from the student, a proof of which is the access of biometric systems deployed throughout the campus. With the data that they obtain, it is possible to determine the time of entry and exit of the student and by crossing this information with that of the wireless systems, it is possible to determine the effective hours of class. It is feasible to trace the connectivity of the students and define if they are in the university, but do not enter classes. In the same way, it is possible to determine the places frequented by the students and generate some efficient academic action.
In addition to the IT components used for academic monitoring, the human factor has greater value. In other words, the personal interaction of the teacher with the student creates a link that allows the teacher to detect the student’s deficiencies in her performance. In the same way, the teacher can easily identify when a student is not an active part of the class and is doing activities outside the subject.
The second scenario is in the educational model to which the pandemic has subjected us and with it the confinement to which society is subjected. This modality makes use of the resources and methods of the face-to-face modality, but, for the development of the classes, it does so through synchronous meetings. These are done with the use of videoconferencing platforms. At the beginning of the pandemic, this integration to supply the master classes allowed the continuity of education. The model has even been compared to an online education model, something that is far from reality. In online education, the method, resources, and activities change significantly. Therefore, the most appropriate option is to determine the current state of learning in students and establish the differences with the results of the students of the face-to-face modality and based on this analysis, create a hybrid model that must necessarily include education in line as a guide.
3.1. Data Analysis Applied to the Face-to-Face Modality
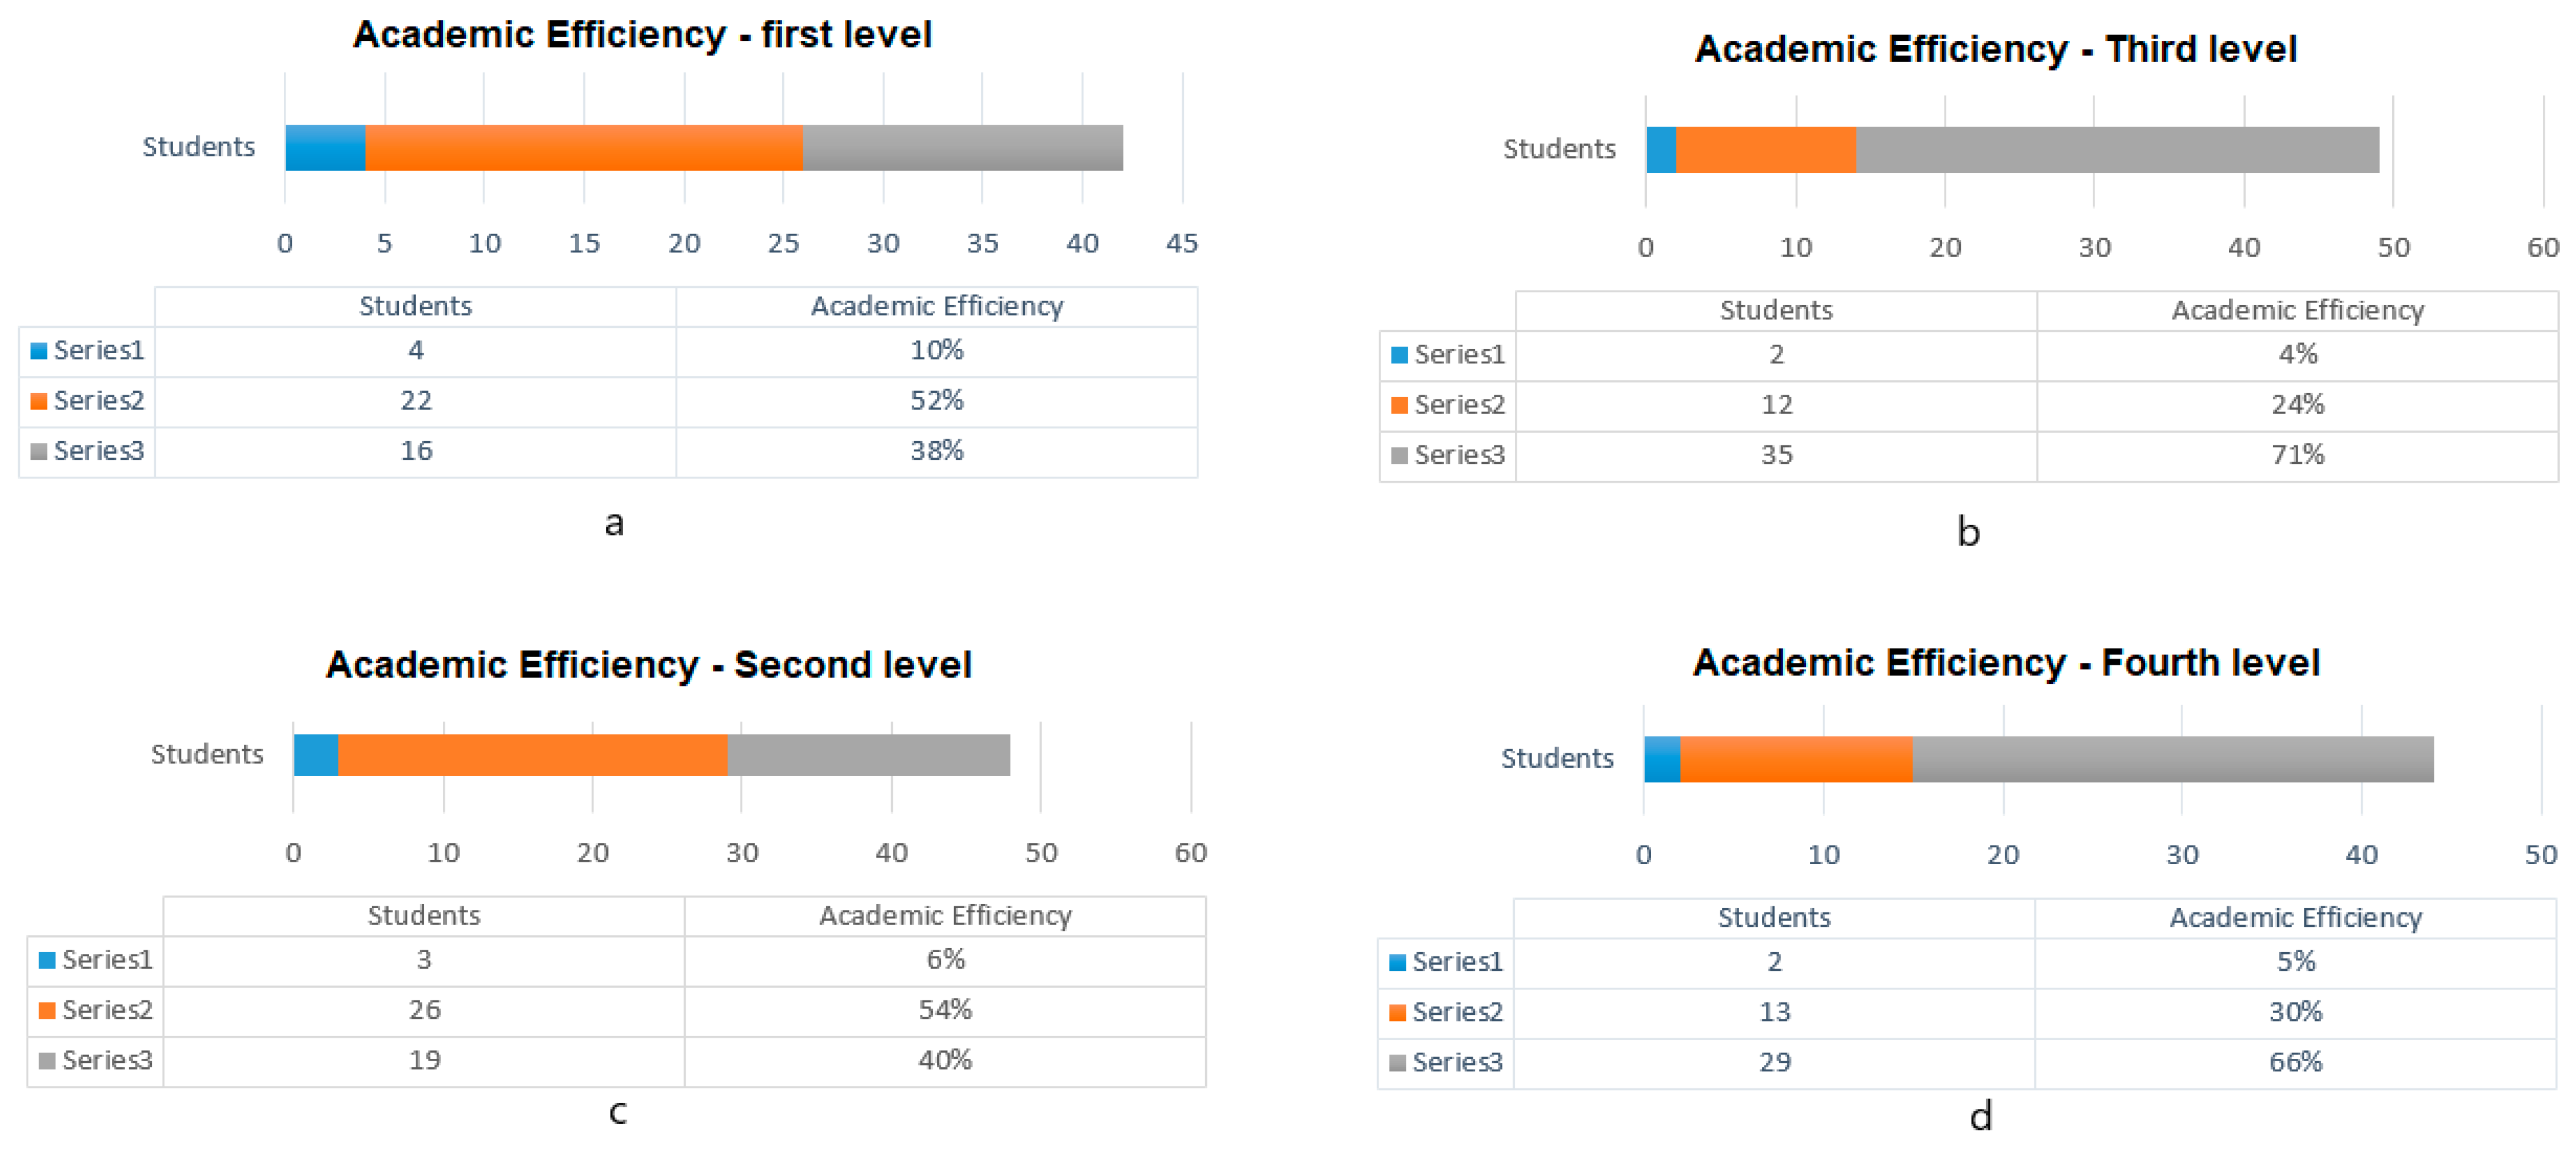
In this modality, there is a large amount of data that is integrated into the analysis in order to detect what problems are present in students when generating learning. The first case is to detect the academic efficiency of the students, for which the qualifications of the students are considered per period with the consideration that, by university policy, the sufficient qualification to pass a course is 6/10. In
Figure 7, the analysis of academic efficiency in each of the academic levels included in this research is presented. The sources included are academic ones. In each of them, it is shown that, in blue, are the number of students who did not reach six in their average, therefore, they failed several subjects. In addition, of the number of students, the percentage they represent is presented. In the first level, of 42 students, four did not reach the average and are considered as an insufficient level. Of 22 students who are in the orange band, they reached an average between six and eight as an average that is considered as a good state. In the gray band are the students that exceed six on average, which are 16, reaching a very good level. This very basic analysis aims to establish the initial parameters to cross the information and determine the level of learning in the face-to-face education model.
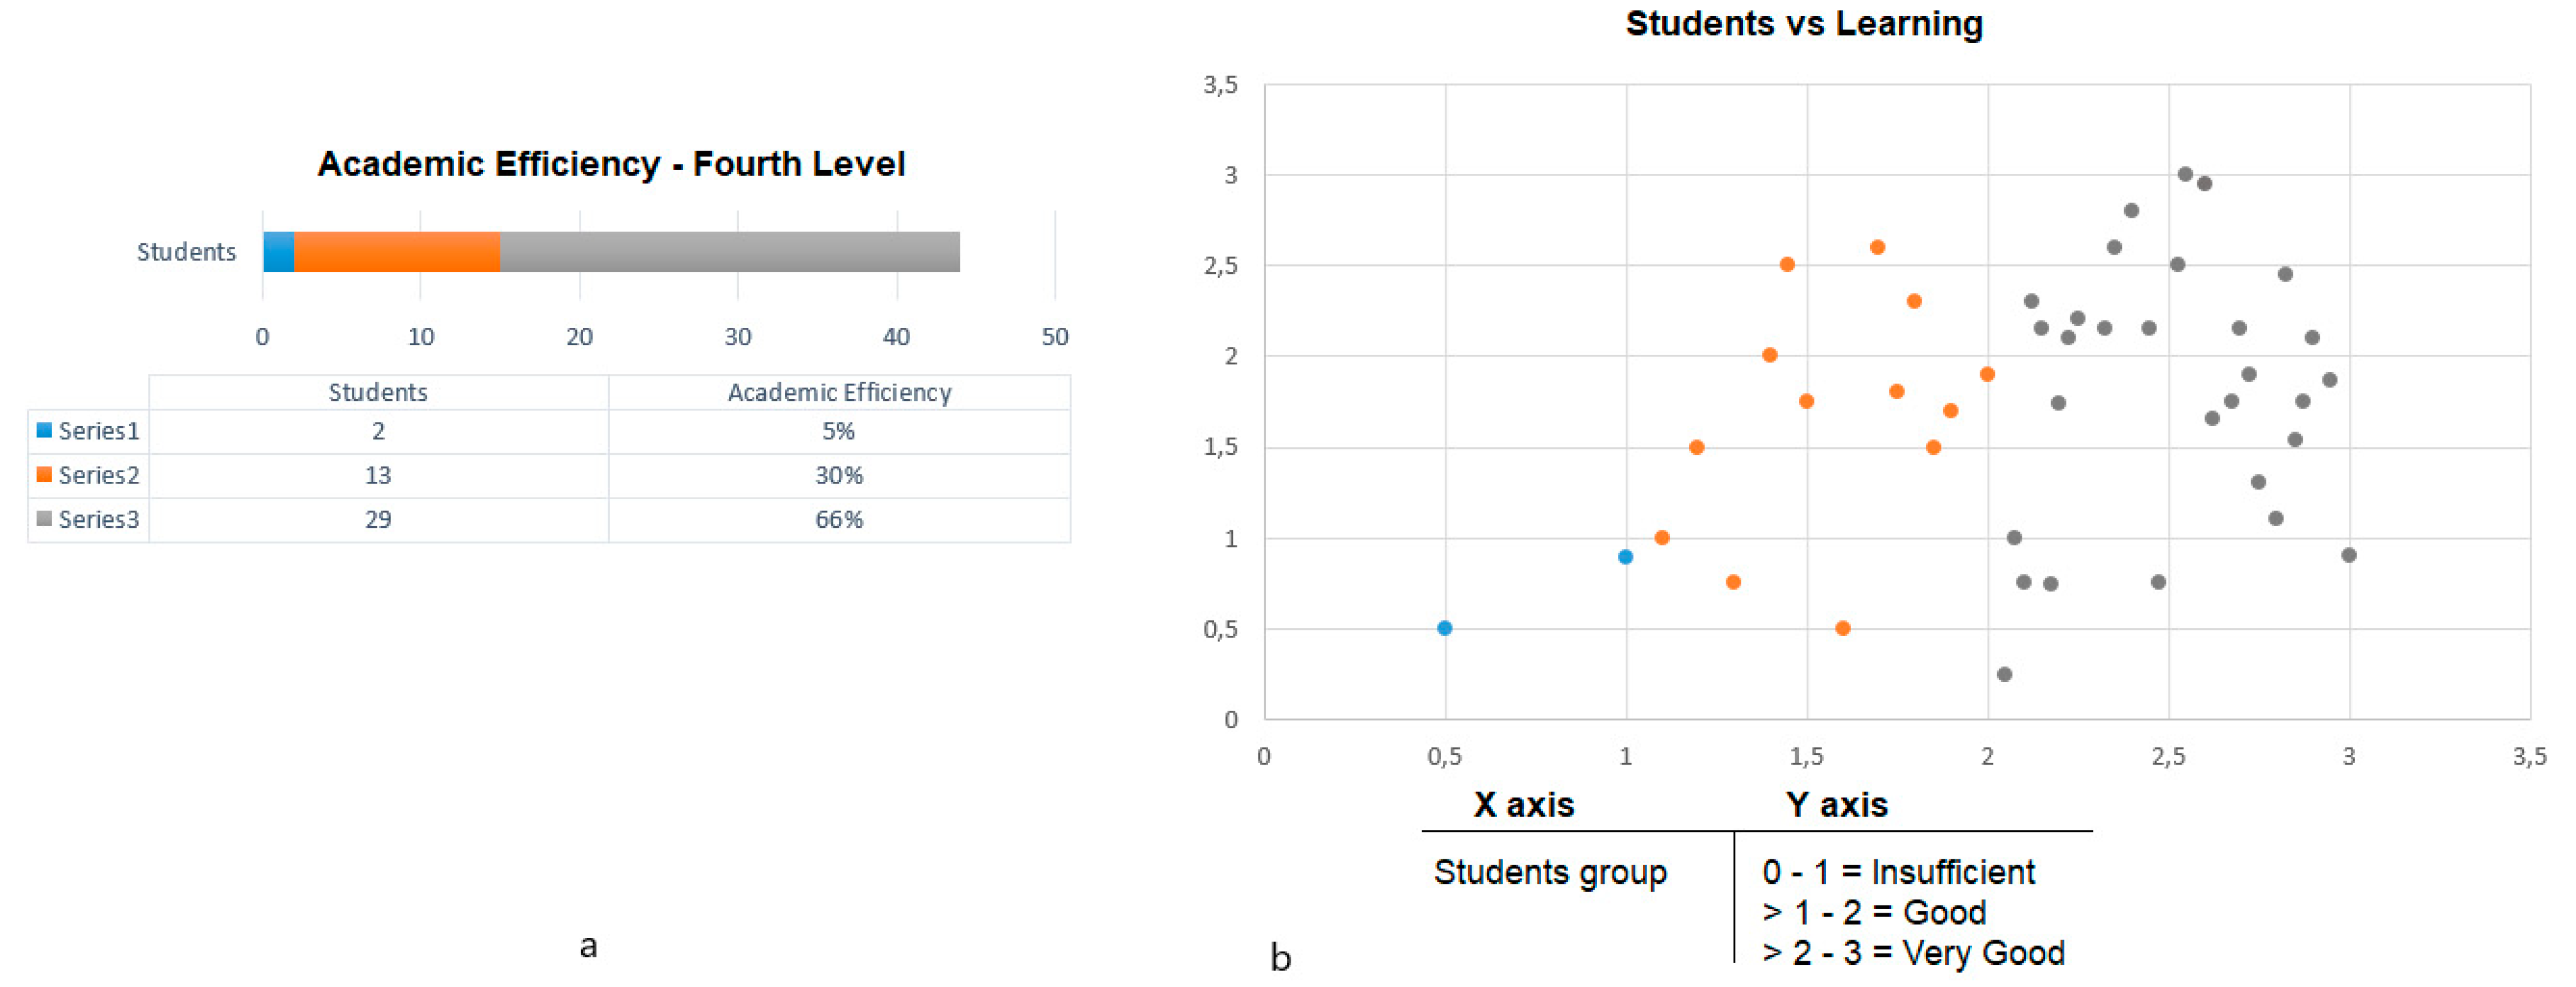
To cross information, the LMS data is integrated into the framework, specifically from the integrating activities in each subject. The activities are evaluated, through rubrics, which allow establishing in each criterion the level where the learning is fulfilled. Each activity is aligned with the learning outcomes, both from the career and from the university. Learning outcomes are designed to determine when knowledge is generated in students, regardless of grades. In
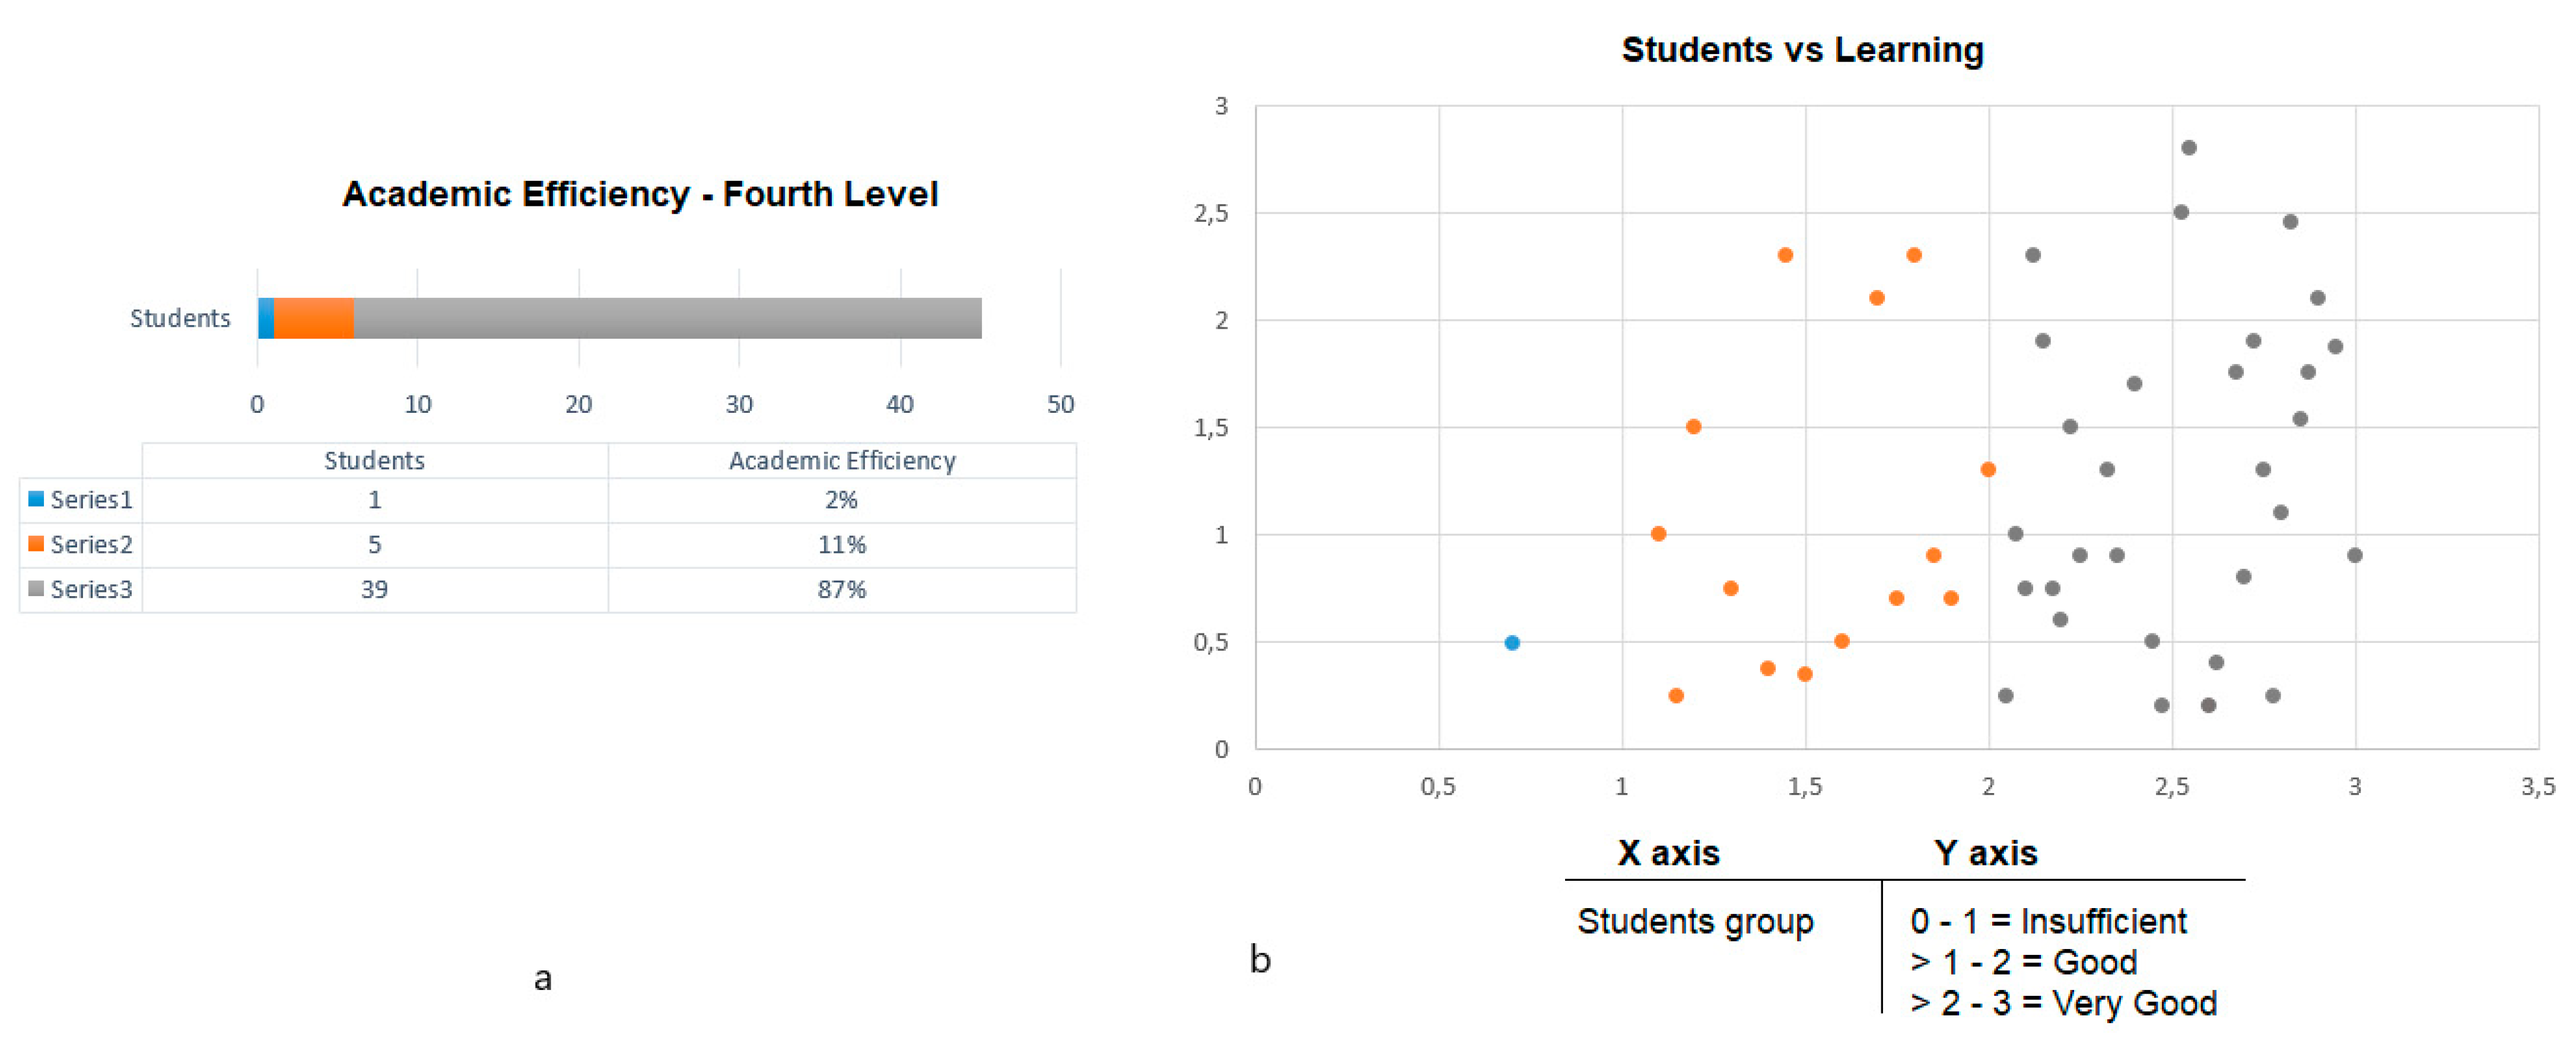
Figure 8, a comparison is presented between the academic efficiency represented by the academic effectiveness vs. the learning. The analyzed group is the fourth level; in academic efficiency, the results were established in the previous analysis. In learning, analysis determines what level each student reached.
The university establishes three levels where students achieve learning. These levels are aligned with the institutional, career, and subject learning outcomes. In addition, from the learning outcomes, each level depends on the level the students are taking: for example, if a learning result of the subject has to do with the student being able to identify the necessary concepts that allow him to propose a solution to an economic problem. If the subject that evaluates this result is from the second semester, it is expected that the student begins to generate learning from a lower level than the one that would have in a seventh semester. The input where this scale is executed is in the evaluation rubrics, which in addition to the qualification, aligning each criterion with the learning results allows measuring when the student reaches it. The three levels considered are insufficient, good, and very good; each level depends on the criteria of the rubric in
Table 1, see two criteria of a rubric and the level at which the learning reaches. Being a fifth semester subject, learning is achieved from a good level; if this level is not reached, it is considered insufficient. In the framework, the three levels for each group were configured as follows: on the Y axis by means of values, it is considered that, between 0–1, the level of learning is insufficient, between values >1–2, the level of learning is good, and of >2–3, the level of learning is very good. The X axis defines the groups of students in relation to the number established in each field of academic efficiency.
In the comparison, see the differences that exist between the grades and the learning of each student. This implies that high grades, or that a student reaches a set average, does not always mean that she is learning. In the first case, the students who are represented by the color blue are observed; these, in addition to obtaining low grades or less than 6/10 in learning, are also penalized, since they remain at a level less than one or insufficient. If the effectiveness–learning relationship were relative, it would be 42 students who easily exceed the insufficient level. However, these are not the results, since nine students who exceeded the average of six have been grouped in the insufficient learning level, 16 barely reach the good level, and 17 achieve a very good level. The results obtained serve greatly to continue with the objective of the work. In addition, it raises an additional question about the causes that cause this difference between effectiveness and learning.
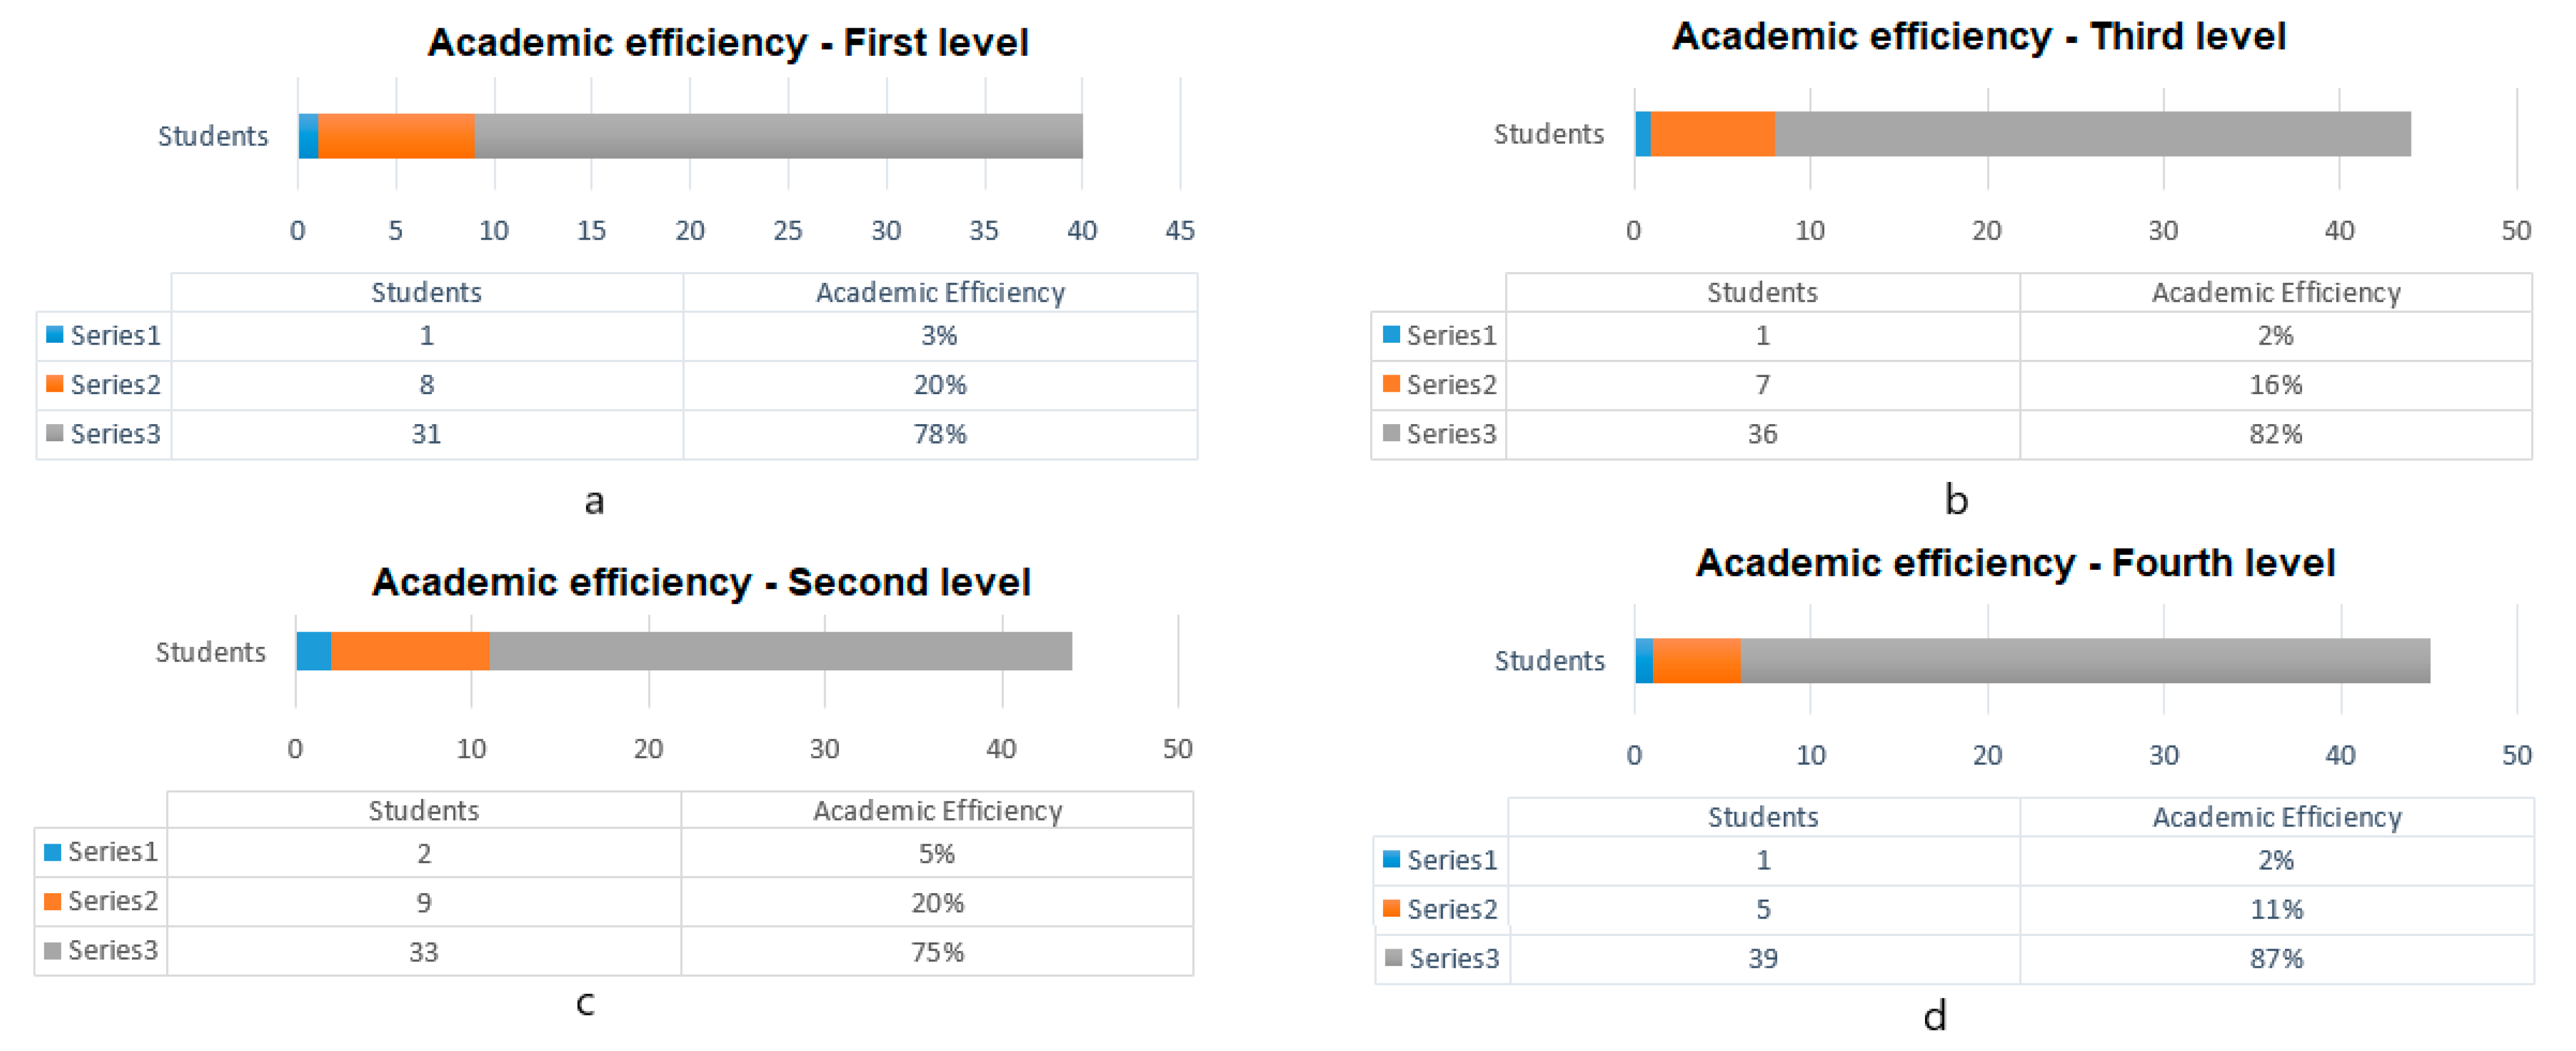
3.2. Data Analysis Applied to the Current Modality
The analysis for the current modality begins with a process similar to that carried out in the face-to-face modality. In
Figure 9, the results are shown, where it can be observed that the number of students who do not reach the average of 6/10 has been significantly reduced. Being that the academic efficiency is the one that has improved, for example, in the first level of 40 students, only one does not reach the established average, being its insufficient use. Only five students who are in the orange band that refers to a good level and 31 students represented in gray, reach an average higher than 8/10. It is necessary to consider that these results occur in a modality where the educational model changes and the classes were carried out in remotely. Now, they follow an online class scheme; these results are repeated at all academic levels of the career that is being analyzed.
In the comparison between academic effectiveness and learning, there is a significant change in the results. As seen in
Figure 10, there is a large drop in learning; however, academic effectiveness does not suffer deficiencies. Even the effectiveness values in relation to the ratings tend to the 8–10 range and are considered as a very good state. In learning, there are 24 cases that are in the range of 0–1, being considered as insufficient, which exceeds 50% of the total number of students. These results are repeated at all academic levels, where learning has been considerably affected.
The way education is carried out at this time has a serious disagreement, because when handling the entire model and components of face-to-face education and transmitting them through a synchronous meeting, it considerably loses its effectiveness. For example, the methods that the teacher uses are not often adequate to transmit them by videoconference. The learning depended strictly on teacher–student interaction. In addition, the fact that the control that was in the charge of the teacher to guarantee the interest of the student has disappeared. This has been demonstrated by the large number of videos that have been a trend on social networks where, in a synchronous meeting, students are carrying out activities totally unrelated to the subject, for example, the students who have been found asleep in the best of cases, or simply students who log in on some device and leave the class. In each of these scenarios, data analysis is applied to identify student learning patterns.
4. Discussion
The results of the analysis present certain peculiarities with which it is possible to work and establish clear parameters to create a hybrid education model as an alternative that is coupled to the new reality. A key point is the difference between learning and academic effectiveness, where reference is made to the grades that are the main input that determine if a student is suitable to move to a higher level. In the analysis carried out in the face-to-face modality, there is indeed a difference between effectiveness and learning. However, in the analysis of the current education modality, this difference is very marked. It would even be expected that in the new modality, there will be a number of cases in which students will not reach 6/10. However, it is the opposite: students manage to exceed this average with almost no problem.
To determine the reason for this situation, a granular data analysis was carried out, where the number of effective hours that students spend interacting with the LMS for the development of activities is integrated. Even additional data from the videoconferencing platform were integrated in order to determine the effective hours of the students in the synchronous meeting. In
Table 2, the results of the analysis performed are presented, in which several systems are integrated by means of the percentage value of the scores vs. the time of dedication. The table consists of three columns in the first one in which the integrating activities are established; these are classified into three items. In the questionnaires, which are developed in class every eight days, the questions are developed from the topics studied the previous week. Another item is the activities in class; these activities are proposed by the teacher based on examples that teacher performs during the synchronous meeting. Generally, the exercises are done by the teacher and the student replicates the processing and uploads the document to the platform during class time. The autonomous activities are available on the platform and the student can develop them and deliver them until the next class. The individual evaluations are integrative, there are two during the period, and they are strictly evaluated with rubrics that measure learning. For its development, the university makes use of IT tools that allow monitoring of the student during the time that the evaluation is available. These tools have a commercial license and are paid per concurrent user. Its operation consists of monitoring all student activity on this computer and monitoring through the device’s camera.
In the results, it can be observed that if we measure in relation to the percentage of compliance with the average greater than 6/10, there is a very large percentage that meets this requirement without any problem. In addition, the resolution times are extremely low; even the teachers to whom the results have been shared have mentioned that the activities are designed to be solved in a period higher than the average indicated in the table. On the other hand, in the evaluation, the students who exceed the percentage is drastically reduced and the time in their development is close to the established limit that is 120 min.
The results of academic effectiveness trigger an anomalous feature, since their difference should not be so marked. To determine what happened, several satisfaction surveys have been integrated in the last period, and self-assessment activities of learning. They seek to create environments where the student can carry out an analysis of their own knowledge. According to the inclusion of the data, very clear answers are obtained; the current model presents deficiencies when transmitting learning. The synchronous meetings, in the model of the university that participates in this study, last three hours. The time is the same that is handled in the face-to-face mode. This factor is the main problem detected because, in the online model with which the relationship is established, it has as a principle a reduced time: in most cases, they are 60-min tutorials. This forces the student to carry out a prior study of the resources and in the tutoring, the teacher is in charge of answering very specific questions or developing a specific topic. In addition, in the analysis of dedication to meetings and activities, it was determined that the session of several students during a class goes into a waiting state, which is executed when the videoconferencing platform does not detect an event on the keyboard, camera, or the microphone. The platform presents these data in real time to the teacher. However, for the teacher to control this action and notifications is difficult to perceive, since the development of the class does not allow it. Therefore, the framework is in charge of extracting the data and processing it to present it according to the needs.
With the information obtained from data processing, it is possible to determine a safe modality change, where the greatest number of variables are considered in such a way that learning is not affected. To make the change to a hybrid model, it is necessary to establish its execution and define the rules to which the students must adapt. The rules establish how the model will work. In the experiences of several universities, the segmentation of activities is an important factor. This means that of the 100% of credits that a subject has, it is defined by what percentage the student can take online and what percentage will be taken in person. The division is made according to the capabilities of the university infrastructure.
The modification of the resources is another important point—even the syllabus must be adapted to the hybrid modality—where it is necessary to consider a percentage of hours for self-learning and the activities must evaluate this component. The learning resources must be modified and worked with experts in multimedia design and the design of academic resources. The resources must be developed with the student as the axis, and they must be interactive. The objective is that students can generate the greatest amount of learning by studying them and their understanding is complemented by interaction with the teacher, who in this modality becomes a tutor or facilitator. With this concept, the number of hours needs a reduction: the percentage should be close to that used in an online education model. This forces the student to become an active part of their learning, where innovation and research take on greater relevance in each subject.
The activities must necessarily be updated, applying the development of skills in the students. This point requires the integration of IT, which implies that like online education, the entire modality and its development must include a high percentage of IT use. In addition, the psychological factor is a fundamental point that must be worked on, considering that most of the students entered these universities convinced of the face-to-face educational model. Therefore, a forced change will lead to the lack of interest of the student, increase in the desertion, and will irremediably punish the learning. The academic assessment models must necessarily include the use of data analysis tools. As there are factors that are not controllable due to the lack of physical interaction with students, technology will be able to cover these actions and obtain data to guarantee a preventive evaluation, and that is communicated directly. Even in future work, the integration of artificial intelligence tools for academic monitoring and the recommendation of activities or academic management is proposed.
5. Conclusions
The current situation in which society finds itself due to COVID-19 has changed the way in which it develops. The confinement to which society is subjected has forced the different sectors and areas to seek solutions based on the use of ICT to guarantee the continuity of their businesses or activities. Universities and other organizations have introduced new tools to their activities to continue with education. The tools that have been integrated in most cases are videoconferencing platforms. However, the integration of these tools solved the problems that arose at the beginning of the pandemic, the main problem being the development of face-to-face classes which, in the traditional educational modality, is the main activity for the development of education.
With the new normal, it is necessary to think of other educational models that adapt to the needs of students. This is not a new idea, since universities have been working for several years to refine educational models such as virtual or online education. These models have been the product of years of research at a pedagogical and technical level. In these models, the main actor in education is the student and all the technical infrastructure and the academic component are made available to the student.
However, the abrupt change that education faced has exposed several existing problems in the generation of knowledge. Usually in traditional educational models, all educational aspects are available at the service of the teacher, since in this environment, it is he who is in charge of what students should learn and how they should do it. When seeking the continuity of education through videoconferencing platforms to execute a face-to-face education model, universities encountered several problems in its execution. A traditional master class is not comparable with a synchronous class. The problems that exist in this change involve the method that exists for the teacher to teach her class, technical problems, to the lack of disposition on the part of the students. There was a misconception in certain universities that, by implementing synchronous sessions while maintaining the face-to-face method, assumed that the results would be similar to those of online education. As the months passed, this concept became clear on its own. Online education requires a methodological change in all its areas; having a tool that allows for meetings without chronicles does not guarantee learning.
This work considers the problems generated by the change that education underwent due to the pandemic. As a solution, the transition to a hybrid education model is proposed based on the analysis of the data available at the university. The data analysis carried out by a Big Data framework identifies the learning deficiencies that exist in the face-to-face education model and the current model. With the knowledge acquired in the analysis, the main points for the transition to the hybrid model are defined. However, for the change to take place guaranteeing learning, it is necessary to consider online education as a second axis. Its versatility and coupling to the needs of students is a factor that should be included in hybrid education. This is the path that various universities will take to present their new academic programs. In addition, it must be borne in mind that education will not be the same again and the new normal will change the way society carries out its economic activities, its personal relationships, and even the way it learns.
Once the causes of the learning disability are identified, it is possible to determine a plan for creating a hybrid model. The optimum is to take the best of the face-to-face education model and the best of an online education model. In the face-to-face model, the availability of areas and human resources that exist for student care will always be an advantage. By leveraging this potential and adding IT to your processes, it strengthens problem detection and academic needs. Even when carrying out the data analysis, it is possible to take advantage of the data that is considered reserved from the students. In this data is psychological and emotional information of the students; by adding this data, valuable knowledge can be obtained that will improve the opportunities to help students. Online education has a method that has worked for years to meet the needs of students without the need to take face-to-face classes. This methodology must be modeled to the new normal, specifically in the time of dedication of the students. For these to assume a greater role in their education, it is essential to reduce the number of class hours and increase the hours of research and self-study. Another factor to consider is the activities proposed to the students: these activities must be designed under competencies aligned to an active education.


 ,
, 


