
Topology of the World Tourism Web


1
Faculty of Economics and Tourism “Dr. Mijo Mirković”, Juraj Dobrila University of Pula, 52100 Pula, Croatia
2
Istrian University of Applied Sciences, 52100 Pula, Croatia
*
Author to whom correspondence should be addressed.
Appl. Sci. 2021, 11(5), 2253; https://0-doi-org.brum.beds.ac.uk/10.3390/app11052253
Submission received: 8 February 2021
/
Revised: 24 February 2021
/
Accepted: 26 February 2021
/
Published: 4 March 2021
(This article belongs to the Special Issue Social Network Analysis)
Abstract
:The applications of social network analysis to the world tourism network are scarce, and a research update is long overdue. The goal of this research is to examine the topology of the world tourism network and to discuss the meaning of its characteristics in light of the current situation. The data used for the analysis comprise 193 target countries, 242 source countries, and 17,022 links, which is an overall 1,448,285,894 travels in 2018. Social network analysis is applied to the data to determine network topological and diffusion properties, as well as the network structure and its regularities (does it behave more as a social or a technological/biological network?). While results presented in this paper give a thorough insight into the world tourism network in the year 2018, they are only a glimpse in comparison to the possibilities for further research.
1. Introduction
Complex systems, such as tourism, may be observed from the social network analysis (SNA) perspective. The importance of SNA use in the analysis of economic and social networks arose during the last crisis [1,2]. Accordingly, most of the research applying SNA to tourism dates back a decade or less.
The motivation for this research is to fill in the research gap regarding the use of SNA in tourism. While SNA has been used to determine the relations and interplay of the actors at the local, country, or regional level, the comprehensive endeavors to examine the tourist network at the global level, which have been done for trade [3,4,5], are scarce, except for a few efforts in the field. Miguéns and Mendes [6] studied inbound and outbound tourism based on international tourist arrivals for the year 2004. In addition, Lozano and Gutiérrez [7] examined the top outbound vs. inbound countries in the tourism network on the global scale for the years 2013 and 2014. Seok et al. [8] examined the international tourism flow for the period from 2002 to 2014 based on UN World Tourism Organization (UNWTO) data for 218 listed countries. In addition to the complexity of the network, tourism is also a dynamic phenomenon, indicating network growth and development over time. Thus, findings from the previous years may not be valid over a longer period of time.
The goal of this research is to examine the topology of the world tourism network and to discuss the meaning of its characteristics in light of the current situation. We build on the previous research [6,7,8], aiming for a more extensive and exhaustive world tourism network overview with the most recent data.
The following section offers a theoretical basis for the research, with an overview of similar research and research gaps, followed by the definitions of used data, data collection descriptions, and data-related difficulties, ending with a description of our analysis. The Results and Discussion section reveals calculated network properties and discusses those properties in the tourism, economic, and pandemic contexts. The Results and Discussion section is divided into sub-sections to enable reading and navigating by topic, which include Network Topology and Structure (with the sub-sections Basic Network Measures, Countries’ In- and Out-Degrees, Centrality Measures and Clustering, Communities, and Patterns), examination Whether the Network Behaves as a Social or Technological/Biological Network (with the sub-sections Small World and Free-Scale Networks, Pareto Rule, Assortativity, Patterns between the Core and the Periphery, High Clustering Coefficients, Homophily, Weak Ties, and Structural Holes), and Network Diffusion Properties.
While the article is primarily quantitatively oriented and focused on the topology of the tourism network, our goal is also to keep interested even non-quantitatively oriented readers by providing a sufficient topic background and the interpretation of the findings in relation to realistic settings.
2. Materials and Methods
2.1. Theoretical Basis
Tourism refers to a specific set of activities taken by a traveler when taking a trip to a destination outside his usual environment for a limited duration (less than a year) and for any main purpose except for employment (the masculine gender is used for comprehensibility, and throughout the paper, such terms should be understood as referring to all genders, equally) [9]. Aggregation of such activities and related actors create a tourism market, involving numerous stakeholders and allowing observation from different perspectives. Hence, tourism may be observed from a social, cultural, and geographical point of view, but it is still predominantly observed from the economic point of view due to its relevance to national economies. Given the economic perspective of tourism, most of the research has been done using econometric models where only a part involving time series considers a dynamic perspective. This also means that most of the findings are delivered assuming a static form. However, such approach is not suitable for systems that are inherently volatile and dynamic [10].
Historical data points out to tourism as a global phenomenon with continuous growth at the global level [11,12]. The rapid tourism growth has been supported by many factors [8]: technological advancements (that lead to the expansion of air travel, digitalization, availability of information, and easier travel organization), changes in socioeconomic factors (education level, distribution of age groups, living standards, global cohesion, and cultural exchange), economic agents (number of travel agencies, international airlines, employees in the tourism sector, touristic capacities), as well as the revenues and expenses of tourism. According to the same authors, a cause-and-effect relationship between tourism and economic growth creates a clear motivation for in-depth analysis of tourism. Moreover, the tourism industry also shows susceptibility to crises and disasters, which are revealed as structural breaks in the international tourism demand but can be determined only ex post using historical data [13]. The macroeconomic uncertainty that occurs in the times of crises, political instabilities, and disasters affects the income level and consequently the behavior of tourists [14]. The authors analyze historical data and find that if the uncertainty is related to their income, tourists tend to travel more but mainly to neighboring countries and spend less on their trips [14], suggesting a diversification of tourism activities. This finding might prove relevant to the current crisis caused by the COVID-19 pandemic.
Travel-related diseases were a problem for tourism in underdeveloped countries long before the current situation [12], and perceived risks influence tourists’ destination choices. The duration of the COVID-19 crisis and recovery cannot be easily forecasted, as people tend to change behavior and new trends and behavioral patterns occur [1]. Following the same thought, Kock et al. [15] suggested that the current pandemic will most likely shift the tourist psyche and consequently cause implications of seismic proportions for tourism. While the tourists may develop disease avoidance behavior (and thus avoid out-of-group members [15]), which would guide their travels and lead to a decrease or systematic change in tourism as we know it, they might also eagerly wait for the end of the pandemic to regain control over own activities and enjoy the travels (previously taken for granted), which would lead to an increase in touristic activities. At this point, one can only speculate. Moreover, historical data are not very useful for trend prognosis in such situations, as successful identification of structural brakes and their effects on behavior and economic activities occurs after the event.
Tourism research requires new approaches—both in measurement and in analysis, partly because of its complex nature arising from interactions between social and economic components [16]. While the authors primarily discuss satellite tourism accounts, the issue of measurement and analysis problems extends to all macro-level research. The issue of qualitative and quantitative methods in tourism research is also addressed by [17], who emphasize a constructive and interdisciplinary approach for monitoring and managing tourism activities.
The importance of SNA use in the analysis of economic and social networks was highlighted during the last crisis [1,2]. One of the first suggestions for combining tourism and SNA extensively discusses the possibilities for SNA application to tourism [18]. In the overview of SNA in tourism [19], authors discuss the relational quality of the data, along with difficulties and limitations of their use, list possible ties between the nodes, discuss measurement scales, and systematize previous research according to used parameters for network description. Cehan et al. [20] classify the application of SNA in tourism concerning two mainstream topics: destination management and collaboration between tourism stakeholders and the relationship between tourism and innovation. However, there are also studies that apply SNA to tourism with respect to sustainability (for example, [21,22]), contributing to sustainable tourism trend, as well as papers that reveal flow and behavioral patterns (which may, but do not have to, be related to destination management; for example, [23,24,25,26]). Lozano and Gutiérrez [7] comprehensively systematize previous research into the following topics: tourism destination networks (real-world relationships, web links, mobility/traveling patterns), attractions/villages spatial networks, tourism dynamics, social media and web navigation patterns, tourism flows, tourism and migration/human mobility, and surveys and others. As a detailed overview of the SNA application in tourism has been provided by [7,18,19] and an extensive review of the research area is beyond the scope of this paper, we kindly encourage the reader to check the referred articles.
The motivation for analyzing tourism within the SNA framework is “understanding the flow of tourism (which) has a source of inspiration related to local and global systems, as well as, strategic marketing in tourism industry development” [8]. The authors examined changes in the international tourism structure over time. They revealed that network centralization gradually decreased, which leads to the conclusion that tourist destinations (and tourists’ preferences) are continually diversifying. Nevertheless, they revealed that some countries remain in top positions over time, with minor variations in ranking, which is in line with previous research [7]. Due to the dynamic aspect of their approach, the authors [8] also learn of the rapid growth of countries that removed travel restrictions on inbound and outbound tourism. The two studies [7,8] also reveal clustering of the countries underlined by geographical and cultural proximity. The importance of geographical and/or cultural patterns also proved important in other SNA applications in tourism flows and movements at the local, country, and regional levels, for example, [27,28,29,30,31,32].
The tourism network might exhibit properties similar to the properties of other global networks (as it relates to other global systems [8]). Due to its economic component, the tourism network could show similarities to the trade network [3,4,5,33] or the financial network [34,35]. However, due to its social component, it might resemble migration [36,37] or the education network [38]. Likewise, similarities may exist with the www (World Wide Web) network [39] due to the digitalization processes that support tourism development, as well as with traffic networks [40], which enable travel.
According to [10], in SNA application/ there might be biases and idiosyncrasies related to each data set, but the author’s critique is mainly pointed to the lack of a systematic approach to determining the “prevalence of characteristics across ranges of social settings”. The author argues that many studies should be cautiously interpreted as they might be anecdotal. To fill in the gap, he systematizes the related research in the social and economic setting and points out to regularities in the characteristics of social and economic networks, which tend to have:
- a small diameter and a small average path length in the large networks (small worlds);
- degree distributions with a fat tail in many observed large networks; only a few of them strictly follow the power law, even if they visually appear as scale-free distributions;
- positive assortativity (high-degree nodes tend to be related to other relatively high-degree nodes; a technological and biological network is expected to observe negative assortativity or the correlation of in-degrees across linked nodes);
- patterns between the core and the periphery, where the core is made of highly connected and interconnected nodes;
- high clustering coefficients;
- a decreasing rate of clustering among the higher nodes, given the degree (overall clustering is significantly lower than average clustering);
- homophily, which may be a result of an opportunity or a choice (people tend to connect to similar people to themselves);
- weak ties, which may be important due to their bridging behavior in relation to dissemination (mostly information), but this property still lacks systematization in research for its generalization; and
- structural holes—a lack of connection between groups.
Our analysis is primarily exploratory, and the main goal is to determine topological properties of the world tourism network. However, tourism’s complexity and interdisciplinarity makes the tourism network a perfect candidate for examination of its properties in line with Jackson’s [10] systematization. In addition, the current pandemic, along with information and cultural exchange, creates a motivation for exploration of tourism network diffusion properties.
2.2. Basic SNA Elements Applied to Tourism
The basic elements in SNA are nodes and the links between the nodes. Based on the setting, the nodes (or vertices) may represent persons/tourists, stakeholders, countries, or agents/actors. The links (or edges/arcs) are relations between the nodes, also referred to as ties. Wasserman and Faust [41] systematized possible ties. In tourism, the relations or ties may denote, for example, transactions (payment for goods and services, cultural exchange, etc.), movements (physical movements of tourists from the country of origin to the country of destination, movement between locations in the destination country, virtual movements over websites, etc.), or formal roles (relationship of accommodation units to agencies and/or to the government).
Given the properties of the relationship represented by links, a link may be undirected or directed. For example, if the movement of a tourist from the country of origin to the destination country is observed, a network representing that phenomenon should be a directed network. If one observes a cultural exchange between tourists, such phenomenon would be represented by an undirected network. The main difference (besides the analytical perspective) between directed and undirected links is based on how the links can be severed. For example, in the case of cultural exchange, where the link is undirected, it is assumed that both sides should agree to sever the link. In the case of tourists movements, a ban on traveling from the country of origin can be made without the consent of the destination country. Recently, it is estimated that international travel bans affected over 90% of the world population, according to [42]. For analytical purposes, those ties may be coded as binary, in which case they reveal whether a relationship between the two nodes exists or not, or they can be weighted, in which case a value is assigned to the link between the two nodes, enabling the examination of the network properties, given some quality (measured by assigned values).
A path of the network denotes a sequence of links, where each node appears only once, while a walk is a sequence of links without the restriction of node distinction. In a directed graph, one must follow the direction of the link when determining either a walk or a path. A network is connected if every two nodes may be reached by some path.
Networks and their components may create specific forms (forest, tree, star, cycle). For example, a tourism network based on a formal relationship between the guests, agencies, and the government would resemble a tree or even a forest; the recommendation network of one tourist might resemble a star; an efficient tour over the tourist attractions in a destination might resemble a cycle. Other networks can create uncharacteristic shapes, but some of their components or partitions may resemble specific forms.
If the nodes can be systematized by a certain properties into subgroups, for example, in previously mentioned tourist movements, one might want to organize the countries of origin and destination countries according to the region or belonging continent, which can be done using coloring, allowing for an additional examination. So, networks can be observed as an overall connection of the nodes, but sometimes, for research purposes, it is interesting to observe network components or even each node. This is usually done by analysis, computing summary statistics that enable network characteristics’ interpretation and comparison to similar networks. In addition, from the perspective of a network, network density, degree distributions, diameter, and average path length are usually calculated. Next, most often examined are network compounds, cliquishness, cohesiveness, and clustering [7,8,10]. In the case of tourism examinations, homophily between the countries of the same region may be examined, as well as the transitivity [6,7,8]. As for the nodes, usually calculated statistics refer to the degree or in- and out-degree of a node, and its neighborhood, degree centrality, and other centrality measures—closeness, betweenness, and prestige, power, and eigenvector centrality measures [8,10], as well as the strength and reciprocity in weighted and directed networks [6,7,8].
2.3. Definitions and Data
The data from secondary sources are used, most of it from UN World Tourism Organization as they offer a most comprehensive database on the topic. The usual approach to SNA considers the use of a finite population with enumerated elements or the entire population, which is, in this case, all the countries. However, data availability and establishing the limits of the network are common problems in SNA [19]. We started from the list of countries by UN Arrivals of Non-Resident Tourists/Visitors, Departures and Tourism Expenditure (UN World Tourism Organization (UNWTO)), involving 221 countries.
The literature conceptually differentiates travelers, visitors, and tourists. These conceptual differences also represent different measurement recommendations [9]. The data available at UNWTO are compiled according to [9], so their definitions are relevant to this research. A traveler is the person “who moves between different geographic locations for any purpose and any duration” [9]. A visitor is “a traveler taking a trip to a main destination outside his/her usual environment, for less than a year, for any main purpose (business, leisure or other personal purpose) other than to be employed by a resident entity in the country or place visited” [9]. Tourists are equal to overnight visitors (same-day visitors are excursionists, and travelers passing through the country are transit passengers), and tourism is a subset of travelers and visitors [9]. Overnight visitors or tourists usually require some type of accommodation, where they are subject to a survey or registration for which they provide personal information or characteristics of the trip. While such surveys do not primarily serve to determine the number of arrivals based on the country of origin, such data are often used instead of the border report if such report cannot be obtained. The country of residence can be differently classified by different forms of tourism and its recommended classification, but it must be determined by a question. The travelers’ nationality is usually referenced in the passport, but it does not have to refer to the same country as the country of residence, as people might have more than one nationality and more than one passport [9]. However, when information about the country of residence cannot be obtained, the nationality data are used as a supplement. International Recommendations for Tourism Statistics (IRTS) 2008 [9] differentiates internal, national, and international tourism.
We focused on international tourism, based on the number of arrivals of tourists by their country (other than the country where they have their residence). While obtaining available data, we learned how true a statement from [9] it that “tourism is a phenomenon for which statistical representation has its particular challenges because of its special nature,” as available reports reveal a variety of approaches and inconsistencies in reported data over the countries. Most of the countries report the number of arrivals at national borders. However, some of them report tourists by their country of residence, while others form the report based on the tourists’ nationality—rarely both. Some countries do not check the duration of the travel at the borders and hence do not distinguish tourists from visitors, so they report all people entering as visitors. At the same time, countries that do distinguish tourists from visitors rarely report the number of visitors at the borders. In addition, some countries belong to zones in which national borders are abolished (for example, Schengen), where the movement of people is unrestricted. Due to impossibility of control at the borders, those countries usually report the number of arrivals based on the reports from accommodation units. There is also a distinction in reports regarding the use of all accommodation units or just hotels and similar establishments. The same problem of the data collection has been addressed by the World Bank, as it used the same sources for representation of [43], meaning that the countries only loosely adhere to recommendations for tourism statistics [44] in their reports.
From the perspective of the time periods in the available time series, the data for the latest year available for most countries (187 countries) are for 2018, so we focused on the data from that year. There were 14 countries for which we could not find data for any of the stated type, neither in the UNWTO database, nor on their national statistics bureaus (or tourist bureaus, if any) websites. In addition, there were 23 countries with outdated data, meaning that the reports exist but do not include the target year. The systematization of the countries according to the source of the data used in the analysis is listed in Appendix A, Table A1, but the data were also published in a yearbook [45].
We used the following available data: arrivals of tourists at national borders, by country of residence as the preferred source; if unavailable, then arrivals of tourists at national borders, by nationality; if unavailable, then arrivals of non-resident tourists in all types of accommodation establishments, by country of residence/nationality; if unavailable, then arrivals of non-resident tourists in hotels and similar establishments, by country of residence/nationality; if unavailable, then arrivals of non-resident visitors at national borders, by country of residence/nationality; if unavailable, then data from the statistics bureau (or the tourist bureau) of the country. For countries for which only data for earlier years were available, we approximated the values for 2018 (for the countries where aggregated data for 2018 were unavailable, we used the time series from the International Tourism, Number of Arrivals document and extrapolated the expected value for 2018 from the trend; to approximate the number of arrivals for each country, we used the shares of the last available year and applied them to the extrapolated value). For countries that reported unusual data, we additionally checked the data from national statistics bureaus and used those data (for example, for Poland, the data reported as tourist arrivals at national borders were actually the number of overnight stays). In addition, some countries’ reports appeared unusual, but the control revealed that they keep the statistics in thousands (for example, Ireland and the Netherlands). Another limitation arises from the data that referred to the Other category, where some countries report a substantial number of arrivals, while probably focusing only on the arrivals from the countries they deem relevant. From the SNA perspective, this represents a significant loss of information, which could result in structural holes, even though they may not be present otherwise. However, besides the recommendation for a detailed and systematized approach to data collection in tourism, from the current research perspective, we cannot compensate for that occurrence. As previous studies on the topic [6,7] do not mention difficulties in data collection and the variety of approaches (besides the unavailability of data for some countries), we can only assume that the procedure of data collection in tourism has worsened and recommend the formation of a detailed and unified concept of data collection.
As the exclusion of the nodes in the network leads to an exponential loss in information [19], we strove to include all the available data. For example, exclusion of one node from this network in some cases could result in exclusion of up to 400 links. However, while the methodological inconsistencies suggest the need for a unified approach to data collection, they also represent a limitation for this research. An additional limitation is the snapshot approach, considering only one year. Nevertheless, such approach still enables approximation of the world tourism web, and it has been applied before [6,7].
The collected data required a substantial amount of intervention (cleaning, renaming), as some reports involve arrivals from countries that do not exist anymore (for example, Swaziland, Yugoslavia, etc.). In doing so, we strove to respect political correctness and the autonomy of countries and provinces (as the same approach has been indicated in UN reports; for example, separately listing Hong Kong, Taiwan, etc., as sources).
The database was created using MySQL Database, which was managed by the phpMyAdmin front-end tool. The country names were adjusted according to the official UN statistical methodology regarding official English country names. A SQL query with the UNION SET operator was used to create a list of source and target countries (edge list) with assigned arrival numbers as input for analysis. In addition, the INNER JOIN operator was used to add the source and target coordinates (average latitude and longitude coordinates [46]). The resulting dataset includes 193 target nodes, 242 source nodes, and 17,022 links, which comprise an overall of 1,448,285,894 travels in 2018.
2.4. Analysis
The tourism network is directed and defined as T = (V, A), with a set of vertices (nodes) V and a set of arches (links) , which connect the source and target vertices. For the tourism network, the in-degree and out-degree differ for each vertex:
and
where n(v) stands for the set of neighboring vertices to the vertex v [47].
A weighted tourism network treats the number of arrivals as weights of the arcs, w(a), where the weighted in-degree and the weighted out-degree differ.
The calculations are performed with and without using arrivals as weights.
The statistics calculated for the network and the nodes are as follows:
- Average in-degree is the average number of incoming links (the source countries from which tourists arrive to the target countries). In terms of the tourism network, the in-degree can be an indicator of how likely is that other countries will be drawn to the observed country (presumably) due to its touristic attractiveness. So, the average in-degree points out to the average number of countries drawn to one country in a tourism network.
- Average out-degree is the average number of target countries to which tourists travel from the source countries. Given the data used, the average out-degree must match the average out-degree, but individual values of countries’ in- and out-degrees do not have to be the same. Hence, standard deviations may be different, revealing different underlying distributions.
- Average degree is the average number of countries to which a country is connected in the network.
- Average weighted in-degree or inward link strength is the average number of tourist arrivals from source countries. It is the average of individual countries’ weighted in-degree (the number of tourists drawn to a country).
- Average weighted out-degree or outward link strength is the average number of tourist departures to target countries.
- Average weighted degree is the average number of tourist arrivals and departures per country. The weighted degree illustrates a country’s share in the tourism market, measured by the number of tourists.
- Diameter [48] is a maximal distance in the network and shows how many connections it takes to traverse the network. It is a longest shortest path length.
- Radius [48] is the minimum over distances of each country-node to the farthest country-node in the network (or a minimum over all eccentricity values), indicating how (dis)connected countries are.
- Average path length [48] measures the average of the possible geodesic (shortest path) between all countries in the network and is an indication of network efficiency.
- Density [41] is a share of links in the network in all possible connections in the network. Generally, values closer to 1 mean that it is a dense graph, while values closer to 0 reveal a sparse graph.
- Average clustering coefficient [49,50] is an average of individual clustering coefficients. Individual clustering coefficients measure the degree of connections between the countries to which a certain country is connected. If a clustering coefficient of a country is closer to 1, it means that almost all its connections are connected between themselves. This also indicates that the country is less important in the network.
- Number of triangles [51] is a summation of open or closed triples in each country’s network.
- Number of paths (length 2) [51] is a summation of all paths of length 2 for each node.
- Clustering coefficient (triangle method) [51] is the ratio of the number of closed triples to the number of all possible triples in the network.
- Number of strongly connected components [52] is the number of subgraphs that contain interconnected nodes. In a strongly connected component, each country can be reached by any other country, and vice versa.
- Number of weakly connected components [52] is the number of subgraphs where the links can be formed in only one direction (and observed as undirected in the opposite direction).
- Eccentricity of the largest weakly connected components [55] can be interpreted as a diameter of each node in the largest weakly connected component.
- Closeness centrality [48] is a measure of a country’s position in the network based on the distance to every other country in the network, where a poorly connected country can have a higher centrality if it has a high proportion of high-degree countries in direct connections. Normalized closeness centrality is more commonly used, where values closer to 0 indicate a greater distance from the center of the graph, meaning a worse position in the tourism network in comparison to neighboring nodes.
- Betweenness centrality [48] measures how many times a country appears on the shortest path between every two other countries respective to all shortest paths, which identifies countries that may or may not be central by other parameters but connect otherwise disconnected countries by serving as bridges. From the tourism perspective, this means that tourists from otherwise unconnected countries may find themselves on the same location (a country with a high betweenness centrality) and possibly interact, which emphasizes the importance of such countries for information, cultural, and other exchange.
- Prestige rank [41] is a measure of a node’s importance in the network based on the inbound tourism. Countries with high prestige ranks are the ones that host (many) tourists from many different countries, but do not necessarily reciprocate with their outbound tourism.
- Authority [59] is more commonly used in www analysis, where higher values are interpreted as that node having stored more valuable information. In the tourism network, the interpretation cannot be the value of information, but rather the overall tourism value (both for outbound and inbound tourism).
- Hub [38] measures how well connected a node is. Hubs are countries that have strong inbound and outbound tourism connections to other important nodes in the network.
- Page rank [60] was first used to rank web pages. It considers the relationship of the in- and out-degree for a node and determines the probability that the node will be reached by a walk. The higher the probability, the better the country’s rank. It can be observed as a measure of popularity.
Calculation and visualization are performed using two open source software programs in combination, Gephi [61] and R (igraph, tmap, tmaptools, maps, leaflet, geosphere, spData, and sf packages).
3. Results and Discussion
Results of the conducted analysis are presented in Figure 1, Table 1, and Supplementary Files S1 and S2.
The results are interpreted and discussed in the following sections.
3.1. Network Topology and Structure
3.1.1. Basic Network Measures
A tourism network is a connected network where at least one link exists to each node. The average degree points out that on average, nodes are connected to more than half of the nodes in the network. The average in-degree accordingly suggests that countries, on average, receive tourists from more than a quarter of the countries in the network, or in the case of the average out-degree, tourists go to over a quarter of the countries in the network (Table 1). The average in-degree and average out-degree are equal as the countries are both source and target and the total in the numerator is the same. The in-degree range is 233 (from 0 to 233), with an average of 70.339, and the standard deviation is 75 degrees, which denotes high variability. The out-degree range is 187 (from 1 to 188), and the standard deviation is 39.77 degrees. Data variation is even higher for weighed degrees, with an in-degree standard deviation of 15,365,473.17 degrees and an out-degree standard deviation of 16,982,264.39 degrees.
The network diameter is small in comparison to the network size, meaning that the graph can be traversed by four connections. Accordingly, the nodes’ eccentricities are quite small and the average eccentricity is 2.227, meaning that for most countries, the longest shortest path has a length of 2. The average path length is also very small (1.66), suggesting that on average, most nodes can be reached by the shortest paths of lengths 1 or 2 from any other node, which points out to relative efficiency of the graph. This is also an indication of subgraph star structures along with cliques of 3 within the network. Given the small diameter, it is expected that the network is not very complex, yet other measures will address that question. Previous research [7] revealed diameters of 6–14 for the groups of top k countries in inbound and outbound tourism. While such methodological approach disregards some of the nodes and links, the significant difference indicates the increase in link formation. Moreover, the authors report an average geodesic of 1.669–3.799 for observed groups of the countries, where the lowest value belongs to the top one inbound group of countries and corresponds to our calculation. This could mean that the interconnectivity of the countries increased due to tourism development and shortened the average shortest path for the tourism network in 2018 to the level that was present only for the top one inbound group of countries in 2014.
The graph density indicates a relatively sparse graph. The number of existing links is less than a third of all possible ties, given the number of the nodes. When comparing the findings to Lozano and Guiterrez’s [7] findings, who found that the top k inbound and outbound countries analyzed separately show a density of 0.003 to 0.014, it seems that the connectivity in tourism has intensified over the years. However, these differences may also result from the different methodological approach. In comparison to other global networks, this might be an indication of sector development. For example, in the education network, the density was 0.1235 in 2011 [38]; in the migration network, it was 0.47 for the year 2000 [37] and 0.046 in 2019 according to Barnett [62]; in the financial network, density varies between 0.2 and 0.6 [34]; and for the international trade network, the density reaches an amazing 0.98 [35]. International trade has the most realized links, meaning that almost each country trades with every other country. However, international trade (or trade in general, for that matter) has the longest tradition, and those links have been forming over a very long time. On the other hand, international flows in education are a more recent development (also due to availability of education and efforts to increase the share of highly educated persons in the population). The migration flows might change due to political (in)stabilities, the economic situation, and globalization trends. It seems that the numerosity of formed connections is an indication of the development stage, which in the case of tourism means that the possibilities for growth are high. However, the insight into migration densities shows that people’s movements are sensitive to disturbances and global trends, which leads to the expectation of a lower density of the tourism network in 2020 (after the pandemic occurrence) and its increase in subsequent years along with presumably supporting global tourism trends.
The average of the nodes’ clustering coefficients indicates that for most of the nodes, their neighbors also have a direct link between them. However, this also means that the importance of most links in the network is relatively small, as their neighbors are already connected to each other. Cluster analysis reveals the existence of six clusters for the not-weighted graph, but observing in combination with high clustering coefficients (clustering coefficients vary from 0.4639 to 1), it is likely that overlaps and embeddedness occur. The weighted graph reveals only two clusters, indicating higher cohesion when applying weights. The clustering coefficient calculated over transitive triples (cliques of size 3) confirms the same insight, indicating that on average, a fraction of those triplets occurs in roughly two-thirds of the cases (while individual clustering coefficients vary from 0.3066 to 1). Our findings are in line with previous research of world tourism networks [7], which reveals several clusters by different criteria. The clustering is present in other global networks, as well. For example, in the trade network, individual cluster coefficients are close to 1, and for the international financial network, they vary from 0.7 to 0.85 [35]. In the migration network, the average clustering coefficient increased over time and reached 0.76 in 2000 [37]. While the average clustering coefficient is high in this network, it can be observed that individual clustering coefficients vary more in comparison to other global networks, suggesting the necessity for a deeper insight into the nodes’ position in the network.
Additional insight may be obtained if we switch to the micro approach, observing node statistics (Supplementary Files S1 and S2).
3.1.2. Countries’ In-Degrees and Out-Degrees
While each country could/should be interpreted, due to the limited space, only a few top countries will be discussed (while the interested reader can access the data for all countries in Supplementary Files S1 and S2).
Figure 2 shows the in-degree distribution over countries, where the darker color of a country denotes a higher in-degree. For instance, the highest in-degree occurs for Canada, followed by the United Arab Emirates (UAE), Belgium, Uganda, and the United States, while the lowest in-degrees are for Andorra, Saint Kitts and Nevis, Saint Vincent and the Grenadines, and Turks and Caicos Islands. Besides that, there are additional 47 nodes with an in-degree of 0. This happens because of the lack of data—some countries appear only as a source node. The in-degree lines out the tourism connectivity of a country in a sense that tourists arriving from other countries create tourism connections, where the number of source countries is equal to the target country’s in-degree. Following that interpretation, because of tourism, Canada is connected to most of the countries in the network. As it attracts guests from most of the countries, it can be assumed that Canada’s touristic offer is diverse and appeals to tourists with different socioeconomic backgrounds and preferences.
The highest out-degree is for the United States, followed by Canada, the United Kingdom, France, and Germany (Figure 3). The lowest out-degrees belong to Sint Eustatius, Johnston Islands, and Midway Islands. The out-degree indicates to how many countries tourists travel, where the observed country is the source country. Like the in-degree, the out-degree points out to the connections to other countries realized by the tourist. However, it might also point out to preferences of the country residents, where a higher number of visited countries indicates a higher diversification of tourists’ preferences.
However, when applying weights, the situation changes. As weights represent the number of tourist arrivals, they can serve as an absolute measure of a country’s attractiveness. The highest weighted in-degree occurs for China, followed by the United States, Spain, Hong Kong, and Italy (Figure 4). This means that China attracted most tourists in 2018 and has the highest share in inbound tourism measured by the number of tourists.
According to [8], the top countries in the 2014 tourism network by the weighted in-degree were China, the United States, France, Spain, and Italy. The comparison of the two networks reveals a perturbation in the leading positions over the years, where Spain and Hong Kong improved their positions, Italy continues to hold its fifth rank, while France is not part of the top five countries in 2018.
The highest weighted out-degree (Figure 5) is for China, followed by the United States, Germany, Hong Kong, and the United Kingdom (UK). In 2014, China was ranked fourth by the weighted out-degree ([8], 2014 ranking: Hong Kong, Germany, the United States, China, and the UK). Since China has loosened travel restrictions, it has actively taken a share in the tourism industry, and partly due to the number of its residents, it has been rapidly ascending to the top position in the world tourism network.
The weighted degree forms the following top ordering: China, the United States, Hong Kong, Germany, and the UK. In comparison to previous research [8], from 2002 to 2014, there were a few changes in the core countries, except for the rise of Asian countries and their inclusion in the core.
In the tourism network context, the in- and out-degrees might also be related to the diplomatic relationships between the countries, as well as major touristic happenings, instabilities, and natural disasters. Some of the major happenings in 2018 that might have influenced tourist flows are hurricanes and wildfires in the United States, the World Football Championship in Russia, the Winter Olympics in South Korea, the Commonwealth games in Australia, the royal wedding in the UK, Eurovision in Portugal, the Champions League in Ukraine, the referendum in Ecuador (Ecuador accepts dual citizenship), Mediterranean games in Spain, wildfires in Greece, earthquakes and tsunamis in Indonesia, the tropical storm in China, the Ukrainian crisis, floods in Japan, legalization of cannabis for recreational use in Canada, the end of the conflict between Eritrea and Ethiopia, riots in France, etc. In addition, the lingering effects of some events in the previous year may be present: terrorist attacks and Brexit in the UK; the humanitarian crisis in Yemen, Somalia, South Sudan, and Nigeria; as well as hurricanes in the United States, some countries of South America, and the Caribbean (which might have damaged tourist capacities for the upcoming year). So, in comparison to previous findings [7,8], it can be noticed that a perturbation in the leading positions occurred and some of that can be ascribed to the major events. However, it seems that since 2014, China has been in the process of opening toward possibilities that the tourism market offers, which launched it to the top position. The country’s size is inevitably related to its position in the tourism network, due to the number of citizens, which creates an upper bound for the out-degree, but also due to available capacities and infrastructure, which shape the upper bound for the in-degree. An overview indicates that natural disasters, political unrest, terrorist attacks, and extreme poverty may also explain the low position of some nodes. While Canada has been close to the top in the report for 2014 [7], it has improved its position since then. The United States’ indicators are a bit worse in comparison to previous findings, but that can be explained with natural disasters and by the restricted policies on travel enforced by the Trump administration and his lack of global popularity. While some other differences exist, the findings are not completely comparable to the previous findings due to the differences in methodologies, so we will limit our comparison to the stated differences.
Additional results of the analysis of degree distributions are presented in Section 3.2.1 and refer to the adherence to the power law.
3.1.3. Centrality Measures
Different centrality measures shed a different light on a node’s importance in the network; nonetheless, their interpretation must be adapted to the properties of the examined network (meaning that the classical interpretation in some cases cannot be applied due to the nature of the observed phenomenon). Countries’ rankings by centrality measures are reported in Table A2.
Closeness centrality is the highest (>0.9) for the United States (0.97), followed by Canada, the United Kingdom, France, and Germany. The values are normalized to enable comparison. The lowest value of closeness centrality exists for the island countries and dependent territories. The closeness centrality calculation is based on the sum of the shortest paths between a node and all other nodes. The sum is the denominator, so a higher sum leads to a lower closeness centrality measure, indicating the node’s worse position in the network. This is true for the island countries and dependent territories, as they reveal a few direct connections. However, this may also occur due to reporting issues (namely its thoroughness—if the countries do not report arrivals from all countries but only from most prominent emitting markets, such measures may occur). Closeness centrality indicates that the United States is both well connected and has well-connected neighbors. The countries with normalized closeness centrality values close to 1 tend to have many first-degree connections, which establishes their central position in the network. According to the harmonic closeness centrality, which accounts for data asymmetry, there are 11 countries with values above 0.9 (besides those already mentioned, there are Italy, Switzerland, the Netherlands, Australia, and Belgium). Stated countries are best connected (directly and indirectly), but from the tourism network perspective/ that does not necessarily mean that they are the most important in the network or that the shortest paths are actually going to be used. Rather, their connectedness makes them interesting from the information dissemination and cultural exchange perspectives.
Eigenvector centrality shifts the focus from a country’s own connections to its neighbors’ connections, meaning that some connections are more valuable than others. Eigenvector centrality shows the following ranks: Canada (1), Belgium, Ecuador, the UAE, and Finland (0.995). Given the rank, it seems that Canada is most connected to other high-degree nodes. For comparison, in 2014, countries ranked by eigenvector centrality were China (0.694), Hong Kong, Macao, Korea, and Taiwan; and most of these countries prevailed on top ranks by eigenvector centrality since 2002 [8]. While some differences may arise from the used data, the other part is probably a result of global tourism trends. The calculated values for 2018 are significantly higher, and 43 countries have an eigenvector centrality over 0.9. This can be interpreted in combination with changes in the network density [7] as a general increase in connectivity in the tourism network.
The authority and hub measures are calculated by the HITS algorithm [59], primarily devised for web page analysis. The analysis distinguishes hubs that compile links to authoritative sources and authoritative sources of information. In a way, hubs are a stop on the way to an authoritative source, while an authoritative source is observed as the destination. This property would better explain tourist movements over different target countries within a single trip. Nevertheless, in the context of this network, hubs can be perceived as best-connected countries to other important countries in the network. In a way, they serve as bridges, not in general terms—only to the authoritative nodes. Accordingly, authoritative nodes are most important countries that receive guests from hubs. This means that guests from hubs support the top tourism status of the authoritative countries, while hubs thrive due to tourists from other countries (with smaller authority and hub measures). The authority favors Canada (0.1273) with the highest coefficient, followed by the UAE, Belgium, Ecuador, and the United States (0.1258). The largest hubs are Germany (0.098), France, the United States, the UK, and Italy (0.097).
Prestige centrality is a more refined measure and focuses on the direction of the ties. The prestige rank (normalized) suggests the following order: Canada, the UAE, Belgium, Ecuador, and Finland. While this cannot be explained in terms of choosing connections, it can indicate a country’s popularity in 2018. For Canada, the prestige is relatable to its high in-degree, but it also has to do somewhat with a lower out-degree (as if tourists from almost every country want to go to Canada, but its residents are more restrictive when choosing their own tourist destinations, e.g., they do not reciprocate as much). The prestige rank calculation with weights sets the following country ranks: Belgium, Canada, Ecuador, the UAE, and Finland as top countries. The case of Belgium is interesting as it has a high in-degree of 229 and a much lower out-degree of 156, but its weighted out-degree is more than double its weighted in-degree. Belgium is chosen either by the countries high in rank or by many countries with a moderate rank. Since the countries are both the source and the target at the same time, some of them might have been chosen by Belgium, thus increasing their rank and Belgium’s rank as well. In a way, that really adds motivation to be chosen by Belgian tourists.
The page rank is claimed to be a better measure of popularity and it favors Uganda, Canada, Belgium, the UAE, and New Zealand. If one starts a walk over the tourism network, it is most likely that one will end up in Uganda (and according to its report, it is specifically true for many countries with only a few direct connections). The page rank calculated with weights sets the following ordering: the United States, China, Turkey, Italy, and Spain as the top destinations of 2018. The page rank calculated with weights is more informative, as it indicates probable tourist flows and the most likely destinations. In comparison to previous research [7], the top five of the top one outbound group in 2014 were the United States, Mexico, South Africa, Thailand, and Botswana, and for the inbound group, the United States, Canada, China, Hong Kong, and Germany.
Examination of normalized betweenness centrality shows that the United States has the highest coefficient (0.06), followed by Canada, Belgium, Australia, and New Zealand (0.02). Betweenness centrality points out to the relevance of countries that were not exactly expected to appear so high in ranks. However, in terms of the tourism network, this means that on these locations, tourists mix from different, otherwise unconnected countries. While this may resemble the mixing in the hubs, an important difference occurs: tourists from countries lower in the ranks arrive at hubs, and the residents of those hubs depart to authoritative countries, while betweenness highlights the countries where tourists mix with other tourists (e.g., tourists from countries that are not directly connected). While this may be more obvious for Belgium due to its political importance as a location of the headquarters of many international organizations, this measure highlights its melting-pot property. The explanation is not so obvious for Uganda (ranked 10th), but according to its detailed report, it hosts tourists from many small countries (among them, island countries and dependent territories) where they may interact with tourists from otherwise unrelated countries, enforcing Uganda’s position as a bridging country. According to previous research [8], the rank by betweenness values in 2014 was the United States, Canada, Belgium, Australia, China, and New Zealand, which shows that the ranking has not changed much.
While some countries occur at the top by more than one measure (for example, China, the United States, and Canada), it can be noted that no country claims complete dominance in the tourism network, as changes in the ordering occur due to different criteria. It is also interesting to note that for most measures, among the top five positions occur countries from different continents. On the one hand, it confirms the tourism status as a global phenomenon, and on the other hand, it indicates that each continent has at least one strong player in the global tourism market.
3.1.4. Clustering, Communities, and Patterns
The analysis reveals 48 strongly connected components, where 1—a giant component—is comprised of 195 nodes and the remaining 47 of 1 node each. Those 47 components contain basically isolated nodes with a few connections. Further analysis reveals that there are 187 nodes in the network center and 55 in the periphery. Nodes in the network center mostly coincide with the giant component (Table A3). A weakly connected component is also identified as a subgraph with a diameter of 3 and a radius of 2. Additional graph partitioning by the criteria of node interconnections reveals four communities with very small modularity, indicating that communities do not exhibit any specific property. However, the situation changes for the weighted graph, where a modularity of 0.52 indicates that six revealed communities capture a fraction of links in each community, which would not be expected in a random network (Table 2).
Moreover, an insight into results (Table 2, Figure 6) reveals the underlying geographical proximity as a rule for communities’ partitioning (with a few exceptions, of course). Since no such rule was enforced, it is safe to assume that the observation arises from the tourists’ propensity to travel over shorter distances and, as such, create more links with more weight to neighboring countries. Thus, we find these propositions, such as homophily in terms of outsider avoidance behavior [15], hard to prove, as tourists already interact more with the neighboring countries, which may be simply due to convenience and cost-effective choices. A further discussion on homophily as a property of social and economic networks takes place in Section 3.2.6.
Similar results were obtained by previous research [8]. They applied hierarchical clustering for relational data, which revealed eight groups of countries. They concluded that clustered structures reveal geographical and cultural proximities. When considering cultural proximities, they emphasized the common language used. Such conclusion is in line with their findings, but we observe a fewer number of communities, which breaks the language barrier. For example, Seok et al. [8] find separate clusters for countries that can roughly be divided into North and South Americas, while in this analysis, those countries form a single community. In addition, it seems that European countries have developed higher cohesion since 2014 and in 2018 appear in one community. The fewer numbers of revealed communities may be a result of globalization trends, cultural cohesion, and the increase in tourism.
The communities (Table 2) overlap with the nodes in the periphery and the center (Table A3), indicating the existence of patterns between the center and the periphery. The center is composed of 187 countries with an eccentricity of 2, meaning that those countries are interconnected with the longest shortest paths of a length of 2. Countries that are closer to the center of the network also have higher centrality measures, which indicates that they attract a lot of tourists from other countries, and some of those countries have a peripheral position in the network. Some of the countries in the periphery do not have as small degrees as expected (e.g., Puerto Rico with an in-degree of 103 and an out-degree of 41 or Lichtenstein with an in-degree of 46 and an out-degree od 64), but their connections are created in a way that leads to bigger geodesic lengths to the other nodes in the network. There are also some isolated nodes in the periphery, but their position reflects the lack of data more than the real lack of connections as this refers to countries that appear only as the source nodes.
3.2. Does the Tourism Network Behave as a Social or Technological Network?
Further results and discussions will refer to the regularities in characteristics of social and economic networks [10].
3.2.1. Small-World and Scale-Free Network Properties
The observed tourism network follows the properties of small worlds, as it demonstrates a small diameter and a small average path length.
Both studies [6,7] found tourism networks to be small worlds, i.e., to have a relatively small diameter and a small average path length. Both studies [6,7] revealed a certain amount of reciprocity. Our research results are in line with their findings.
However, the degree distributions do not exhibit classic fat tails and are not scale-free distributions.
At first glance (Figure 7a–c), it may seem that there is a possibility for a power-law adherence. However, for weighted degrees (Figure 7d–f), it can be observed that there are many nodes with a lower number of links, but the right tail suggests the existence of more hubs than expected in a scale-free network. Additional analysis to check whether the distributions follow the power law reveals very weak adherence to the power law (estimations were conducted with and without the constant and better-fitting models are stated here). For the in-degree distribution, the estimated power function is , and the model is statistically significant , so is the constant and α ). The out-degree power model is with and it is statistically significant ). The degree distribution shows even weaker adherence to the power law , but it is statistically significant ( and ). While a much stretched conclusion may be that the network does follow the power law, it can be seen that these models explain a very small amount of variations in the degree frequencies, while the majority of the variances (75.4% in the first, 54.6% in the second, and 76.7% in the third model) remain unexplained. In addition, the α values are unusually small, given the commonly reported values in the literature (such values of α should not be seen in large finite networks, as the number of links connected to the hubs grows faster than the size of the network and will eventually be connected to every node [63]). However, these results are not entirely unexpected. The prerequisite for a scale-free network is the possibility of link creation to an arbitrary number of other nodes. This might not be satisfied for the world tourism network, as tourism also depends on the diplomatic relationships between countries [7], for example, a visa requirement that might discourage some tourists. Despite the ever-present endeavors of a search for scale-free networks because of their properties and regularities in their growth, they are rare in the real world [64]. With additional analysis, we find that the out-degree, degree, weighted out-degree, and weighted degree distributions best fit the Weibull distribution, while the in-degree and weighted in-degree best fit the log-normal distribution. This shows that this network is not scale free. In addition, it sheds a new light on the behavior of arrivals and departures from the observed countries, as it indicates that they are governed by different underlying regularities.
There are three comparable studies that deal with tourism on the global scale [6,7,8], so we consider these as initial observations. Given their findings, the tourism network seems to be governed by most of the typical social and economic network characteristics. Miguéns and Mendes [6] find that degree distributions seem to be scale free and follow the power law, while Lozano and Gutiérrez [7] obtain different results (the topological network does not display scale-free behavior, but the in- and out-degree strength distribution analyzed separately can be fitted to the power law). Some of the differences in observations might arise from the differences in the methodological approach (while Miguéns and Mendes [6] use data of tourist arrivals in 208 countries and analyze it through one network, Lozano and Gutiérrez [7] separate inbound and outbound tourism into two networks and use only top k flows for each network).
For comparison, the migration network, World Wide Web, and optimal traffic networks are scale free [37,39,40]. Our findings show that degree distributions best fit the log-normal and Weibull distributions, while it can be stated that degree distributions follow the power law but very loosely and with a poor model fit.
3.2.2. Pareto (20/80) Rule
For the sake of thoroughness, we will not ignore the Pareto (20/80) rule, which is usually related to scale-free networks (as it might be present in the observed one). Top 20% of the countries (roughly 48 countries) obtain 42.336% of all or the arcs (measured by degrees), receive tourists from 56.31% countries, and emit tourists to 37.56% of all countries. In the case of a weighted network, top 20% of the countries comprise 85.57% of the travels in 2018 (measured by weighted degrees) and, similarly, cover 85.58% and 83.04% of the tourism market as recipients and emitters of tourists, respectively. When reading this, one must keep in mind that separate sorting of the countries was made with regard to what was measured, so the list of top 20% of the countries is not the same for each share.
Lozano and Gutiérrez [7] reveal a high degree of centralization of outbound tourism, and they identified the United States, Canada, France, Spain, and Malaysia as the core—a few countries that maintain a central position in the world tourism network. While our results also point out to countries with a higher level of centralization, we do not find evidence of a core of few countries that remain at the top when applying different centralization measures. Nevertheless, we find evidence of the 20/80 rule, where roughly 20% of the countries benefit from over an 80% share of the tourism market, and this is valid only for the weighted network.
3.2.3. Assortativity
Next, if communities are observed, which are highly interconnected, one can notice that each community has at least one high-degree node (Table 2). In addition, communities do not have the same degree sum, showing that in some areas, people travel more and elsewhere less. However, presuming that community interconnections are stronger than those with other high-degree nodes, it is safe to assume that the high-degree nodes in a community relate to lower-degree nodes within the community (rather than to other high-degree nodes outside the community). This leads us to the conclusion that the network does not show positive assortativity. However, this assumption has been additionally tested, and we received the following correlation coefficients for the in-degrees, out-degrees, degrees, weighted in-degrees, weighted out-degrees, and weighted degrees, respectively: (coefficients are statistically significant at the 5% level). The coefficients point to very weak correlations, but from the assortativity perspective, we are focused on the coefficient sign, which indicates the negative direction of correlation. This means that high-degree nodes make connections to low-degree nodes, and vice versa, proving to be disassortative. From the perspective of assortativity, it seems that the tourism network exhibits a behavior more typical of technological and biological networks.
Miguéns and Mendes [6] reveal disassortative mixing, which they interpret as the underlying economic influence and the flows of technology and knowledge (such correlation is also present in a trade network [3] and a financial network on the global scale [34]). Our findings confirm the disassortative behavior of the tourism network.
The ecological approach may be applied in the case of SNA analysis of tourists’ behavior, as suggested by [65]. For example, compartmentalized and disassortative networks “tend to confer a significant degree of stability against disturbance”—a very interesting property from the COVID-19 crisis perspective. To reach such a conclusion, besides the disassortative network property, it is necessary to examine the network’s diffusion properties and compartmentalization possibilities, which is done in Section 3.3.
3.2.4. The Patterns between the Core and the Periphery
Each community contains nodes both from the center and the periphery (Table 2 and Table A3), indicating that patterns exist between the core and the periphery. The network is disassortative, which highlights this interaction. For the most part, the center coincides with the largest strongly connected component (gigantic component), so it can be concluded that the tourism network displays this property of social networks.
3.2.5. High Clustering Coefficients
An additional property of this network, in line with social networks, is high clustering coefficients. High-degree nodes tend to have lower clustering coefficients (the lowest one is 0.46, or in the case of the triangle method, 0.3066), and the overall clustering is significantly different from the average clustering.
3.2.6. Homophily
If we again observe the communities (in the weighted graph; Table 2, Figure 6), the underlying geographical proximity may be an indication of homophily, in a manner. Namely, such behavior may not be related as much to the likeness but can be attributed to the lower costs of short-distance travels (which are also less time-consuming). For instance, not many people regularly travel to different continents on their tourist travels.
Previous research also revealed an expressed homophily between the countries in the same continent, meaning that the tourism flow is larger within the region than between regions. The authors explain that these results may occur due to physical proximity and lower travel expenses but also due to the similarity in the culture and diplomatic relationship between the countries [7]. Besides geographical proximity, Seok et al. [8] emphasize the common culture and language within the clusters. In comparison to Seok et al. [8], this research reveals a fewer number of communities. For example, most of the European countries form a single community and moreover include Russia and some African countries. The African countries that belong to this community are also former colonies, indicating the possibility of the lingering effects of those relationships. Moreover, this community overcomes language barriers and cultural differences. Similarly, both North and South American countries are strongly interconnected within one community, which also favors geographical proximity over cultural differences as an explanation. Still, the sixth community (Table 2) contains countries that are spread over three continents, so in this case, cultural similarities may be a better explanation. This may mean that globalization trends, cultural cohesion, and the increase in tourism do not enforce changes in the tourism network evenly. So, we suggest that two variations of homophily occur in the network: the first one is guided by the opportunity (geographical proximity, low cost, less time consumption), and the second one is guided by similarities (socioeconomic factors, common culture, language). The revealed variations of homophily are in line with [15], who suggest an ecological approach to tourism due to the expected change in tourist behavior, with the exception that tourists were governed by proximity in their destination choices long before the current pandemic situation.
3.2.7. Weak Ties
Weak ties denote relationships to nodes with an eccentricity of 3 (or connected by links with low weights), but from the perspective of a single node in this network, they may be observed as an indirect connection to other countries. This network examines links created by physical guest arrivals in target countries, so the exploration of usual role of weak ties (as in recommendations for something) is limited. When considering dissemination possibilities, in weakly tied countries, a tourist may be exposed to new information or other country’s promotion that would lead to traveling to another, possibly neighboring country based on the received information. However, this is just storytelling the data, and such possibility should be further investigated. Nevertheless, if future research would reveal such regularity, it would open a new aspect of advertising possibilities (advertising one’s own country in other countries during the peak season and count on the weak ties to long-distance travelers).
3.2.8. Structural Holes
Conducted analysis has not revealed structural holes between communities. While some communities are more connected to others, they are all connected sufficiently enough to discourage structural holes’ creation. There are nodes with fewer connections that are interpreted as isolated, but such interpretation is limited by the lack of data. Despite the lack of data, the nodes that appear only as a source also find their position in the communities. As none of the isolated nodes reveals important bridging properties, no structural holes can be identified.
The presented analysis of topological properties of the network shows the recent network condition, and a comparison with previous research sheds light on the tourism dynamics on the global scale.
It can be concluded that the tourism network shows mixed properties. In some parts, it behaves as a social network, while in other parts, it exhibits characteristics usually expected in technological or biological networks. This is encouraging due to the properties of such networks: stability against disturbance and the possibility of self-recovery.
3.3. Network Diffusion Properties
Network diffusion properties are of special interest due to the COVID-19 pandemic. However, some of the previously stated data and measures may also shed light on the situation, as we presume that noticed trends continue and we use the calculated parameters as orientation. First, as the outbreak started in China, it is important to note that China had the highest weighted out-degree (which showed a rise in China’s importance in the tourism network since 2014 and can be an indication of a trend), with tourists visiting 152 distinct countries. Second, betweenness centrality shows critical places where otherwise unconnected tourists may interact or occupy the same location: the United States, Canada, Belgium, Australia, New Zealand, Japan, China, Italy, Finland, and Uganda. However, most of those countries do not have a peak season in that period. The first cases outside China were reported in the Republic of Korea, Japan, Thailand, Singapore, the United States, and Italy. While some of those countries share the same community with China, there are other ways and paths to travel (for example, many Chinese residents own shops or work in northern Italy). So, if betweenness centrality did not change by the end of 2019, most of the countries that are expected to behave as bridges, in this case, did not play a role (except for the United States, Japan, and Italy) in the initial days of the outbreak, probably because the outbreak occurred in an out-of-season period.
Generally, assessment of the diffusion property is how one node’s actions may have consequences for other nodes in a network. One of the prerequisites for diffusion is the existence of interconnected components, while the tourism network contains a giant component. In a contagion situation, usually applied models refer to susceptible-infected-recovered or susceptible-infected-susceptible models or their combination. In such models, it is assumed that some of the nodes have immunity (π). The basic presumption of these models is that if p (1 − π) n is smaller than 1, the disease will die out, and if it is larger than 1, the disease will spread. So, a threshold for a giant component of infected nodes is p (1 − π) n = 1, where p stands for the probability of the link creation, n is the number of nodes, and (1 − π) is a share of susceptible nodes. Based on the presented network, we may assume that the probability of the node connection is p = 0.29, and we will be free to assume that periphery nodes have immunity, which leads to π = 0.227 (given that the countries cannot get vaccinated (only their citizens can); from the perspective of this network, the absence of connections is the only immunity that we can account for). As it can be intuitively deduced from the equations, in the case of a large p, a fraction of susceptible population (q) can be quite high. The proportion of q can be approximated by solving . The approximated share for stated measures is q = 1, leading to the possible infection of all the nodes in the interconnected part of the network. So basically, the change in that share can be achieved either by increasing the immunity (by any measure) or by reducing the probability of the connection. It was estimated that the international travel bans affected over 90% of the world population [42]. This reduced p to 0.1, which gives us , and if further reduction takes p to 0.01, then the approximate share of susceptible countries is q ~ 0.75. However, a glance at the initial expression shows that p (1 − π) n should be reduced to less than 1 for a disease to die out, and this can be achieved by reducing the probability of creating a connection to p~0.0053. However, one must keep in mind that not only touristic but business and other travels and visits also create connections between countries. This explains the necessity of lockdowns [42] and temporary improvements within the countries during the lockdowns.
For complex systems, such as tourism, some parallels regarding the systems’ robustness may be drawn from ecological systems. A short-term influence of the pandemic is undeniably present [42], which shifts the focus to the possibility of system recovery. Compartmentalized ecological complex systems show less sensitivity and long-term stability toward disturbances, such as a pandemic or fire—while the parallel may also be drawn with economic crises [1,2]. According to May et al. [65], “If there is strong interconnection among all elements, a perturbation will encounter nothing to stop it from spreading,” and a similar interpretation seems to be valid for recessions and crises when observing economic and social networks [2]. Such approach is somewhat in opposition to observed trends of globalization and cohesion in tourism but might prove useful in the current situation.
Due to the existence of a giant component, the tourism network is not compartmentalized. Nevertheless, the mentioned travel restrictions are one way to achieve compartmentalization of the network. To examine network compartmentalization possibilities, two approaches are attempted: arbitrary removal of the edges and removal of the nodes (Appendix A). For the first approach, 10%, 20%, and 25% of all possible links are randomly chosen and removed from the network. As long as the central countries retain most of their links, this approach does not lead to compartmentalization (Figure A1). Thus, the node or edge removal should be intentional and purposeful to achieve compartmentalization. The second approach involves removal of the top nodes ranked by betweenness centrality (countries that serve as bridges). Removed nodes are not part of the resulting network (temporarily, at least, as long as they have no links to other countries). The network of countries that remain after each iteration of removal of the top 10% nodes shows an increasing number of communities, a larger diameter, a longer geodesic, a smaller average degree, and a lower density (Figure A2). However, the nature of the formed relationships does not allow a conclusion about compartmentalization. The network of remaining nodes is somewhat compartmentalized after the removal of the top 50% nodes ranked by betweenness centrality. Such network has an average degree of 5.32, a diameter of 8, an average path length of 2.29, a density of 0.044, and it has 31 communities. After the removal of 60% of the nodes, the network is considered compartmentalized, with 97 nodes and 37 edges remaining. Such network has a density of 0.004, with many isolated nodes and nine components. With the achieved compartmentalization, the probability of creating a connection is also reduced below the threshold (p ≤ 0.0053). While this is only a simulation, it can be assumed that something similar happens during the travel ban, so this is an appropriate measure for compartmentalizing the tourism network with the aim of diminishing (or stopping) the COVID-19 spread over the countries. However, travel bans occur only temporarily, meaning that afterward, the nodes restore their links and recreate the giant component. While compartmentalization of the tourism network can be achieved by enforced measures, it is not a natural property of this network. This means that without exogenous measures, COVID-19 would freely spread over the giant component, causing a trade-off between tourism benefits and health measures.
From the tourism network perspective, one usually desirable property in the sense of information sharing, word of mouth, cultural transmission, or touristic promotion, might have played a role in its own temporary disintegration. While it is a sheer lottery to prognose how the world after-COVID-19 will look like (if there will be such a thing), it is safe to assume that in time, tourism patterns will restore and this representation of the world tourism network may be used for comparison with the new ones in the future.
4. Conclusions
Previous research of the tourism network at the global level is scarce. We build on [6,7,8] and continue in line with their efforts, aiming for a more extensive and thorough overview with more up-to-date data.
While the model and the following conclusions heavily depend on the data used, we see that the whole is indeed greater than the sum of its parts. The analysis reveals topological properties of the world tourism network, which leads to conclusion that no country claims complete dominance in the tourism network, as changes in the ordering occur due to different criteria. The tourism network shows mixed properties of a social network and technological or biological networks. This is encouraging as such networks tend to express stability against disturbance and the possibility for self-recovery. However, the network also shows expressed diffusion properties and requires exogenous measures to achieve compartmentalization.
The limitation of the research mainly arises from the used data, which calls for recommendation for a detailed and systematic approach to data collection in tourism. The second limitation refers to the snapshot approach, as it does not enable deeper insight into tourism dynamics.
While the results presented in this paper give insight into the world tourism web, they are only a glimpse in comparison to possibilities for further research. First, given the pandemic situation, this model may be used in future research as a baseline for comparison to a pre-COVID-19 tourism network. While this research used a static approach, further network development may incorporate dynamics into modeling. Besides that, the possibilities for exploration of regional networks remain, as does the exploration of the individual countries’ position in the network.
Supplementary Materials
The following are available online at https://0-www-mdpi-com.brum.beds.ac.uk/2076-3417/11/5/2253/s1: Supplementary File S1: Calculated parameters for each node in the world tourism network (not weighted); Supplementary File S2: Calculated parameters for each node in the world tourism network (weighted).
Author Contributions
Conceptualization, K.K. and M.T.; methodology, K.K. and M.T.; formal analysis, K.K.; data curation, M.T.; writing—original draft preparation, K.K.; visualization, M.T. All authors have read and agreed to the published version of the manuscript.
Funding
This research was partially funded by Social Network Analysis in Croatian Tourism, an internal project at the Faculty of Economics and Tourism “Dr. Mijo Mirković” Pula.
Institutional Review Board Statement
Not applicable.
Informed Consent Statement
Not applicable.
Data Availability Statement
Secondary data were used, and all sources are listed in Appendix A.
Conflicts of Interest
The authors declare no conflict of interest.
Appendix A

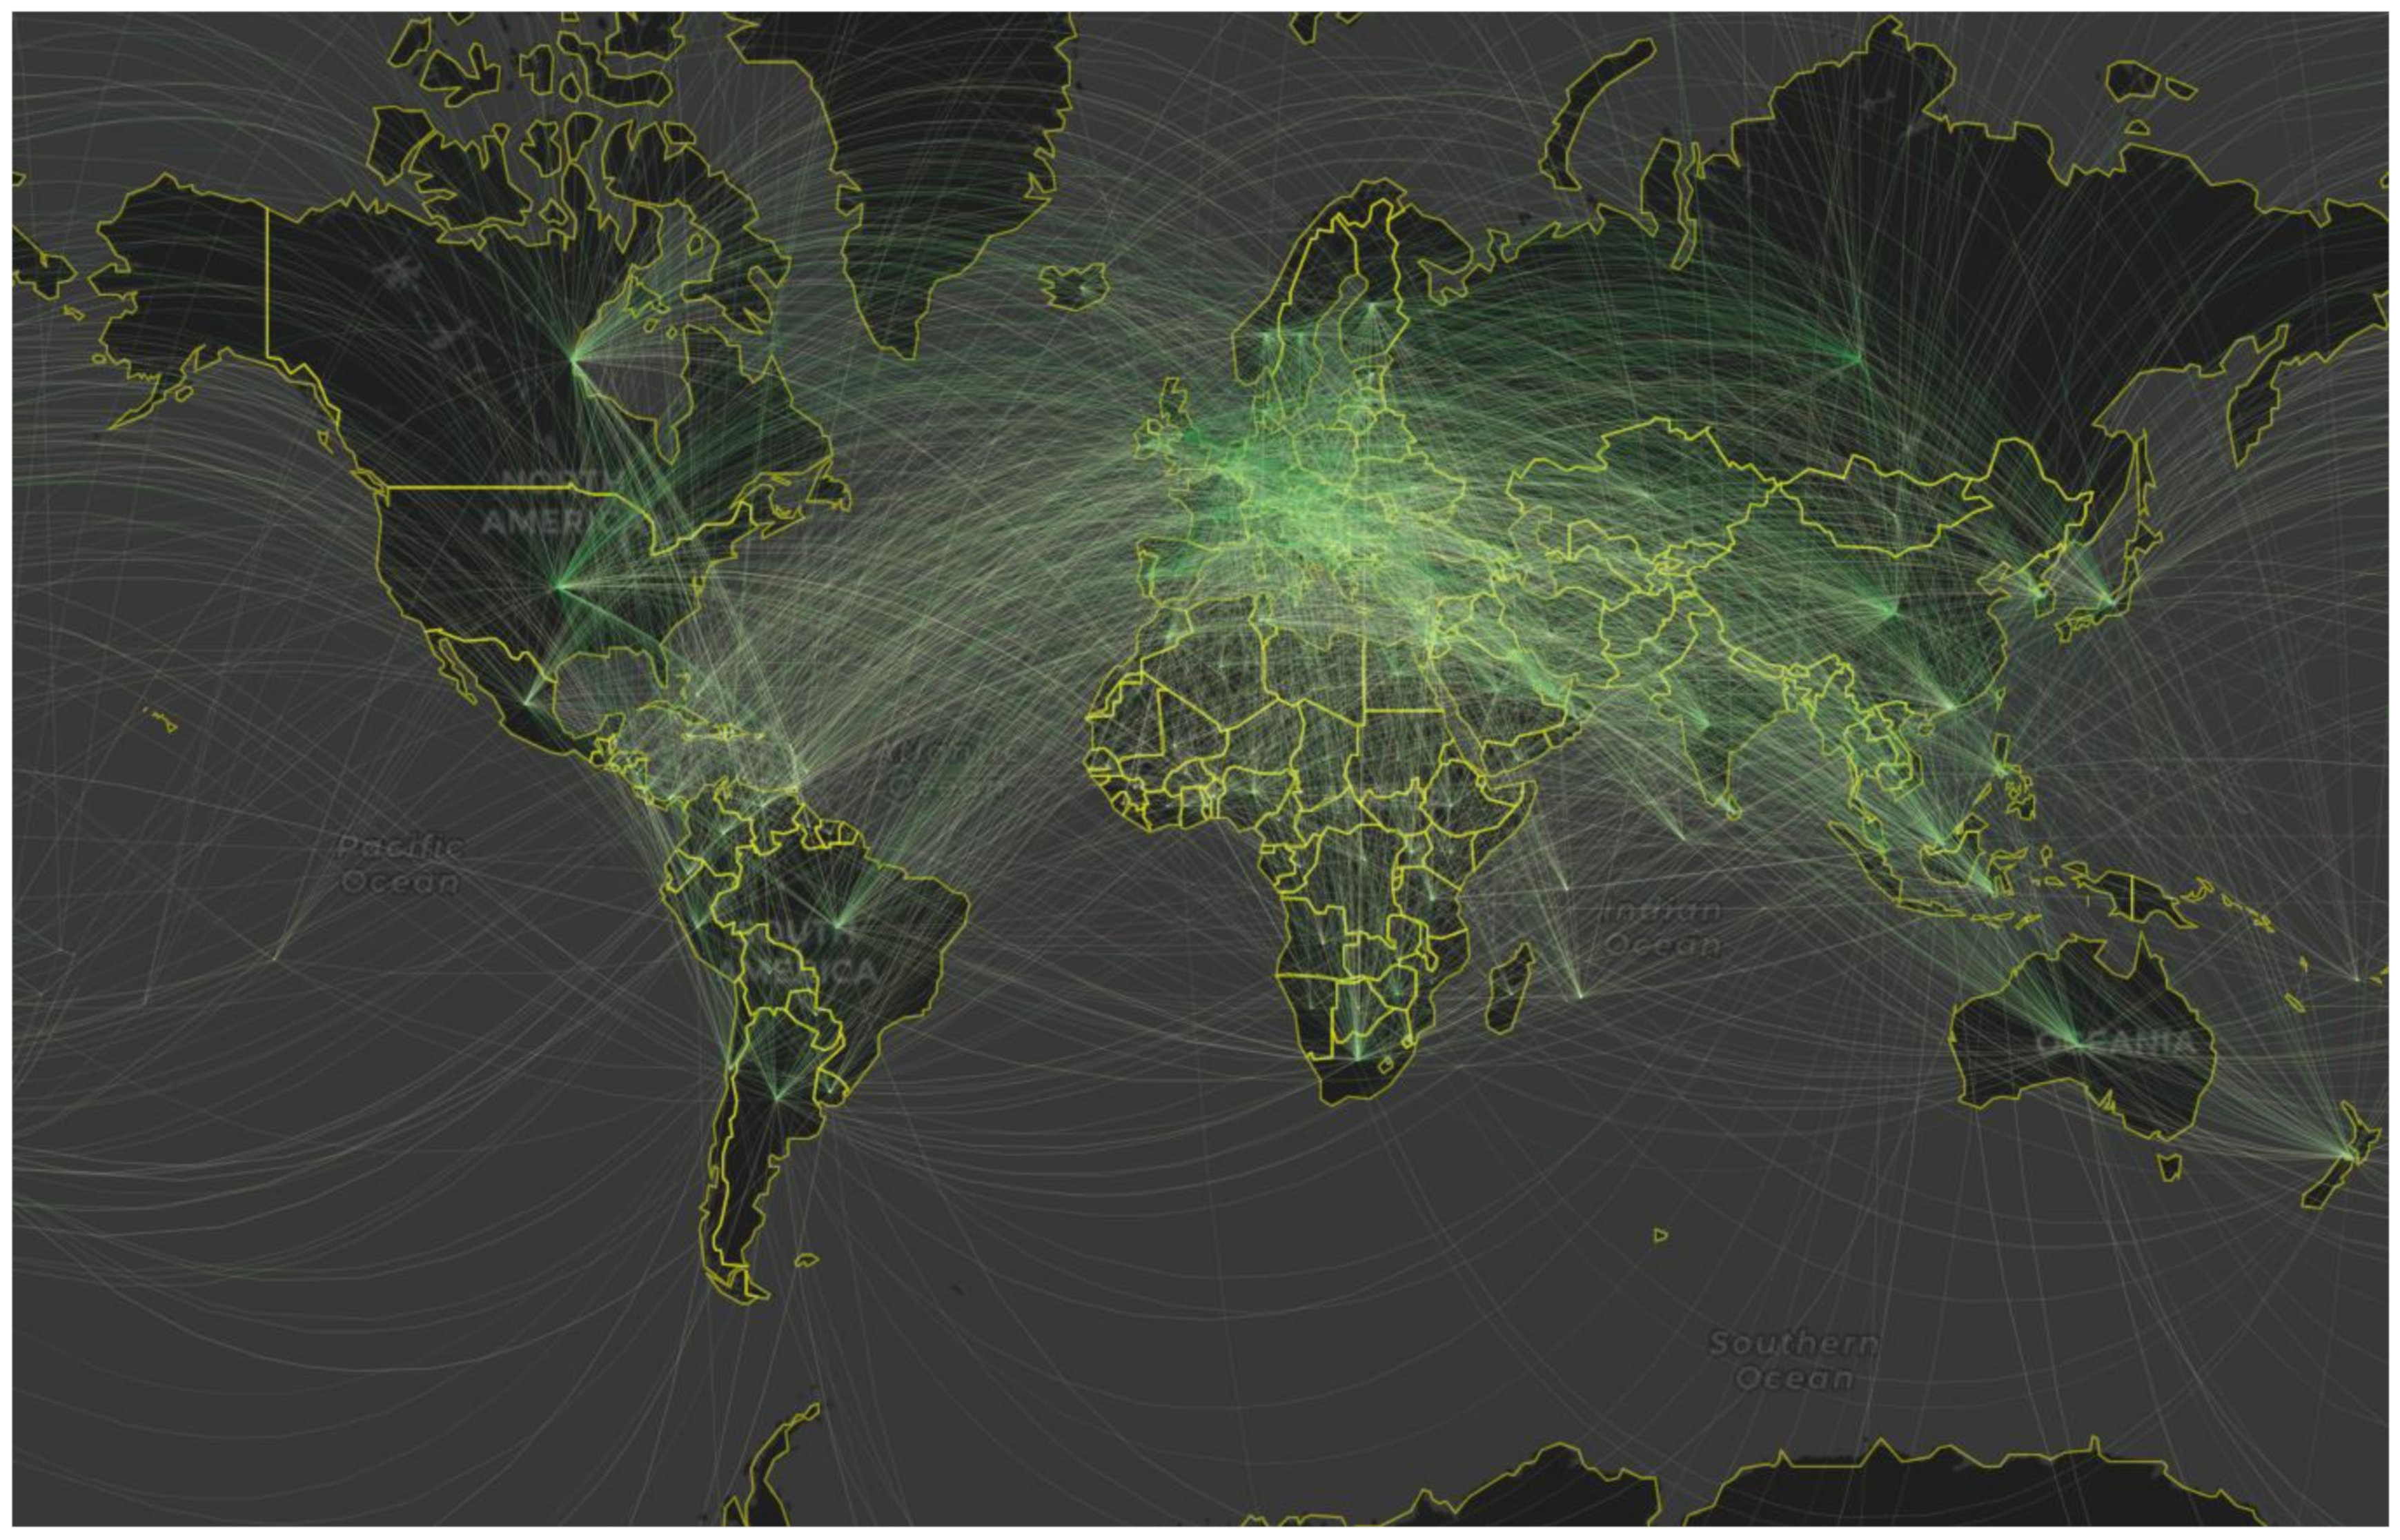
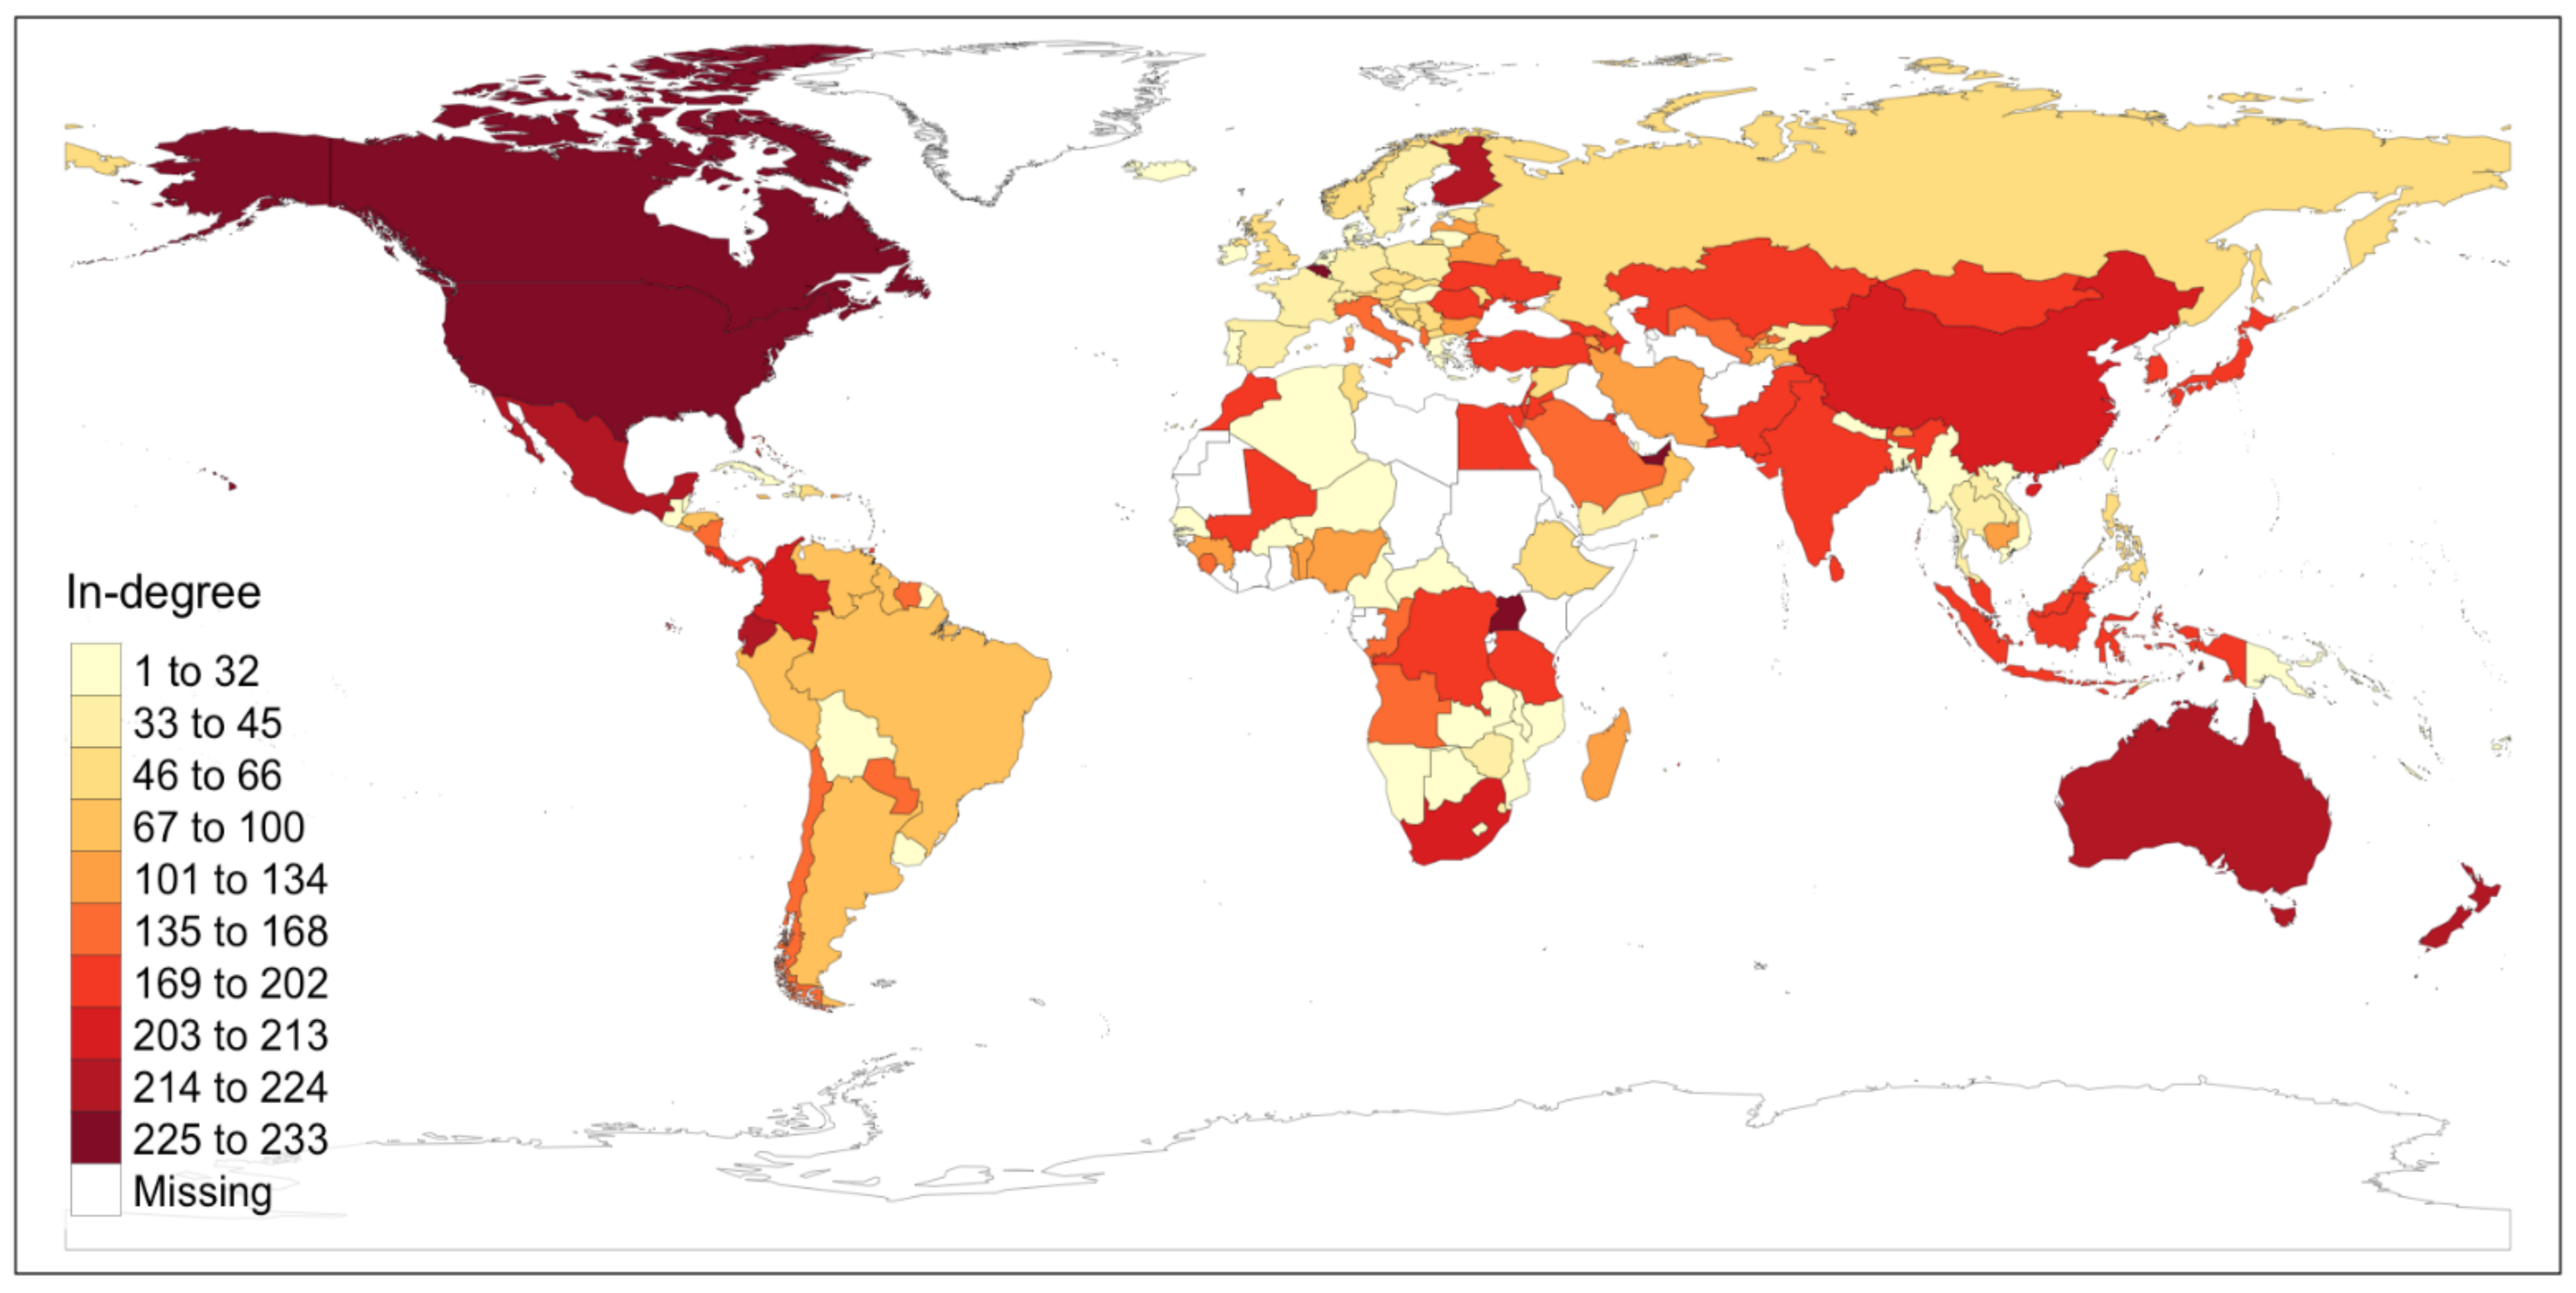
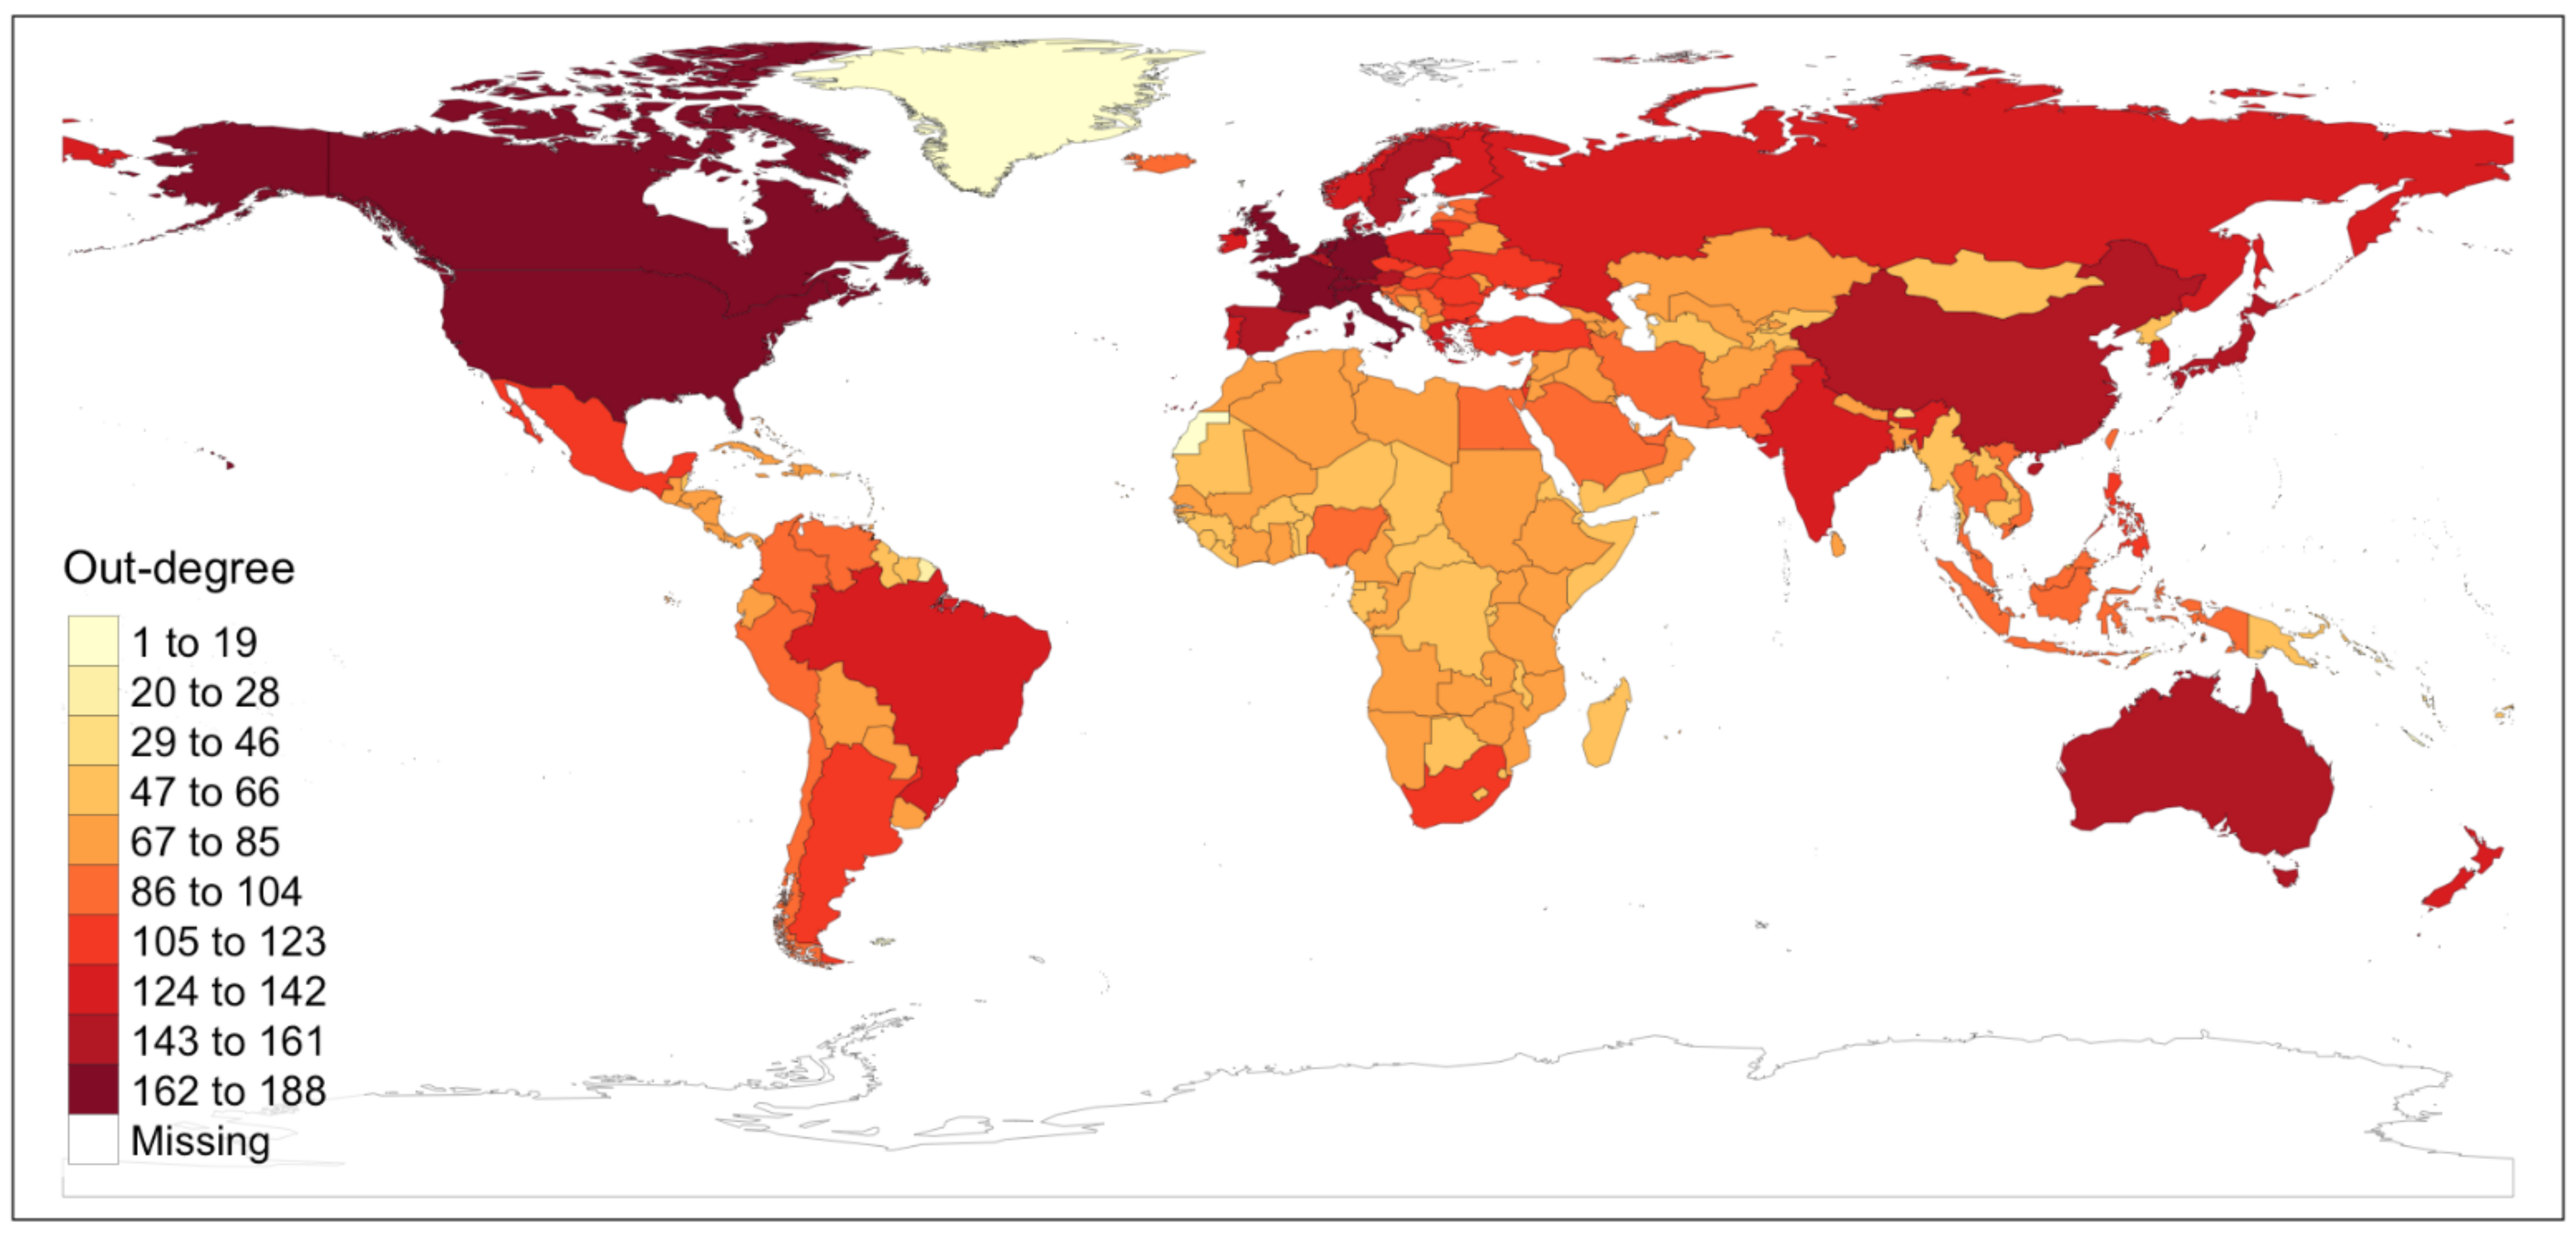
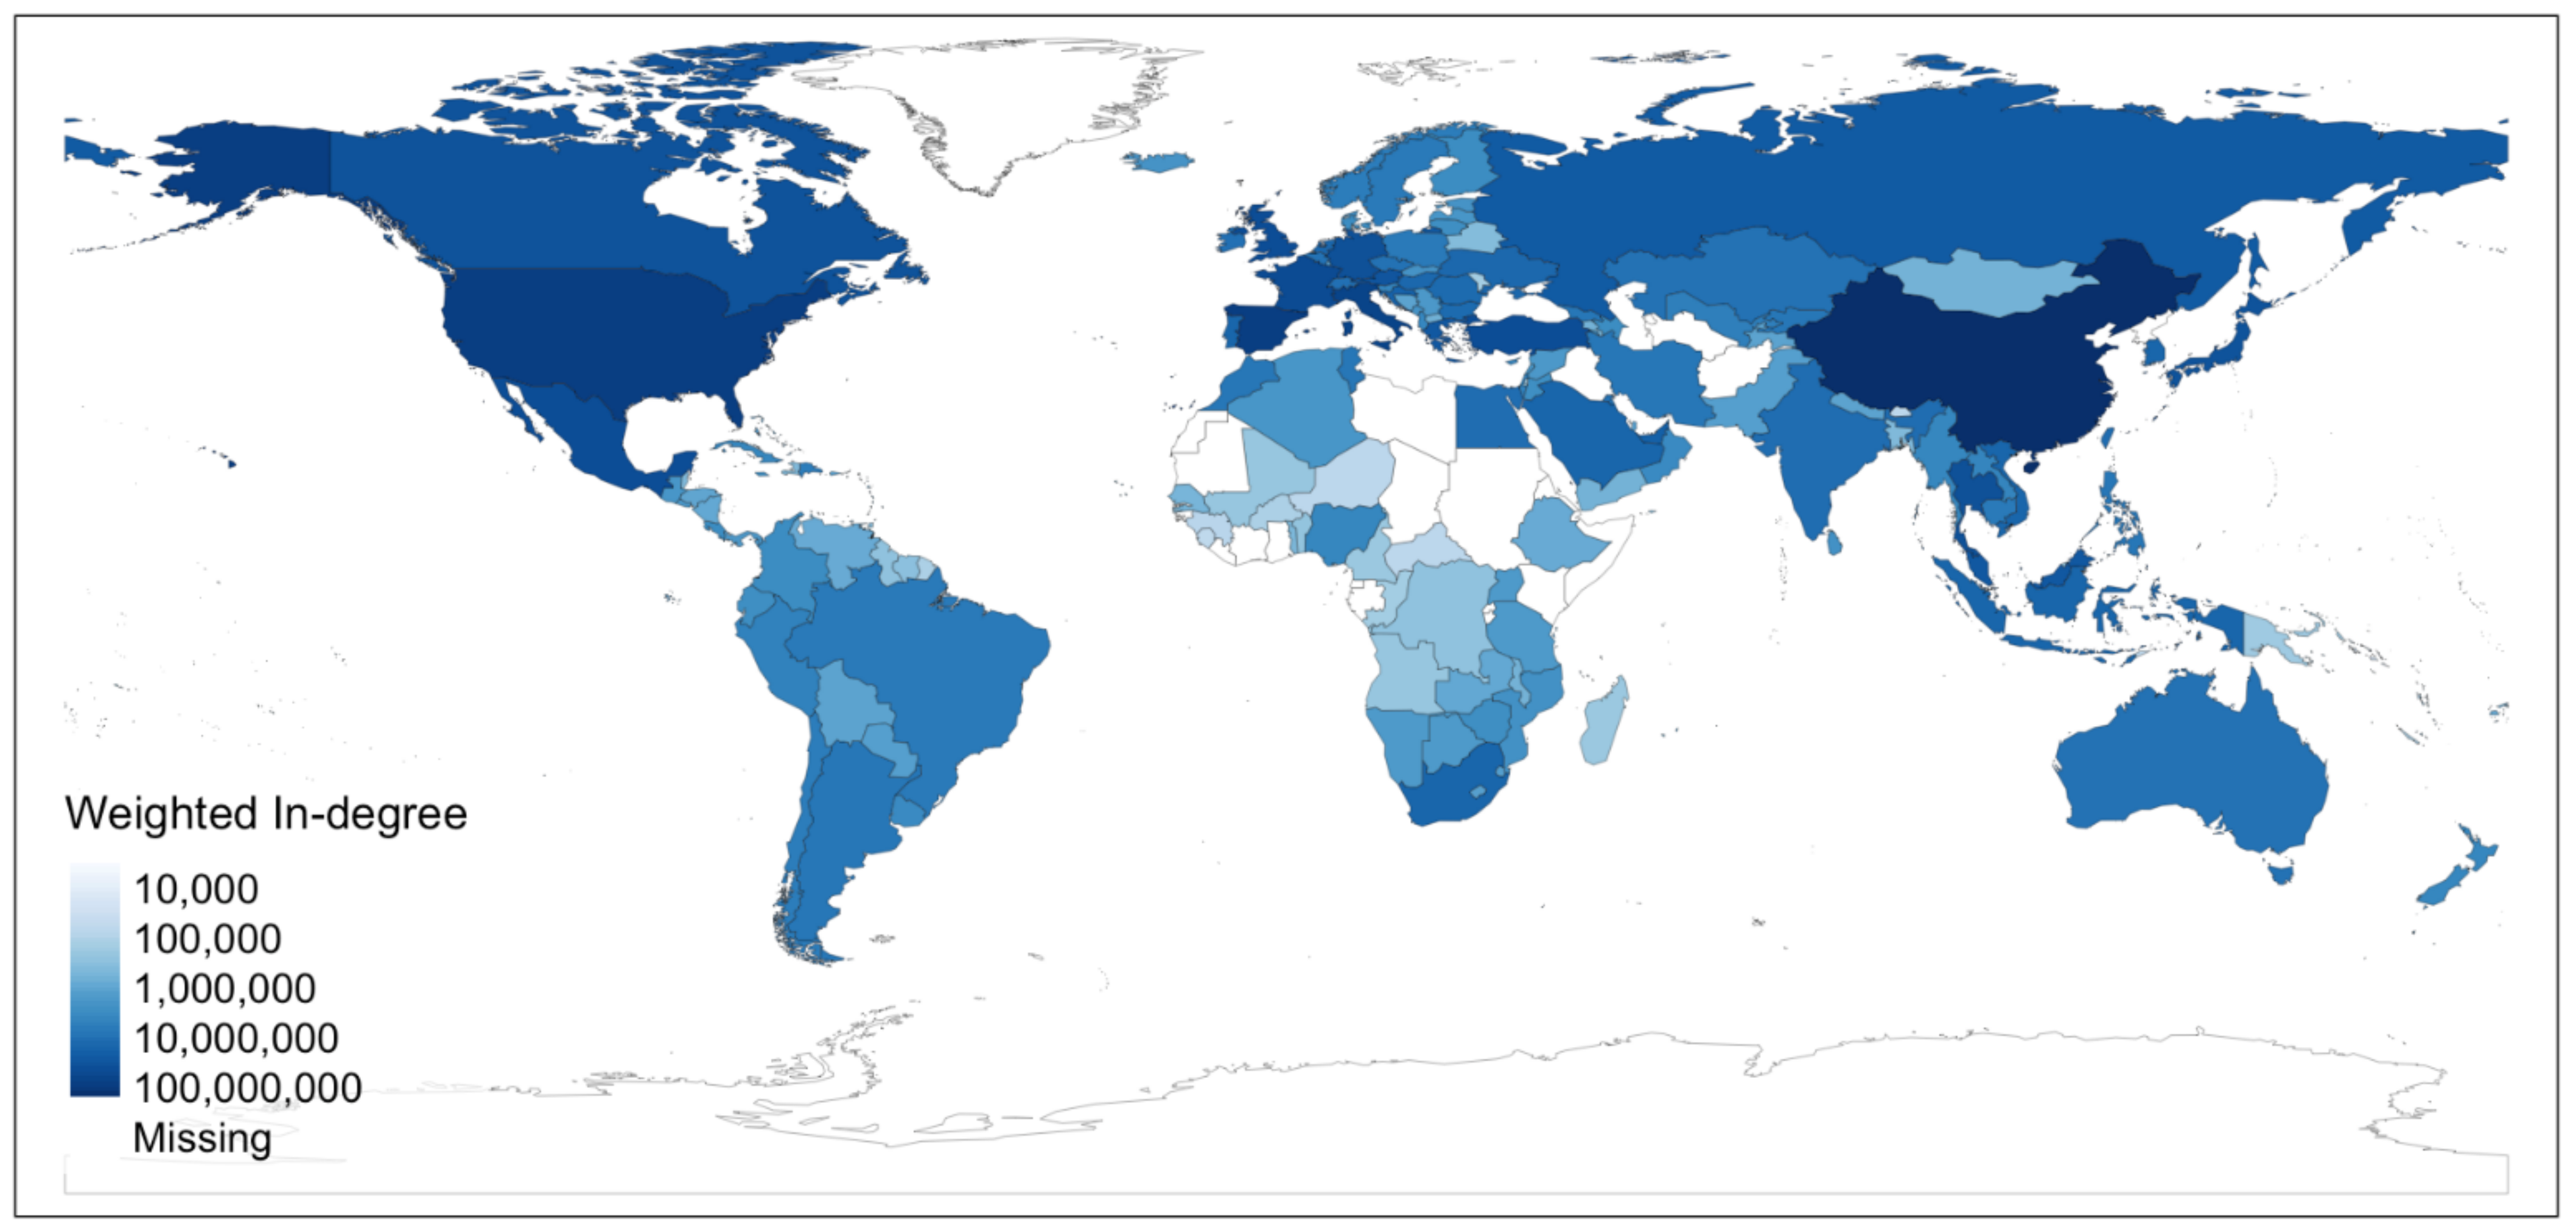
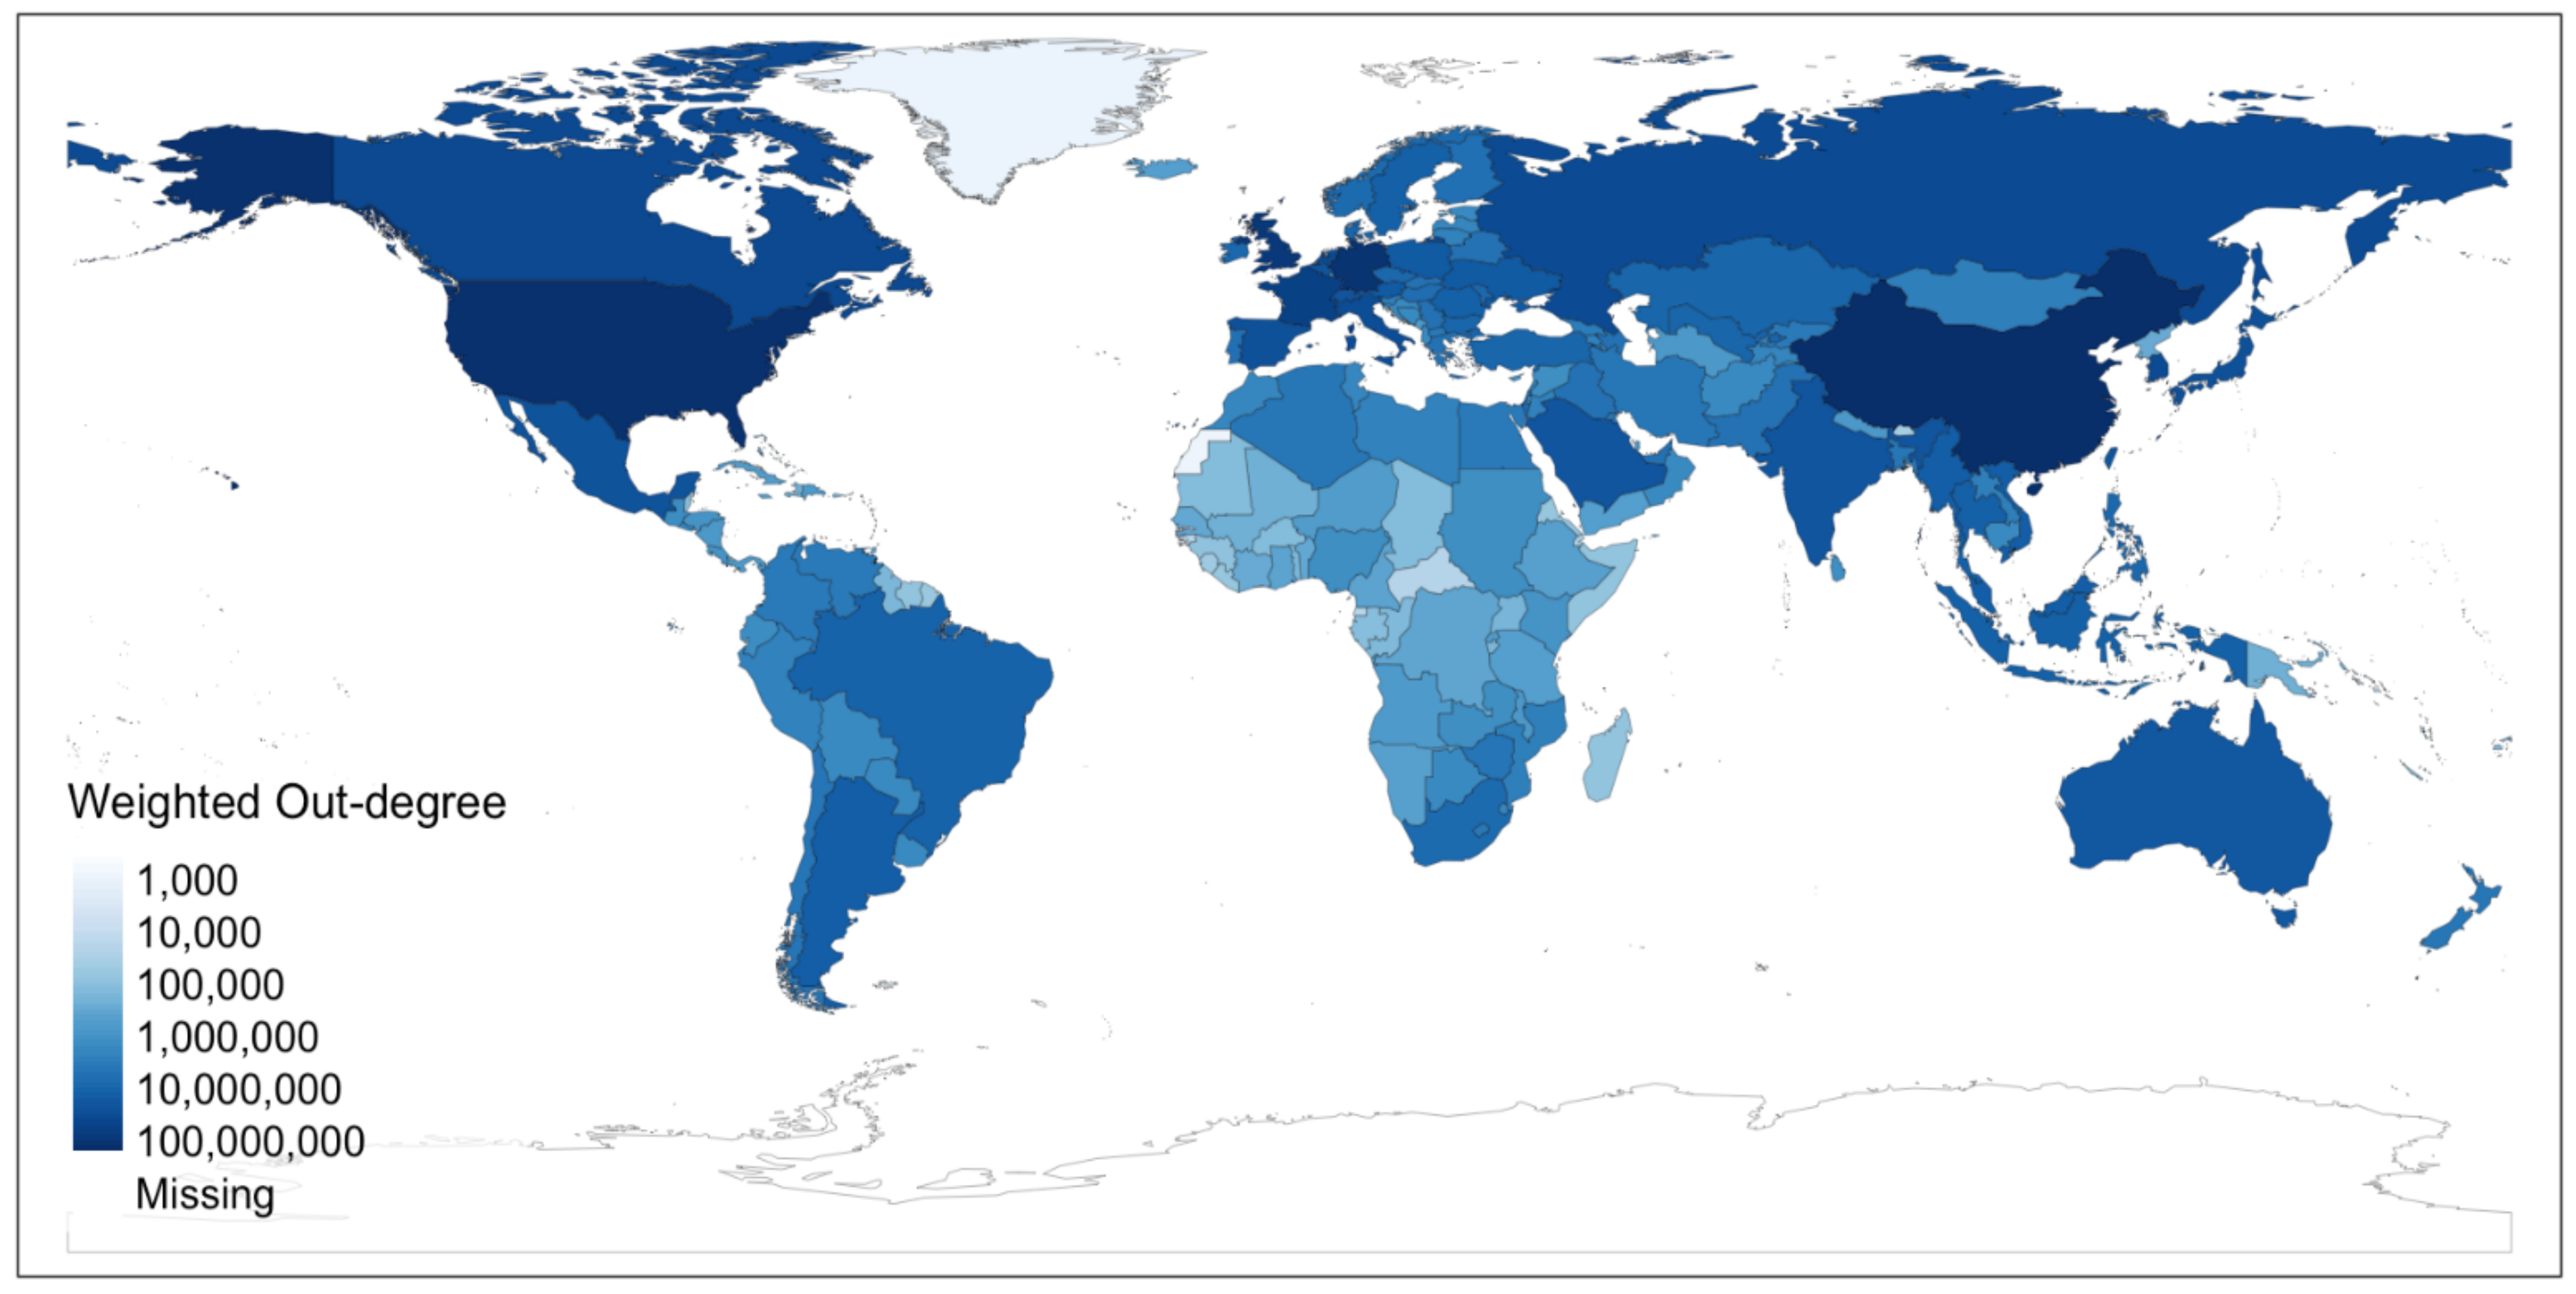
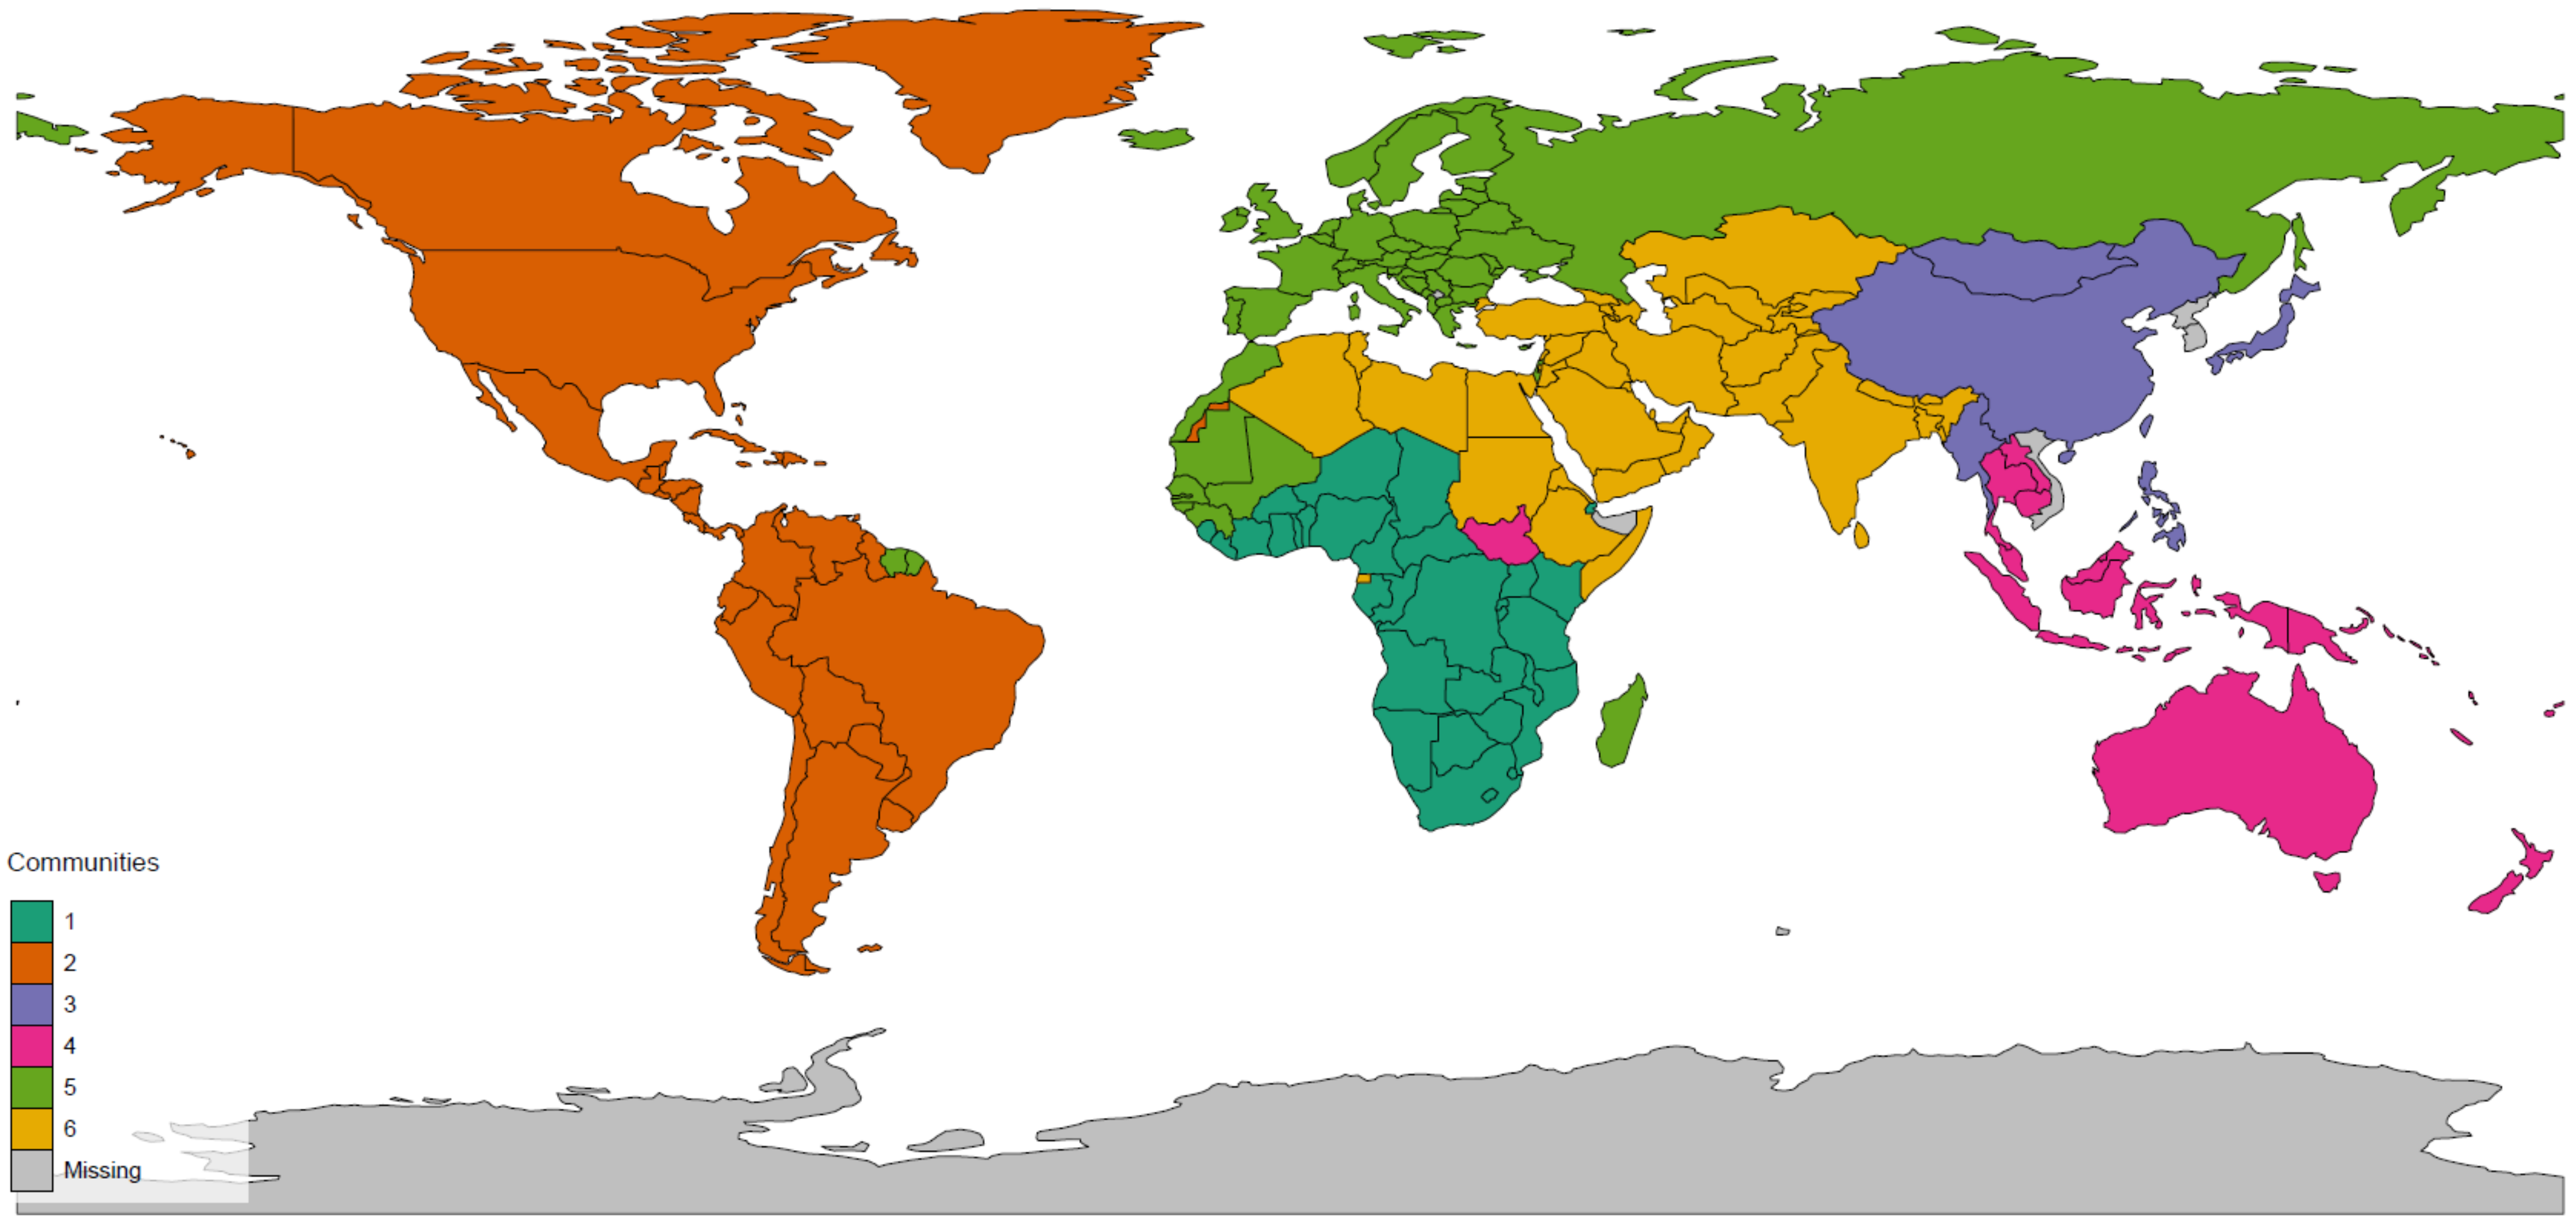
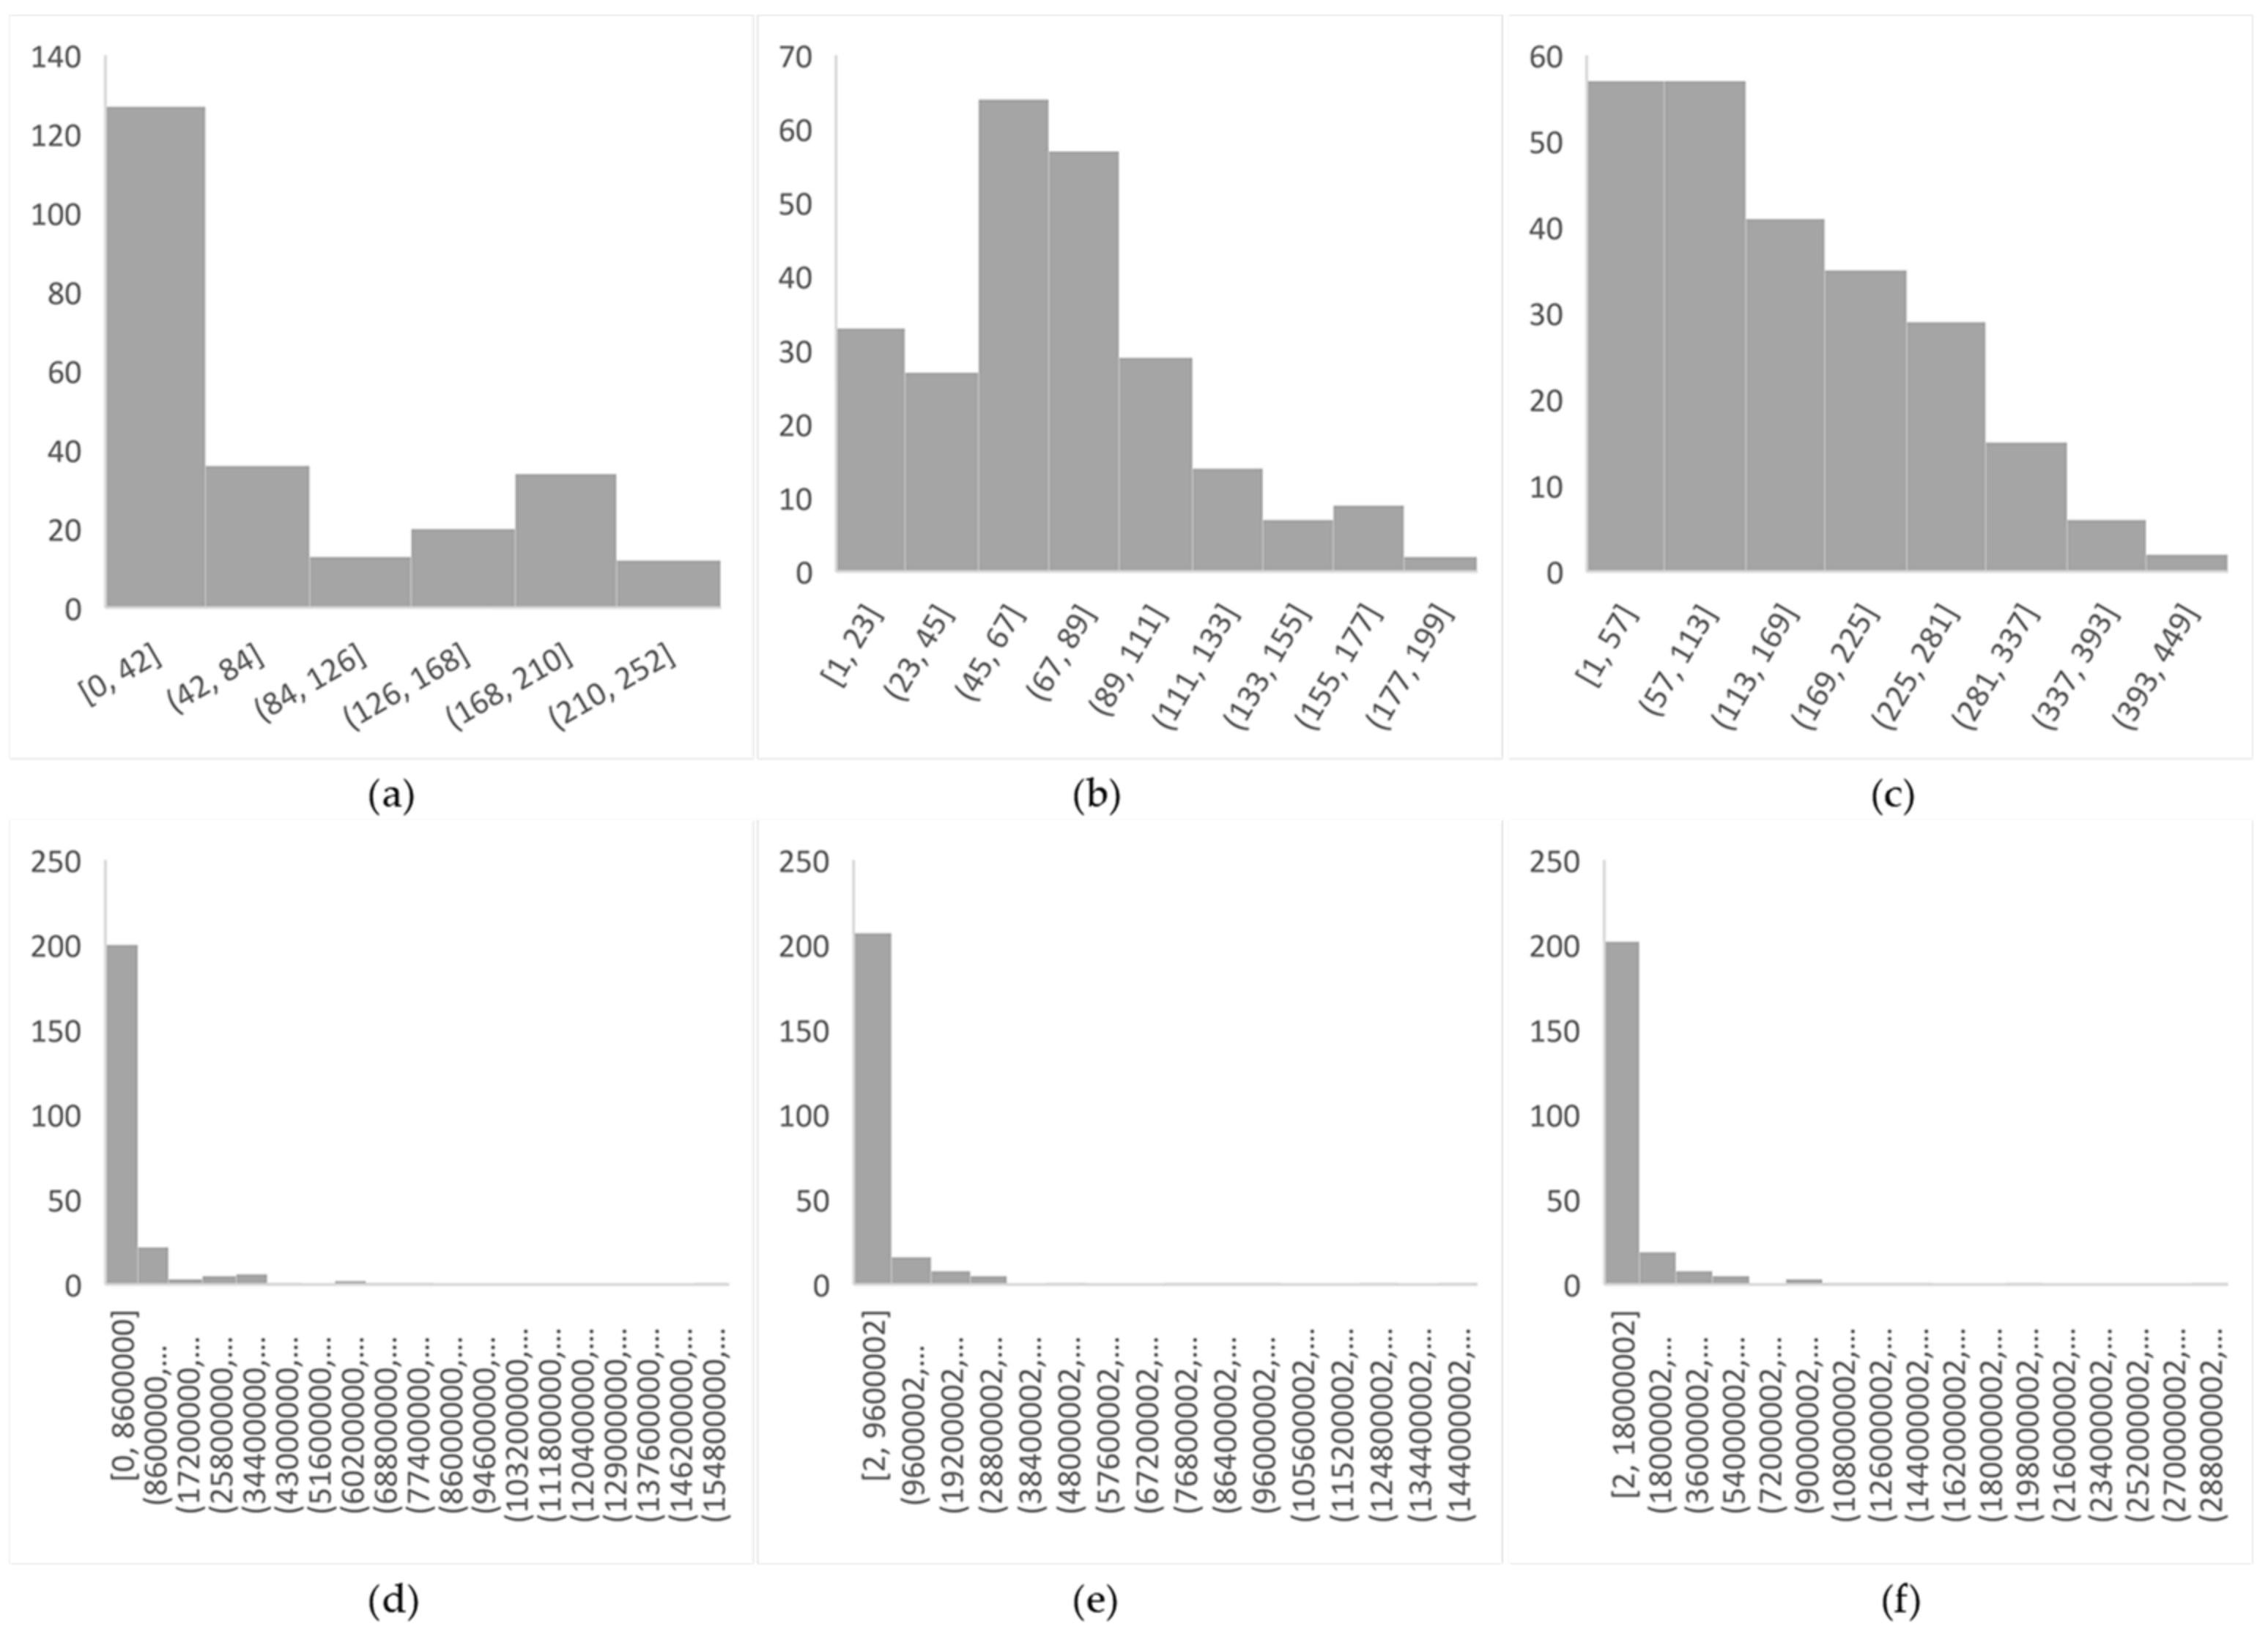
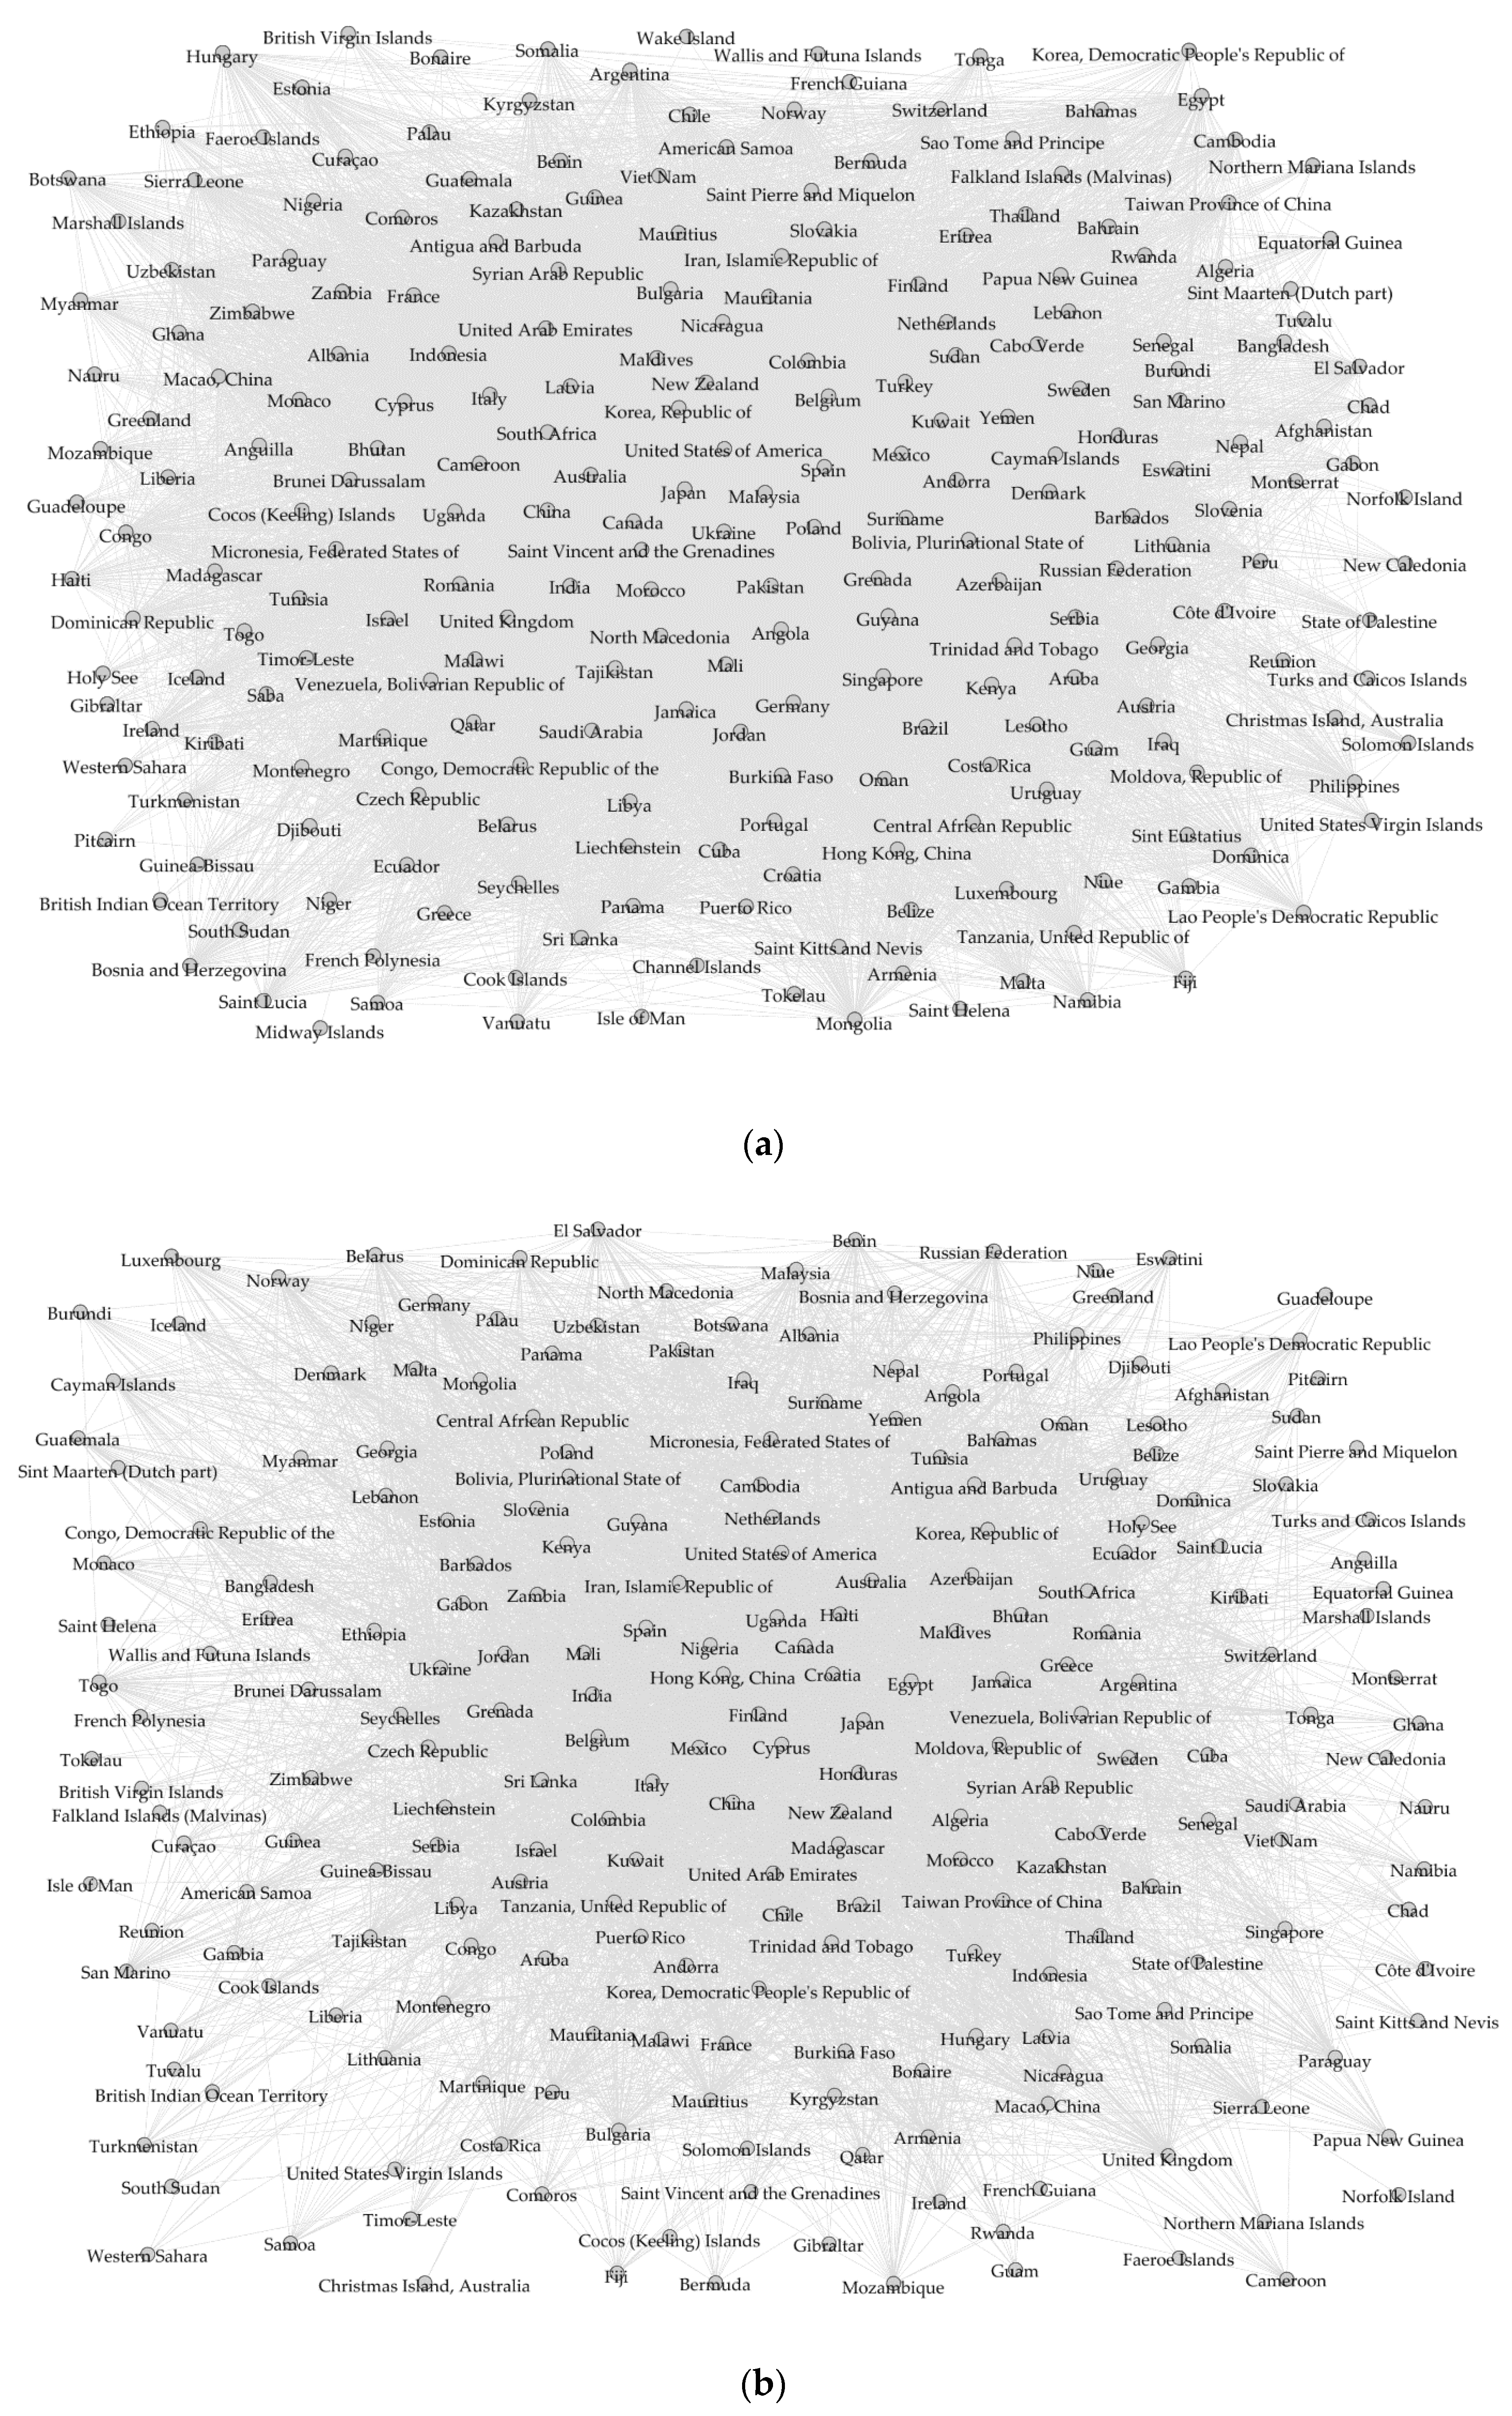
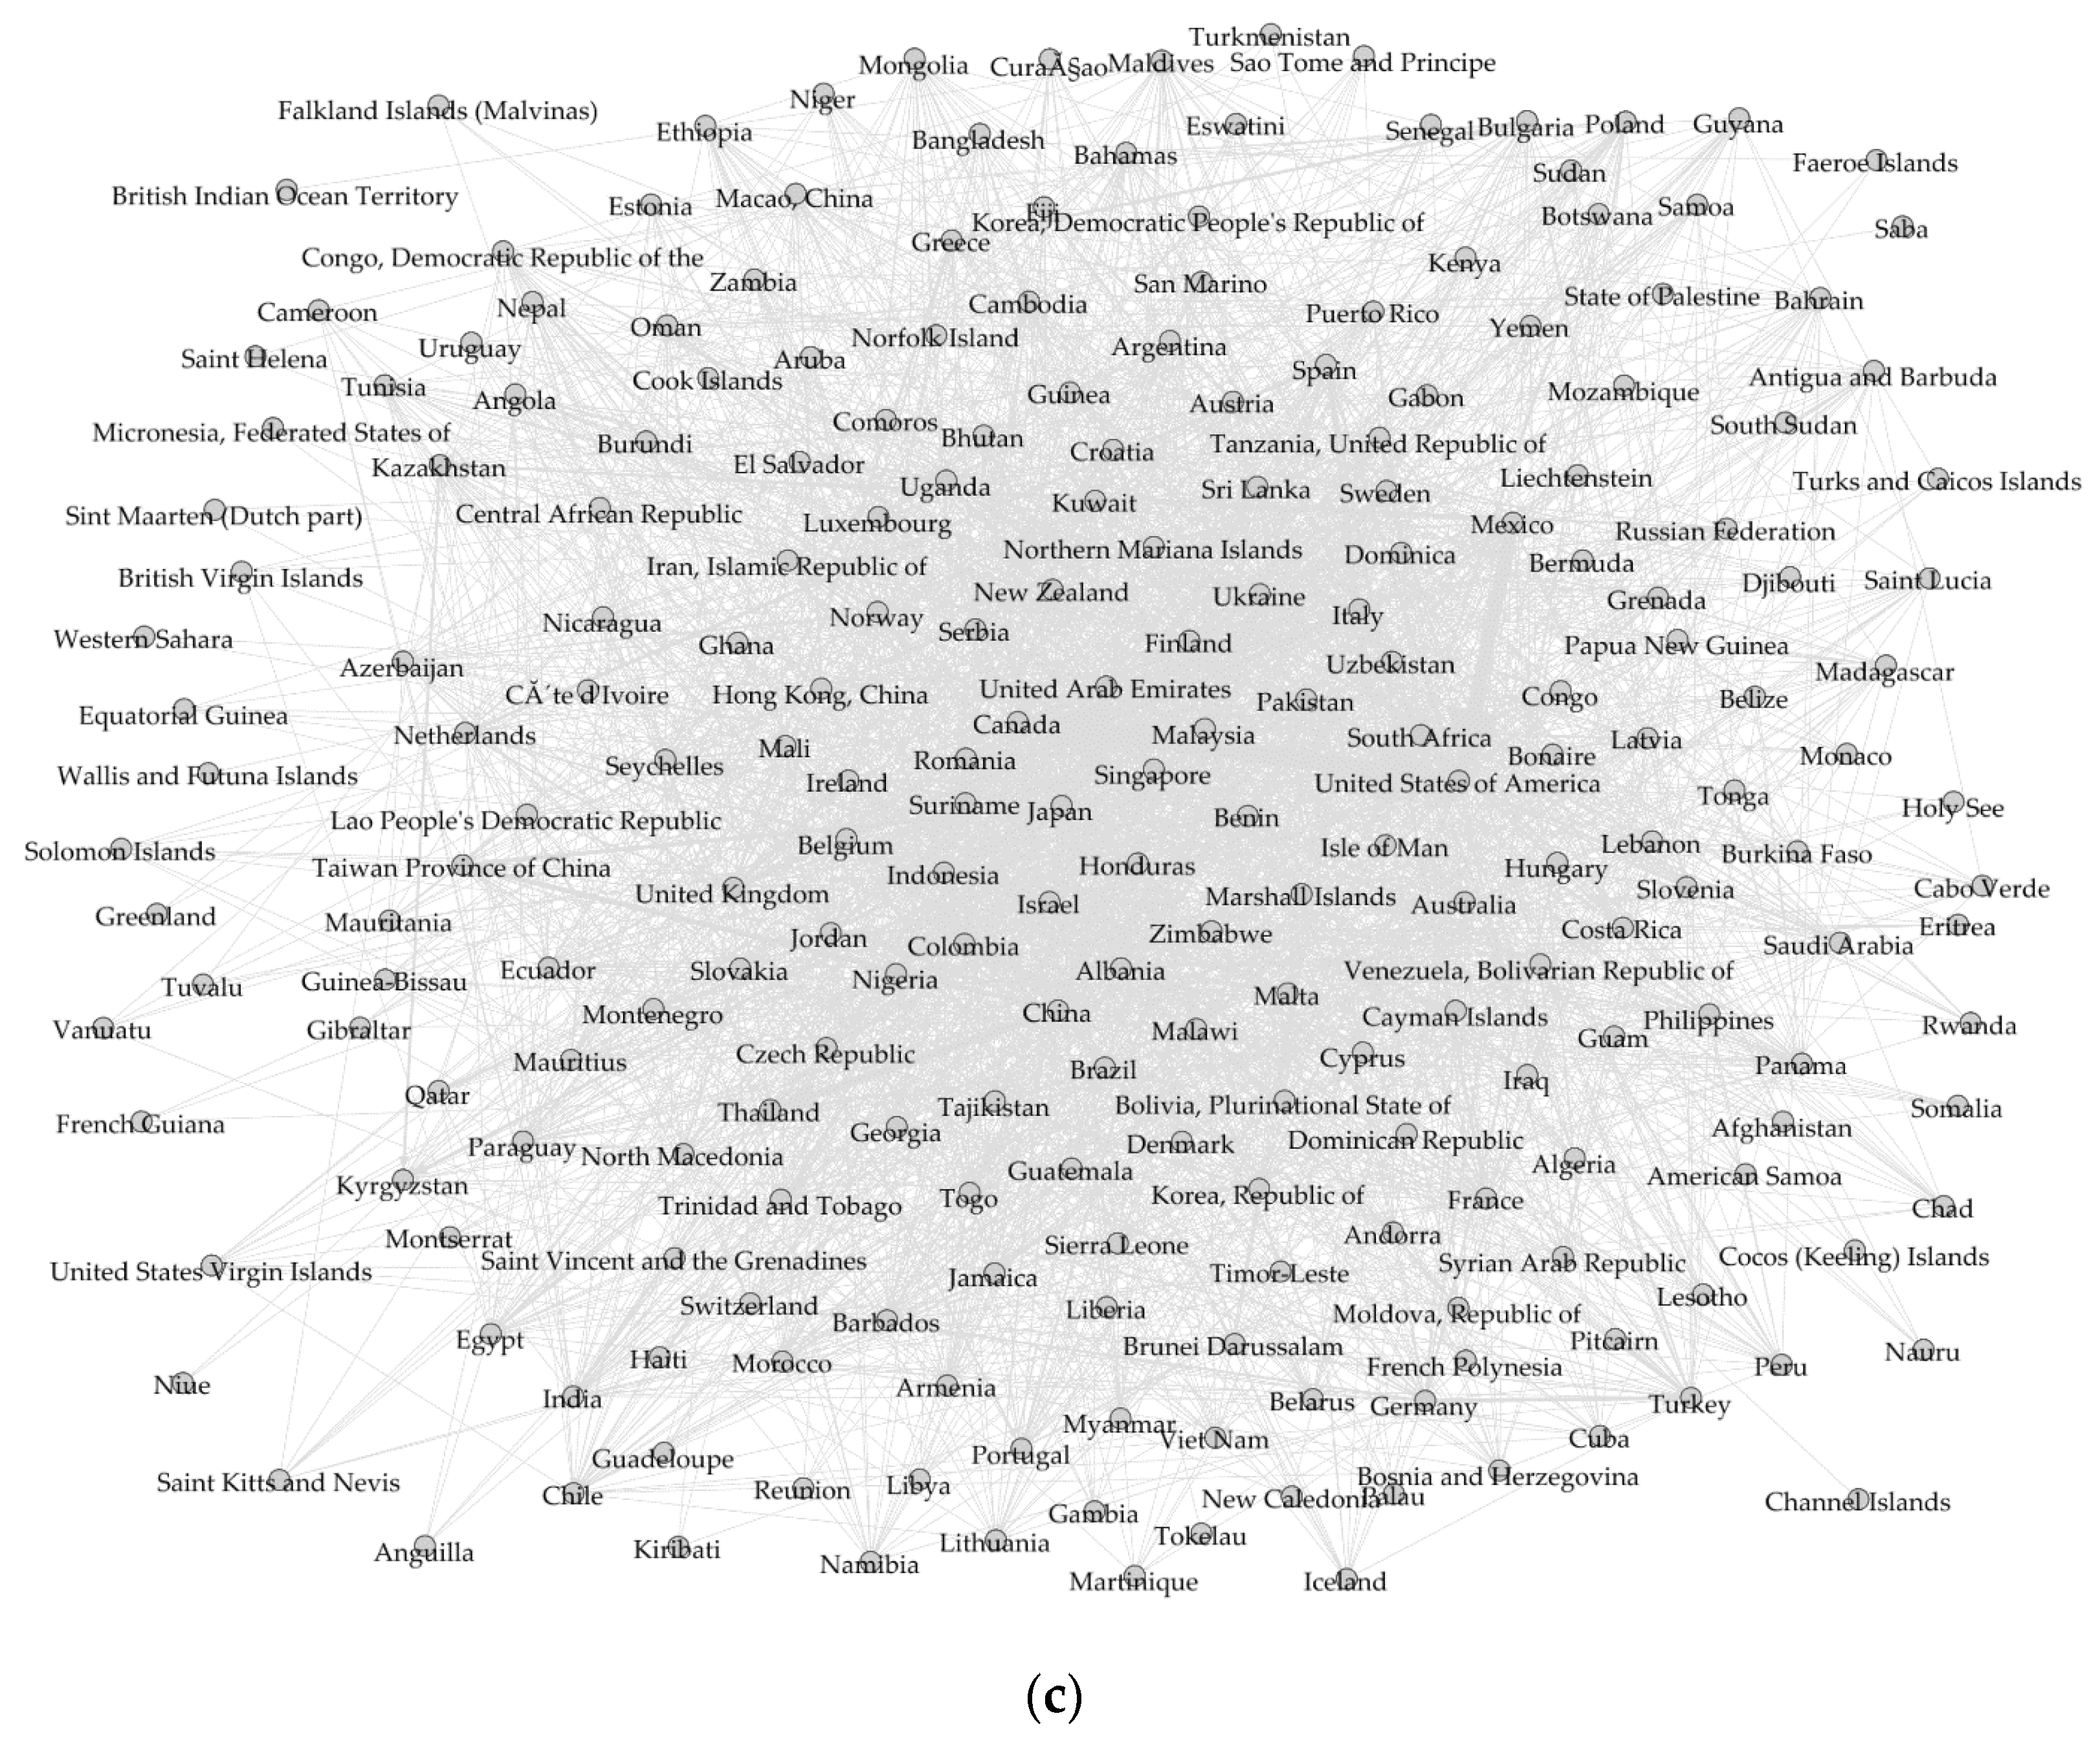
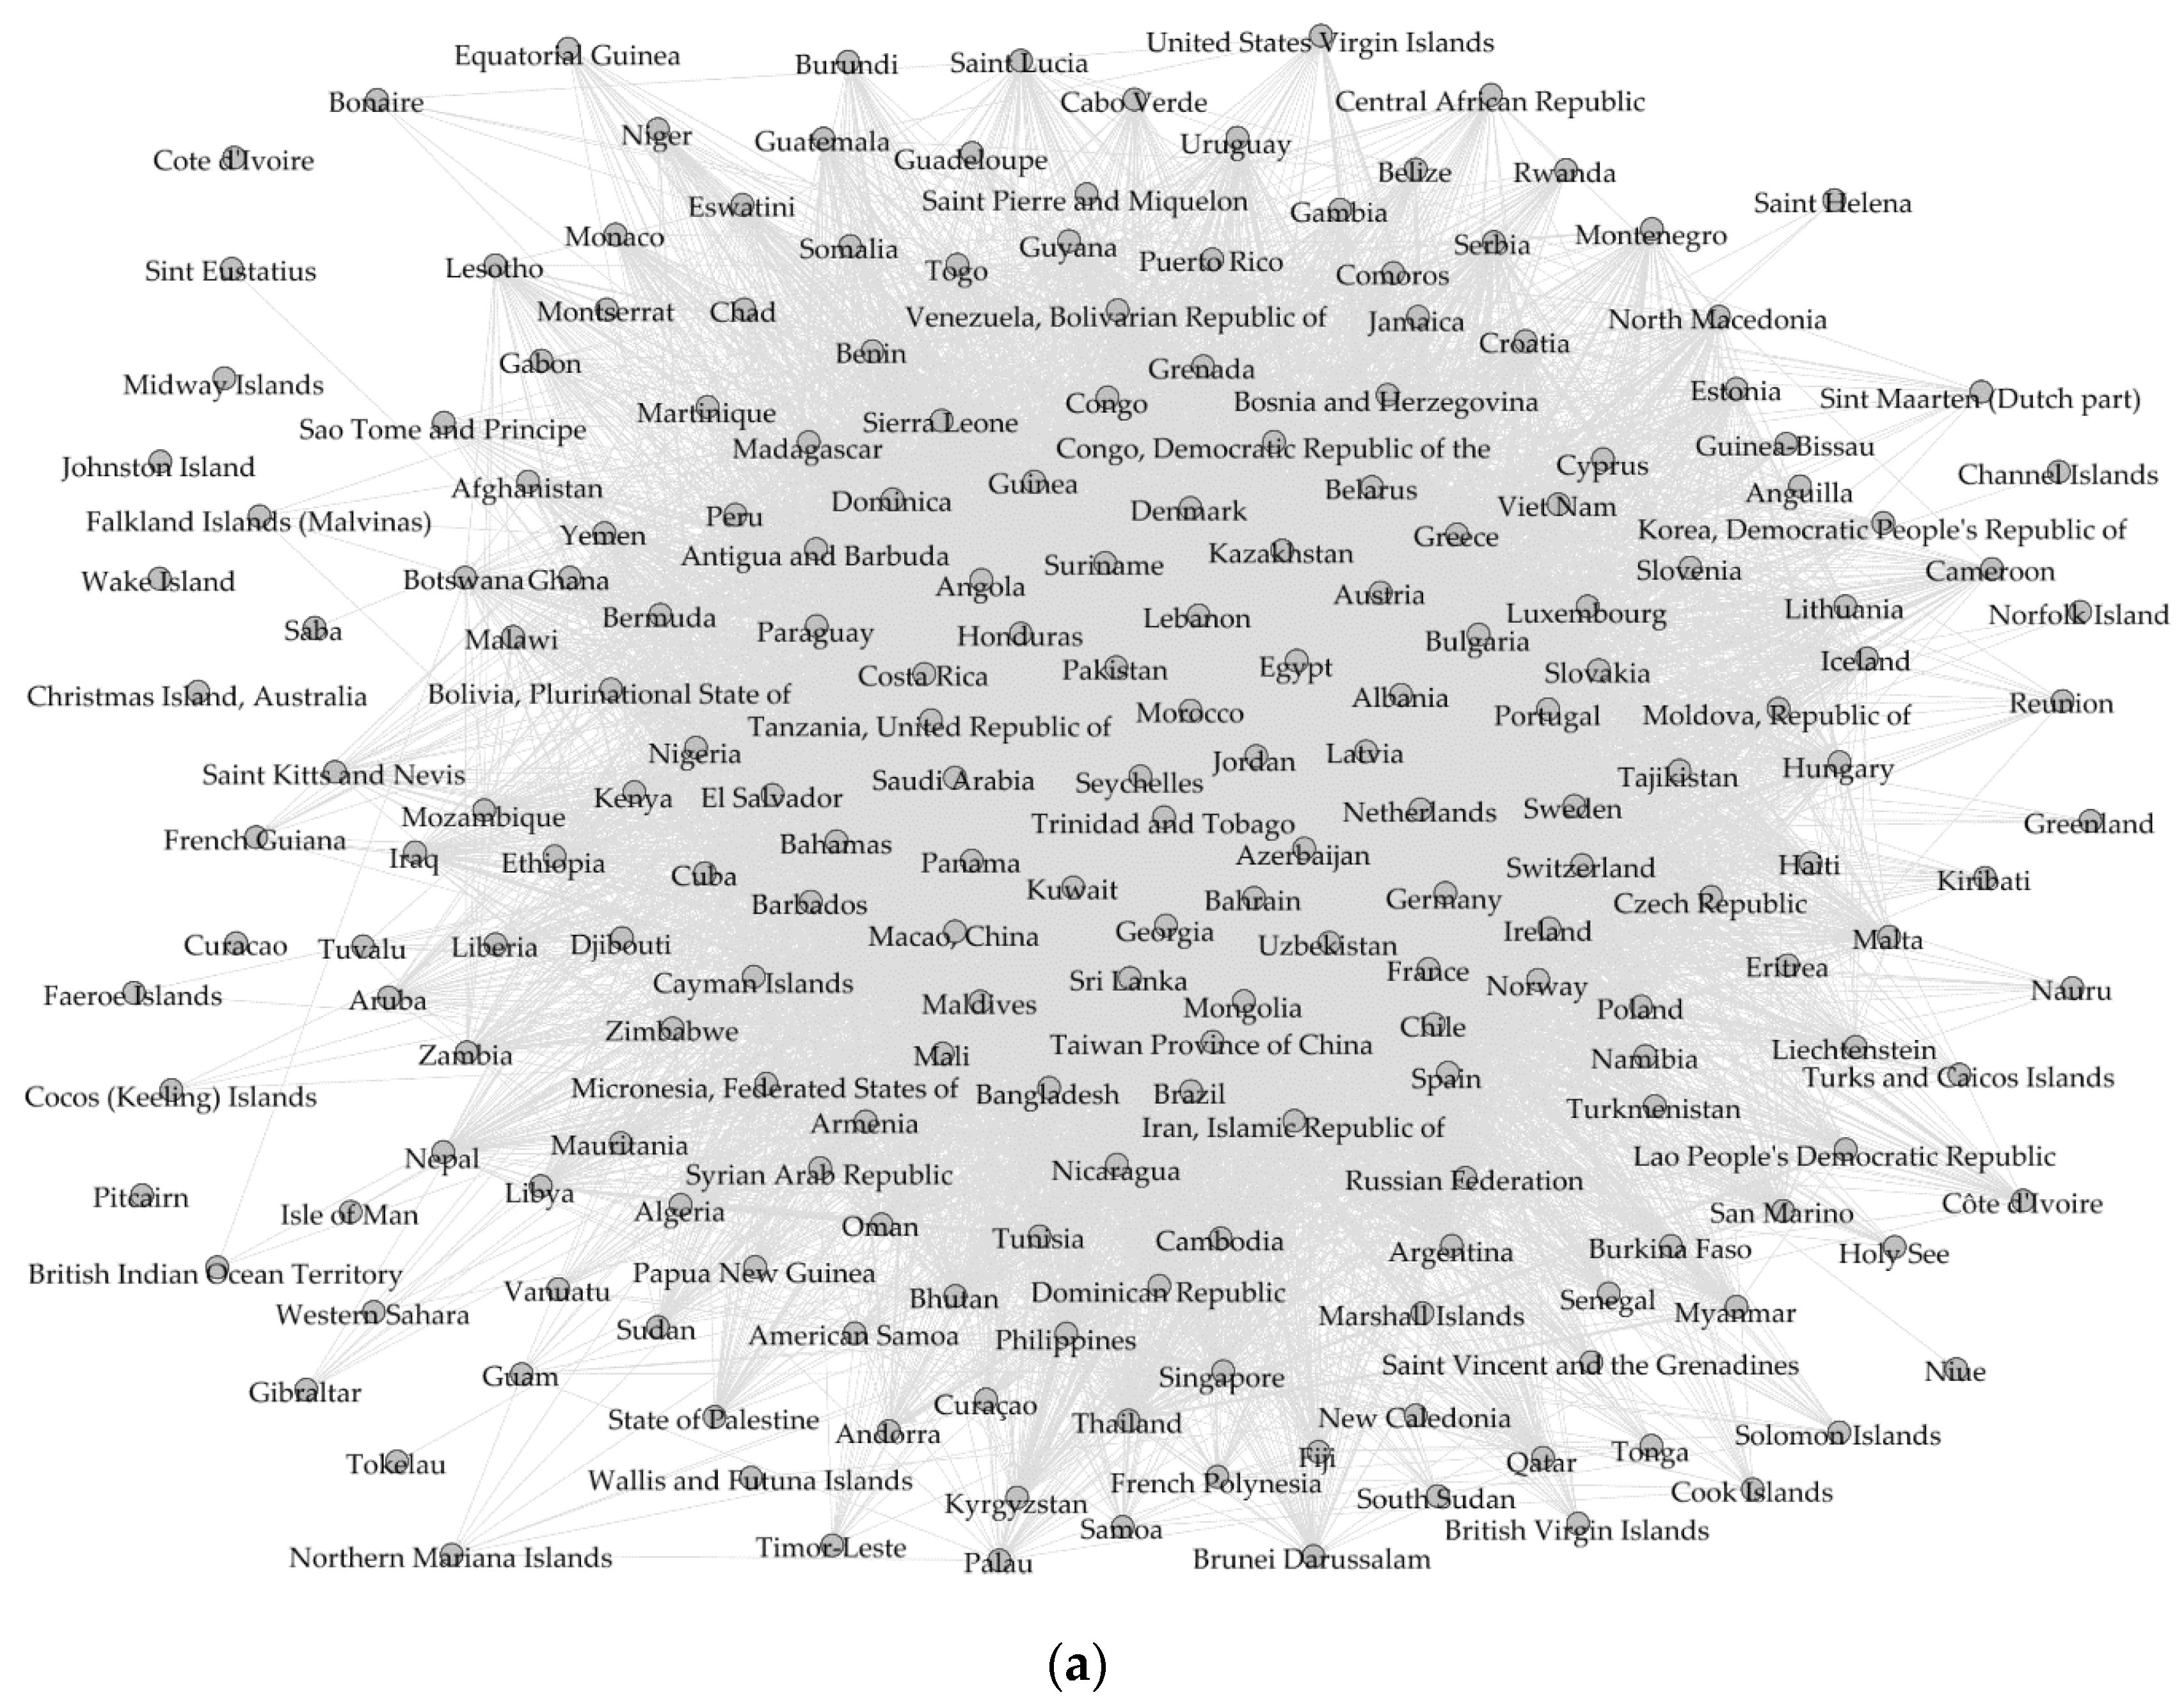
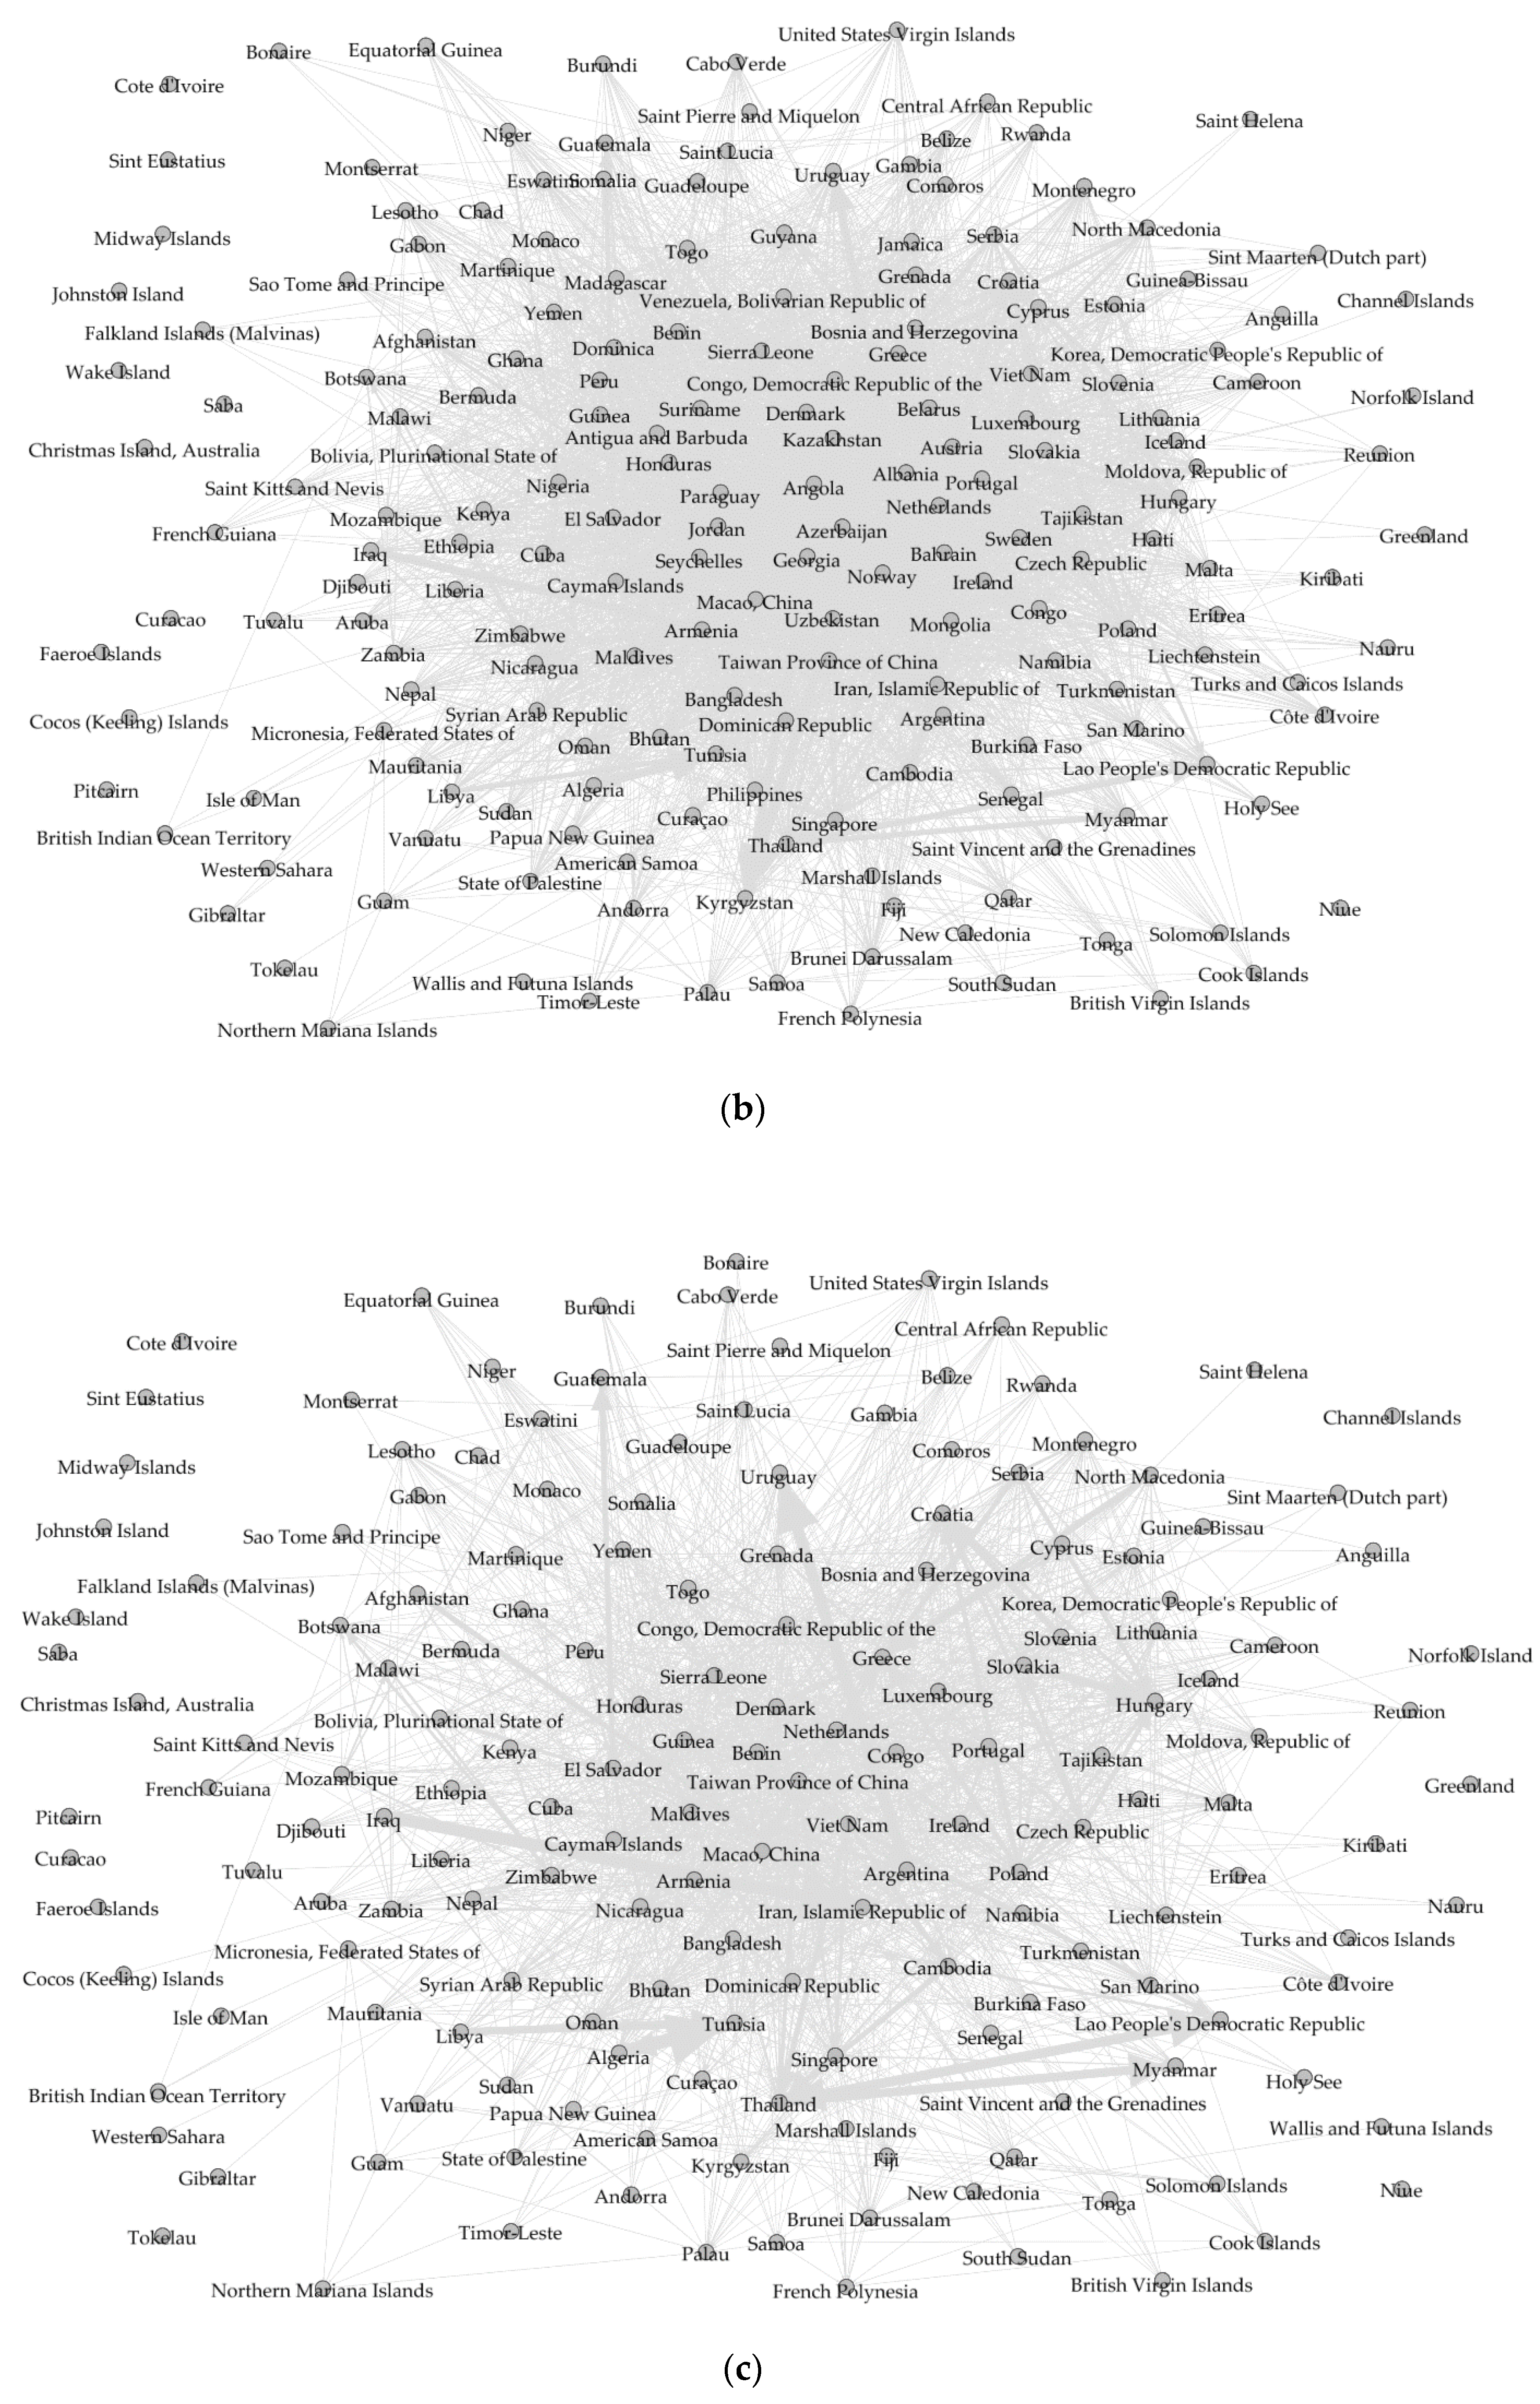
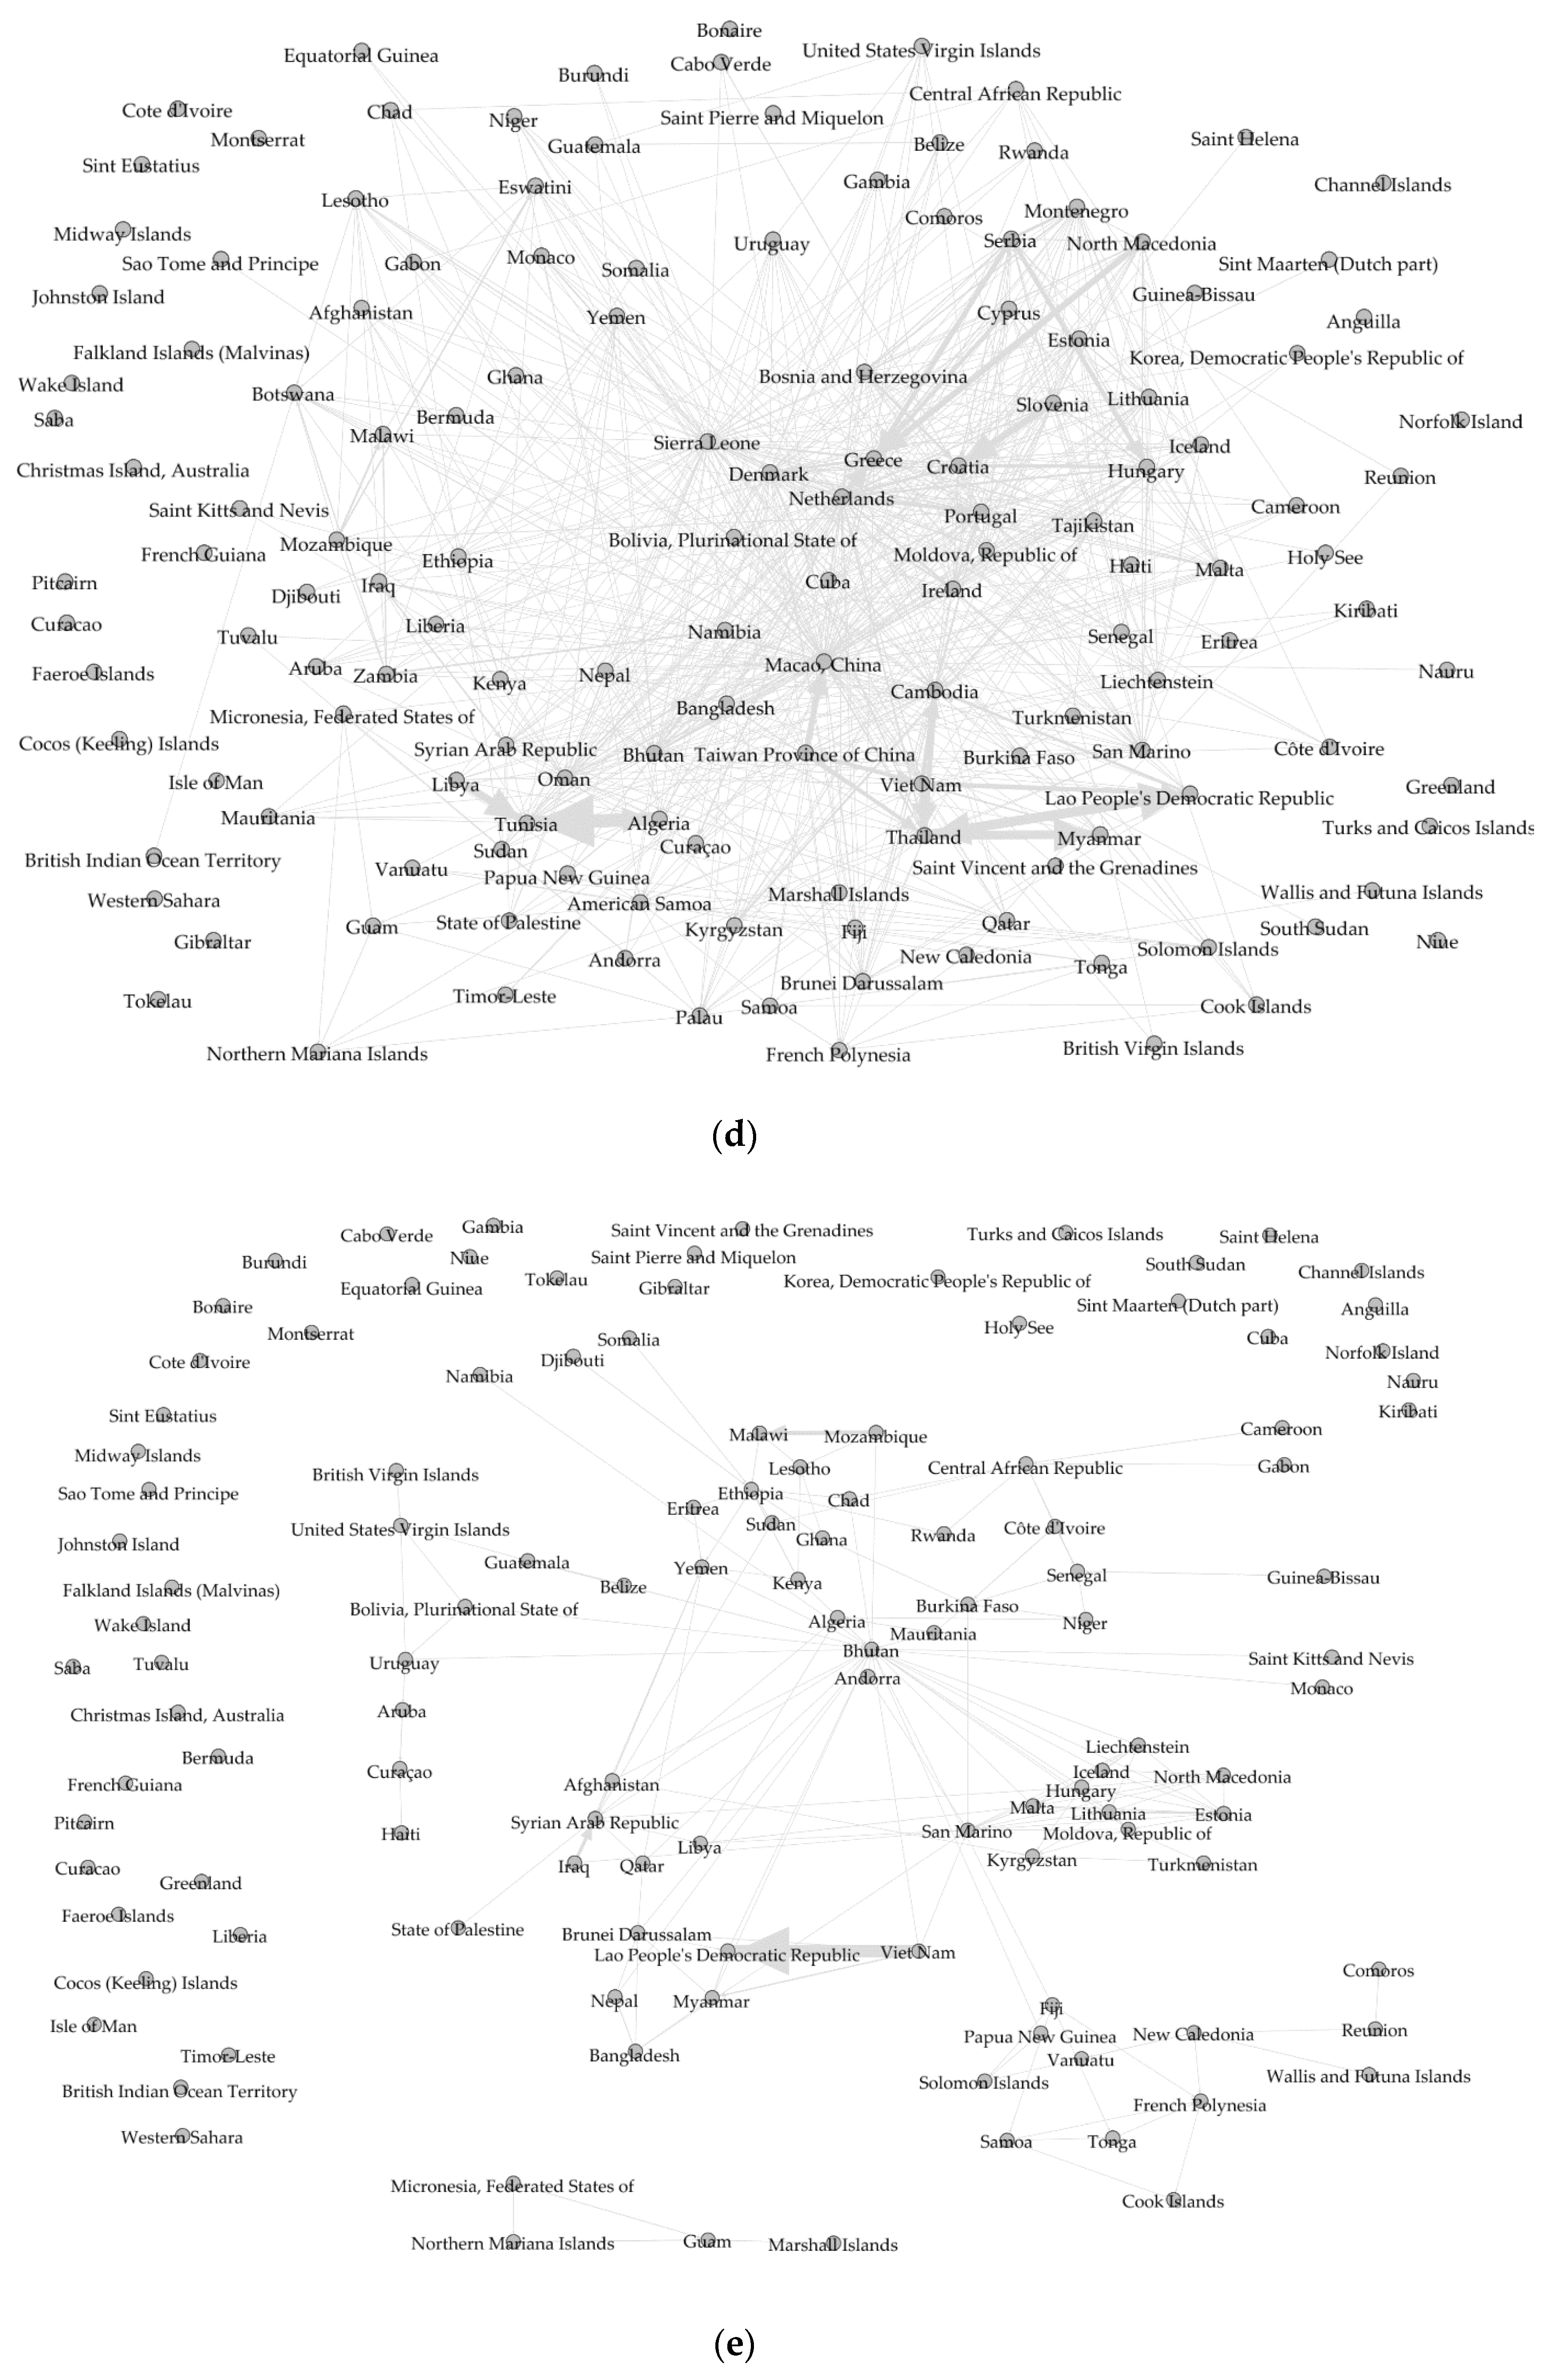
Table A1.
Sources of the data on non-resident tourists/visitors by country of residence/nationality.
Table A1.
Sources of the data on non-resident tourists/visitors by country of residence/nationality.
| Country | Source: Arrivals of Non-Resident Tourists at National Borders | Source: Arrivals of Non-Resident Tourists by Accommodation | Source: Arrivals of Non-Resident Visitors at National Borders | Source: Statistics Bureau (or Tourist Bureau) of the Country |
|---|---|---|---|---|
| Afghanistan | Data unavailable | |||
| Albania | Albania: Country specific: Arrivals of non-resident visitors at national borders, by nationality 2015–2019 (07.2020) | |||
| Algeria | Algeria: Country specific: Arrivals of non-resident visitors at national borders, by nationality 2015–2019 (05.2020) | |||
| American Samoa | American Samoa: Country specific: Arrivals of non-resident tourists at national borders, by nationality 2013–2017 (11.2018)—data for 2018 not available | |||
| Andorra | Andorra: Country specific: Arrivals of non-resident tourists at national borders, by country of residence 2014–2018 (11.2019) | |||
| Angola | Angola: Country specific: Arrivals of non-resident tourists at national borders, by country of residence 2015–2019 (07.2020) | |||
| Anguilla | Anguilla: Country specific: Arrivals of non-resident tourists at national borders, by country of residence 2015–2019 (09.2020) | |||
| Antigua and Barbuda | Antigua and Barbuda: Country specific: Arrivals of non-resident tourists at national borders, by country of residence 2014–2018 (09.2019) | |||
| Argentina | Argentina: Country specific: Arrivals of non-resident tourists at national borders, by country of residence 2014–2018 (12.2019) | |||
| Armenia | Armenia: Country specific: Arrivals of non-resident tourists at national borders, by country of residence 2014–2018 (12.2019) | |||
| Aruba | Aruba: Country specific: Arrivals of non-resident tourists at national borders, by country of residence 2014–2018 (11.2019) | |||
| Australia | Australia: Country specific: Arrivals of non-resident visitors at national borders, by country of residence 2014–2018 (05.2019) | |||
| Austria | Austria: Country specific: Arrivals of non-resident tourists in all types of accommodation establishments, by country of residence 2015–2019 (07.2020) | |||
| Azerbaijan | Azerbaijan: Country specific: Arrivals of non-resident tourists in hotels and similar establishments, by country of residence 2015–2019 (07.2020) | |||
| Bahamas | Bahamas: Country specific: Arrivals of non-resident tourists at national borders, by country of residence 2015–2019 (07.2020) | |||
| Bahrain | Bahrain: Country specific: Arrivals of non-resident visitors at national borders, by nationality 2014–2018 (11.2019)—data for 2018 not available | |||
| Bangladesh | Bangladesh: Country specific: Arrivals of non-resident tourists at national borders, by nationality 2010–2014 (12.2015)—data for 2018 not available | |||
| Barbados | Barbados: Country specific: Arrivals of non-resident tourists at national borders, by country of residence 2014–2018 (11.2019) | |||
| Belarus | Belarus: Country specific: Arrivals of non-resident tourists at national borders, by nationality 2015–2019 (07.2020) | |||
| Belgium | Belgium: Country specific: Arrivals of non-resident tourists in all types of accommodation establishments, by country of residence 2014–2018 (07.2019) | |||
| Belize | Belize: Country specific: Arrivals of non-resident tourists at national borders, by nationality 2014–2018 (10.2019) | |||
| Benin | Benin: Country specific: Arrivals of non-resident tourists at national borders, by country of residence 2014–2018 (05.2019) | |||
| Bermuda | Bermuda: Country specific: Arrivals of non-resident tourists at national borders, by country of residence 2014–2018 (04.2019) | |||
| Bhutan | Bhutan: Country specific: Arrivals of non-resident tourists at national borders, by nationality 2015–2019 (07.2020) | |||
| Bolivia, Plurinational State of | Bolivia, Plurinational State of: Country specific: Arrivals of non-resident tourists at national borders, by nationality 2014–2018 (11.2019) | |||
| Bonaire | https://www.cbs.nl/en-gb/figures/detail/83191ENG?q=tourism (accessed on 15 December 2020) | |||
| Bosnia and Herzegovina | Bosnia and Herzegovina: Country specific: Arrivals of non-resident tourists in all types of accommodation establishments, by country of residence 2014–2018 (07.2019) | |||
| Botswana | Botswana: Country specific: Arrivals of non-resident tourists at national borders, by country of residence 2014–2018 (10.2019) | |||
| Brazil | Brazil: Country specific: Arrivals of non-resident tourists at national borders, by country of residence 2014–2018 (09.2019) | |||
| British Virgin Islands | British Virgin Islands: Country specific: Arrivals of non-resident tourists at national borders, by country of residence 2009–2013 (04.2015)—data for 2018 not available | |||
| Brunei Darussalam | Brunei Darussalam: Country specific: Arrivals of non-resident tourists at national borders, by nationality 2015–2019 (05.2020) | |||
| Bulgaria | Bulgaria: Country specific: Arrivals of non-resident tourists in all types of accommodation establishments, by country of residence 2015–2019 (06.2020) | |||
| Burkina Faso | Burkina Faso: Country specific: Arrivals of non-resident tourists in hotels and similar establishments, by country of residence 2014–2018 (06.2019) | |||
| Burundi | Burundi: Country specific: Arrivals of non-resident tourists at national borders, by nationality 2013–2017 (11.2018)—data for 2018 not available | |||
| Cabo Verde | Cape Verde: Country specific: Arrivals of non-resident tourists in hotels and similar establishments, by country of residence 2015–2019 (03.2020) | |||
| Cambodia | Cambodia: Country specific: Arrivals of non-resident tourists at national borders, by country of residence 2014–2018 (05.2019) | |||
| Cameroon | Cameroon: Country specific: Arrivals of non-resident tourists in hotels and similar establishments, by nationality 2014–2018 (11.2019) | |||
| Canada | Canada: Country specific: Arrivals of non-resident tourists at national borders, by country of residence 2014–2018 (12.2019) | |||
| Cayman Islands | Cayman Islands: Country specific: Arrivals of non-resident tourists at national borders, by country of residence 2014–2018 (10.2019) | |||
| Central African Republic | Central African Republic: Country specific: Arrivals of non-resident tourists at national borders, by nationality 2014–2018 (10.2019)—data for 2018 not available | |||
| Chad | Chad: Country specific: Arrivals of non-resident tourists at national borders, by nationality 2013–2017 (12.2018)—data for 2018 not available | Chad: Country specific: Arrivals of non-resident tourists in hotels and similar establishments, by nationality 2013–2017 (12.2018)—data for 2018 not available | ||
| Chile | Chile: Country specific: Arrivals of non-resident tourists at national borders, by nationality 2015–2019 (07.2020) | |||
| China | China: Country specific: Arrivals of non-resident visitors at national borders, by nationality 2014—2018 (12.2019) | |||
| Colombia | Colombia: Country specific: Arrivals of non-resident tourists at national borders, by country of residence 2014–2018 (11.2019) | |||
| Comoros | Comoros: Country specific: Arrivals of non-resident tourists at national borders, by nationality 2015–2019 (05.2020) | |||
| Congo | Congo: Country specific: Arrivals of non-resident tourists in hotels and similar establishments, by country of residence 2014–2018 (11.2019) | |||
| Cook Islands | Cook Islands: Country specific: Arrivals of non-resident tourists at national borders, by country of residence 2015–2019 (04.2020) | |||
| Costa Rica | Costa Rica: Country specific: Arrivals of non-resident tourists at national borders, by nationality 2015–2019 (05.2020) | |||
| Côte d’ivoire | Cote d’ivoire: Country specific: Arrivals of non-resident visitors at national borders, by country of residence 2014–2018 (07.2019) | |||
| Croatia | Croatia: Country specific: Arrivals of non-resident tourists in all types of accommodation establishments, by country of residence 2015–2019 (07.2020) | |||
| Cuba | Cuba: Country specific: Arrivals of non-resident visitors at national borders, by country of residence 2014–2018 (12.2019) | |||
| Curaçao | Curaçao: Country specific: Arrivals of non-resident tourists at national borders, by country of residence 2014–2018 (07.2019) | |||
| Cyprus | Cyprus: Country specific: Arrivals of non-resident tourists at national borders, by country of residence 2014–2018 (07.2019) | Cyprus: Country specific: Arrivals of non-resident tourists in all types of accommodation establishments, by country of residence 2014–2018 (07.2019) | ||
| Czech Republic | Czech Republic: Country specific: Arrivals of non-resident tourists in all types of accommodation establishments, by nationality 2015–2019 (05.2020) | |||
| Democratic Republic of the Congo | Democratic Republic of the Congo: Country specific: Arrivals of non-resident tourists at national borders, by country of residence 2013—2017 (12.2018)—data for 2018 not available | |||
| Denmark | Denmark: Country specific: Arrivals of non-resident tourists in all types of accommodation establishments, by country of residence 2015–2019 (07.2020) | |||
| Djibouti | Data unavailable | |||
| Dominica | Dominica: Country specific: Arrivals of non-resident tourists at national borders, by country of residence 2014–2018 (12.2019) | |||
| Dominican Republic | Dominican Republic: Country specific: Arrivals of non-resident tourists at national borders, by country of residence 2015–2019 (03.2020) | |||
| Ecuador | Ecuador: Country specific: Arrivals of non-resident visitors at national borders, by country of residence 2014–2018 (11.2019) | |||
| Egypt | Egypt: Country specific: Arrivals of non-resident visitors at national borders, by nationality 2014–2018 (11.2019) | |||
| El Salvador | El Salvador: Country specific: Arrivals of non-resident tourists at national borders, by nationality 2015–2019 (07.2020) | |||
| Equatorial Guinea | Data unavailable | |||
| Eritrea | Data unavailable | |||
| Estonia | Estonia: Country specific: Arrivals of non-resident tourists in all types of accommodation establishments, by country of residence 2014–2018 (11.2019) | |||
| Eswatini | Swaziland: Country specific: Arrivals of non-resident tourists in hotels and similar establishments, by country of residence 2014–2018 (11.2019) | |||
| Ethiopia | Ethiopia: Country specific: Arrivals of non-resident tourists at national borders, by country of residence 2014–2018 (11.2019) | |||
| Fiji | Fiji: Country specific: Arrivals of non-resident tourists at national borders, by country of residence 2015–2019 (05.2020) | |||
| Finland | Finland: Country specific: Arrivals of non-resident tourists in all types of accommodation establishments, by country of residence 2015–2019 (07.2020) | |||
| France | France: Country specific: Arrivals of non-resident tourists at national borders, by country of residence 2014–2018 (11.2019) | France: Country specific: Arrivals of non-resident tourists in all types of accommodation establishments, by country of residence 2014–2018 (12.2019) | ||
| French Guiana | French Guiana: Country specific: Arrivals of non-resident tourists at national borders, by country of residence 2014–2018 (11.2019)—data for 2018 not available | |||
| French Polynesia | French Polynesia: Country specific: Arrivals of non-resident tourists at national borders, by country of residence 2015–2019 (03.2020) | |||
| Gabon | Data unavailable | |||
| Gambia | Gambia: Country specific: Arrivals of non-resident tourists at national borders, by nationality 2014–2018 (10.2019) | |||
| Georgia | Georgia: Country specific: Arrivals of non-resident tourists in hotels and similar establishments, by country of residence 2014–2018 (11.2019) | |||
| Germany | Germany: Country specific: Arrivals of non-resident tourists in all types of accommodation establishments, by country of residence 2015–2019 (07.2020) | |||
| Ghana | Data unavailable | |||
| Greece | Greece: Country specific: Arrivals of non-resident tourists at national borders, by country of residence 2015–2019 (07.2020) | Greece: Country specific: Arrivals of non-resident tourists in all types of accommodation establishments, by country of residence 2014–2018 (11.2019) | ||
| Grenada | Grenada: Country specific: Arrivals of non-resident tourists at national borders, by nationality 2015–2019 (05.2020) | |||
| Guadeloupe | Guadeloupe: Country specific: Arrivals of non-resident tourists at national borders, by country of residence 2011–2015 (11.2016)—data for 2018 not available | |||
| Guam | Guam: Country specific: Arrivals of non-resident tourists at national borders, by country of residence 2015–2019 (06.2020) | |||
| Guatemala | Guatemala: Country specific: Arrivals of non-resident visitors at national borders, by country of residence 2014–2018 (07.2019) | |||
| Guinea | Guinea: Country specific: Arrivals of non-resident tourists at national borders, by country of residence 2013–2017 (01.2019)—data for 2018 not available | |||
| Guinea-Bissau | Data unavailable | |||
| Guyana | Guyana: Country specific: Arrivals of non-resident tourists at national borders, by country of residence 2015–2019 (04.2020) | |||
| Haiti | Haiti: Country specific: Arrivals of non-resident tourists at national borders, by country of residence 2015–2019 (05.2020) | |||
| Honduras | Honduras: Country specific: Arrivals of non-resident tourists at national borders, by nationality 2013–2017 (12.2018)—data for 2018 not available | |||
| Hong Kong, China | Hong Kong, China: Country specific: Arrivals of non-resident tourists at national borders, by country of residence 2015–2019 (07.2020) | |||
| Hungary | Hungary: Country specific: Arrivals of non-resident tourists at national borders, by nationality 2015–2019 (07.2020) | Hungary: Country specific: Arrivals of non-resident tourists in all types of accommodation establishments, by nationality 2015–2019 (07.2020) | ||
| Iceland | Iceland: Country specific: Arrivals of non-resident tourists at national borders, by nationality 2014–2018 (11.2019) | Iceland: Country specific: Arrivals of non-resident tourists in all types of accommodation establishments, by nationality 2014–2018 (11.2019) | ||
| India | India: Country specific: Arrivals of non-resident tourists at national borders, by nationality 2014–2018 (01.2020) | |||
| Indonesia | Indonesia: Country specific: Arrivals of non-resident visitors at national borders, by nationality 2015–2019 (09.2020) | |||
| Iran, Islamic Republic of | Iran, Islamic Republic of: Country specific: Arrivals of non-resident visitors at national borders, by nationality 2014–2018 (07.2019) | |||
| Iraq | Data unavailable | |||
| Ireland | Ireland: Country specific: Arrivals of non-resident tourists at national borders, by country of residence 2014–2018 (10.2019) | |||
| Israel | Israel: Country specific: Arrivals of non-resident tourists at national borders, by country of residence 2014–2018 (05.2019) | Israel: Country specific: Arrivals of non-resident tourists in hotels and similar establishments, by country of residence 2014–2018 (05.2019) | ||
| Italy | Italy: Country specific: Arrivals of non-resident tourists at national borders, by nationality 2015–2019 (07.2020) | Italy: Country specific: Arrivals of non-resident tourists in all types of accommodation establishments, by nationality 2015–2019 (07.2020) | ||
| Jamaica | Jamaica: Country specific: Arrivals of non-resident tourists at national borders, by country of residence 2015–2019 (07.2020) | |||
| Japan | Japan: Country specific: Arrivals of non-resident visitors at national borders, by nationality 2015–2019 (07.2020) | |||
| Jordan | Jordan: Country specific: Arrivals of non-resident tourists at national borders, by nationality 2014–2018 (06.2019) | |||
| Kazakhstan | Kazakhstan: Country specific: Arrivals of non-resident visitors at national borders, by country of residence 2015–2019 (07.2020) | |||
| Kenya | Data unavailable | |||
| Kiribati | Kiribati: Country specific: Arrivals of non-resident tourists at national borders, by nationality 2014–2018 (11.2019) | |||
| Korea, Republic of | Korea, Republic of: Country specific: Arrivals of non-resident visitors at national borders, by nationality 2015–2019 (07.2020) | |||
| Kuwait | Kuwait: Country specific: Arrivals of non-resident visitors at national borders, by nationality 2014–2018 (11.2019) | |||
| Kyrgyzstan | Kyrgyzstan: Country specific: Arrivals of non-resident visitors at national borders, by country of residence 2014–2018 (10.2019) | |||
| Lao People’s Democratic Republic | Lao People’s Democratic Republic: Country specific: Arrivals of non-resident visitors at national borders, by nationality 2015–2019 (05.2020) | |||
| Latvia | Latvia: Country specific: Arrivals of non-resident tourists in all types of accommodation establishments, by country of residence 2015–2019 (07.2020) | |||
| Lebanon | Lebanon: Country specific: Arrivals of non-resident tourists at national borders, by nationality 2015–2019 (06.2020) | |||
| Lesotho | Lesotho: Country specific: Arrivals of non-resident visitors at national borders, by country of residence 2015–2019 (09.2020) | |||
| Liberia | Data unavailable | |||
| Libya | Data unavailable | |||
| Liechtenstein | Liechtenstein: Country specific: Arrivals of non-resident tourists in all types of accommodation establishments, by country of residence 2015–2019 (07.2020) | |||
| Lithuania | Lithuania: Country specific: Arrivals of non-resident tourists at national borders, by country of residence 2014–2018 (12.2019) | Lithuania: Country specific: Arrivals of non-resident tourists in all types of accommodation establishments, by country of residence 2014–2018 (12.2019) | ||
| Luxembourg | Luxembourg: Country specific: Arrivals of non-resident tourists in all types of accommodation establishments, by country of residence 2014–2018 (09.2019) | |||
| Macao, China | Macao, China: Country specific: Arrivals of non-resident tourists in hotels and similar establishments, by country of residence 2015–2019 (07.2020) | |||
| Madagascar | Madagascar: Country specific: Arrivals of non-resident tourists at national borders, by nationality 2014–2018 (11.2019) | |||
| Malawi | Malawi: Country specific: Arrivals of non-resident tourists at national borders, by country of residence 2014–2018 (11.2019) | |||
| Malaysia | Malaysia: Country specific: Arrivals of non-resident tourists at national borders, by nationality 2015–2019 (07.2020) | |||
| Maldives | Maldives: Country specific: Arrivals of non-resident tourists at national borders, by nationality 2014–2018 (07.2019) | |||
| Mali | Mali: Country specific: Arrivals of non-resident tourists at national borders, by country of residence 2014–2018 (06.2019) | |||
| Malta | Malta: Country specific: Arrivals of non-resident tourists at national borders, by country of residence 2015–2019 (07.2020) | |||
| Marshall Islands | Marshall Islands: Country specific: Arrivals of non-resident tourists at national borders, by country of residence 2013–2017 (06.2018)—data for 2018 not available | |||
| Martinique | Martinique: Country specific: Arrivals of non-resident tourists at national borders, by country of residence 2014–2018 (06.2019) | Martinique: Country specific: Arrivals of non-resident tourists in all types of accommodation establishments, by country of residence 2014–2018 (06.2019) | ||
| Mauritania | Data unavailable | |||
| Mauritius | Mauritius: Country specific: Arrivals of non-resident tourists at national borders, by country of residence 2015–2019 (07.2020) | |||
| Mexico | Mexico: Country specific: Arrivals of non-resident tourists at national borders, by country of residence 2014–2018 (12.2019) | |||
| Micronesia, Federated States of | Micronesia, Federated States of: Country specific: Arrivals of non-resident tourists at national borders, by country of residence 2012–2016 (10.2017)—data for 2018 not available | |||
| Moldova, Republic of | Moldova, Republic of: Country specific: Arrivals of non-resident tourists in all types of accommodation establishments, by nationality 2015–2019 (07.2020) | |||
| Monaco | Monaco: Country specific: Arrivals of non-resident tourists in hotels and similar establishments, by nationality 2015–2019 (07.2020) | |||
| Mongolia | Mongolia: Country specific: Arrivals of non-resident tourists at national borders, by nationality 2015–2019 (04.2020) | |||
| Montenegro | Montenegro: Country specific: Arrivals of non-resident tourists in all types of accommodation establishments, by nationality 2014–2018 (11.2019) | |||
| Montserrat | Montserrat: Country specific: Arrivals of non-resident tourists at national borders, by country of residence 2014–2018 (12.2019) | |||
| Morocco | Morocco: Country specific: Arrivals of non-resident tourists at national borders, by nationality 2014–2018 (11.2019) | |||
| Mozambique | Mozambique: Country specific: Arrivals of non-resident visitors at national borders, by country of residence 2015–2019 (09.2020) | |||
| Myanmar | Myanmar: Country specific: Arrivals of non-resident tourists at national borders, by nationality 2015–2019 (07.2020) | |||
| Namibia | Namibia: Country specific: Arrivals of non-resident tourists at national borders, by nationality 2015–2019 (09.2020) | |||
| Nauru | Data unavailable | |||
| Nepal | Nepal: Country specific: Arrivals of non-resident tourists at national borders, by nationality 2015–2019 (07.2020) | |||
| Netherlands | Netherlands: Country specific: Arrivals of non-resident tourists in all types of accommodation establishments, by country of residence 2014–2018 (12.2019) | |||
| New Caledonia | New Caledonia: Country specific: Arrivals of non-resident tourists at national borders, by country of residence 2015–2019 (05.2020) | |||
| New Zealand | New Zealand: Country specific: Arrivals of non-resident visitors at national borders, by country of residence 2014–2018 (11.2019) | |||
| Nicaragua | Nicaragua: Country specific: Arrivals of non-resident tourists at national borders, by nationality 2015–2019 (06.2020) | |||
| Niger | Niger: Country specific: Arrivals of non-resident tourists at national borders, by nationality 2015–2019 (03.2020) | |||
| Nigeria | Nigeria: Country specific: Arrivals of non-resident visitors at national borders, by nationality 2012–2016 (01.2018)—data for 2018 not available | |||
| Niue | Niue: Country specific: Arrivals of non-resident tourists at national borders, by country of residence 2013–2017 (06.2018)—data for 2018 not available | |||
| North Macedonia | The Former Yugoslav Rep. of Macedonia: Country specific: Arrivals of non-resident tourists in all types of accommodation establishments, by nationality 2015–2019 (07.2020) | |||
| Northern Mariana Islands | Northern Mariana Islands: Country specific: Arrivals of non-resident visitors at national borders, by nationality 2014–2018 (11.2019) | |||
| Norway | Norway: Country specific: Arrivals of non-resident tourists in all types of accommodation establishments, by country of residence 2015–2019 (06.2020) | |||
| Oman | Oman: Country specific: Arrivals of non-resident visitors at national borders, by country of residence 2014–2018 (12.2019) | |||
| Pakistan | Pakistan: Country specific: Arrivals of non-resident tourists at national borders, by nationality 2009–2013 (04.2015)—data for 2018 not available | |||
| Palau | Palau: Country specific: Arrivals of non-resident tourists at national borders, by nationality 2014–2018 (10.2019) | |||
| Palestine, State of | Palestine, State of: Country specific: Arrivals of non-resident tourists in hotels and similar establishments, by nationality 2015–2019 (05.2020) | |||
| Panama | Panama: Country specific: Arrivals of non-resident visitors at national borders, by country of residence 2014–2018 (11.2019) | |||
| Papua New Guinea | Papua New Guinea: Country specific: Arrivals of non-resident visitors at national borders, by country of residence 2015–2019 (04.2020) | |||
| Paraguay | Paraguay: Country specific: Arrivals of non-resident tourists at national borders, by nationality 2014–2018 (09.2019) | |||
| Peru | Peru: Country specific: Arrivals of non-resident tourists at national borders, by country of residence 2014–2018 (11.2019) | |||
| Philippines | Philippines: Country specific: Arrivals of non-resident tourists at national borders, by country of residence 2015–2019 (09.2020) | Philippines: Country specific: Arrivals of non-resident tourists in all types of accommodation establishments, by country of residence 2015–2019 (09.2020) | ||
| Poland | Poland: Country specific: Arrivals of non-resident tourists in all types of accommodation establishments, by country of residence 2014–2018 (11.2019) | Statistics bureau https://stat.gov.pl/en/topics/culture-tourism-sport/tourism/tourists-in-tourist-accommodation-establishments-december-2018,3,15.html (accessed on 15 December 2020) | ||
| Portugal | Portugal: Country specific: Arrivals of non-resident tourists in all types of accommodation establishments, by country of residence 2015–2019 (07.2020) | |||
| Puerto Rico | Puerto Rico: Country specific: Arrivals of non-resident tourists at national borders, by country of residence 2014–2018 (11.2019) | |||
| Qatar | Qatar: Country specific: Arrivals of non-resident visitors at national borders, by nationality 2015–2019 (04.2020) | |||
| Reunion | Reunion: Country specific: Arrivals of non-resident tourists at national borders, by country of residence 2015–2019 (06.2020) | |||
| Romania | Romania: Country specific: Arrivals of non-resident tourists in all types of accommodation establishments, by country of residence 2015–2019 (07.2020) | |||
| Russian Federation | Russian Federation: Country specific: Arrivals of non-resident visitors at national borders, by nationality 2014–2018 (11.2019) | |||
| Rwanda | Arrivals of non-resident tourists at national borders, by country of residence 2015–2017. Yearbook of Tourism Statistics, Data 2014–2018, 2020 Edition. World Tourism Organization (UNWTO). DOI; 10.18111/9789284421442 | |||
| Saba | https://www.cbs.nl/en-gb/figures/detail/83191ENG?q=tourism (accessed on 15 December 2020) | |||
| Saint Kitts and Nevis | Saint Kitts and Nevis: Country specific: Arrivals of non-resident tourists at national borders, by country of residence 2014–2018 (12.2019) | |||
| Saint Lucia | Saint Lucia: Country specific: Arrivals of non-resident tourists at national borders, by country of residence 2014–2018 (11.2019) | |||
| Saint Vincent and the Grenadines | Saint Vincent and the Grenadines: Country specific: Arrivals of non-resident tourists at national borders, by country of residence 2014–2018 (12.2019) | |||
| Samoa | Samoa: Country specific: Arrivals of non-resident visitors at national borders, by country of residence 2015–2019 (03.2020) | |||
| San Marino | San Marino: Country specific: Arrivals of non-resident visitors at national borders, by nationality 2014–2018 (12.2019) | |||
| Sao Tome and Principe | Sao Tome and Principe: Country specific: Arrivals of non-resident tourists at national borders, by nationality 2014–2018 (01.2020) | |||
| Saudi Arabia | Saudi Arabia: Country specific: Arrivals of non-resident tourists at national borders, by nationality 2015–2019 (06.2020) | |||
| Senegal | Senegal: Country specific: Arrivals of non-resident tourists in hotels and similar establishments, by nationality 2013–2017 (12.2018)—data for 2018 not available | |||
| Serbia | Serbia: Country specific: Arrivals of non-resident tourists in all types of accommodation establishments, by nationality 2015–2019 (07.2020) | |||
| Seychelles | Seychelles: Country specific: Arrivals of non-resident tourists at national borders, by country of residence 2014–2018 (10.2019) | |||
| Sierra Leone | Sierra Leone: Country specific: Arrivals of non-resident tourists at national borders, by country of residence 2014–2018 (06.2019) | |||
| Singapore | Singapore: Country specific: Arrivals of non-resident visitors at national borders, by country of residence 2015–2019 (09.2020) | |||
| Sint Eustatius | https://www.cbs.nl/en-gb/figures/detail/83191ENG?q=tourism (accessed on 15 December 2020) | |||
| Sint Maarten (Dutch Part) | Saint Maarten: Country specific: Arrivals of non-resident tourists at national borders, by nationality 2014–2018 (09.2019) | |||
| Slovakia | Slovakia: Country specific: Arrivals of non-resident tourists in all types of accommodation establishments, by nationality 2015–2019 (07.2020) | |||
| Slovenia | Slovenia: Country specific: Arrivals of non-resident tourists in all types of accommodation establishments, by nationality 2015–2019 (07.2020) | |||
| Solomon Islands | Solomon Islands: Country specific: Arrivals of non-resident tourists at national borders, by country of residence 2014–2018 (07.2019) | |||
| South Africa | South Africa: Country specific: Arrivals of non-resident tourists at national borders, by country of residence 2015–2019 (06.2020) | |||
| South Sudan | Data unavailable | |||
| Spain | Spain: Country specific: Arrivals of non-resident tourists at national borders, by country of residence 2015–2019 (07.2020) | Spain: Country specific: Arrivals of non-resident tourists in all types of accommodation establishments, by country of residence 2015–2019 (07.2020) | ||
| Sri Lanka | Sri Lanka: Country specific: Arrivals of non-resident tourists at national borders, by country of residence 2015–2019 (07.2020) | |||
| Sudan | Sudan: Country specific: Arrivals of non-resident tourists at national borders, by nationality 2014–2018 (11.2019) | |||
| Suriname | Suriname: Country specific: Arrivals of non-resident tourists at national borders, by country of residence 2013–2017 (03.2018)—data for 2018 not available | |||
| Sweden | Sweden: Country specific: Arrivals of non-resident tourists in all types of accommodation establishments, by country of residence 2014–2018 (11.2019) | |||
| Switzerland | Switzerland: Country specific: Arrivals of non-resident tourists in all types of accommodation establishments, by country of residence 2015–2019 (06.2020) | |||
| Syrian Arab Republic | Syrian Arab Republic: Country specific: Arrivals of non-resident tourists in all types of accommodation establishments, by nationality 2009–2013 (04.2015) | |||
| Taiwan (Province of China) | Taiwan (Province of China): Country specific: Arrivals of non-resident tourists in all types of accommodation establishments, by country of residence 2015–2019 (07.2020) | |||
| Tajikistan | Tajikistan: Country specific: Arrivals of non-resident visitors at national borders, by country of residence 2014–2018 (10.2019) | |||
| Tanzania, United Republic of | Tanzania, United Republic of: Country specific: Arrivals of non-resident visitors at national borders, by country of residence 2014–2018 (12.2019) | |||
| Thailand | Thailand: Country specific: Arrivals of non-resident tourists at national borders, by country of residence 2014–2018 (12.2019) | |||
| Timor-Leste | null: Country specific: Arrivals of non-resident tourists at national borders, by country of residence 2015–2019 (04.2020) | |||
| Togo | Togo: Country specific: Arrivals of non-resident tourists in hotels and similar establishments, by country of residence 2015–2019 (04.2020) | |||
| Tonga | Tonga: Country specific: Arrivals of non-resident tourists at national borders, by country of residence 2013–2017 (06.2018)—data for 2018 not available | |||
| Trinidad and Tobago | Trinidad and Tobago: Country specific: Arrivals of non-resident tourists at national borders, by nationality 2015–2019 (07.2020) | |||
| Tunisia | Tunisia: Country specific: Arrivals of non-resident tourists at national borders, by nationality 2015–2019 (05.2020) | Tunisia: Country specific: Arrivals of non-resident tourists in hotels and similar establishments, by nationality 2015–2019 (05.2020) | ||
| Turkey | Turkey: Country specific: Arrivals of non-resident tourists at national borders, by nationality 2014–2018 (11.2019) | Turkey: Country specific: Arrivals of non-resident tourists in all types of accommodation establishments, by nationality 2014–2018 (11.2019) | ||
| Turkmenistan | Data unavailable | |||
| Turks and Caicos Islands | Turks and Caicos Islands: Country specific: Arrivals of non-resident tourists at national borders, by country of residence 2014–2018 (12.2019) | |||
| Tuvalu | Tuvalu: Country specific: Arrivals of non-resident tourists at national borders, by nationality 2013–2017 (01.2019) | |||
| Uganda | Uganda: Country specific: Arrivals of non-resident tourists at national borders, by country of residence 2013–2017 (11.2018)—data for 2018 not available | |||
| Ukraine | Ukraine: Country specific: Arrivals of non-resident tourists at national borders, by country of residence 2014–2018 (11.2019) | |||
| United Arab Emirates | United Arab Emirates: Country specific: Arrivals of non-resident tourists in hotels and similar establishments, by nationality 2015–2019 (07.2020) | |||
| United Kingdom | United Kingdom: Country specific: Arrivals of non-resident visitors at national borders, by country of residence 2015–2019 (09.2020) | |||
| United States | United States: Country specific: Arrivals of non-resident tourists at national borders, by country of residence 2015–2019 (04.2020) | |||
| United States Virgin Islands | United States Virgin Islands: Country specific: Arrivals of non-resident tourists in hotels and similar establishments, by nationality 2014–2018 (06.2019) | |||
| Uruguay | Uruguay: Country specific: Arrivals of non-resident visitors at national borders, by nationality 2014–2018 (07.2019) | |||
| Uzbekistan | Uzbekistan: Country specific: Arrivals of non-resident visitors at national borders, by country of residence 2014–2018 (10.2019) | |||
| Vanuatu | Vanuatu: Country specific: Arrivals of non-resident tourists at national borders, by country of residence 2015–2019 (04.2020) | |||
| Venezuela, Bolivarian Republic of | Venezuela: Country specific: Arrivals of non-resident tourists at national borders, by nationality 2013–2017 (10.2018)—data for 2018 not available | |||
| Viet Nam | Viet Nam: Country specific: Arrivals of non-resident visitors at national borders, by country of residence 2014–2018 (09.2019) | |||
| Yemen | Yemen: Country specific: Arrivals of non-resident tourists at national borders, by nationality 2011–2015 (12.2016)—data for 2018 not available | |||
| Zambia | Zambia: Country specific: Arrivals of non-resident tourists at national borders, by country of residence 2014–2018 (11.2019) | |||
| Zimbabwe | Zimbabwe: Country specific: Arrivals of non-resident visitors at national borders, by country of residence 2014–2018 (10.2019) | |||
Source: systematization by authors.
Table A2.
Top 10% countries ranked by centrality measures.
| Rank | Country | Closeness Centrality | Country | Eigenvector Centrality | Country | Authority | Country | Hub | Country | Prestige Rank | Country | Page Ranks | Country | Betweenness Centrality |
|---|---|---|---|---|---|---|---|---|---|---|---|---|---|---|
| 1 | United States | 0.97 | Canada | 1 | Canada | 0.127 | Germany | 0.098 | Belgium | 1 | China | 0.070 | United States | 0.0607 |
| 2 | Canada | 0.92 | Belgium | 1.000 | United Arab Emirates | 0.127 | France | 0.098 | Canada | 0.99994 | United States | 0.065 | Canada | 0.0578 |
| 3 | United Kingdom | 0.92 | Ecuador | 0.997 | Belgium | 0.127 | United States | 0.098 | Ecuador | 0.998 | Spain | 0.034 | Belgium | 0.0363 |
| 4 | France | 0.92 | United Arab Emirates | 0.996 | Ecuador | 0.126 | United Kingdom | 0.098 | United Arab Emirates | 0.997 | Italy | 0.033 | Australia | 0.0317 |
| 5 | Germany | 0.90 | Finland | 0.995 | United States | 0.126 | Italy | 0.097 | Finland | 0.996 | Hong Kong, China | 0.032 | New Zealand | 0.0224 |
| 6 | Italy | 0.89 | Australia | 0.993 | Finland | 0.126 | Switzerland | 0.097 | Australia | 0.995 | Turkey | 0.032 | Japan | 0.0212 |
| 7 | Switzerland | 0.87 | Colombia | 0.986 | New Zealand | 0.125 | Netherlands | 0.097 | Colombia | 0.989 | Saudi Arabia | 0.029 | China | 0.0196 |
| 8 | Netherlands | 0.86 | New Zealand | 0.985 | Uganda | 0.124 | Canada | 0.097 | New Zealand | 0.987 | United Kingdom | 0.028 | Italy | 0.0189 |
| 10 | Australia | 0.85 | China | 0.980 | Colombia | 0.123 | Spain | 0.096 | China | 0.984 | Mexico | 0.024 | Uganda | 0.0143 |
| 11 | Belgium | 0.84 | Mauritius | 0.977 | Mexico | 0.123 | Belgium | 0.095 | Mauritius | 0.981 | France | 0.022 | Mexico | 0.0134 |
| 12 | China | 0.82 | Uganda | 0.974 | Australia | 0.123 | Japan | 0.095 | Uganda | 0.976 | Greece | 0.022 | South Africa | 0.0116 |
| 13 | Sweden | 0.82 | Costa Rica | 0.966 | China | 0.123 | Austria | 0.095 | Costa Rica | 0.971 | United Arab Emirates | 0.021 | Korea, Republic of | 0.0107 |
| 14 | Spain | 0.82 | South Africa | 0.966 | South Africa | 0.122 | Australia | 0.094 | Seychelles | 0.971 | Malaysia | 0.019 | India | 0.0102 |
| 15 | Austria | 0.81 | Indonesia | 0.963 | Indonesia | 0.122 | Denmark | 0.094 | South Africa | 0.970 | Germany | 0.018 | Turkey | 0.00877 |
| 16 | Denmark | 0.80 | Seychelles | 0.962 | Malaysia | 0.121 | China | 0.094 | Indonesia | 0.969 | Canada | 0.018 | United Arab Emirates | 0.00810 |
| 17 | Norway | 0.78 | Korea, Republic of | 0.961 | Seychelles | 0.121 | Norway | 0.093 | Korea, Republic of | 0.966 | South Africa | 0.017 | Israel | 0.00686 |
| 18 | Russian Federation | 0.77 | Mexico | 0.959 | Korea, Republic of | 0.121 | Russian Federation | 0.092 | Maldives | 0.964 | Macao, China | 0.016 | Ukraine | 0.00600 |
| 19 | Finland | 0.76 | Maldives | 0.957 | Hong Kong, China | 0.121 | Portugal | 0.091 | Hong Kong, China | 0.963 | Bulgaria | 0.016 | Romania | 0.00590 |
| 20 | Portugal | 0.76 | Japan | 0.957 | Japan | 0.121 | Finland | 0.091 | Japan | 0.963 | Bahrain | 0.015 | Malaysia | 0.00571 |
| 21 | New Zealand | 0.75 | Hong Kong, China | 0.957 | Costa Rica | 0.120 | Greece | 0.091 | Ukraine | 0.961 | Japan | 0.015 | Mauritius | 0.00568 |
| 22 | Brazil | 0.75 | Ukraine | 0.953 | Sri Lanka | 0.120 | Brazil | 0.090 | Mexico | 0.961 | Kuwait | 0.013 | United Kingdom | 0.00555 |
| 23 | Korea, Republic of | 0.75 | Malaysia | 0.952 | Ukraine | 0.120 | Ireland | 0.090 | Panama | 0.958 | Austria | 0.012 | Hong Kong, China | 0.00531 |
| 24 | Ireland | 0.74 | Panama | 0.951 | Azerbaijan | 0.120 | Poland | 0.090 | Malaysia | 0.956 | Singapore | 0.012 | Indonesia | 0.00528 |
Note: Calculations are based on the weighted network. The data for all countries are available in Supplementary Files S1 and S2. Source: authors.
Table A3.
Network components.
| Group | Countries |
|---|---|
| Center | United States, Canada, Belgium, Australia, China, Japan, New Zealand, Finland, Mexico, Italy, Republic of Korea, South Africa, United Arab Emirates, India, Turkey, Ecuador, Colombia, Malaysia, Indonesia, Ukraine, Uganda, Romania, Israel, Mauritius, Hong Kong, Costa Rica, Kuwait, Sri Lanka, Panama, Egypt, Lebanon, Pakistan, Morocco, Jordan, Azerbaijan, Georgia, Saudi Arabia, United Republic of Tanzania, Mali, Kazakhstan, Bahamas, Barbados, Seychelles, Trinidad and Tobago, Mongolia, Maldives, United Kingdom, Bulgaria, Latvia, Chile, Uzbekistan, Paraguay, Albania, Bahrain, Macao, Suriname, Angola, Democratic Republic of the Congo, Germany, Nigeria, Antigua and Barbuda, Brazil, France, Congo, Sierra Leone, Nicaragua, Switzerland, Belarus, Armenia, Norway, Russian Federation, Dominica, Austria, Islamic Republic of Iran, Sweden, Madagascar, Guinea, Spain, El Salvador, Benin, Cayman Islands, Grenada, Bolivarian Republic of Venezuela, Togo, Argentina, Philippines, Netherlands, Denmark, Poland, Cambodia, Czech Republic, Bhutan, Portugal, Slovakia, Guyana, Peru, Honduras, Jamaica, Luxembourg, Oman, Croatia, Greece, Slovenia, Singapore, Thailand, Estonia, Ireland, Serbia, Dominican Republic, Bosnia and Herzegovina, Tajikistan, Cyprus, Taiwan Province of China, Tunisia, Hungary, Lithuania, Syrian Arab Republic, San Marino, Malta, Iceland, Zimbabwe, Republic of Moldova, Montenegro, Uruguay, Viet Nam, North Macedonia, Ethiopia, Cuba, Algeria, Nepal, Kyrgyzstan, Bangladesh, Yemen, Plurinational State of Bolivia, Saint Lucia, Myanmar, Eswatini, Lao People’s Democratic Republic, Zambia, Qatar, Namibia, Senegal, Burkina Faso, Guatemala, Kenya, Fiji, Botswana, Haiti, Cameroon, Belize, Monaco, Gambia, Ghana, Mozambique, Iraq, Malawi, Niger, Sudan, Papua New Guinea, Cabo Verde, Palau, Afghanistan, Cote d’Ivoire, Aruba, State of Palestine, Mauritania, Liberia, Andorra, Rwanda, United States Virgin Islands, Gabon, French Polynesia, Turkmenistan, Chad, Comoros, Samoa, Curacao, Saint Vincent and the Grenadines, Equatorial Guinea, Vanuatu, Anguilla, Federated States of Micronesia, Turks and Caicos Islands, Montserrat, Sint Maarten (Dutch Part), Greenland, Faeroe Islands |
| Periphery | Puerto Rico, Liechtenstein, Brunei Darussalam, Lesotho, Central African Republic, Libya, American Samoa, Democratic People’s Republic of Korea, Somalia, Burundi, Tonga, Guinea-Bissau, Eritrea, Saint Kitts and Nevis, Solomon Islands, Guadeloupe, Djibouti, Bermuda, Martinique, Cook Islands, Kiribati, Timor-Leste, Sao Tome and Principe, Marshall Islands, New Caledonia, Holy See, British Virgin Islands, South Sudan, Guam, Nauru, Tuvalu, Reunion, French Guiana, Northern Mariana Islands, Gibraltar, Saint Helena, Niue, Falkland Islands (Malvinas), Cocos (Keeling) Islands, Norfolk Island, Wallis and Futuna Islands, British Indian Ocean Territory, Isle of Man, Bonaire, Western Sahara, Pitcairn, Saint Pierre and Miquelon, Tokelau, Christmas Island, Channel Islands, Saba, Wake Island, Johnston Island, Midway Islands, Sint Eustatius |
| Largest strongly connected component | United States, Canada, Belgium, Australia, China, Japan, New Zealand, Finland, Mexico, Italy, the Republic of Korea, South Africa, United Arab Emirates, India, Turkey, Ecuador, Colombia, Malaysia, Indonesia, Ukraine, Uganda, Romania, Israel, Mauritius, Hong Kong, Costa Rica, Kuwait, Sri Lanka, Panama, Egypt, Lebanon, Pakistan, Morocco, Jordan, Azerbaijan, Georgia, Saudi Arabia, United Republic of Tanzania, Mali, Kazakhstan, Bahamas, Barbados, Seychelles, Trinidad and Tobago, Mongolia, Maldives, United Kingdom, Bulgaria, Latvia, Chile, Uzbekistan, Paraguay, Albania, Bahrain, Macao, Suriname, Angola, Democratic Republic of the Congo, Germany, Nigeria, Antigua and Barbuda, Brazil, France, Congo, Sierra Leone, Nicaragua, Switzerland, Belarus, Armenia, Norway, Russian Federation, Dominica, Austria, Islamic Republic of Iran, Sweden, Madagascar, Guinea, Spain, El Salvador, Benin, Cayman Islands, Grenada, Bolivarian Republic of Venezuela, Togo, Argentina, Philippines, Netherlands, Denmark, Poland, Cambodia, Czech Republic, Bhutan, Portugal, Slovakia, Guyana, Peru, Honduras, Jamaica, Luxembourg, Oman, Croatia, Greece, Slovenia, Singapore, Thailand, Puerto Rico, Estonia, Ireland, Serbia, Dominican Republic, Bosnia and Herzegovina, Tajikistan, Cyprus, Taiwan (Province of China), Tunisia, Hungary, Lithuania, Syrian Arab Republic, San Marino, Malta, Iceland, Zimbabwe, Republic of Moldova, Montenegro, Uruguay, Viet Nam, North Macedonia, Ethiopia, Cuba, Liechtenstein, Algeria, Nepal, Kyrgyzstan, Brunei Darussalam, Bangladesh, Yemen, Plurinational State of Bolivia, Saint Lucia, Myanmar, Eswatini, Lao People’s Democratic Republic, Zambia, Qatar, Namibia, Senegal, Burkina Faso, Guatemala, Lesotho, Fiji, Botswana, Haiti, Cameroon, Belize, Monaco, Gambia, Central African Republic, Mozambique, Malawi, Niger, Papua New Guinea, Cabo Verde, Palau, Aruba, State of Palestine, Andorra, United States Virgin Islands, French Polynesia, American Samoa, Comoros, Samoa, Curacao, Saint Vincent and the Grenadines, Tonga, Saint Kitts and Nevis, Vanuatu, Solomon Islands, Guadeloupe, Bermuda, Martinique, Cook Islands, Kiribati, Timor-Leste, Anguilla, Federated States of Micronesia, Marshall Islands, New Caledonia, Turks and Caicos Islands, British Virgin Islands, Guam, Reunion, French Guiana, Montserrat, Sint Maarten (Dutch part), Northern Mariana Islands, Niue |
| Other 47 strongly connected components | Afghanistan, Cote d’Ivoire, Eritrea, Ghana, Greenland, Holy See, Iraq, Kenya, Democratic People’s Republic of Korea, Liberia, Libya, Rwanda, Sudan, Turkmenistan, Mauritania, Burundi, Chad, Djibouti, Equatorial Guinea, Gabon, Guinea-Bissau, Sao Tome and Principe, Somalia, Bonaire, Falkland Islands (Malvinas), Gibraltar, Tuvalu, South Sudan, Channel Islands, Faeroe Islands, Isle of Man, Nauru, Pitcairn, Saint Helena, Tokelau, Wallis and Futuna Islands, Sint Eustatius, Cocos (Keeling) Islands, British Indian Ocean Territory, Christmas Island, Norfolk Island, Saint Pierre and Miquelon, Western Sahara, Saba, Wake Island, Johnston Island, Midway Islands |
Source: authors.
Figure A1.
Simulation of arbitrary link removal. (a) Network after 10% randomly removed links of all possible links (or 34% of existing links), (b) network after 20% randomly removed links of all possible links (or 68% of existing links), and (c) network after 25% removed links of all possible links (or 83% of existing links). Source: authors.


Figure A2.
Simulation of removal of top nodes ranked by betweenness centrality. (a) Top 10% nodes removed, (b) top 20% nodes removed; (c) top 30% nodes removed, (d) top 40% nodes removed, (e) top 50% nodes removed, and (f) top 60% nodes removed. Source: authors.
Figure A2.
Simulation of removal of top nodes ranked by betweenness centrality. (a) Top 10% nodes removed, (b) top 20% nodes removed; (c) top 30% nodes removed, (d) top 40% nodes removed, (e) top 50% nodes removed, and (f) top 60% nodes removed. Source: authors.


References
- Schweitzer, F.; Fagiolo, G.; Sornette, D.; Vega-Redondo, F.; White, D.R. Economic Networks: What Do We Know and What Do We Need to Know? Adv. Complex Syst. 2009, 12, 407–422. [Google Scholar] [CrossRef] [Green Version]
- Schweitzer, F.; Fagiolo, G.; Sornette, D.; Vega-Redondo, F.; Vespignani, A.; White, D.R. Economic Networks: The New Challenges. Science 2009, 325, 422–425. [Google Scholar] [CrossRef]
- Fagiolo, G.; Reyes, J.; Schiavo, S. World-trade web: Topological properties, dynamics, and evolution. Phys. Rev. E 2009, 79, 036115. [Google Scholar] [CrossRef] [Green Version]
- Serrano, M.; Ángeles; Boguñá, M. Topology of the world trade web. Phys. Rev. E 2003, 68, 015101. [Google Scholar] [CrossRef] [PubMed] [Green Version]
- Deguchi, T.; Takahashi, K.; Takayasu, H.; Takayasu, M. Hubs and Authorities in the World Trade Network Using a Weighted HITS Algorithm. PLoS ONE 2014, 9, e100338. [Google Scholar] [CrossRef]
- Miguéns, J.; Mendes, J. Travel and tourism: Into a complex network. Phys. A Stat. Mech. Appl. 2008, 387, 2963–2971. [Google Scholar] [CrossRef] [Green Version]
- Lozano, S.; Gutiérrez, E. A complex network analysis of global tourism flows. Int. J. Tour. Res. 2018, 20, 588–604. [Google Scholar] [CrossRef]
- Seok, H.; Barnett, G.A.; Nam, Y. A social network analysis of international tourism flow. Qual. Quant. 2020, 1–21. [Google Scholar] [CrossRef]
- United Nations. International Recommendations for Tourism Statistics 2008; United Nations Publications: New York, NY, USA, 2010; Available online: https://unstats.un.org/unsd/publication/Seriesm/SeriesM_83rev1e.pdf (accessed on 15 October 2020.).
- Jackson, M.O. Social and Economic Networks; Princeton University Press: Princeton, NJ, USA, 2010. [Google Scholar]
- Kyrylov, Y.; Hranovska, V.; Boiko, V.; Kwilinski, A.; Boiko, L. International Tourism Development in the Context of Increasing Globalization Risks: On the Example of Ukraine’s Integration into the Global Tourism Industry. J. Risk Financ. Manag. 2020, 13, 303. [Google Scholar] [CrossRef]
- Rosselló, J.; Santana-Gallego, M.; Awan, W. Infectious disease risk and international tourism demand. Health Policy Plan. 2017, 32, 538–548. [Google Scholar] [CrossRef] [Green Version]
- Cró, S.; Martins, A.M. Structural breaks in international tourism demand: Are they caused by crises or disasters? Tour. Manag. 2017, 63, 3–9. [Google Scholar] [CrossRef]
- Nguyen, C.P.; Schinckus, C.; Su, T.D. Economic policy uncertainty and demand for international tourism: An empirical study. Tour. Econ. 2020, 26, 1415–1430. [Google Scholar] [CrossRef]
- Kocka, F.; Nørfeltb, A.; Josiassenabe, A.; Assaf, A.G.; Tsionas, M.G. Understanding the COVID-19 tourist psyche: The Evolutionary Tourism Paradigm. Ann. Tour. Res. 2020, 85, 103053. [Google Scholar] [CrossRef] [PubMed]
- Antolini, F.; Grassini, L. Methodological problems in the economic measurement of tourism: The need for new sources of information. Qual. Quant. 2020, 54, 1769–1780. [Google Scholar] [CrossRef]
- Simonetti, B.; Antolini, F.; Castellano, R.; Gallo, M.; González-Rodríguez, M.R.; Giusti, A.; Sarnacchiaro, P. Special issue: Qualitative and quantitative methods in tourism research. Qual. Quant. 2020, 54, 1385–1386. [Google Scholar] [CrossRef]
- Baggio, R.; Scott, N.; Cooper, C. Network science. Ann. Tour. Res. 2010, 37, 802–827. [Google Scholar] [CrossRef]
- Casanueva, C.; Gallego, Á.; García-Sánchez, M.-R. Social network analysis in tourism. Curr. Issues Tour. 2016, 19, 1190–1209. [Google Scholar] [CrossRef]
- Cehan, A.; Eva, M.; Iațu, C.; Costa, C. Inquiring Structure and Forms of Collaboration in Tourism through Social Network Analysis. Sustainability 2020, 12, 8161. [Google Scholar] [CrossRef]
- Nguyen, T.Q.T.; Young, T.; Johnson, P.; Wearing, S. Conceptualising networks in sustainable tourism development. Tour. Manag. Perspect. 2019, 32, 100575. [Google Scholar] [CrossRef]
- Martini, U.; Buffa, F. Local networks, stakeholder dynamics and sustainability in tourism. Opportunities and limits in the light of stakeholder theory and SNA. Sinergie Ital. J. Manag. 2015, 33, 113–130. [Google Scholar] [CrossRef] [Green Version]
- Lee, S.-H.; Choi, J.-Y.; Yoo, S.-H.; Oh, Y.-G. Evaluating spatial centrality for integrated tourism management in rural areas using GIS and network analysis. Tour. Manag. 2013, 34, 14–24. [Google Scholar] [CrossRef]
- Shih, H.-Y. Network characteristics of drive tourism destinations: An application of network analysis in tourism. Tour. Manag. 2006, 27, 1029–1039. [Google Scholar] [CrossRef]
- Hwang, Y.-H.; Gretzel, U.; Fesenmaier, D.R. Multicity trip patterns. Ann. Tour. Res. 2006, 33, 1057–1078. [Google Scholar] [CrossRef]
- Leung, X.Y.; Wang, F.; Wu, B.; Bai, B.; Stahura, K.A.; Xie, Z. A Social Network Analysis of Overseas Tourist Movement Patterns in Beijing: The Impact of the Olympic Games. Int. J. Tour. Res. 2012, 14, 469–484. [Google Scholar] [CrossRef]
- González-Díaz, B.; Gómez, M.; Molina, A. Configuration of the hotel and non-hotel accommodations: An empirical approach using network analysis. Int. J. Hosp. Manag. 2015, 48, 39–51. [Google Scholar] [CrossRef]
- Guo, Y.; Zhang, J.; Yang, Y.; Zhang, H. Modeling the Fluctuation Patterns of Monthly Inbound Tourist Flows to China: A Complex Network Approach. Asia Pac. J. Tour. Res. 2014, 20, 942–953. [Google Scholar] [CrossRef]
- Kádár, B.; Gede, M. Tourism flows in large-scale destination systems. Ann. Tour. Res. 2021, 87, 103113. [Google Scholar] [CrossRef]
- Sainaghi, R.; Baggio, R. Complexity traits and dynamics of tourism destinations. Tour. Manag. 2017, 63, 368–382. [Google Scholar] [CrossRef]
- Chung, H.C.; Chung, N.; Nam, Y. A Social Network Analysis of Tourist Movement Patterns in Blogs: Korean Backpackers in Europe. Sustainability 2017, 9, 2251. [Google Scholar] [CrossRef] [Green Version]
- Baggio, R. The web graph of a tourism system. Phys. A Stat. Mech. Appl. 2007, 379, 727–734. [Google Scholar] [CrossRef] [Green Version]
- Blazquez, L.; González-Díaz, B. International automotive production networks: How the web comes together. J. Econ. Interact. Co-ord. 2015, 11, 119–150. [Google Scholar] [CrossRef] [Green Version]
- Chinazzi, M.; Fagiolo, G.; Reyes, J.A.; Schiavo, S. Post-mortem examination of the international financial network. J. Econ. Dyn. Control. 2013, 37, 1692–1713. [Google Scholar] [CrossRef] [Green Version]
- Schiavo, S.; Reyes, J.; Fagiolo, G. International trade and financial integration: A weighted network analysis. Quant. Financ. 2010, 10, 389–399. [Google Scholar] [CrossRef]
- Korotayev, A.; Zinkina, J. What does global migration network say about recent changes in the world system structure? J. Multicult. Educ. 2014, 8, 146–161. [Google Scholar] [CrossRef]
- Fagiolo, G.; Mastrorillo, M. International migration network: Topology and modeling. Phys. Rev. E 2013, 88, 012812. [Google Scholar] [CrossRef]
- Barnett, G.A.; Lee, M.; Jiang, K.; Park, H.W. The flow of international students from a macro perspective: A network analysis. Comp. A J. Comp. Int. Educ. 2016, 46, 533–559. [Google Scholar] [CrossRef]
- Barabási, A.-L.; Albert, R.; Jeong, H. Scale-free characteristics of random networks: The topology of the world-wide web. Phys. A Stat. Mech. Appl. 2000, 281, 69–77. [Google Scholar] [CrossRef]
- Wu, J.-J.; Gao, Z.-Y.; Sun, H.-J. Optimal traffic networks topology: A complex networks perspective. Phys. A Stat. Mech. Appl. 2008, 387, 1025–1032. [Google Scholar] [CrossRef]
- Wasserman, S.; Katherine, F. Social Network Analysis: Methods and Applications; Cambridge University Press: Cambridge, UK, 1994. [Google Scholar]
- Gössling, S.; Scott, D.; Hall, C.M. Pandemics, tourism and global change: A rapid assessment of COVID-19. J. Sustain. Tour. 2020, 29, 1–20. [Google Scholar] [CrossRef]
- International Tourism, Number of Arrivals, The World Bank. Available online: https://data.worldbank.org/indicator/ST.INT.ARVL (accessed on 20 October 2020.).
- United Nations Statistical Division. International Recommendations for Tourism Statistics 2008 Compilation Guide; United Nations Publications: New York, NY, USA, 2016. [Google Scholar]
- World Tourism Organization. Yearbook of Tourism Statistics, Data 2014—2018, 2020 ed.; World Tourism Organization (UNWTO): Madrid, Spain, 2020. [Google Scholar]
- Countries with Their (ISO 3166-1) Alpha-2 Code, Alpha-3 Code, UN M49, Average Latitude and Longitude Coordinates. Available online: https://gist.github.com/tadast/8827699 (accessed on 15 January 2021).
- Van Steen, M. Graph Theory and Complex Networks. An Introduction. Published by Maarten van Steen. 2010. Available online: https://www.distributed-systems.net/index.php/books/gtcn/gtcn/ (accessed on 15 September 2020).
- Brandes, U. A faster algorithm for betweenness centrality*. J. Math. Sociol. 2001, 25, 163–177. [Google Scholar] [CrossRef]
- Watts, D.J.; Strogatz, S.H. Collective dynamics of ‘small-world’networks. Nature 1998, 393, 440–442. [Google Scholar] [CrossRef]
- Barrat, A.; Barthelemy, M.; Pastor-Satorras, R.; Vespignani, A. The architecture of complex weighted networks. Proc. Natl. Acad. Sci. USA 2004, 101, 3747–3752. [Google Scholar] [CrossRef] [Green Version]
- Newman, M.E.J. The Structure and Function of Complex Networks. SIAM Rev. 2003, 45, 167–256. [Google Scholar] [CrossRef] [Green Version]
- Tarjan, R. Depth-First Search and Linear Graph Algorithms. SIAM J. Comput. 1972, 1, 146–160. [Google Scholar] [CrossRef]
- Takes, F.W.; Kosters, W.A. Determining the diameter of small world networks. In Proceedings of the 20th ACM international conference on Information and knowledge management—CIKM ’11, Glasgow, UK, 24–28 October 2011; pp. 1191–1196. [Google Scholar]
- Blondel, V.D.; Guillaume, J.-L.; Lambiotte, R.; Lefebvre, E. Fast unfolding of communities in large networks. J. Stat. Mech. Theory Exp. 2008, 2008, P10008. [Google Scholar] [CrossRef] [Green Version]
- Takes, F.W.; Kosters, W.A. Computing the Eccentricity Distribution of Large Graphs. Algorithms 2013, 6, 100–118. [Google Scholar] [CrossRef] [Green Version]
- Lambiotte, R.; Delvenne, J.-C.; Barahona, M. Laplacian dynamics and multiscale modular structure in networks. arXiv 2008, arXiv:0812.1770. [Google Scholar]
- Williams, G. Linear Algebra with Applications; Jones & Bartlett Learning: Burlington, MA, USA, 2017. [Google Scholar]
- Hwang, W.; Cho, Y.; Zhang, A.; Ramanathan, M. Bridging centrality: Identifying bridging nodes in scale-free networks. In Proceedings of the 12th ACM SIGKDD International Conference on Knowledge Discovery and Data Mining, Philadelphia, PA, USA, 20–23 August 2006; pp. 20–23. [Google Scholar]
- Kleinberg, J.M. Authoritative sources in a hyperlinked environment. J. ACM 1999, 46, 604–632. [Google Scholar] [CrossRef]
- Brin, S.; Page, L. The anatomy of a large-scale hypertextual Web search engine. Comput. Netw. ISDN Syst. 1998, 30, 107–117. [Google Scholar] [CrossRef]
- Bastian, M.; Sebastien, H.; Mathieu, J. Gephi: An open source software for exploring and manipulating networks. In Proceedings of the International AAAI Conference on Web and Social Media, San Jose, CA, USA, 17–20 May 2009. [Google Scholar]
- Barnett, G.A. A Network Model of International/Intercultural Migration. In Proceedings of the Keynote Speech to BIGSSS-CSS Migration, Cagliari, Sardinia, Italy, 12 June 2019. [Google Scholar]
- Barabási, A.-L. The Scale-Free Property. In Network Science. Available online: http://networksciencebook.com/ (accessed on 15 January 2021).
- Broido, A.D.; Clauset, A. Scale-free networks are rare. Nat. Commun. 2019, 10, 1–10. [Google Scholar] [CrossRef] [PubMed]
- May, R.M.; Levin, S.A.; Sugihara, G. Ecology for bankers. Nat. Cell Biol. 2008, 451, 893–894. [Google Scholar] [CrossRef] [PubMed] [Green Version]
Figure 1.
Interactive world tourism web. Note: The map displays only the arcs with weight > 1000. Source: authors. Available online: https://0-www-mdpi-com.brum.beds.ac.uk/2076-3417/11/5/2253/s1 (accessed on 7 March 2021).
Figure 1.
Interactive world tourism web. Note: The map displays only the arcs with weight > 1000. Source: authors. Available online: https://0-www-mdpi-com.brum.beds.ac.uk/2076-3417/11/5/2253/s1 (accessed on 7 March 2021).

Figure 2.
In-degrees. Source: authors.

Figure 3.
Out-degrees. Source: authors.

Figure 4.
Weighted in-degrees. Source: authors.

Figure 5.
Weighted out-degrees. Source: authors.

Figure 6.
Communities in the world tourism network. Source: authors.

Figure 7.
Degree distributions. (a) In-degree distribution, (b) out-degree distribution; (c) degree distribution, (d) weighted in-degree distribution, (e) weighted out-degree distribution, and (f) weighted degree distribution. Source: authors.
Figure 7.
Degree distributions. (a) In-degree distribution, (b) out-degree distribution; (c) degree distribution, (d) weighted in-degree distribution, (e) weighted out-degree distribution, and (f) weighted degree distribution. Source: authors.

Table 1.
Tourism network parameters.
| Parameter | Not Weighted | Weighted |
|---|---|---|
| Average degree | 70.339 | 70.339 |
| Average weighted degree | / | 5,984,652.455 |
| Average path length | 1.6579 | 1.6579 |
| Diameter | 4 | 4 |
| Radius | 2 | 2 |
| Density | 0.292 | 0.292 |
| Average eccentricity | 2.227 | 2.227 |
| Average clustering coefficient | 0.8279 | 0.8279 |
| Number of triangles | 423,624 | 423,624 |
| Number of paths (length 2) | 1,838,537 | 1,838,537 |
| Clustering coefficient (triangle method) | 0.6912 | 0.6912 |
| Number of strongly connected components | 48; 1 (195); 47 (1) | 48; 1 (195); 47 (1) |
| Number of weakly connected components | 1 | 1 |
| Diameter of weakly connected components | 3 | 3 |
| Radius of weakly connected components | 2 | 2 |
| Eccentricity of largest weakly connected components | 2 (187), 3 (55) | 2 (197), 3 (55) |
| Number of nodes in periphery | 55 | 55 |
| Number of nodes in center | 187 | 187 |
| Number of clusters (Leiden CPM; random seed) | 6 (quality:0.978) | 2 (quality:0.999) |
| Modularity (random seed) | 0.09 | 0.52 |
| Number of communities | 4 | 6 |
| Number of nodes in communities | 75, 71, 83, 13 | 38, 54, 16, 27, 67, 40 |
Source: authors’ calculation using Gephi and R. Source: authors.
Table 2.
Communities in the world tourism network.
| Community | Countries |
|---|---|
| 1 | South Africa, Uganda, United Republic of Tanzania, Angola, Democratic Republic of the Congo, Nigeria, Congo, Sierra Leone, Benin, Togo, Zimbabwe, Eswatini, Zambia, Namibia, Burkina Faso, Lesotho, Kenya, Botswana, Cameroon, Ghana, Central African Republic, Mozambique, Malawi, Niger, Cote d’Ivoire, Liberia, Rwanda, Gabon, Chad, Burundi, Equatorial Guinea, Sao Tome and Principe, South Sudan, Saint Helena, Saba, Wake Island, Johnston Island, and Midway Islands |
| 2 | United States, Canada, Mexico, Ecuador, Colombia, Costa Rica, Panama, Bahamas, Barbados, Trinidad and Tobago, Chile, Paraguay, Antigua and Barbuda, Brazil, Nicaragua, Dominica, El Salvador, Cayman Islands, Grenada, Bolivarian Republic of Venezuela, Argentina, Guyana, Peru, Honduras, Jamaica, Puerto Rico, Dominican Republic, Uruguay, Cuba, Plurinational State of Bolivia, Saint Lucia, Guatemala, Haiti, Belize, Aruba, United States Virgin Islands, Saint Vincent and the Grenadines, Saint Kitts and Nevis, Bermuda, Turks and Caicos Islands, Holy See, British Virgin Islands, Montserrat, Gibraltar, Falkland Islands (Malvinas), Greenland, Cocos (Keeling) Islands, Faeroe Islands, British Indian Ocean Territory, Bonaire, Western Sahara, Saint Pierre and Miquelon, Christmas Island, Australia, Sint Eustatius |
| 3 | China, Japan, Republic of Korea, Hong Kong, Mongolia, Macao, Philippines, Taiwan Province of China, Viet Nam, Myanmar, Palau, Democratic People’s Republic of Korea, Federated States of Micronesia, Marshall Islands, Guam, Northern Mariana Islands |
| 4 | Australia, New Zealand, Malaysia, Indonesia, Cambodia, Singapore, Thailand, Brunei Darussalam, Lao People’s Democratic Republic, Fiji, Papua New Guinea, Samoa, Tonga, Solomon Islands, Vanuatu, Cook Islands, Kiribati, Timor-Leste, New Caledonia, Nauru, Tuvalu, Niue, Norfolk Island, Wallis and Futuna Islands, Isle of Man, Tokelau, Channel Islands |
| 5 | Belgium, Finland, Italy, Ukraine, Romania, Israel, Mauritius, Morocco, Mali, Seychelles, Maldives, United Kingdom, Bulgaria, Latvia, Albania, Suriname, Germany, France, Switzerland, Belarus, Norway, Russian Federation, Austria, Sweden, Madagascar, Guinea, Spain, Netherlands, Denmark, Poland, Czech Republic, Portugal, Slovakia, Luxembourg, Croatia, Greece, Slovenia, Estonia, Ireland, Serbia, Bosnia and Herzegovina, Cyprus, Hungary, Lithuania, San Marino, Malta, Iceland, Republic of Moldova, Montenegro, North Macedonia, Liechtenstein, Senegal, Monaco, Gambia, Cabo Verde, Mauritania, Andorra, French Polynesia, Curacao, Guinea-Bissau, Guadeloupe, Martinique, Anguilla, Reunion, French Guiana, Sint Maarten (Dutch part), Pitcairn |
| 6 | United Arab Emirates, India, Turkey, Kuwait, Sri Lanka, Egypt, Lebanon, Pakistan, Jordan, Azerbaijan, Georgia, Saudi Arabia, Kazakhstan, Uzbekistan, Bahrain, Armenia, Iran, Islamic Republic of Iran, Bhutan, Oman, Tajikistan, Tunisia, Syrian Arab Republic, Ethiopia, Algeria, Nepal, Kyrgyzstan, Bangladesh, Yemen, Qatar, Iraq, Sudan, Afghanistan, Libya, State of Palestine, American Samoa, Turkmenistan, Comoros, Somalia, Eritrea, Djibouti |
Source: authors.
Publisher’s Note: MDPI stays neutral with regard to jurisdictional claims in published maps and institutional affiliations. |
© 2021 by the authors. Licensee MDPI, Basel, Switzerland. This article is an open access article distributed under the terms and conditions of the Creative Commons Attribution (CC BY) license (http://creativecommons.org/licenses/by/4.0/).
Share and Cite
MDPI and ACS Style
Kostelić, K.; Turk, M. Topology of the World Tourism Web. Appl. Sci. 2021, 11, 2253. https://0-doi-org.brum.beds.ac.uk/10.3390/app11052253
AMA Style
Kostelić K, Turk M. Topology of the World Tourism Web. Applied Sciences. 2021; 11(5):2253. https://0-doi-org.brum.beds.ac.uk/10.3390/app11052253
Chicago/Turabian StyleKostelić, Katarina, and Marko Turk. 2021. "Topology of the World Tourism Web" Applied Sciences 11, no. 5: 2253. https://0-doi-org.brum.beds.ac.uk/10.3390/app11052253
Note that from the first issue of 2016, this journal uses article numbers instead of page numbers. See further details here.