
Reliability Analysis of Accelerated Destructive Degradation Testing Data for Bi-Functional DC Motor Systems


1
Department of Industrial Engineering, Hanyang University, Seoul 04763, Korea
2
Lamp Test Development Cell, Hyunda Mobis Co. Ltd., Yongin-si 16891, Korea
*
Author to whom correspondence should be addressed.
Appl. Sci. 2021, 11(6), 2537; https://0-doi-org.brum.beds.ac.uk/10.3390/app11062537
Submission received: 15 February 2021
/
Revised: 28 February 2021
/
Accepted: 5 March 2021
/
Published: 12 March 2021
(This article belongs to the Special Issue Reliability Modelling and Analysis for Complex Systems)
Abstract
:Featured Application
Automobile, DC motor.
Abstract
An accelerated degradation test (ADT) has become a popular method to accelerate degradation mechanisms by stressing products beyond their normal use conditions. The components of an automobile are degraded over time or cycle due to their constant exposure to friction or wear. Sometimes, the performance degradation can be measured only by destructive inspection such as operating torques of return-springs in a bi-functional DC motor system. Plastic deformation of the return-spring causes the degradation of actuating forces for shield movement, resulting in deterioration of the shield moving speed in a headlight system. We suggest a step-by-step procedure for a reliability analysis for a bi-functional DC motor in a headlight system, based mainly on accelerated destructive degradation test (ADDT) data. We also propose nonlinear degradation models to describe the ADDT data of the return-springs. Exposure effects of high temperatures on the return-springs are quantitatively modeled through the ADDT models. We compare the estimation results from both the closed-form expression and Monte Carlo simulation to predict the failure–time distribution at normal use conditions, showing that the lifetime estimation results from the closed-form formulation are more conservative.
1. Introduction
Due to increasing global competition, automobile manufacturers are requested to evaluate the reliability of newly designed automobiles as quickly as possible using limited resources before releasing them. The most common approach for this purpose is to use an accelerated life test (ALT) which facilitates failure mechanisms by stressing the products beyond their normal use conditions. Analogous to the ALT, an accelerated degradation test (ADT) has recently replaced ALT when failure data are supplemented by degradation data as measurements of product deterioration (e.g., the luminosity of a display device, storage capacity of a rechargeable battery) available at one or more time-points during the reliability test. Degradation mechanisms for the products (e.g., fatigue, crack growth, electro-migration, oxidation) can be accelerated by increasing voltage, temperature, humidity or other external factors. In some applications, the degradation level at a specific time-point can be measured only by destructive inspection such as operating torques of return-springs in a bi-functional DC motor system, as in this study. That is, testing units are destroyed or physical characteristics are significantly changed after measuring the performance degradation. In such a manner, only one measurement can be taken from one unit. Along with accelerated variables to hasten degradation mechanisms, this form of testing method is referred to as an accelerated destructive degradation test (ADDT).
ADDT has been commonly employed in industrial practice to evaluate the long-term material properties. Nelson [1] conducted ADDT to evaluate dielectric breakdown strength of insulation specimens using accelerated temperatures. Escobar et al. [2] proposed a parametric approach to ADDT for the adhesive bond B data. Li and Doganaksoy [3] analyzed ADDT testing data of the seal strength at accelerated temperature conditions. Recently, Xie et al. [4] proposed a semiparametric model to describe ADDT data of the adhesive formulation K. In the literature, the analysis of the ADDT data involves a model fitting to the degradation paths over time. Meanwhile, accelerated stress effects should be explicitly incorporated into the ADDT model in a parametric manner. See Escobar et al. [2] for more details on the models and data analyses of ADDT.
In the literature on reliability analyses in the field of automobiles, Pfeufer [5] proposed a model-based fault detection method based on the parity-space and parameter estimation approach for the reliability improvement of automotive actuators. Zhang et al. [6] employed the reliability sensitivity analysis of design parameters to multiple case studies including coil springs and composite springs in automobiles. Shin and Lee [7] proposed the reliability analysis of small DC motors for automobiles with Accelerated Life Testing. The application of the inverse-power law model indicates its main failure mechanism—performance degradation by brush wear out. Liu et al. [8] also studied the reliability analysis of automobile welding structures to analyze its strength degradation of key components, to name a few.
In this work, we provide a step-by-step procedure of the reliability analysis for bi-functional DC motor systems, based mainly on ADDT data. We also propose nonlinear degradation models to describe the ADDT data of the return-springs in a bi-functional DC motor system. To derive the failure-time distribution from the ADDT data, both the closed-form formulation approach and Monte Carlo simulation were conducted. The DC motors are replacing solenoid motors which have been widely used in various industry areas. In particular, DC motors have garnered more attention for its effective usage, due to its limited dimension and weight, for electronic devices in automobiles. A number of studies on the reliability analysis regarding DC motors have been performed up to this point. Moseler and Isermann [9] conducted fault detections based on the mathematical modeling of each electrical and mathematical subsystem. Kara and Eker [10] proposed a nonlinear modeling for DC motor rotation dynamics. Shin and Lee [11] studied degradation mechanisms of brushes for automotive small brush-type DC motors. Shin et al. [12] investigated the effects of the wear behavior of copper-graphite brushes to predict the lifetime of small brush-type DC motors. General approaches to predict the lifetime of the DC motor system are provided by Flickinger et al. [13]. To our best knowledge, however, the reliability evaluation for DC motor systems using ADDT is not abundant. Some components such as the return-spring in automobiles have performance degradation patterns with a destructive nature. While many components of automobile are influenced by the constant contact and friction caused by service, some components are affected by temperature as well.
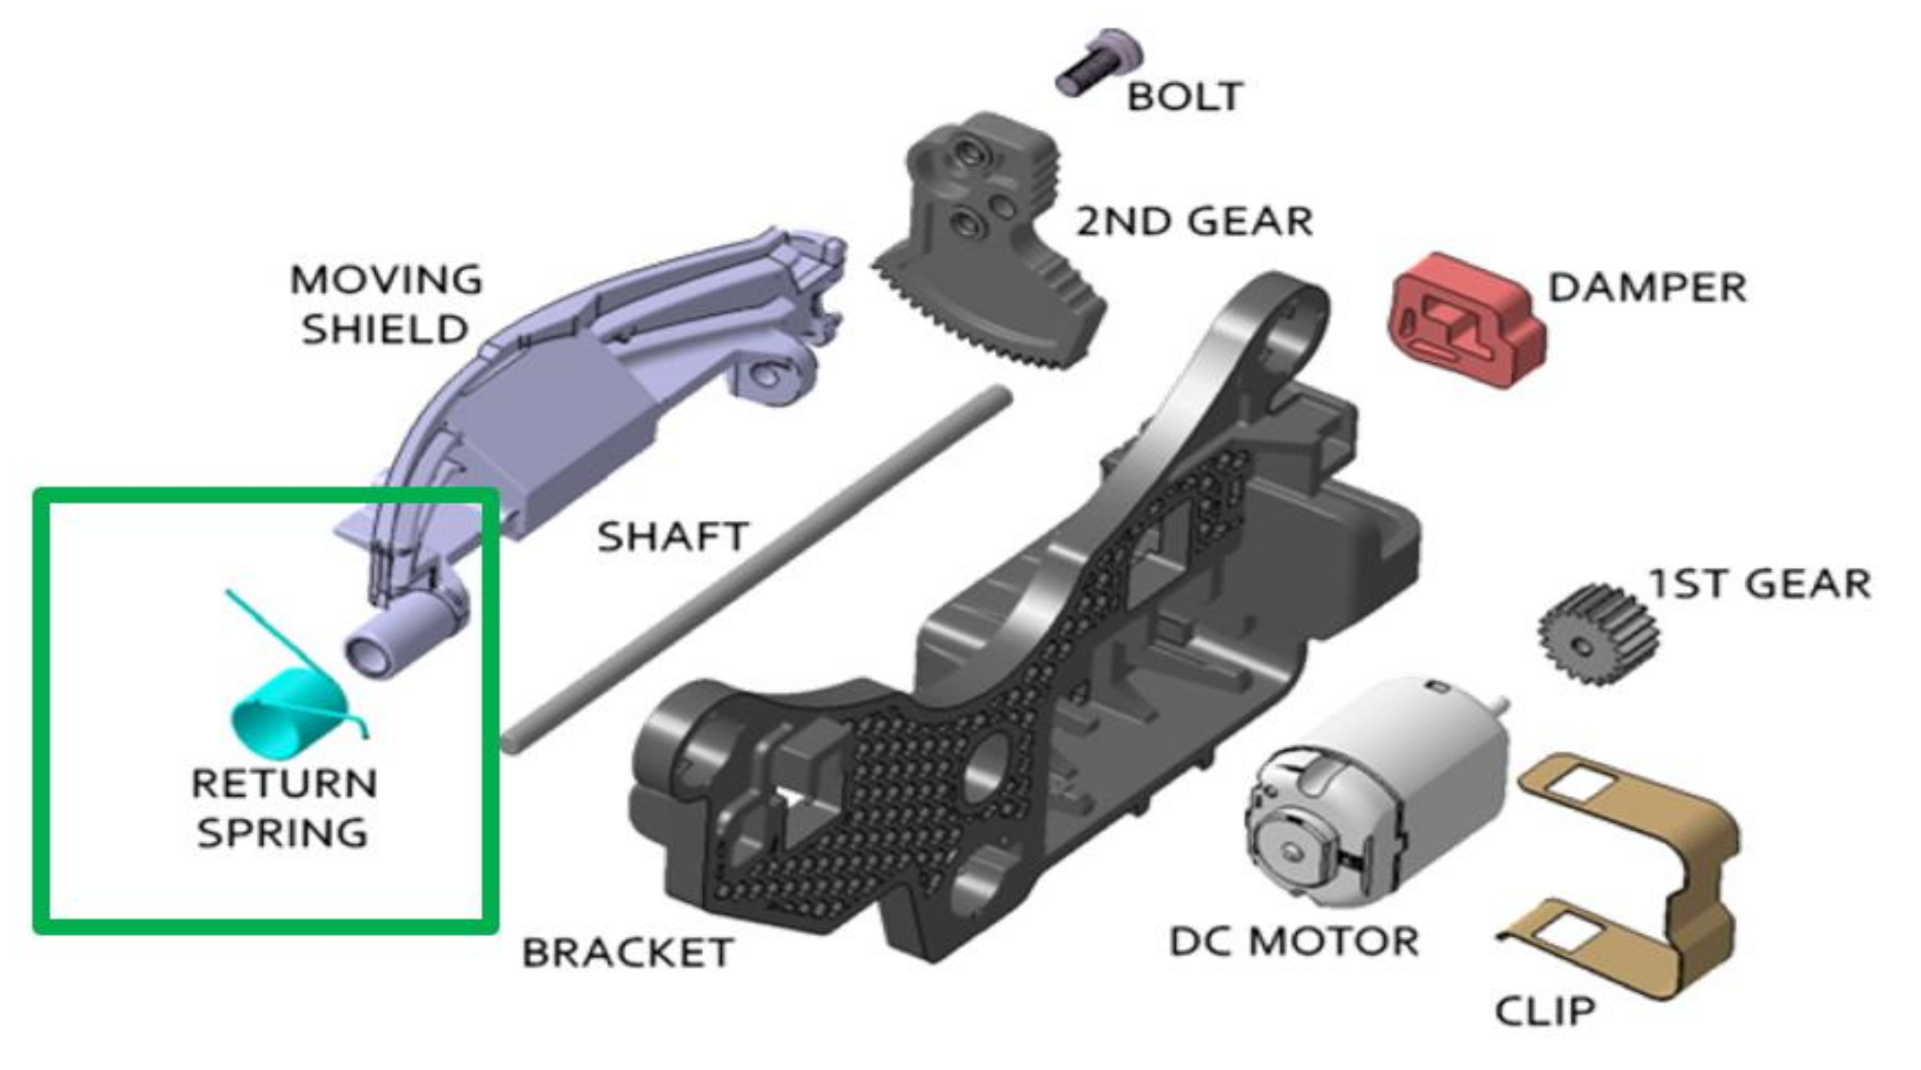
Figure 1 shows a bi-functional DC motor system for an automobile. The general objective of the bi-functional DC motor system is to control the function of the headlight beam. Despite its importance for the driver’s safety, claims about its functional faults are constantly increasing. In particular, main complaints from users come from the incompleteness of the on-off switching of headlights (see Figure 2). It is mainly induced by the malfunction of the return-spring due to degradation of their elastic restoring forces. Reliability analysis of DC motor return-springs becomes a major issue in mechanical engineering. However, there is still a limitation on collecting enough reliability information about them because their elastic restoring forces can be measured only via destructive tests. We found through ADDT that the degradation paths of operating torques of the return-springs in a bi-functional DC motor system are of nonlinear form. We proposed a nonlinear degradation model to describe the ADDT data of the return-springs.
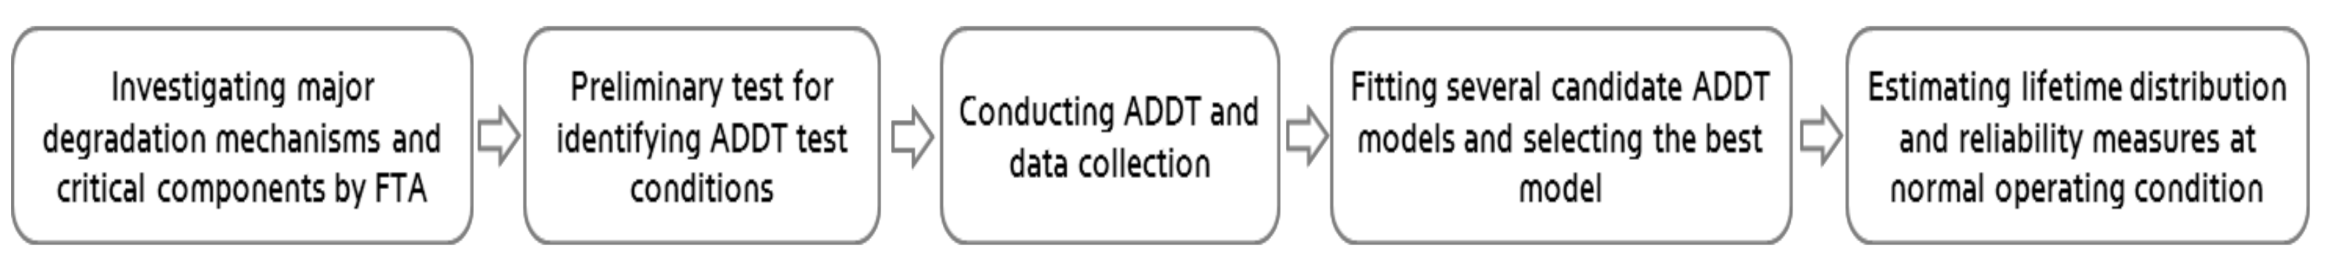
Figure 3 briefly summarizes the overall ADDT approach and its data analysis procedure for return-springs in the bi-functional DC motor system. After investigating major degradation mechanisms and identifying critical components of the bi-functional DC motor system via the fault tree analysis (FTA), ADDT is conducted based on the conditions derived from the preliminary test. For the ADDT data, a variety of candidate degradation models are fitted and the best model is selected according to model evaluation criteria. Finally, lifetime distribution and reliability measures at normal operating conditions are estimated from the selected degradation model.
The remainder of this paper is organized as follows. Section 2 presents degradation mechanisms of return-springs in a bi-functional DC motor system. Section 3 illustrates the experimental setup of the ADDT and ADDT model for return-springs in the bi-functional DC motor systems. Then, reliability prediction at normal use conditions is performed based on the ADDT model constructed at higher stress levels. Section 4 concludes this paper and states possible future research directions.
2. Degradation Mechanisms of Bi-Functional DC Motors
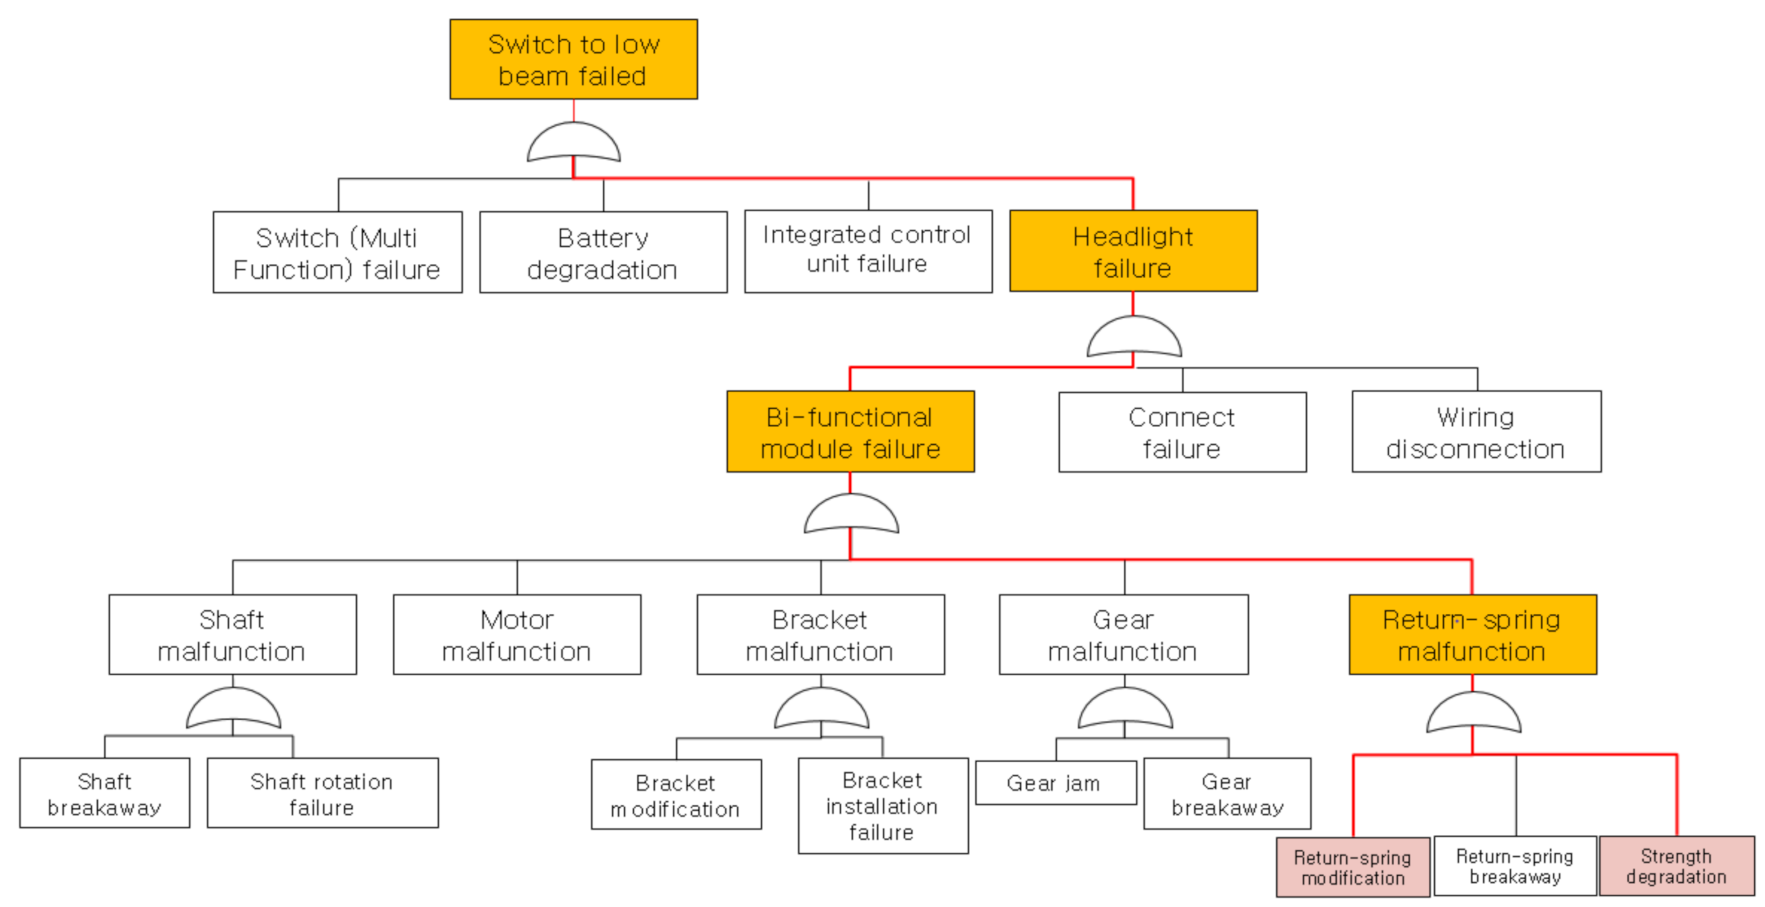
Fault tree analysis (FTA) was first conducted to identify critical components in a bi-functional DC motor system. Figure 4 presents FTA for the bi-functional DC motor system, showing that a return-spring is one of critical components for the failure of on-off switching of highlight beams. It has been proved that the return-spring has the shortest lifetimes in an FTA performed by reliability engineers. The spring is supposed to play a major role in maintaining and restoring the moving shield. However, plastic deformation or breakdown of the return-spring can cause the malfunction of shield movement, eventually resulting in the failure of the headlight system. Plastic deformation of the return-spring causes the degradation of actuating forces for shield movement, resulting in the deterioration of shield moving speed. A failed return-spring is shown in Figure 5. From preliminary investigation and an expert’s knowledge in the field, the primary reason of its failure may be the constant exposure to high temperatures released from headlight beams; as a result, the operating strength of the return-spring will deteriorate as time goes on.
3. ADDT Analysis
3.1. Experimental Setup
Before performing the ADDT, a preliminary test was executed to determine accelerated stress conditions for selecting the highest stress level. A temperature acceleration test was performed to examine whether test units fail under identical degradation mechanisms at five temperature levels above 300 °C. The return-springs were firmly fixed to jigs on the plate shown, then put in a chamber for high-temperature exposure (see Figure 6). From this preliminary test, extremely high temperatures (e.g., 400 °C, 600 °C) caused quite severe distortions of the return-spring shape (see Figure 7). To secure failures of return-springs from similar degradation mechanisms at a real operating condition (230 °C) for the ADDT, we selected two temperature levels lower than 400 °C: 300 °C and 325 °C, considering the test chamber capacity. We measured actuating forces of return-spring A in terms of high angle torque at the two accelerated temperature levels. Initially, 60 samples were put on the ADDT at each temperature level, then 3 samples were randomly chosen to measure their high angle torques per every inspection point. The torques of the return-springs were measured using a sensor-based machine in Figure 8. The machine rotated an arm after fixing the other arm, then measured the actuating forces as , where is a length of the arm (unit: mm) and is the actuating force (unit: kgf). Strictly speaking, the arm length denotes the distance from the spring center to the device rotating the arm. Note that the arm angle of the return-spring is 130° at low-beam rotation and 170° at high-beam rotation.
3.2. ADDT Model
| Notation | |
| i | The number of stress levels |
| j | The number of testing units |
| The number of samples in the -th stress level. | |
| t | Measurement time |
| -th stress level. | |
| Parameter vector for degradation path | |
| Degradation result of -th testing unit at -th stress level. | |
| Normal error term to describe unit-to-unit variability | |
| Mean degradation path | |
| Cumulative distribution function for degradation | |
| Cumulative distribution of standard normal distribution | |
| Parameters for the degradation model | |
| Activation energy | |
| Pre-determined failure threshold level | |
| Th number of simulation iterations | |
| Vector of estimated parameters in ADDT model | |
| Covariance matrix for estimated parameter | |
Suppose that the ADDT of a return-spring is conducted at two higher stress levels: , where is the normal use stress, that is, 230 °C in a bi-functional DC motor system. The observed sample degradation path at measurement time on the th testing unit under stress level is given by
where is the mean degradation path at time under stress level , and is the number of samples measured at the th stress level. is assumed to be a monotonic decreasing function of time and the parameter vector ; it is also a twice differentiable continuous function. is a normal error term describing unit-to-unit variability as .
For temperature–acceleration processes, the Arrhenius model is often used to represent the relationship between the degradation process and temperature as
Here, is in degrees Celsius, and the value 11,605 is the reciprocal of Boltzmann’s constant in units of electron volts per Kelvin (eV/K). The value of 273.15 in the denominator is used to convert to the absolute Kelvin temperature scale. Note that the transformed function is of the exponential form for the Arrhenius model, that is, .
With respect to the ADDT model in Equation (1), the regression based general path models have been widely applied in many applications, e.g., (transformed) linear path model [14] and nonlinear path model [15]. Recently, a semiparametric model has been suggested by Xie et al. [4]. For a given time and accelerated variable level, the cumulative distribution function (CDF) for the degradation is
where is the CDF of a standard normal distribution. For the mean degradation path, four popular degradation models are employed; exponential, power, logarithmic, and logistic models. Table 1 lists the formulas of the four models and plots the outlined features under specified values of their parameters with . For example, the exponential ADDT model with the Arrhenius relationship at temperature level is given by
for and . Here, denotes the normal use temperature level and is the activation energy of the return-spring. Under the parametric specification, the parameters can be estimated by using the maximum likelihood (ML) method or least-squares (LS) approach. In this work, we use the ML method since the ML method is more efficient in the nonlinear degradation model and we can easily quantify uncertainty through asymptotic normality for the ML estimator or its function.
To derive the failure–time distribution from the ADDT model in Equation (1), the failure-time is defined as the first crossing time that the actual degradation path reaches the pre-determined threshold level . Along with a decreasing degradation path, failure-time being less than is equivalent to an observed degradation being less than at time ; that is,
Figure 9 shows the ADDT data of return-spring samples in bi-functional DC motors at 300 °C and 325 °C. Note that the degradation of the operating force for the return-spring is of nonlinear form and the force degradations at 325 °C are steeper than those at 300 °C. We seek a model for relative operating force by dividing each measurement of the operating force by the initial value to easily derive the failure-time of the return-spring, where the failure is defined at the time when the relative operating force falls below 1.23 kgF/1.42 kgF = 86.89%. The values of 1.23 kgF and 1.42 kgF were derived from the preliminary experiment of users’ cognitive speed for return-spring resilience. We fitted the four models, including one linear model, to the ADDT data, but we re-parameterized the exponential model to fit the relative actuating forces and to present the decreasing degradation rate as
In addition, we also modified the logarithmic model and the power model to fit the relative actuating forces as
and
respectively.
Figure 10 presents the fitting results of the mean degradation path from four candidate models, along with the estimated degradation path at the normal use condition (230 °C). The horizontal dashed line represents the failure threshold. We computed the log-likelihood, Akaike information criterion (AIC) [16], and Bayesian information criterion (BIC) [17] to support the best model selection procedure. The AIC is a general-purpose criterion which is defined as: , where is the log-likelihood for the ML estimates and is the dimension of , that is, the number of parameters to be estimated. The BIC is defined as: , where is the number of observations for the ADDT. The intention of these two information criteria is to help us find the simpler model by assigning the penalty for increasing the complexity of an assumed model. If we are using the log-likelihood, we prefer the model with the larger log-likelihood, while we prefer the model with the lower AIC, or lower BIC to compare several models for the same data. Table 2 summarizes the statistics from the best model selection procedure. All the results advocate the power model as the best model for the ADDT data of return-springs. The parameters of the power model were estimated as: , and . Using the asymptotic normality for the MLEs, the variance-covariance matrix of was obtained by the inverse of Fisher-information matrix as: = [ Finally, the mean degradation model at the normal use condition is
and its path was plotted as the dashed line in Figure 10c.
3.3. Failure-Time Analysis
To derive the failure-time distribution in normal use conditions, we used two methods; closed-form expression and the Monte Carlo simulation, based on the estimated parameters for the power degradation model selected as the best for the ADDT experiment data. Using the variance-covariance matrix of estimated parameters, 100,000 degradation paths were simulated from the Monte Carlo simulation. The pseudo-failure is determined at the time that the degradation path reaches the given failure threshold (%).
Suppose that a specified model for degradation path and the failure-time distribution can be derived by the function of the degradation model parameters. Assume that a unit fails at given time for the degradation path to reach a given criterion
For a given , the distribution of depends on the distribution of the degradation model parameters . In general, a closed-form expression exists and the life estimators can be calculated based on the nonlinear with the MLE . The th quantile of the lifetime distribution is derived using the relationship
and by solving the power model in terms of .
In addition to the lifetime estimation using the closed-form equation, a numerical method was applied to compare the precision of the estimated results. A Monte Carlo simulation can be an effective approach for the evaluation of by the large number of random sample paths generated with the assumed model. The procedure of the lifetime estimation based on the simulation algorithm is given as follows.
- Step I: Generate (large number: e.g., ) simulated degradation paths using the estimators of from a multivariate normal distribution with mean and variance-covariance matrix , where we used the variance-covariance matrix of to simulate the random sample path.
- Step II: Compute pseudo-failure times corresponding to the realizations of , where the pseudo-failure time is defined as the point where the degradation path intersects with the failure threshold.
- Step III: For any desired values of , use the following function for evaluation of as
As the value of N increases, the precision of the estimation will improve. Using the Monte Carlo simulation, the simulated degradation paths with the given failure criterion and resulting failure-time distribution is given in Figure 11.
The results of the lifetime estimation using both the closed-form equation and Monte Carlo simulation are compared in Table 3, where the years of use were calculated according to the average usage rate of the vehicle at 4 h per day. As described in the table, the overall lifetimes based on the closed-form equation become conservative since this method does not consider the variability of the parameters and directly estimates the constant value of the independent parameter set, . On the other hand, the numerical method provides a more centralized lifetime distribution, where the generated degradation paths are spread around the original path through the closed-form equation.
4. Conclusions
The ADDT is a useful tool for making reliability inferences and predictions of products with limited testing times and resources by employing accelerated stress conditions. We proposed the step-by-step procedure of an ADDT analysis for the return-springs in a bi-functional DC motor system in this work. From the ADDT, return-springs were tested for 1000 h at 300 °C and 325 °C. Four nonlinear degradation models were applied to the ADDT data and from the comparative study among the four models, a power model was selected as the best, based on the log-likelihood, AIC, and BIC. From both the closed-form expression and the Monte Carlo simulation, using the estimates of the parameters in the assumed model, failure-time distribution at normal use conditions and reliability measures of interest were derived.
In this work, we only considered one degradation mechanism. However, there may be more than one degradation mechanism, which can cause the observations to be right-censored. For future research, the application of the Bayesian method and the consideration of several accelerated variables can be beneficial for various practices in the automobile and other industries. If prior information about degradation mechanisms is available, Bayesian methods incorporating the priors into the ADDT model parameters can be useful in improving the precision of reliability or other specified quantities of interest at normal use conditions. Sometimes, several accelerated variables (e.g., accelerated temperatures and humidity levels, accelerated temperatures and voltages) are involved in ADDTs. The optimal experimental design for an ADDT with several accelerated variables can be devised for testing cost minimization or precision maximization.
Author Contributions
Conceptualization, S.J.B.; methodology, C.L., M.L.; software, M.L.; validation, C.L. and S.J.B.; formal analysis, C.L., M.L. and S.J.B.; investigation, C.L., M.L.; resources, C.L., C.K., and S.J.B.; data curation, M.L.; writing—original draft preparation, C.L.; writing—review and editing, M.L., C.K., and S.J.B.; visualization, S.J.B.; supervision, S.J.B.; project administration, S.J.B.; funding acquisition, S.J.B. All authors have read and agreed to the published version of the manuscript.
Funding
This research was supported by two research funds: Basic Science Research Program through the National Research Foundation of Korea (NRF) funded by the Ministry of Education(2018R1D1A1A09083149) and the National Research Foundation of Korea (NRF) grant funded by the Korea government (MSIT) (No. 2020R1A4A407990411).
Institutional Review Board Statement
Not applicable.
Informed Consent Statement
Not applicable.
Data Availability Statement
Not applicable.
Acknowledgments
We appreciate three anonymous reviewers for the valuable comments, and Hyundai Mobis Co., Ltd. for providing the ADDT data.
Conflicts of Interest
The authors declare no conflict of interest.
References
- Nelson, W. Analysis of performance-degradation data from accelerated tests. IEEE Trans. Reliab. 1981, 30, 149–155. [Google Scholar]
- Escobar, L.A.; Meeker, W.Q.; Kugler, D.L.; Kramer, L.L. Accelerated destructive degradation tests: Data, models, and analysis. In Mathematical and Statistical Methods in Reliability; World Scientific Publishing Company: River Edge, NJ, USA, 2003. [Google Scholar]
- Li, M.; Doganaksoy, N. Batch variability in accelerated-degradation testing. J. Qual. Technol. 2014, 46, 171–180. [Google Scholar] [CrossRef]
- Xie, Y.; King, C.B.; Hong, Y.; Yang, Q. Semiparametric models for accelerated destructive degradation test data analysis. Technometrics 2018, 60, 222–234. [Google Scholar] [CrossRef] [Green Version]
- Pfeufer, T. Improvement of flexibility and reliability of automobile actuators by model-based algorithms. Int. Fed. Autom. Control 1994, 27, 355–360. [Google Scholar]
- Zhang, Y.M.; He, X.D.; Liu, Q.L.; Wen, B.C. Reliability-based optimization of automobile components. Int. J. Veh. Saf. 2005, 1, 52–63. [Google Scholar] [CrossRef]
- Shin, W.G.; Lee, S.H. A development of accelerated life test method for blower motor for automobile using inverse power law model. Int. J. Mod. Phys. B 2008, 22, 1074–1080. [Google Scholar] [CrossRef]
- Liu, X.T.; Zheng, S.L.; Feng, J.Z.; Huang, H.; Chu, J.; Zhao, L.H. Reliability analysis and evaluation of automobile welding structure. Qual. Reliab. Eng. Int. 2013, 30, 1293–1300. [Google Scholar] [CrossRef]
- Moseler, O.; Isermann, R. Application of model based fault detection to a brushless DC motor. IEEE Trans. Ind. Electron. 2000, 47, 1015–1020. [Google Scholar] [CrossRef]
- Kara, T.; Eker, I. Nonlinear modeling and identification of a DC motor for bidirectional operation with real time experiments. Energy Convers. Manag. 2004, 45, 1087–1106. [Google Scholar] [CrossRef]
- Shin, W.G.; Lee, S.H. An analysis of the main factors on the wear of brushes for automotive small brush-type DC motor. J. Mech. Sci. Technol. 2010, 24, 37–41. [Google Scholar] [CrossRef]
- Shin, W.G.; Song, Y.S.; Seo, Y.K. Correlation analysis of brush temperature in brush-type DC motor for predicting motor life. J. Mech. Sci. Technol. 2012, 26, 2151–2154. [Google Scholar] [CrossRef]
- Flickinger, G.L.; Chmiel, G.J.; Surtherland, H.A. Method and system for determining the reliability of a DC motor system. U.S. Patent 7,873,581, 18 January 2011. [Google Scholar]
- Shi, Y.; Escobar, L.A.; Meeker, W.Q. Accelerated destructive degradation test planning. Technometrics 2009, 51, 1–13. [Google Scholar] [CrossRef] [Green Version]
- Vaca-Trigo, I.; Meeker, W.Q. A statistical model for linking field and laboratory exposure results for a model coating, In Service Life Prediction of Polymer Materials; Martin, J., Ryntz, R.A., Chin, J., Dickie, R.A., Eds.; Chap. 2; Springer: New York, NY, USA, 2009. [Google Scholar]
- Sakamoto, Y.; Ishiguro, M.; Kitagawa, G. Akaike Information Criterion Statistics; Reidel: Dordrecht, Holland, 1986. [Google Scholar]
- Schwarz, G. Estimating the dimension of a model. Ann. Stat. 1978, 6, 461–464. [Google Scholar] [CrossRef]
Figure 1.
Bi-functional DC motor system in an automobile.

Figure 2.
Fault phenomenon of a headlight system.

Figure 3.
A flow diagram for the accelerated destructive degradation test (ADDT) and data analysis procedure.
Figure 3.
A flow diagram for the accelerated destructive degradation test (ADDT) and data analysis procedure.

Figure 4.
Fault tree analysis (FTA) of a bi-functional DC motor system in an automobile.

Figure 5.
Breakdown of a return-spring in a bi-functional DC motor.

Figure 6.
The jig plate (left) and a zig shape firmly fixing a return-spring (right).

Figure 7.
Degradation shapes of test samples at each temperature condition.

Figure 8.
A sensor-based machine measuring the actuating force of a return-spring.

Figure 9.
Degradation paths of actuating forces for return-springs at 300 °C and 325 °C.

Figure 10.
Fitting results of the ADDT data from the four candidate models.


Figure 11.
Simulated degradation paths and failure-time distribution at normal use conditions from the ADDT data.
Figure 11.
Simulated degradation paths and failure-time distribution at normal use conditions from the ADDT data.


Table 1.
Mean degradation path models applied to ADDT of springs.
| Model | Exponential | Logarithmic | Power | Logistic |
|---|---|---|---|---|
| Mean degradation | ||||
| Degradation over time |  |  |  |  |
Table 2.
Stress condition for the failure mechanism.
| ADDT Model | Log-Likelihood | AIC | BIC |
|---|---|---|---|
| Exponential | 222.54 | −439.08 | −430.25 |
| Logarithmic | 373.49 | −740.99 | −732.16 |
| Power | 374.53 | −743.07 | −734.24 |
| Logistic | 230.38 | −454.75 | −445.93 |
Table 3.
Percentile estimation of the return-spring at normal use conditions.
| Estimation Method | Percentile | 1 | 5 | 10 | 20 | 30 | 40 | 50 |
|---|---|---|---|---|---|---|---|---|
| Closed-form equation | Hour | 4,694 | 14,256 | 25,925 | 53,775 | 91,351 | 144,033 | 220,914 |
| (Year) | (3.22) | (9.76) | (17.76) | (36.83) | (62.57) | (98.65) | (151.31) | |
| Monte Carlo simulation | Hour | 18,061 | 29,356 | 38,593 | 94,050 | 127,629 | 168,546 | 220,311 |
| (Year) | (12.37) | (20.11) | (26.43) | (64.42) | (87.42) | (115.44) | (150.90) |
Publisher’s Note: MDPI stays neutral with regard to jurisdictional claims in published maps and institutional affiliations. |
© 2021 by the authors. Licensee MDPI, Basel, Switzerland. This article is an open access article distributed under the terms and conditions of the Creative Commons Attribution (CC BY) license (http://creativecommons.org/licenses/by/4.0/).
Share and Cite
MDPI and ACS Style
Lee, C.; Lim, M.; Kim, C.; Bae, S.J. Reliability Analysis of Accelerated Destructive Degradation Testing Data for Bi-Functional DC Motor Systems. Appl. Sci. 2021, 11, 2537. https://0-doi-org.brum.beds.ac.uk/10.3390/app11062537
AMA Style
Lee C, Lim M, Kim C, Bae SJ. Reliability Analysis of Accelerated Destructive Degradation Testing Data for Bi-Functional DC Motor Systems. Applied Sciences. 2021; 11(6):2537. https://0-doi-org.brum.beds.ac.uk/10.3390/app11062537
Chicago/Turabian StyleLee, Chinuk, Munwon Lim, Chanjoong Kim, and Suk Joo Bae. 2021. "Reliability Analysis of Accelerated Destructive Degradation Testing Data for Bi-Functional DC Motor Systems" Applied Sciences 11, no. 6: 2537. https://0-doi-org.brum.beds.ac.uk/10.3390/app11062537
Note that from the first issue of 2016, this journal uses article numbers instead of page numbers. See further details here.