
Statistical Tolerance Analysis—A Survey on Awareness, Use and Need in German Industry

1
Faculty of Engineering, University of Applied Sciences Ansbach, 91522 Ansbach, Germany
2
Department of Engineering Design, Friedrich-Alexander-University Erlangen-Nürnberg, 91058 Erlangen, Germany
*
Author to whom correspondence should be addressed.
Appl. Sci. 2021, 11(6), 2622; https://0-doi-org.brum.beds.ac.uk/10.3390/app11062622
Submission received: 5 February 2021
/
Revised: 10 March 2021
/
Accepted: 11 March 2021
/
Published: 16 March 2021
(This article belongs to the Special Issue Mechanical Tolerance Analysis in the Era of Industry 4.0)
Abstract
:The importance of geometric deviations of components for the aesthetic and functional quality of products has been undisputed for decades. So, it is not surprising that not only have numerous researchers devoted themselves to this field, but also commercial software tools for the analysis and optimization of tolerance specifications (currently already fully integrated in 3D-CAD systems) have been available for around 30 years. However, it is even more surprising that the well-founded specification of tolerances and their analysis using a so-called statistical tolerance analysis are only established in a few companies. There is thus a contradiction between the proclaimed relevance of tolerances and their actual consideration in everyday business life. Thus, the question of the significance of geometric deviations and tolerances as well as the use of statistical tolerance analysis arises. Therefore, a survey among 102 German companies was carried out. The results are presented and discussed in this paper.
1. Introduction
Imprecise manufacturing processes lead to parts that differ in their dimensions and shape [1]. The assembly of these parts, in consequence, results in products whose aesthetic quality and/or functionality during their use do not meet the ideal that is sought. Consequently, the design engineer has to specify appropriate tolerances to limit these deviations to ensure the adequate functional and aesthetic quality of final products.
Despite all the technical developments and remarkable achievements, errors and uncertainties in the development and manufacturing of technical products (among other things due to human nature and the limits of what is technically feasible) are still unavoidable today. If design engineers, production planners, workers in manufacturing and assembly, quality inspectors, etc., are also under pressure of time, cost and success, even the smallest shortcomings may accumulate and sometimes have dramatic consequences. These have to be avoided for the benefit of the company as well as the customer, society and environment.
From time to time, however, geometric tolerances and their significance attract global attention. This was the case in 2014, when General Motors attributed the recall of 8.4 million vehicles due to a tolerance stack-up problem, summarizing that “a tolerance stack-up condition exists between components internal to the cylinder which will allow some keys to be removed” [2].
It is, therefore, all the more surprising that, despite this relevance, tolerance engineering in industrial practice mostly has a scarce existence [3]. The consequences are sometimes considerable: Insufficient tolerance engineering leads to higher costs in production and assembly, a poor internal climate and thus biased communication, functional deficiencies and a reduction in the value of the products (reduced quality), as well as a dwindling reputation of the company among existing and future customers and partners [4]. Efficient and holistic specification and analysis of tolerances are not a natural part of the company’s philosophy. Rather, these are often understood as an arduous duty incumbent on the design engineer. Accordingly, the authors face the urgent question of how tolerance analysis in German companies is performed, focusing on three aspects:
- The relevance of geometric deviations and tolerances for companies and their products and processes;
- The already established use of statistical tolerance analysis in companies;
- The need for further development and research on statistical tolerance simulations.
In order to answer these questions thoroughly, the authors conducted a representative survey of 102 German industrial companies. The survey was carried out in the late summer of 2012. The results of this survey are presented and discussed in this paper due to the self-imposed publication embargo of eight years on selected questions.
The paper is structured as follows: Section 2 and Section 3 will provide the foundation of the paper. Section 2 gives a general overview of the development of tolerance engineering from its early beginnings to date. The state of the art (Section 3) details existing surveys on certain aspects of tolerancing carried out in the last 30 years. The relevant information on the established survey, the procedure and the questionnaire are given in Section 4. Section 5, Section 6 and Section 7 then discuss the survey results–focusing on the three aspects of tolerancing–awareness of deviations and tolerances (Section 5), the current use and extent of statistical tolerance analysis (Section 6) and the need and potential of statistical tolerance simulations (Section 7). The paper concludes with a critical appraisal of the insights gained as well as the identification of an omnipresent dilemma that the tolerance community must strive to overcome (Section 8).
In recent decades, various terms have become established for the discipline that encompasses all the methods and tools used in dealing with deviations and tolerances. The most common terms are “geometric dimensioning and tolerancing (GD&T)”, “dimensional management”, “tolerance management”, “geometry assurance”, “tolerancing” and “tolerance engineering”. In this paper, we use the term “tolerance engineering”, which is synonymous with all the others.
2. What Led Us to Today?—A Brief Historical Review on Tolerance Engineering
The history of tolerance engineering is closely linked to progress in the manufacturing and assembly of products and in particular the manufacturing of tools and weapons. The idea of interchangeability in the production of bows and arrows was born in ancient Egypt (3000 BC) [5]. However, it was only in the 18th century in France that the interchangeability of weapon components was promoted by De Gribeauval and Blanc as well as in the USA by Whitney [6,7].
The interchangeability for the first time allowed the quality of products to be guaranteed even if certain deviations were accepted. At the beginning of the 20th century, the standardization of products and processes was implemented massively worldwide. Beginning in Great Britain (1901), another 24 organizations for standardization were founded within the following 31 years [5]. Among the first results published in 1922 by the German Standards Committee (DIN) was the DIN system of fits [8], which still exists today in a modified form [9]. As standardization progressed, the need for a uniform specification of tolerances in technical drawings and sketches, which was first regulated at the beginning of the 20th century, also increased [10].
At the beginning of the 20th century, statistics and probability theories found their way into almost every science, including mechanical engineering [5]. The rapidly growing automotive industry in particular demanded new methods to improve the production and thus the quality of vehicles. Shewhart explained in [11] as early as 1925 that the quality of each product during use was a function of the qualities of the single parts used [12]. In [12], he explained the necessity to analyze the effects of individual part deviations on the quality of the product, taking into account the associated probability distributions and permissible reject rates. With this requirement, Shewhart explained the statistical tolerance analysis in its currently known form, although he did not explicitly use this term.
During World War II, research activities decreased enormously [13]. However, in the following years, the newly flourishing automobile production (especially in the USA) and the rapidly increasing economic and thus purchasing performance in Europe spurred the spread of statistical tolerance calculations in research and industrial mass production [14].
With the increasing availability of mainframes in the 1960s, research and development on tolerance engineering probably experienced the greatest impetus to date. Existing and established methods and approaches [15,16,17] could be implemented on the fly and then applied quickly and easily. In addition to tolerance analysis, however, tolerance synthesis in particular benefited from the almost unlimited possibilities of computer support. This is illustrated by the multitude of research work in the 1970s in the field of statistical tolerance optimization (e.g., [18,19,20,21,22]) as well as tolerance-cost models (e.g., [23,24,25]). This decade can, therefore, be regarded as the decade of tolerance-cost models [26].
With the introduction of the personal computer 30 years ago, the development of software tools for tolerance analysis increased in importance [27]. A large number of software tools [28,29,30] were developed [31,32,33,34], which have since established themselves in few companies worldwide [35,36]. Due to the variety of methods and tools developed, there was an increasing need to revise existing standards. The revision of the Geometric Product Specification (GPS) by expert committees [37,38] deserves special mention and is still in full progress. Furthermore, the current digital transformation of production (Industry 4.0) challenges engineers to advance tolerancing engineering by considering data collected during the entire product lifecycle [39,40,41], to enhance the communication of tolerances using product manufacturing information (PMI) [42] and to integrate real-time tolerance simulations into each step of manufacturing processes [43].
However, despite all the achievements of research and development, holistic tolerance engineering and the sensible and well-founded use of methods and tools for tolerance analysis are still scarce in German companies. Dealing with deviations and tolerances is still a tiresome and unpleasant task, which usually receives insufficient attention.
3. Surveys on Tolerance Engineering
The following section discusses surveys in the context of tolerance engineering. Similar to our survey, this section focuses on German industry. Nevertheless, an identical picture can also be seen from a global point of view in recent works [44,45].
In 1985, Susanto interviewed 125 German companies in [46] on the application of updated standards on tolerances and fits. Most of the interviewed companies were in the fields of mechanical engineering and electrical engineering. Nearly all the companies surveyed (92.2%) gave their opinion on carrying out tolerance engineering. The main reasons given for the introduction of tolerance engineering were functional and quality-specific aspects, where cooperation with other companies was also mentioned. However, more than half of the companies (63.6%) still had problems with the implementation of effective tolerance engineering, mainly due to gaps in knowledge and insufficient experience. These implementation problems were particularly evident during the measurement of deviations that appear. About 75% of the companies reported that they did not check shape and position tolerances.
In 1995, Schütte interviewed 31 companies in Germany [47]. It turned out that shape and positional tolerances were stated to be extremely important for product quality assurance and clear and comprehensive communication with partners. At the same time, the respondents pointed out that gaps in employee knowledge, and comprehension problems during testing led to problems. According to the respondents, these problems should be improved by internal discussions of component drawings and various training of the engineers and departments involved.
Page investigates in [48] the use of tools in tolerancing in the medical device industry, and companies from the aviation industry were also included in the survey. An online survey, which followed several telephone interviews, found that statistical tolerance analyses were rarely applied among engineering design departments in the medical sector. The main reason was seen as the high complexity of the analysis tools. However, companies that used tolerance analysis reported very positive benefits. The extent to which the results of the survey are representative is questionable, since only 13 participants took part in it. Nevertheless, the survey supports the already quoted strictly limited application of tolerance analysis in German industry.
The focus of [35] was on the application of tolerance analysis in the field of medical engineering. They discuss the use and challenges of using software tools for tolerance analysis (computer-aided tolerancing, or CAT) in a company. Different employees within this company were interviewed and stated that tolerance analysis was considered highly important and was already applied during product development. However, there was no continuous workflow. Based on these findings, the employees were asked about their requirements of these software, so that their continuous application could be facilitated. The most important finding was the need to improve the link between the 3D-CAD- and the CAT-environments. The authors shed light on the requirements of a company in detail. The general validity of these results, however, is not discussed in the work.
The latest survey on the state of tolerance engineering in Germany was carried out in 2018 by Sersch et al. [49]. However, the authors have published only a few results since then. The survey focused on the barriers to a proper application of ISO GPS standards in German industry. The authors revealed that ~69% (=24 of 35) of the participants were familiar with the ISO GPS standards, but only ~67% of them (=16 of 24) were applying ISO GPS. The participants that did not apply ISO GPS in their companies saw the barriers in the “lack of know-how and expertise”, the “implementation of the GPS-system in the company’s individual product life cycle”, the “lack of time” and “difficulties in communication”. Finally, the participants demanded first for “adequate training” and the installation of “tolerance experts” in their companies to overcome these barriers.
The surveys discussed differ significantly in scope, extend and date are, therefore, only comparable with each other to a limited extent. In summary, they show that German companies from different sectors have been dealing with tolerance engineering for more than 30 years, but they are still struggling with very similar problems. Among the biggest challenges is the proper qualification and regular training of employees, since they claim significant knowledge gaps in understanding and applying standards on tolerancing, as well as in the application of tolerance simulations. Furthermore, the growing number of CAT software users reveals dramatic issues in user-friendliness, conformity with current standards as well as a seamless integration into product development processes.
4. The Survey—Implementation, Questionnaire and Participants
The common objective of methods of information acquisition and data collection is to enable empirically founded statements that can be generalized [50]. The methodical and systematic collection of data is assigned to social research and differentiated into qualitative and quantitative social research. While qualitative social research primarily aims at the subjective and thus hidden meaning of the topics from the participants’ point of view, quantitative social research captures the objective meaning of the topics questioned [50]. This quantitative evaluation allows the direct derivation of key indicators and thus absolute findings from the clearly assignable responses of the participants. Thus, the findings are objectified, and conclusions of general validity can be drawn. With the aim of generalizing knowledge and generally valid formulation as well as an objective review of hypotheses, quantitative social research was thus applied in the data collection. This ensures the desired representativeness and objectivity of the results [51].
The collection of data usually takes place via questions in a questionnaire, which are answered by randomly selected participants of a specific group personally, by telephone, in writing or online [50,52]. In our work, a compilation of 35 open questions (allowing answers as free text) and closed questions (single-choice or multiple-choice from given answers) [53] was established and assigned to the following four subjects of the questionnaire:
- General information on the participant;
- Significance of deviation effects on the aesthetic and functional quality of products;
- Approaches to take deviations into account as well as to reduce their effects on products at an early stage;
- Current state of use of tolerance simulations and future potential.
Subsequently, the questionnaire (in the form of an interactive PDF) was sent by e-mail in July and August 2012 to 381 participants from German mechanical engineering companies with the request to participate in the data collection. Finally, 102 participants completed the questionnaire and returned it via e-mail. This was a response rate of about 27%, which exceeds the usual response rates for online surveys of 5% to 20% [54]. Furthermore, the number of 102 returned questionnaires corresponds almost exactly to the recommendation to use at least 30 and ideally 100 data sets for representative online surveys [55]. The data collected in this study are thus representative and can be evaluated and discussed in the following. Figure 1 shows the number of questionnaires sent out and the number of returns per federal state. The complete interactive questionnaire (in German) is available from the corresponding author.
The survey participants came from various companies in the German mechanical engineering industry. This showed a balanced distribution of participants in terms of the size of their companies. Small and micro enterprises (<50 employees) made up the majority compared to medium-sized businesses (50 to 250 employees) and large companies (>250 employees). Figure 2 shows the distribution of participants among the four types of companies depending on the size of the company (in employees), which follows the company definition of the European Union [56].
The majority (52%) of the 102 participants worked in the engineering design department. The focus of the work of other participants was in management (15.7%), quality management (10.8%), research and development (8.8%) and production (7.8%). The composition of the participants thus reflected the diversity of Germany’s mechanical engineering industry, both in their responsibilities and in company size.
5. Awareness of Deviations and Tolerances
The fundamental assumption of all the following discussions is that the interviewees were familiar with tolerances and had a basic understanding of tolerance engineering. Therefore, we first evaluated to what extent participants already dealt with deviations and tolerances in their daily work routine and underlying development processes. In general, the overwhelming majority of the respondents (~94.1% = 96 of 102) dealt with deviations and tolerances and their effects on the functionality and aesthetic quality of products. Thus, the results of this survey are based on sound feedback and thus allow conclusions and recommendations with generality.
Almost all participants (94 of 102) asserted that tolerances were specified and detailed in drawings and/or 3D-CAD models of their products’ components and assemblies. In Germany, the tolerances in orientation, location, profile and run-out are classified to so-called “Lagetoleranzen” [57]. Hence, this term was used in the questionnaire. These tolerance specifications include:
- Dimensional tolerances in size by ~97.9% (=94 of 96);
- Form tolerances by ~87.5% (=84 of 96);
- Tolerances in orientation, location, run-out and profile by ~83.3% (=80 of 96);
- Surface roughness by ~69.8% (=67 of 96).
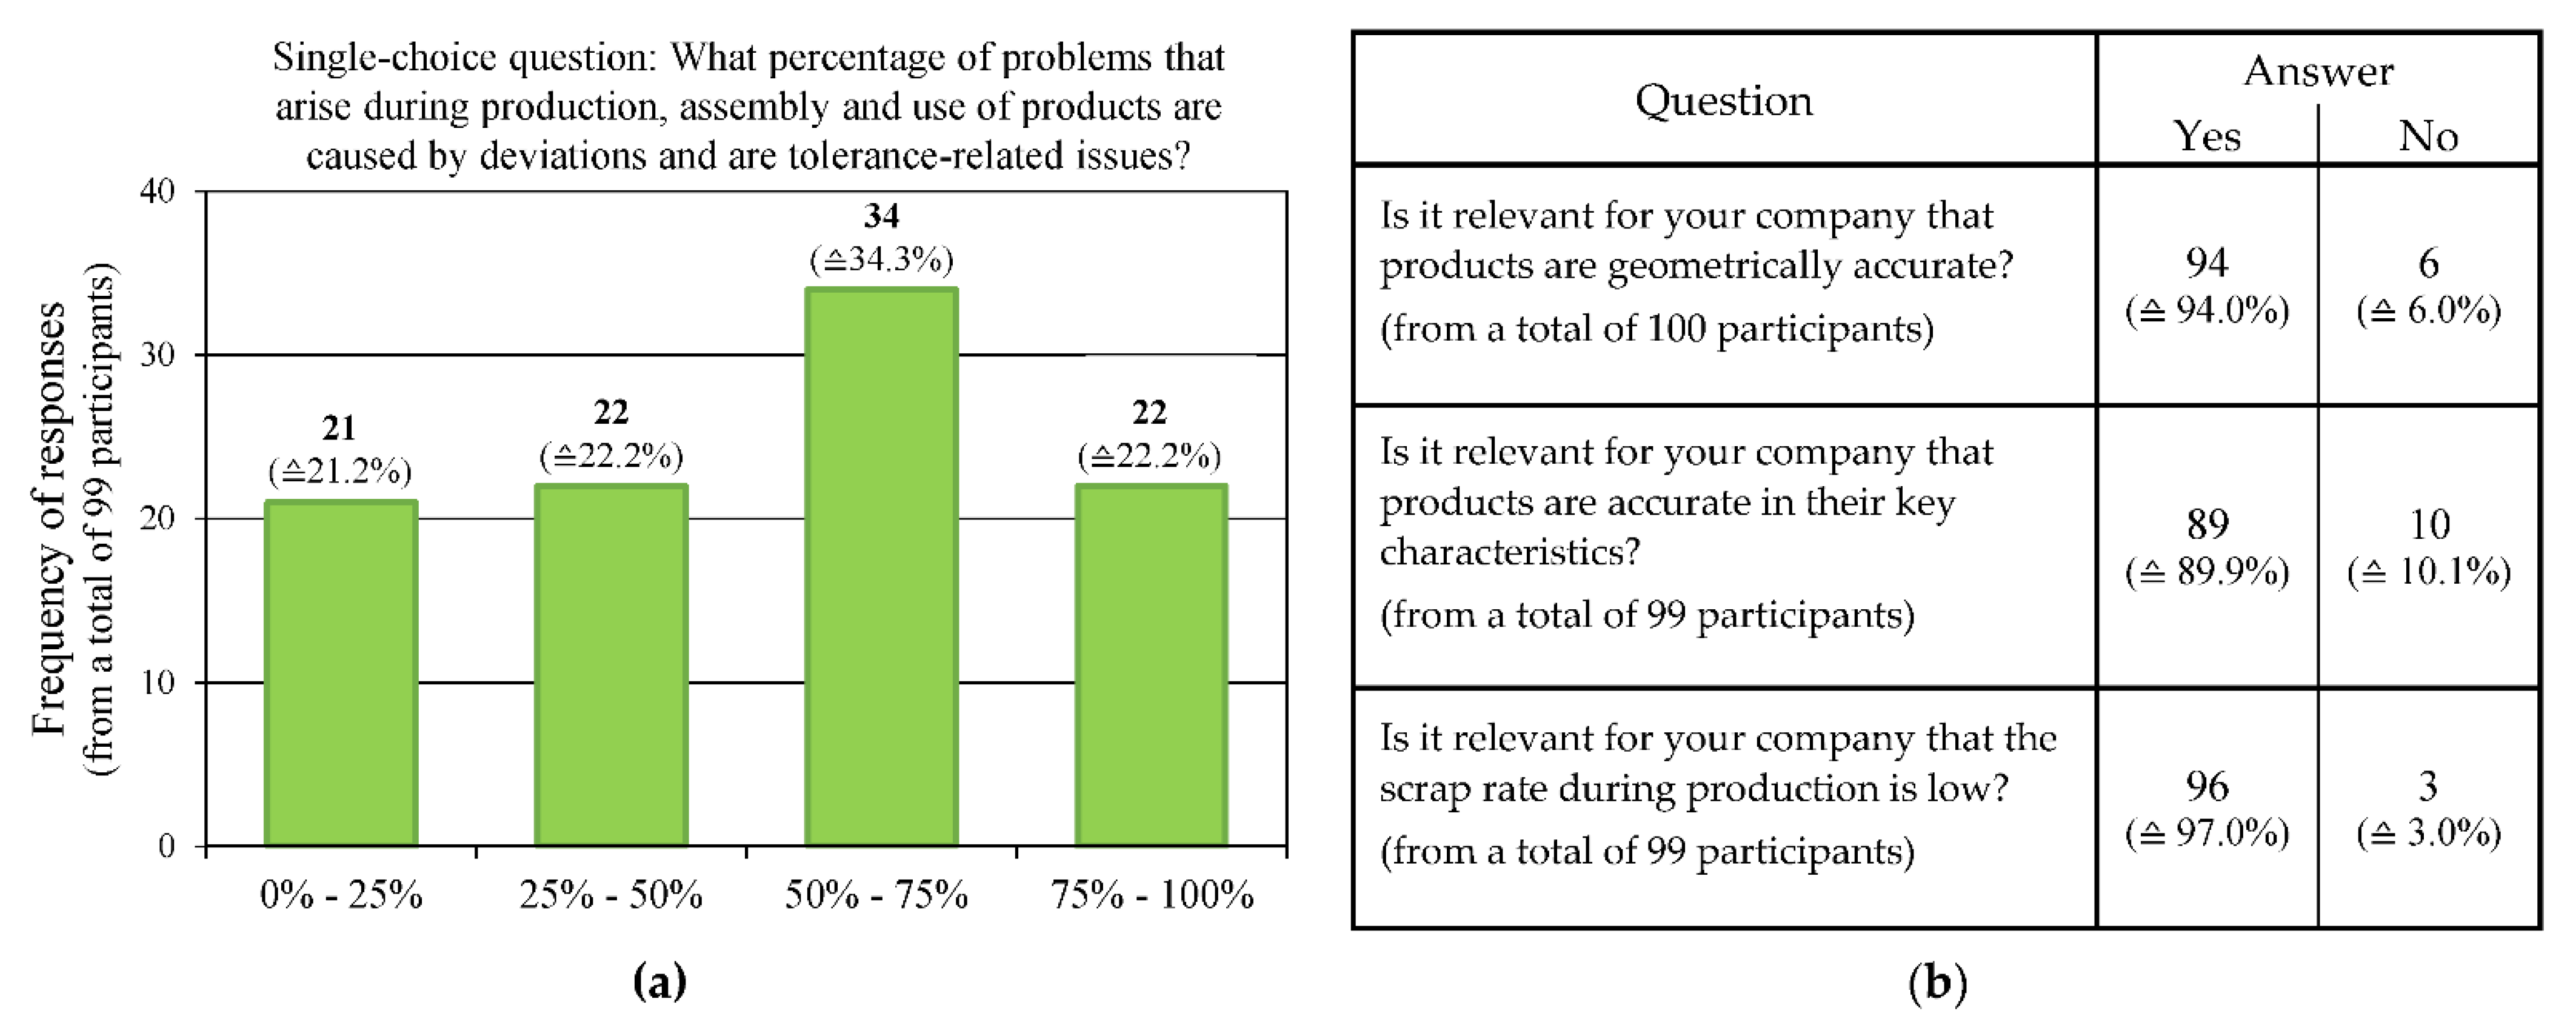
At first glance, this response is surprisingly positive and suggests an already existing broad knowledge of tolerancing practice and existing standards. However, in most cases, these tolerances were assigned relying on the engineer’s experience (~83.3% = 80 of 96). Furthermore, individual in-house standards (~62.5% = 60 of 96) as well as general tolerances, such as the widely known but recently withdrawn ISO 2768 (~66.7% = 64 of 96), were applied to assign tolerances. Only five respondents explicitly mentioned the determination of tolerances using established methods (such as worst-case and statistical tolerance analysis). Finally, five respondents reported specifying tolerances in agreement with others, such as the customer or production engineers. Nevertheless, the participants were aware of the importance of deviations and tolerances as Figure 3a illustrates. The majority (~56.6% = 56 of 99, 3 abstentions) of them claimed that at least every second problem that arose during production, assembly and use of products was caused by deviations and was a tolerance-related issue. This result shows a clear concordance with the well-known and widely quoted findings of [58,59], stating that a “large number of design/process alterations resulting in 67% to 70% of all changes related to product dimensional variation in aerospace and automotive industries” [59].
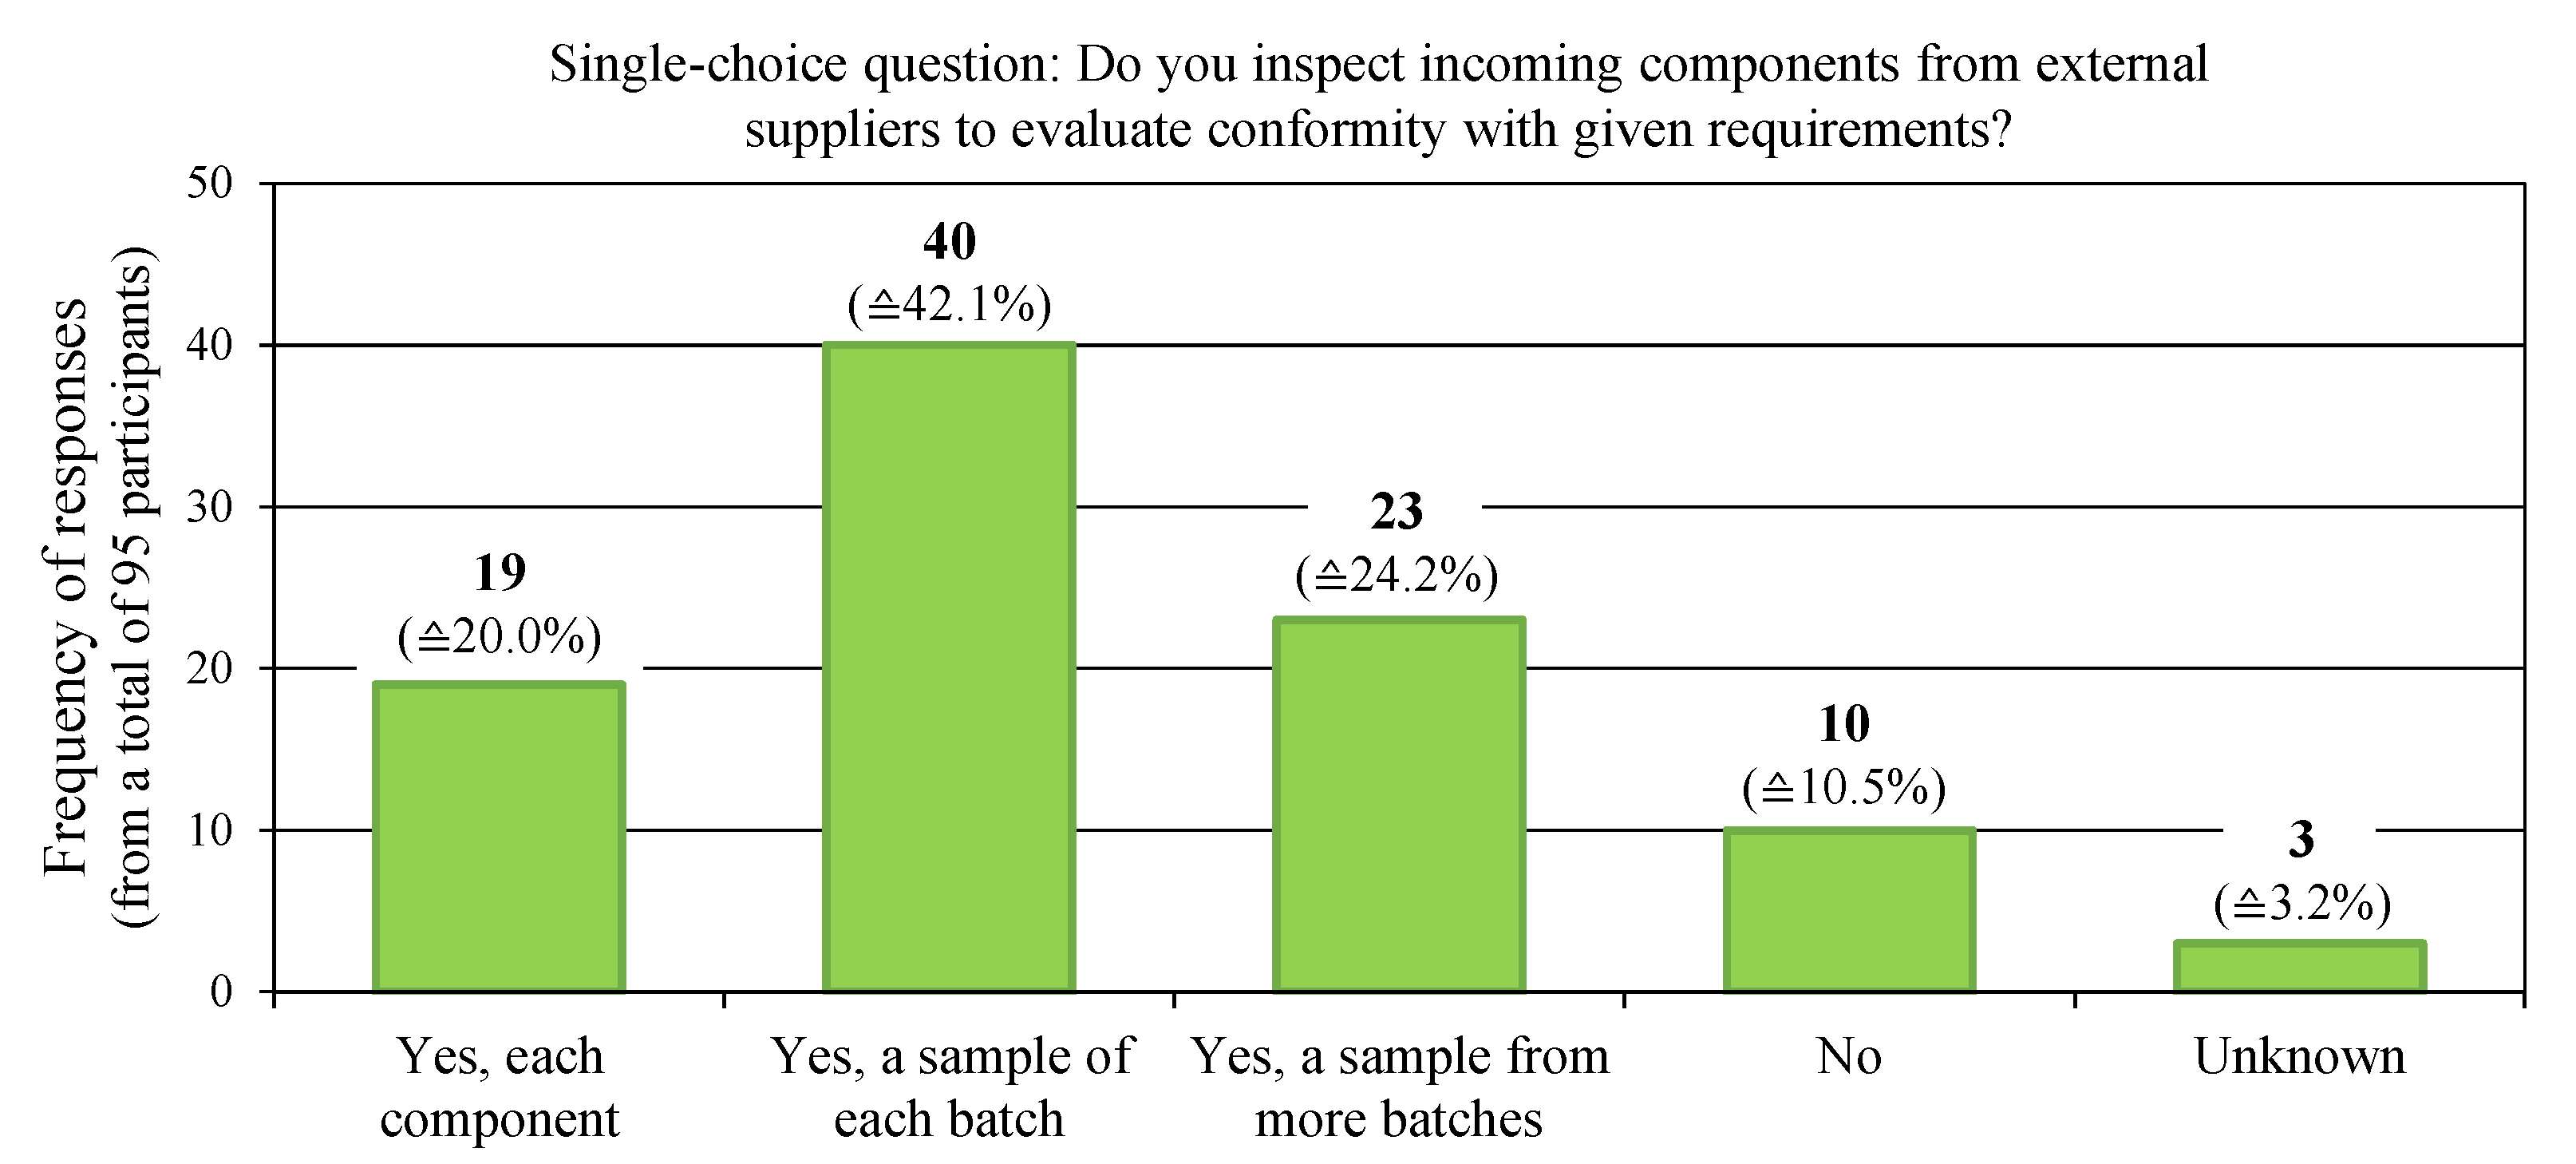
Most respondents (94% = 94 of 100, 2 abstentions) confirmed the high importance of accuracy of their products—both in their geometry and in their resulting key characteristics (see Figure 3b). It is not surprising that nearly all the participants (~97.0% = 96 of 99, 3 abstentions) aimed to minimize scraps and rejects of their products. Hence, companies today still face the everlasting tolerance conflict between tight tolerances (to meet high quality requirements) and large tolerances (to reduce complexity and scrap rates during manufacturing). Nevertheless, 31 of the 53 design engineers (≙~58.5%) played it safe (and confirmed their great respect for the specification of proper tolerances) by confessing that the assignment of tolerances was too tight (so-called “angst tolerances”) and thus caused higher manufacturing costs. Experts expect that the specification of tight tolerances goes hand in hand with a strict philosophy on quality inspection in companies. This expectation may be strengthened by the survey results of 95 participants (7 abstentions) that are detailed in Figure 4: while only 13 of these 95 respondents did not inspect incoming components from external suppliers, the remaining vast majority of 82 participants had already established procedures to inspect incoming components. This figure comprises those who inspected every single component delivered (19 of 95) as well as those who inspected a set of samples taken either from every individual batch (40 of 95) or from a larger number of batches (23 of 95).
In consequence, components were identified whose actual geometries did not meet the tolerances specified. Fortunately, 81% (=81 of 100, 2 abstentions) of the participants sorted out these parts and sent them for reworking (either in-house or at the supplier). However, this is obviously a cost-intensive procedure and thus not optimal for components of low cost. In the end, even this rework can still be in vain. Therefore, it is not surprising that 68 of 100 respondents (2 abstentions) finally considered these components as scrap. Moreover, three participants stated that they discussed with the customer to achieve a so-called deviation approval of the components or to coordinate expedient actions and plan further steps.
The results discussed reveal a great awareness of deviations and the relevance of proper tolerance engineering among the survey participants. Nevertheless, successful tolerance engineering is still a challenging field for engineers from all domains. This reaffirms the use of tolerance analyses (as early as possible) in order to specify valid tolerances—following the “first time right” philosophy of engineering design.
6. Current Use of Statistical Tolerance Analysis
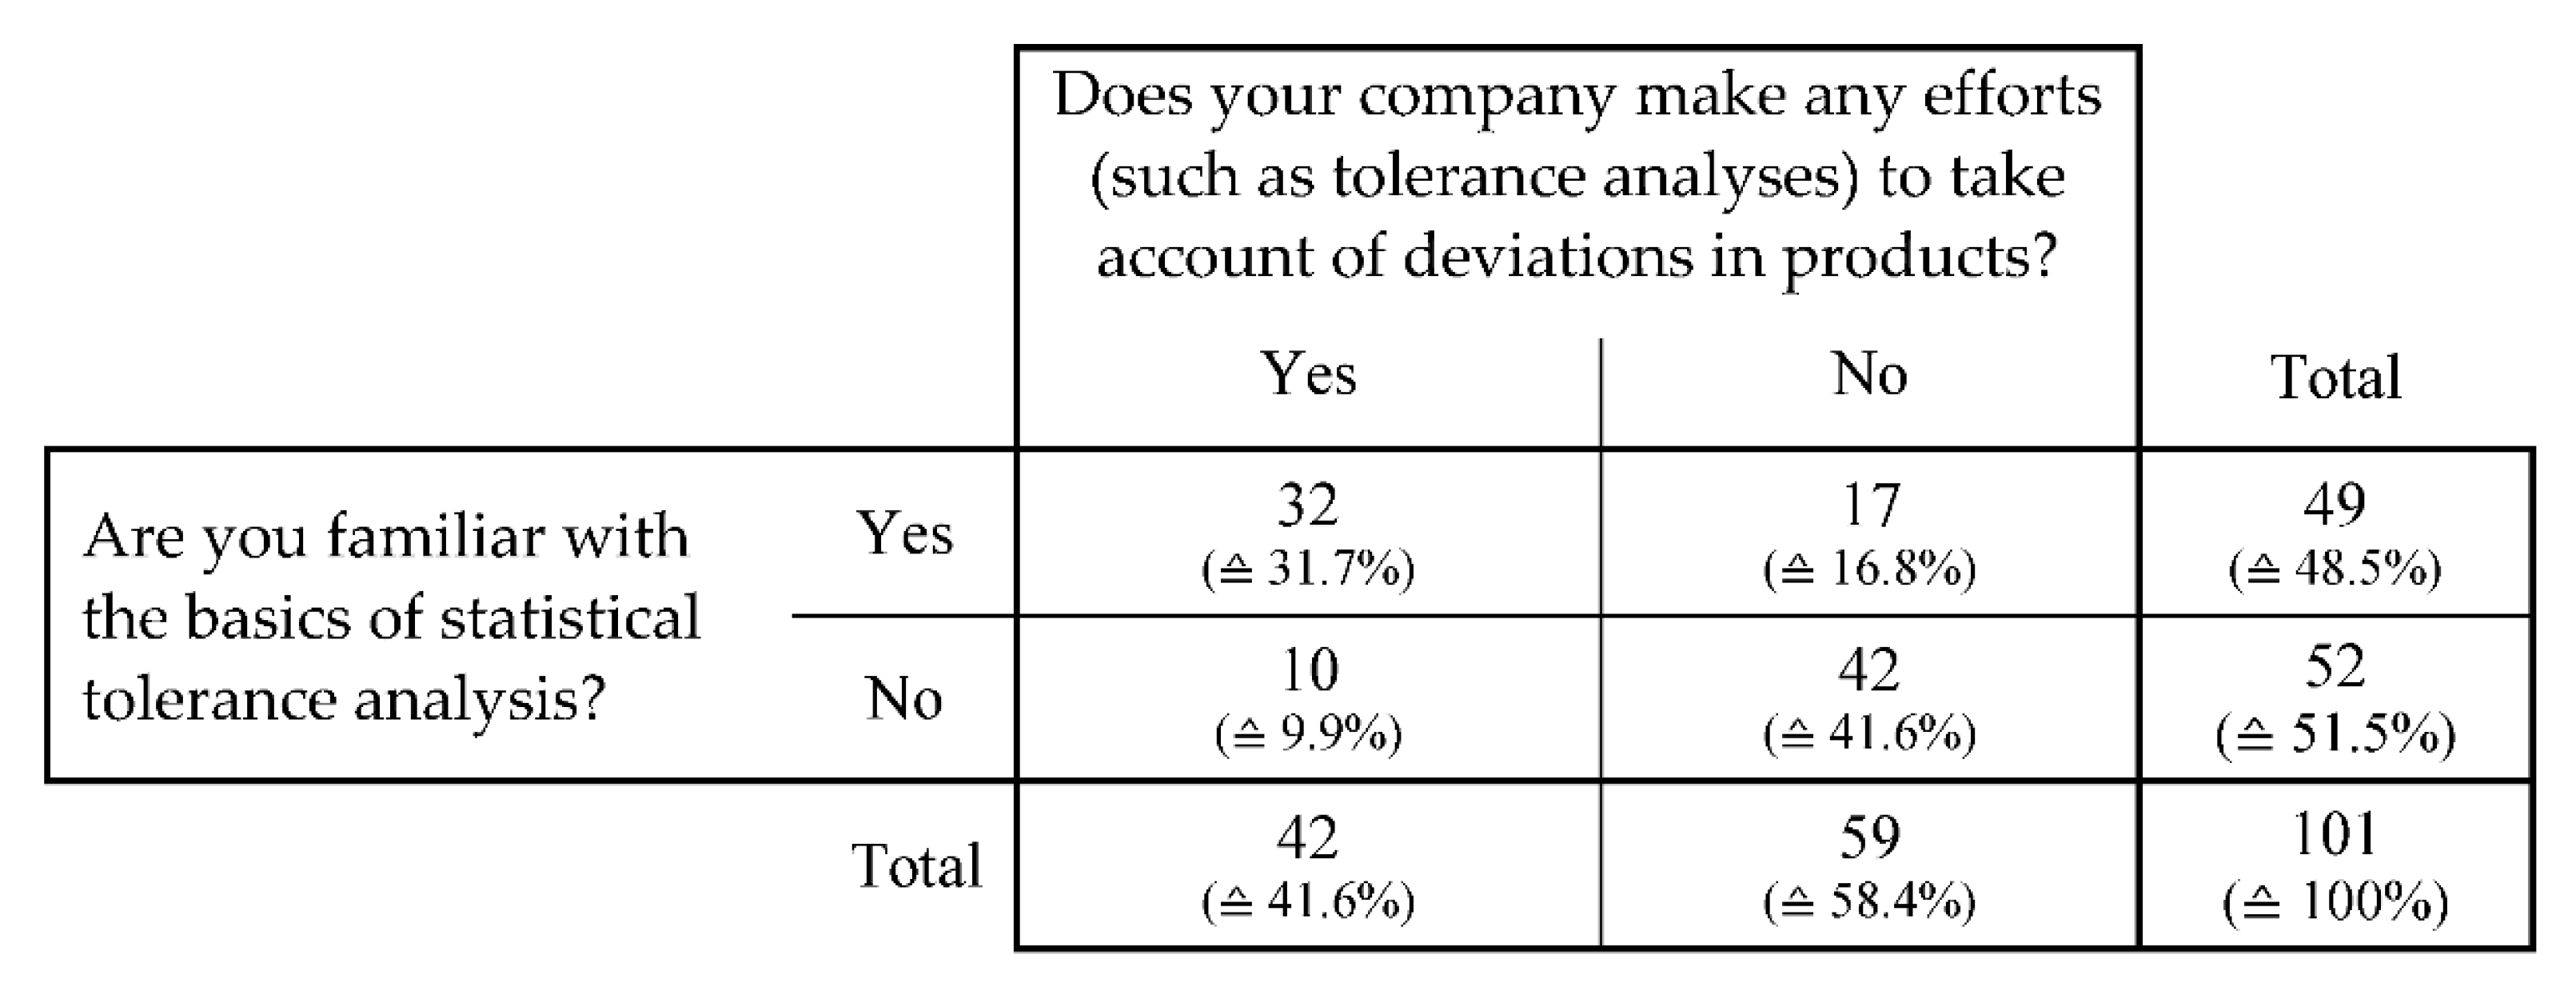
To date, the use of statistical tolerance simulations is by far a self-evident and established step in the German mechanical industry. Nevertheless, surprisingly, many companies (42 of 101, 1 abstention) were already making efforts to implement tolerance engineering, such as performing statistical tolerance analyses during product development in order to deal with deviations and thus to quantify their effects on the final product. It is not surprising that this ratio was particularly high among participants who worked in “research and development”. There, 7 out of 9 employees carried out statistical tolerance analyses regularly to evaluate and ensure product quality. In consequence, one may assume that there is a strong correlation between existing knowledge on tolerancing and the companies striving towards the implementation of adequate methods and tools during product development. The following cross table (Figure 5) details the results of two corresponding questions to assess this potential correlation.
The cross-evaluation proved that a direct correlation exists between the existence of certain knowledge of the basics of statistical tolerance analysis and its application during product development. The knowledge of statistical tolerance simulations was very low in companies that did not perform tolerance analyses (~19.2% = 10 of 52). In contrast, the majority of the 49 respondents (~65.3% = 32 of 49) whose companies performed statistical tolerance analysis were also familiar with the fundamentals of tolerancing and tolerance analysis. Hence, a strong correlation is obvious and undisputed. Furthermore, it can be concluded that employees (~51.5% = 52 vs. 49) are mostly confronted with statistical tolerance analysis for the first time when already working in German companies and thus years (or even decades) after graduating from university. This indicates a strong lack of lectures and seminars on tolerance engineering in the curricula at universities. Further considering the fact that only one in seven engineers in Germany is of a foreign nationality [60], the cause is actually attributed to the limited extent of lectures and seminars on tolerance engineering, specifically among German universities.
A closer look at the distribution of the participants’ departments further revealed that the fundamentals of tolerancing and statistical tolerance analysis were most widespread among engineers who assigned themselves to “research and development” as well as among participants from “management” (11 of 16). Further, almost every second employee from the remaining departments (engineering design (23 of 53), manufacturing (3 of 8) and quality management (5 of 11) was familiar with the fundamentals of tolerancing and statistical tolerance analysis. This rebuts a frequently given argument that professional expertise on tolerancing is exclusively present in the design department. Furthermore, it clarifies that (as a good approximation) about 50% of all engineers have adequate knowledge of the fundamentals of tolerancing as well as of statistical tolerance analysis—and this is across all departments.
Despite the pleasingly high ratio of engineers with proper knowledge of tolerancing among all departments, there was a strong consensus among the survey participants that the analysis and optimization of tolerance specifications are the responsibility of design engineers, who also shared this opinion. However, still not all design engineers performed tolerance analyses during their daily work. The main reasons are well known and obvious: about 66.7% (=10 of 15) of the design engineers who did not perform tolerance analyses designated (i) the lack of time and (ii) a significant lack of knowledge of the method of tolerance analysis (~46.7% = 7 of 15) as reasons for not carrying out tolerance analyses.
As previously stated, a variety of commercial software tools on computer-aided tolerancing (CAT) are available. These tools enable the design engineer to carry out statistical tolerance analyses of any given mechanical assembly in the virtual 3D-CAD environment. However, none of the respondents used such a commercial CAT software. Rather, of the 42 companies that performed tolerance analyses, only 20 relied on computer support. The majority (80% = 16 of 20) used the in-house developed Excel spreadsheets to carry out tolerance analyses. The remaining 22 respondents relied on the analytical calculation of tolerance stack-up problems by hand, using established and simple approaches, such as a worst-case tolerance analysis [61] or the “root-sum-square” approach [62].
Despite the intensive application of simple methods and tools in statistical tolerance analysis, the variety of different kinds of tolerances that are said to be taken into account in the industry are surprising and gratifying. The survey revealed that nearly all tolerance analysis carried out (~92.9% = 39 of 42) considers tolerances in size (so-called “plus/minus tolerances”). Further, form tolerances (~71.4% = 30 of 42), tolerances of orientation, location, run-out and profile (~59.0% = 29 of 42) as well as surface roughness (50% = 21 of 42) are taken into account when statistical tolerance analyses are performed in these companies. However, a critical consideration of the answers given leads to serious concerns about the quality and reliability of such statistical tolerance analyses. Further details concerning quality and reliability were not assessed in the survey.
The knowledge gained confirms that in German industry, the design engineer usually carries out tolerance calculations using rather simple and easy-to-use methods and tools. No tolerance specialist, whose main task is to detect and analyze tolerance problems with the help of commercial software, was found among the surveyed companies, and the role is thus at least very rare in German industrial companies.
Finally, the 28 companies that did not perform tolerance analyses but considered them useful and stated a need for them were asked about the reasons for not performing tolerance analyses (Figure 6). In particular, the lack of available time (~78.6% = 22 of 28) and no or insufficient knowledge of the necessary methods (~46.4% = 13 of 28) were mentioned. These results coincide with the results that were gained from the design engineers who did not perform tolerance analysis. Moreover, in ~42.9% (=12 of 28) of these companies, the use of statistical tolerance analyses was “not part of the company’s corporate policy”.
The 42 survey participants who performed tolerance analysis (=42 of 101; 1 abstention) felt rather confident in dealing with tolerances in their practice. Additionally, 55 of the remaining 59 survey participants (that did not perform tolerance analyses) assessed their handling of tolerances as comparatively good. However, ~61.4% (=35 of 55) of them could not state which tolerancing principle (independency principle vs. envelope principle) was applied in their company’s technical drawings. This result showed a clear concordance with the results Schütte gained in 1995 [47]. The survey revealed that 65% of the participants were not aware of the difference between the tolerancing principles. This is particularly surprising, since in Germany, the ISO GPS is the established standard in the industry, but also ~17.9% (=17 out of 95) of the participants stated that they applied the AMSE Y14.5 standard. These results justified serious concerns that the participants not performing tolerance analyses overestimated their ability to deal with deviations and tolerances.
7. Need and Potential of Statistical Tolerance Analysis
An overwhelming majority of 81.4% (=79 of 97; 5 abstentions) of the respondents agreed that the additional expenditure arising from establishing and performing statistical tolerance analyses was less than the additional expenditure arising from tolerance-related problems. This is particularly pleasing, since 54.4% of those (=43 of 79) had not yet carried out a tolerance analysis by themselves. This, therefore, showed that, even in companies that had not yet carried out a tolerance analysis, the benefits were already assessed as positive.
It is, therefore, not surprising that participants stated that an average of ~30.3% of complications and problems that appeared during the manufacturing, assembly and use of their products could be avoided if statistical tolerance analyses were carried out early on during design. This value even increased to ~40.5% when taking into account only those respondents who already performed tolerance analyses.
In addition, ~72.7% of the participating managing directors (=8 of 11), who were familiar with the basic methods of tolerance analysis, stated that the additional workload (to perform statistical tolerance analyses) was less than the workload that would result later from having to solve the unidentified tolerance-related problems. This value increased to 100% when the (seven) managing directors whose companies already carried out tolerance analyses were taken into account. In other words, all the managing directors who supported and/or had introduced tolerance analysis in their companies gained positive experiences and stated that tolerance engineering was key to company success. Furthermore, these seven managing directors stated that ~41.8% of the critical issues during manufacturing, assembly and use were caused by tolerance-related problems. This evaluation was nearly identical to the answers given by the participating design engineers. Based on these findings, we go so far as to postulate that the positive benefits of statistical tolerance analysis have been recognized and appreciated in German companies across different levels of the corporate hierarchy. This stands in contrast to the common complaint among researchers and industrial experts on tolerance engineering that tolerance analysis is not given the importance and resources it warrants by higher management. However, the authors are aware that the survey only provides one snapshot of a very limited selection of companies.
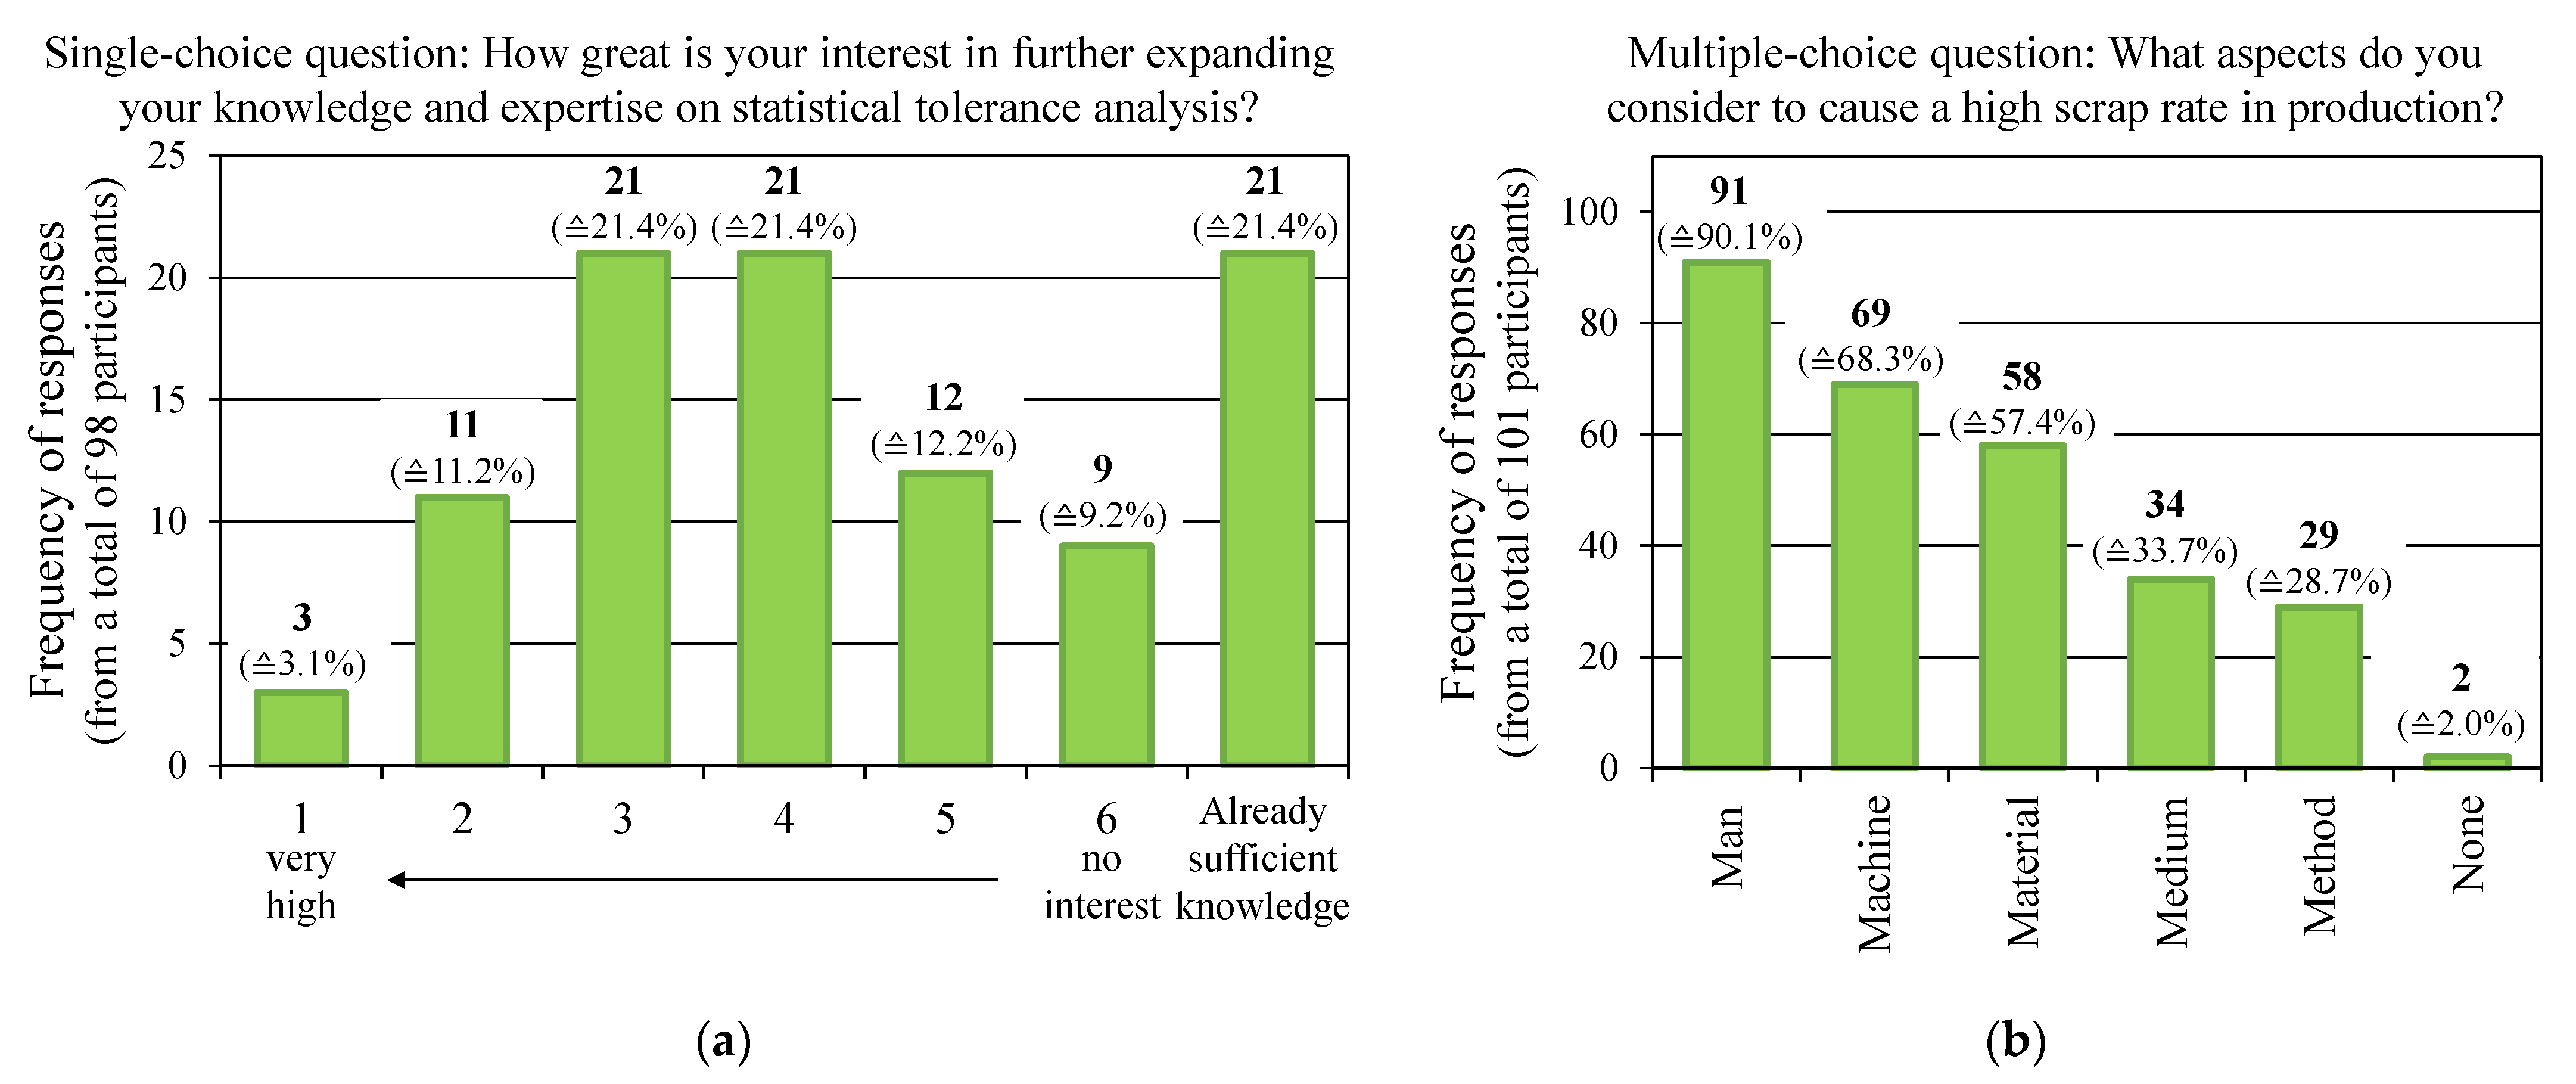
It is, therefore, not surprising that there was a clear interest among 98 respondents (4 abstentions) in learning the basics or deepening their knowledge of statistical tolerance analysis (see Figure 7a). Of these, 29 of the 50 respondents who were not familiar with the basics of statistical tolerance analysis stated a high interest. Nevertheless, even those who already knew the basics of statistical tolerance analysis were interested in expanding their knowledge further. Meanwhile, 21 of these 50 respondents already considered their current knowledge on statistical tolerance analysis to be sufficient to apply in everyday work. However, for sustainable and established tolerance engineering, it is essential to integrate tolerance analysis and tolerance synthesis into existing product development processes and milestone evaluations. When asked about opportunities for improvement in their companies, one respondent demanded the “firm integration of tolerance analyses into the development process”, in order to be able to “perform tolerance analysis early”, according to another participant. In addition, a production engineer requested “to be involved in projects as early as the design stage in order to influence tolerances at an early stage”. Nevertheless, respondents wanted “tools that are easy and quick to use”, since the required and available time is essential for the participants to decide on either performing or skipping a statistical tolerance analysis. This is even more relevant for most design engineers due to the fact that tolerance analysis is only a subordinate step and not the main activity of their daily work.
In consequence, it is essential that a tolerance expert (or at least an experienced key user) is available in companies to support engineers from all domains in dealing with tolerances. Fortunately, over the last decade, more companies have already appointed and established an in-house expert whose work has since then proven its worth.
Looking beyond the horizon, the effects of geometric deviations of components on the final product have already attracted the attention of design engineers and led to a pronounced awareness. Nevertheless, this is only the beginning, as one participant’s demand for an “increase in the quality consciousness of employees” illustrated. A common understanding of the influences of deviations (some also call them uncertainties, errors, faults, variations, shifts, malfunctions, etc.) on the functionality and aesthetic quality of a product has not yet been internalized everywhere. One participant highlighted the importance of the “creation of a uniform understanding” for the company’s success, which is also considered essential among researchers [44,63]. This becomes even more obvious when analyzing the results in Figure 7b, which ranks the aspects that respondents would consider if the scrap rate during production were to exceed its given limit. The participants chose from Ishikawa’s “5 Ms”. While 91 of 101 respondents (1 abstention) still considered “man” as a relevant influencing factor, the aspects “medium” (34 of 101) and “method” (29 of 101) were significantly less frequent. Consequently, engineers should take a holistic view of their product and all the interactions that arise during the product’s entire life cycle. The approaches of robust design, as well as the perspectives and methods of total quality management and lean management are promising. Fortunately, current research already integrates tolerance engineering in superordinate philosophies (such as in uncertainty management [64,65], robust design [43,66] and Industry 4.0 [67,68,69,70].
8. Conclusions and Recommendations
The survey reveals that tolerance engineering is not implemented as a matter of course among German companies. So, the systematic and reliable introduction of statistical tolerance analyses to existing development processes was found only in the minority of these companies. This may seem discouraging. However, the survey clearly proved the participants’ high awareness of the effects of deviations and tolerances on the aesthetic quality and/or the functionality of their products. This goes hand in hand with a strong motivation of the participants to expand their knowledge and enhance their skills in proper tolerancing. Furthermore, they felt encouraged by successful applications of statistical tolerance analyses to strive for the installation of holistic tolerance engineering in their companies’ philosophies and people’s mindsets.
However, despite all the achievements in industrial practice and among academics, dealing with deviations and tolerances is still a tiresome and unpleasant task, which usually receives insufficient attention. Sadly, in recent past decades, little has changed in the reputation and image of tolerance engineering. Moreover, this is despite the fact that over the last 30 years, engineering design has dramatically changed-from hand-drawn technical drawings to the introduction of 3D-CAD and the progressing digitalization of processes in the context of Industry 4.0. Pessimists could claim that the discipline of tolerance engineering and its community of researchers and industrial experts have been missing developments and trends and have thus continually lost contact with millions of engineers in companies worldwide.
However, it is too easy to simply blame the tolerance community. Rather, there seems to be a deep-seated, fundamental issue that outweighs all of the barriers mentioned herein and leads to the fact that tolerance engineering has always been negatively burdened across disciplines and hierarchies. The survey puts us on the right track, as one aspect is recurring throughout the survey results—the enormous complexity and extremely high scope of methods, tools as well as the ISO GPS standards. The tolerance community currently finds itself in a dilemma, henceforth referred to as the “dilemma of complexity and user-friendliness”, forcing the community to choose between two (equally unpleasant) approaches, to strive for a framework on tolerance engineering that is either of the following:
- Holistic and universal (precise and detailed, but complex and not user-friendly);
- Easily applied and adopted (less complex and more user-friendly, but simplified and ambiguous).
It is indisputable (especially when taking into account the scientometric analysis of Seminars and Conferences on CAT in [71]) that the tolerance community has silently chosen to focus on a holistic and universal approach to tolerance engineering.
This is not surprising, since academic researchers drive progress in methods and tools as well as the revision of existing standards. These tend to a strong academic ambition for a holistic understanding. However, this has allowed a gap to emerge that is becoming increasingly larger, since the engineers in industry are still struggling with the application of proper tolerance engineering. It is hardly surprising that the ISO GPS standards are met with great reluctance and skepticism due to their immense scope and complexity. The engineers simply lack the time, support, motivation and interest to get involved in such a comprehensive set of standards. Moreover, tolerancing has always been an unpopular discipline among engineers worldwide.
It is undisputed that revisions and extensions of the ISO GPS standards lead to a better and more accurate tolerance design. Nevertheless, the primary goal of the tolerance community is that the methods, tools and standards of tolerance engineering are ultimately applied in industrial practice and thus ultimately become a matter of course. Still, according to Mathieu, “industrial needs have to be the driver for research” [72]. Hence, we make an empathic appeal to the tolerance community to “keep it simple”.
Author Contributions
Conceptualization, M.S.J.W.; methodology, M.S.J.W. and C.K.; software, M.S.J.W. and C.K.; validation, M.S.J.W. and C.K.; formal analysis, M.S.J.W. and C.K.; investigation, M.S.J.W. and C.K.; data curation, M.S.J.W. and C.K.; writing—original draft preparation, M.S.J.W. and B.H.; writing—review and editing, M.S.J.W.; visualization, M.S.J.W.; supervision, M.S.J.W. and S.W.; project administration, M.S.J.W. and S.W. All authors have read and agreed to the published version of the manuscript.
Funding
This research received no external funding.
Institutional Review Board Statement
Ethical review and approval were waived for this study as it did not include any ethical issues and the questionnaire did not collect any personally identifiable data.
Informed Consent Statement
Participant consent was waived due to the nature of research. The invitation of the survey emphasizes that participation is voluntary, and the participant could leave the survey at any time during the process. The participants were also verbally informed that the data will only be used for research and a self-imposed publication embargo of eight years on selected questions is applied.
Data Availability Statement
The questionnaire (interactive PDF) is available on Github. The data presented in this study are available on request from the corresponding author.
Conflicts of Interest
The authors declare no conflict of interest.
References
- Srinivasan, V. Elements of computational metrology. In Computer-Aided Design and Manufacturing; Janardan, R., Smid, M., Dutta, D., Eds.; American Mathematical Society: Providence, RI, USA, 2005; pp. 79–116. [Google Scholar]
- United States Bankruptcy Court for the Southern District of New York. Case No. 09-50026. Amended Ex. B to Motion For An Order Granting Authority To File Late Class Proofs Of Claim, Dkt. No. 13806. #132. p. 59. Available online: https://www.docketbird.com/court-documents/Motors-Liquidation-Company/Exhibit-1-Late-Class-Claims/nysb-1:2009-bk-50026-14695-001 (accessed on 30 January 2021).
- Krogstie, L.; Walter, M.S.J.; Wartzack, S.; Martinsen, K. Towards a more comprehensive understanding of tolerance engineering research importance. Procedia CIRP 2015, 27, 29–34. [Google Scholar] [CrossRef] [Green Version]
- Walter, M.S.J. Toleranzanalyse und Toleranzsynthese Abweichungsbehafteter Mechanismen; VDI Verlag: Dusseldorf, Germany, 2016. [Google Scholar]
- Shewhart, W.A. Applications of statistical methods to manufacturing problems. J. Frankl. Inst. 1938, 226, 163–186. [Google Scholar] [CrossRef]
- Alder, K. Innovation and amnesia: Engineering rationality and the fate of interchangeable parts manufacturing in France. Technol. Cult. 1997, 38, 273–311. [Google Scholar] [CrossRef]
- Shewhart, W.A. Statistical Method from the Viewpoint of Quality Control, re-print of 1st ed.; Dover: New York, NY, USA, 1986. [Google Scholar]
- Schuh, R. Von DIN-zu ISA-Passungen, Wälzlagerpassungen. Ein Lehr-und Nachschlageheft für Werkstatt und Schule, 2nd ed.; C.F. Müller Verlag: Karlsruhe, Germany, 1947. [Google Scholar]
- International Organization for Standardization. Geometrical Product Specifications (GPS)-ISO Code System for Tolerances on Linear Sizes—Part 1: Basis of Tolerances, Deviations and Fits (ISO 286-1:2010 + Cor 1:2013); German Version EN ISO 286-1:2010 + AC:2013; ISO: Geneva, Switzerland, 2019. [Google Scholar]
- Voelcker, H.B. The current state of affairs in dimensional tolerancing. Integr. Manuf. Syst. 1998, 9, 205–217. [Google Scholar] [CrossRef]
- Shewhart, W.A. The application of statistics as an aid in maintaining quality of a manufactured product. J. Am. Stat. Assoc. 1925, 152, 546–548. [Google Scholar] [CrossRef]
- Shewhart, W.A. Economic aspects of engineering applications of statistical methods. J. Frankl. Inst. 1928, 205, 395–405. [Google Scholar] [CrossRef]
- Bates, E.E. How to increase tolerances and obtain closer fits. The Iron Age, 3 July 1947; 58–61. [Google Scholar]
- Mansoor, E.M. The application of probability to tolerances used in engineering designs. Proc. Inst. Mech. Eng. 1963, 178, 29–39. [Google Scholar] [CrossRef]
- Evans, D.H. Statistical tolerancing: The state of the art—Part III. Shifts and drifts. J. Qual. Technol. 1975, 7, 72–76. [Google Scholar] [CrossRef]
- Evans, D.H. Statistical tolerancing: The state of the art—Part II. Methods for estimating moments. J. Qual. Technol. 1975, 7, 1–12. [Google Scholar] [CrossRef]
- Evans, D.H. Statistical tolerancing: The state of the art—Part I. Background. J. Qual. Technol. 1974, 6, 188–195. [Google Scholar] [CrossRef]
- Bandler, J.W. Optimization of design tolerances using nonlinear programming. J. Optim. Theory Appl. 1974, 14, 99–114. [Google Scholar] [CrossRef]
- Ostwald, P.F.; Huang, J. A method for optimal tolerance selection. J. Manuf. Sci. Eng. 1997, 99, 558–565. [Google Scholar] [CrossRef]
- Grey, D.S. Tolerance sensitivity and optimization. Appl. Opt. 1970, 9, 523–526. [Google Scholar] [CrossRef]
- Bennett, G.; Gupta, L.C. Least-cost tolerances I. Int. J. Prod. Res. 1970, 8, 65–74. [Google Scholar] [CrossRef]
- Bennett, G.; Gupta, L.C. Least-cost tolerances II. Int. J. Prod. Res. 1970, 8, 169–182. [Google Scholar] [CrossRef]
- Sutherland, G.H.; Roth, B. Mechanism design: Accounting for manufacturing tolerances and costs in function generation problems. J. Eng. Ind. Trans. ASME 1975, 97, 283–286. [Google Scholar] [CrossRef]
- Spotts, M.F. Allocation of tolerances to minimize cost of assembly. J. Eng. Ind. 1973, 95, 762–764. [Google Scholar] [CrossRef]
- Speckhart, F.H. Calculation of tolerance based on a minimum cost approach. J. Eng. Ind. 1972, 94, 447–453. [Google Scholar] [CrossRef]
- Walter, M.S.J. Dimensional and geometrical tolerances in mechanical engineering—A historical review. Mach. Des. 2019, 11, 67–74. [Google Scholar]
- Roy, U.; Liu, C.R.; Woo, T.C. Review of dimensioning and tolerancing: Representation and processing. Comput. Aided Des. 1991, 23, 466–483. [Google Scholar] [CrossRef] [Green Version]
- Craig, M. Dimensional management versus tolerance assignment. Assem. Autom. 1996, 16, 12–16. [Google Scholar] [CrossRef]
- Salomons, O.; van Houten, F.; Kals, H. Current status of CAT systems. In Geometric Design Tolerancing; El Maraghy, H.A., Ed.; Springer: Dordrecht, The Netherlands, 1998; pp. 438–452. [Google Scholar]
- Clozel, P.; Rance, P.-A. MECAmaster: A tool for assembly simulation from early design, industrial approach. In Geometric Tolerancing of Products; Villeneuve, F., Mathieu, L., Eds.; Wiley: Hoboken, NJ, USA, 2010; pp. 241–273. [Google Scholar]
- Prisco, U.; Giorleo, G. Overview of current CAT systems. Integr. Comput. Aided Eng. 2002, 9, 373–387. [Google Scholar] [CrossRef]
- Rhahli, Y.; Bosch, M.; Anselmetti, B.; Eynard, B. A survey on tolerancing task integration in PLM. In Proceedings of the 9th International Conference on Integrated design and Manufacturing in Mechanical Engineering IDMME 2010, Bordeaux, France, 20–22 October 2010; p. 26. [Google Scholar]
- Hallmann, M.; Schleich, B.; Wartzack, S. From tolerance allocation to tolerance-cost optimization: A comprehensive literature review. Int. J. Adv. Manuf. Technol. 2020, 107, 4859–4912. [Google Scholar] [CrossRef]
- ElMaraghy, H.A. Geometric Design Tolerancing: Theories, Standards and Applications, 1st ed.; Springer: Boston, MA, USA, 1998; pp. 411–464. [Google Scholar]
- Siguardarson, N.; Eifler, T.; Ebro, M. The applicability of CAT tools in industry—Boundaries and challenges in new methodology to analyze the functional and physical architecture. Procedia CIRP 2018, 75, 261–266. [Google Scholar] [CrossRef]
- Kosec, P.; Skec, S.; Miler, D. A comparison of the tolerance analysis methods in the open-loop assembly. Adv. Prod. Eng. Manag. 2020, 15, 44–56. [Google Scholar] [CrossRef] [Green Version]
- Morse, E.P.; Shakarji, C.M.; Srinivasan, V. A brief analysis of recent ISO tolerancing standards and their potential impact on digitization of manufacturing. Procedia CIRP 2018, 75, 11–18. [Google Scholar] [CrossRef]
- Nielsen, H.S. Recent developments in International Organization for Assembly Automation Standardization geometrical product specification standards and strategic plans for future work. Proc. Inst. Mech. Eng. B 2013, 207, 643–649. [Google Scholar] [CrossRef]
- Martinsen, K. Industry 4.0 closed loop tolerance engineering maturity evaluation. In Advanced Manufacturing and Automation VIII, Proceedings of the IWAMA 2018, Changzhou, China, 20–21 September 2018; Lecture Notes in Electrical Engineering; Wang, K., Wang, Y., Strandhagen, J., Yu, T., Eds.; Springer: Singapore, 2019; Volume 484, pp. 3–11. [Google Scholar]
- Praveen, O.V.S.; Dileep, B.; Gayatri, S.; Deepak Lawrence, K.; Manu, R. Automated tolerance analysis of mechanical assembly using STEP AP 242 managed model-based 3D engineering. In Industry 4.0 and Advanced Manufacturing; Lecture Notes in Mechanical Engineering; Chakrabarti, A., Arora, M., Eds.; Springer: Singapore, 2021; pp. 149–157. [Google Scholar]
- He, C.; Zhang, S.; Qiu, L.; Liu, X.; Wang, Z. Assembly Tolerance Design Based on Skin Model Shapes Considering Processing Feature Degradation. Appl. Sci. 2019, 9, 3216. [Google Scholar] [CrossRef] [Green Version]
- Emmer, C.; Glaesner, K.-H.; Pfouga, A.; Stjepandić, J. Advances in 3D Measurement Data Management for Industry 4.0. Procedia Manuf. 2017, 11, 1335–1342. [Google Scholar] [CrossRef]
- Eifler, T.; Howard, T.J. The importance of robust design methodology. Res. Eng. Des. 2018, 29, 39–53. [Google Scholar] [CrossRef] [Green Version]
- Krogstie, L. Closed Loop Tolerance Engineering. Ph.D. Thesis, Norwegian University of Science and Technology, Trondheim, Norway, 2015. [Google Scholar]
- Krogstie, L.; Martinsen, K.; Andersen, B. Approaching the devil in the details; A survey for improving tolerance engineering practice. Procedia CIRP 2014, 17, 230–235. [Google Scholar] [CrossRef] [Green Version]
- Susanto, A. Industriebefragung zur Anwendungssituation der Normen DIN 7184 Teil 1, DIN 2300, DIN 7150 Teil 2 und DIN 7168 Teil 2. DIN Mitt. 1985, 64, 350–356. [Google Scholar]
- Schütte, W. Methodische Form- und Lagetolerierung: Ein Werkzeug zur Qualitätsgerechten Produktbeschreibung. Thesis, University Paderborn, Paderborn, Germany, 1995. [Google Scholar]
- Page, T. A study into the use of tolerance analysis in the mechanical design of medical devices. Int. J. Des. Eng. 2015, 6, 116–139. [Google Scholar] [CrossRef] [Green Version]
- Sersch, A.; Gust, P. Empirische Untersuchung zur Überprüfung des Anwendungsgrades der Geometrischen Produktspezifikation (GPS). In Proceedings of the 8. Workshop Arbeitsgemeinschaft Toleranzmanagement (ATOL) “Toleranzmanagement und -Simulation in der Praxis”, Krefeld, Germany, March 2018. [Google Scholar] [CrossRef]
- Flick, U. Introducing Research Methodology: A beginner’s Guide to Doing a Research Project, 2nd ed.; Sage: London, UK, 2015. [Google Scholar]
- Schnell, R.; Hill, P.B.; Esser, E. Methoden der Empirischen Sozialforschung, 11th ed.; De Gruyter Oldenbourg: Berlin, Germany, 2018. [Google Scholar]
- Pepels, W. Marketing: Lehr- und Handbuch, 4th ed.; Oldenbourg Wissenschaftsverlag: Munich, Germany, 2004. [Google Scholar]
- Raab-Steiner, E.; Benesch, M. Der Fragebogen: Von der Forschungsidee zur SPSS/PASW-Auswertung, 2nd ed.; UTB: Stuttgart, Germany, 2010. [Google Scholar]
- Hofte-Frankenhauser, K.T.; Wälthy, H.-F. Marktforschung, 3rd ed.; Compendio: Zurich, Switzerland, 2011. [Google Scholar]
- Leitfanden Statistische Auswertung. Available online: http://www.2ask.de/media/1/10/2/23/25/3b44548aa4f7b046/Leitfaden_Statistik.pdf (accessed on 20 September 2014).
- European Commission. Commission Recommendation of 6 May 2003 Concerning the Definition of Micro, Small and Medium-Sized Enterprises (Notified Under Document Number C(2003) 1422) (OJ L 124, 20.5.2003, pp. 36–41). Available online: https://eur-lex.europa.eu/legal-content/EN/TXT/?uri=LEGISSUM%3An26026 (accessed on 21 January 2021).
- Jorden, W. Form- und Lagetoleranzen: Handbuch für Studium und Praxis, 6th ed.; Hanser: Munich, Germany, 2009. [Google Scholar]
- Shalon, D.; Gossard, D.; Ulrich, K.; Fitzpatrick, D. Representing Geometric Variations in Complex Structural Assemblies on CAD Systems. In Proceedings of the ASME Advances in Design Automation, 18th Annual ASME Design Automation Conference, Scottsdale, AZ, USA, 13–16 September 1992; Volume 2, pp. 121–132. [Google Scholar]
- Huang, W.; Ceglarek, D.; Zhou, Z. Tolerance analysis for design of multistage manufacturing processes using Number-Theoretical Net Method (NT-net). Int. J. Flex. Manuf. Syst. 2004, 16, 65–90. [Google Scholar] [CrossRef] [Green Version]
- Verein Deutscher Ingenieure e.V. 2014: Ingenieure auf Einen Blick—Erwerbstätigkeit, Migration, Regionale Zentren; VDI Verlag: Dusseldorf, Germany, 2014; p. 15. [Google Scholar]
- Chase, K.W.; Greenwood, H.W. Design issues in mechanical tolerance analysis. Manuf. Rev. 1998, 1, 50–59. [Google Scholar]
- Ettinger, W.J.; Bartky, W. Basis for determining manufacturing tolerances. Product Engineering, August 1936; 297–300. [Google Scholar]
- Aidibe, A.; Tahan, S.A.; Kamali Nejad, M. Interlaboratory Empirical Reproducibility Study Based on a GD&T Benchmark. Appl. Sci. 2020, 10, 4704. [Google Scholar]
- Walter, M.; Storch, M.; Wartzack, S. On uncertainties in simulations in engineering design: A statistical tolerance analysis application. Simulation 2014, 90, 547–559. [Google Scholar] [CrossRef]
- Morse, E.; Dantan, J.-Y.; Anwer, N.; Söderberg, R.; Moroni, G.; Qureshi, A.; Jiang, X.; Mathieu, L. Tolerancing: Managing uncertainty from conceptual design to final product. CIRP Ann. 2018, 67, 695–717. [Google Scholar] [CrossRef] [Green Version]
- Ebro, M.; Howard, T.J. Robust design principles for reducing variation in functional performance. J. Eng. Des. 2016, 27, 75–92. [Google Scholar] [CrossRef] [Green Version]
- Romero Subirón, F.; Rosado Castellano, P.; Bruscas Bellido, G.M.; Benavent Nácher, S. Feature-Based Framework for Inspection Process Planning. Materials 2018, 11, 1504. [Google Scholar] [CrossRef] [PubMed] [Green Version]
- Schleich, B.; Wärmefjord, K.; Söderberg, R.; Wartzack, S. Geometrical Variations Management 4.0: Towards next Generation Geometry Assurance. Procedia CIRP 2018, 75, 3–10. [Google Scholar] [CrossRef]
- Boorla, S.M.; Bjarklev, K.; Eifler, T.; Howard, T.J.; McMahon, C.A. Industry 4.0—A challenge for variation simulation tools for mechanical assemblies. Adv. Comput. Des. 2019, 4, 43–52. [Google Scholar]
- Polini, W.; Corrado, A. A Unique Model to Estimate Geometric Deviations in Drilling and Milling Due to Two Uncertainty Sources. Appl. Sci. 2021, 11, 1996. [Google Scholar] [CrossRef]
- Garaizar, O.R.; Anwer, N.; Mathieu, L.; Qiao, L. Exploring the proceedings of Computer Aided Tolerancing CIRP Seminars: A scientometric analysis. In Proceedings of the 13th CIRP Conference on Computer Aided Tolerancing (CAT 2014), Hangzhou, China, 11–14 May 2014. Keynote Paper. [Google Scholar]
- Mathieu, L.; Villeneuve, F. New trends in tolerancing, the GD&T French Research Group point of view. In Proceedings of the 11th CIRP International Seminar on Computer Aided Tolerancing (CIRP CAT 2009), Annecy, France, 26–27 March 2009; Université de Savoie: Annecy, France, 2009. [Google Scholar]
Figure 1.
Distribution of questionnaires sent (left) and returned (right) by the 16 federal states of Germany.
Figure 1.
Distribution of questionnaires sent (left) and returned (right) by the 16 federal states of Germany.

Figure 2.
Classification of companies according to their size (=count of employees).

Figure 3.
(a) Response of 99 participants to the (single–choice) question: “What percentage of problems that arise during production, assembly and use of products are caused by deviations and are tolerance-related issues?”; (b) response of participants to selected (single–choice) questions.
Figure 3.
(a) Response of 99 participants to the (single–choice) question: “What percentage of problems that arise during production, assembly and use of products are caused by deviations and are tolerance-related issues?”; (b) response of participants to selected (single–choice) questions.

Figure 4.
Response of 95 participants to the (single-choice) question: “Do you inspect incoming components from external suppliers to evaluate conformity with given requirements?”.
Figure 4.
Response of 95 participants to the (single-choice) question: “Do you inspect incoming components from external suppliers to evaluate conformity with given requirements?”.

Figure 5.
Cross-evaluation of the response of 101 participants to the (single-choice) question: “Are you familiar with the basics of statistical tolerance analysis?” and the (single-choice) question: “Does your company make any efforts (such as tolerance analyses) to take account of deviations in products?”.

Figure 6.
Response of 28 participants to the (multiple-choice) question: “Why does your company not make any efforts (such as tolerance analyses) to take account of deviations in products?” (multiple answers were allowed).
Figure 6.
Response of 28 participants to the (multiple-choice) question: “Why does your company not make any efforts (such as tolerance analyses) to take account of deviations in products?” (multiple answers were allowed).

Figure 7.
(a) Response of 98 participants to the (single-choice) question: “How great is your interest in further expanding your knowledge and expertise on statistical tolerance analysis?”; (b) response of 101 participants to the (multiple-choice) question: “What aspects do you consider to cause a high scrap rate in production?”.

Publisher’s Note: MDPI stays neutral with regard to jurisdictional claims in published maps and institutional affiliations. |
© 2021 by the authors. Licensee MDPI, Basel, Switzerland. This article is an open access article distributed under the terms and conditions of the Creative Commons Attribution (CC BY) license (http://creativecommons.org/licenses/by/4.0/).
Share and Cite
MDPI and ACS Style
Walter, M.S.J.; Klein, C.; Heling, B.; Wartzack, S. Statistical Tolerance Analysis—A Survey on Awareness, Use and Need in German Industry. Appl. Sci. 2021, 11, 2622. https://0-doi-org.brum.beds.ac.uk/10.3390/app11062622
AMA Style
Walter MSJ, Klein C, Heling B, Wartzack S. Statistical Tolerance Analysis—A Survey on Awareness, Use and Need in German Industry. Applied Sciences. 2021; 11(6):2622. https://0-doi-org.brum.beds.ac.uk/10.3390/app11062622
Chicago/Turabian StyleWalter, Michael S. J., Christina Klein, Björn Heling, and Sandro Wartzack. 2021. "Statistical Tolerance Analysis—A Survey on Awareness, Use and Need in German Industry" Applied Sciences 11, no. 6: 2622. https://0-doi-org.brum.beds.ac.uk/10.3390/app11062622
Note that from the first issue of 2016, this journal uses article numbers instead of page numbers. See further details here.