Article

Subjective Effects of Sound Absorption and Investigation of Reverberation Times in Modern Japanese Dwellings

1
Department of Architecture and Living Design, Junior College Nihon University, Funabashi 274-8501, Japan
2
MISAWA HOMES Co., Ltd., Tokyo 163-0833, Japan
*
Author to whom correspondence should be addressed.
Submission received: 31 January 2021 / Revised: 8 March 2021 / Accepted: 9 March 2021 / Published: 17 March 2021
(This article belongs to the Special Issue Advances in Room Acoustics of Non-performing Public Spaces)

Abstract

:
This study aimed to reveal the influence of sound absorption in general dwellings on the subjective evaluation of acoustics. First, a subjective experiment was conducted using a full-scale room model. The results indicate that the feelings of silence and serenity can be experienced at absorption coefficients above 0.17, particularly above 0.25. Additionally, we used the recorded binaural sounds for a subjective test instead of using a full-scale room model. This trial showed that the reverberance, feeling of silence, and feeling of serenity can also be evaluated using a headphone listening test. We also measured the reverberation times and recorded the sound environments in three bedrooms, three living and dining (LD) rooms, and three child rooms in modern Japanese dwellings. The average absorption coefficients of the LD and child rooms were lower than 0.17, in the range of 500 Hz to 4 kHz. Therefore, we analyzed the subjective effect of absorption through a psychological test using binaural recorded sounds. The bedrooms with absorption coefficients of 0.18–0.23 were significantly less reverberant, quieter, and more serene than the other rooms.

1. Introduction

Wooden dwellings are very popular in Japan because most part of the territory of the country is covered by forests and mountains. Old and traditional Japanese dwellings tolerated small gaps at high temperatures and humidity. However, recent technologies provide flexible plans as well as airtightness and adiabaticity in modern dwellings. Additionally, with the change in Japanese lifestyle, cloths on plaster boards have been used for the finish of walls and ceilings, instead of thin wooden boards, whereas for the floor, wood is commonly used instead of “tatami” (straw and rush mats). These changes may lead to longer reverberation times and higher average sound pressure levels in modern Japanese dwellings. Under these circumstances, Japanese dwellings could be expected to require different specifications with respect to not only airborne insulation from the outside but also room acoustics.
Studies have been conducted on the room acoustic specifications of general dwellings. Parkin et al. reported that the reverberation time of a general furnished living room is approximately 0.5 s in the main frequency range of 100–3150 Hz [1]. Jackson et al. measured the reverberation time for 50 living rooms and 50 kitchens and reported average reverberation times of 0.51 and 0.68 s at 1 kHz, respectively [2]. Burgress et al. investigated 47 living rooms and 51 bedrooms and reported reverberation times of 0.33 and 0.28 s at 500 Hz, respectively [3]. They stated that the decrease in reverberation time could be attributed to the increasing number of carpets laid on the floors from the 1950s to the 1980s. Bradley measured acoustic parameters of 602 multiple residence homes in Canada and reported that the average reverberation time was close to 0.4 s with a standard deviation of less than 0.1 s in the frequency range of 100–4000 Hz [4].
In the 2000s, Díaz et al. measured 11687 rooms (8246 bedrooms, 3211 living rooms, and 230 unfurnished rooms) and revealed the relationship between room volume and reverberation time (or equivalent absorption area) in general Spanish dwellings [5,6]. To estimate the airborne insulation of rooms, ISO16283 provides the standardized level difference, Dn,T, and the standardized impact sound level, Ln,T, calculated using the reverberation time, T, of the receiving room [7,8]. Nowicka et al. measured the reverberation times of living rooms, bathrooms, and kitchens in Poland for five years and reported that the reverberation times of furnished rooms under 55 m3 were below 0.5 s [9]. Mašović et al. measured 91 furnished rooms and 151 unfurnished rooms and reported that the average reverberation times of furnished rooms under and over 50 m3 were approximately 0.5 s and 0.7 s, respectively, and that of rooms with any volume under 100 Hz was approximately 1.0 s [10]. These results are consistent with those reported by Díaz et al. [5,6]. Kylliäinen et al. reported that the average reverberation time of 207 furnished living rooms was 0.5 s at 125–4000 Hz [11,12]. Jeon et al. also reported the reverberation times of unfurnished and furnished living rooms in Korea [13,14]. These studies focused on quantitative evaluations of rooms of dwellings by using acoustic objective parameters.
Subjective studies concerning the sound environment in dwellings have been conducted from the viewpoint of soundscapes. The term soundscape has been defined by ISO12913–1 [15] as the “acoustic environment as perceived or experienced and/or understood by a person or people, in context”. To date, researchers have focused on urban studies and outdoor environments. The soundscape can be described in at least two dimensions, pleasantness and eventfulness, and also by the eight soundscape items, pleasant, annoying, chaotic, calm, vibrant, monotonous, uneventful, and eventful, proposed by ISO/TS 12913–2 and –3 [16,17] (adapted from Ref. [18]). These interests have recently spread to indoor contexts [19,20,21] such as care facilities [22,23], public libraries [24,25], restaurants [26,27,28], and commuting hubs [29]. Studies on the soundscape of living rooms in residences are strongly related to our study [30,31,32,33]. Torresin et al. conducted indoor soundscape listening tests using a mockup living room and derived eight affective responses instead of the former eight items. From this study, the item “calm” could be related to “private, controlled” [33]. Moreover, there have been many studies on loudness and annoyance caused by floor impact or airborne insulation [34,35,36,37,38,39,40,41,42,43,44,45,46,47,48,49,50,51,52]. However, it is uncertain whether sound absorption treatment is subjectively effective in providing such a “calm” or “private, controlled” living room. If sound absorption has such subjective effects, the amount of effective absorption must be determined by subjective experiments. However, no extensive studies have been conducted on the subjective effects of absorption in ordinary dwelling rooms.
We analyzed the influence of the average absorption coefficient (equivalent absorption area) on the acoustic subjective evaluations using full-scale room models [53]. Subsequently, we used binaural recorded sources by a dummy-head microphone system for the subjective evaluation of these rooms because the analysis of full-scale room models requires a long time period and considerable human resources [54]. Based on these experimental outcomes, we measured the acoustic characteristics of real rooms in modern Japanese dwellings and recorded binaural sound sources [55]. We also conducted a subjective analysis using the recorded sources in our laboratory [55]. In this study, we derived the average absorption coefficient required to provide feelings of silence and serenity based on a series of subjective tests and acoustic measurements previously performed and detailed in our papers written in Japanese [53,54,55]. Additionally, we discussed the relationship between background noise level and sound absorption of the room to create feelings of silence and serenity.

2. Subjective Experiment Using Full-Scale Room Models

2.1. Purpose

A pair of rooms with different absorption areas was used for the comparison. We investigated whether participants could feel the auditorily differences between them, such as reverberance or some spatial impression differences. To clarify the required absorption coefficient to provide the desired effectiveness to the occupant, the experimenter changed the absorption area in some steps.

2.2. Specification of Evaluation Spaces

Two axisymmetric evaluation spaces and front chamber shown in Figure 1a were set in an area of 3.5 × 3.5 m2 in a dwelling built using a wooden panel system. The evaluation spaces had 12.5-mm-thick wooden floor, and the walls and ceiling were finished with a 12.5-mm-thick plasterboard on the plywood board. The floor finish of the front chamber was a plywood board. Figure 2 presents five absorption patterns, from “A” to “E”. Polyester nonwoven panels with a thickness of 50 mm and density of 32 kg/m3 were used as absorbers [56].
Before the subjective experiment, the reverberation time of each pattern and that of the front chamber were measured according to ISO3382–2 [57]. A loudspeaker (YAMAHA MSR100) was located on the floor at position “S” as shown in Figure 1b and exposed a time-stretched pulse (TSP) signal. Microphones (ONOSOKKI MI-1235, class 1) were located at five point marked positions with a height of 1.5 m. The absorption coefficients were calculated using the measurement results (Table 1 and Figure 3). The reverberation times gradually decreased as the absorption area increased from pattern “A” to “E”. Pattern “O” indicates the result of the front chamber. The higher absorption coefficients at 125 Hz than at 250 Hz in all patterns were caused by the plywood board plane vibration.

2.3. Procedure of the Subjective Experiment

Nakaya’s modified method of Scheffé’s paired comparisons [58,59,60,61,62,63,64] was used for the subjective experiment. The evaluation items are listed in Table 2. The participants experienced the two evaluation spaces in sequence and rated the difference in the evaluation items between the two spaces, as shown in Figure 4. Initially, the examiner leads a participant from position “X” in the front chamber to position “Y” in evaluation space 1. The participant experiences this space by generating noise or voice, and then returns to position “X” and moves to position “Z” with the help of the examiner. In sequence, the participant experiences evaluation space 2. After experiencing both spaces, the participant returns to position “X” and states the auditory difference between the two spaces on a scale of −3 to 3 (seven-grade evaluation) for the eight items listed in Table 2.
Ten pairs were used for the comparison. To reduce the order effect, two series of ten-pair sequences (one is EA, EC, DB, DC, …, CB, and the other is of the opposite order: AE, CE, BD, CD, …, BC), excluding equal patterns (AA, BB, …, EE) were set. The sequence of the experiment was randomized, and we ensured that either side was not always less absorptive than the other side. Six people with normal hearing participated in the experiment (age: 20–30s). Three participants were examined in one sequence and the other three were examined in the other sequence. The examiner individually explained the type of the test, approach, procedure, and risk to all participants before the test in all subjective experiments. A blindfold (eye mask) and glove were consensually worn by the participants to eliminate the influence of vision and tactile sensation. Before the experiment, the experimenter indicated to the participant that he/she was allowed to generate noises or speak in the evaluation space and that he/she could experience the pair of spaces again in case of finding difficulties to evaluate the spaces. As shown in Figure 4, the recorded fan noise of the kitchen, as a sound that commonly exists in houses, was transmitted from the two loudspeakers located at the corners of the floor in the front chamber with a 33-dB A-weighted level.

2.4. Results and Discussion

Figure 5 shows the results of the subjective experiments on a psychological scale. Error bars represent 5% significant yardsticks. We can evaluate statistical significance (p < 0.05) between two average cores by comparing with the other’s yardstick. The largest difference in psychological value was observed for “reverberance”. All evaluation spaces were found to have significantly different reverberances. The participants could distinguish one space from the others. With the increase in the absorber area, the psychological values of “feeling of silence”, “feeling of serenity”, “sense of quality”, and “user preference” also tended to increase. However, the changing ranges of these items were not larger than that of “reverberance”. Regarding “feeling of silence” and “sense of quality”, the largest change in psychological value was observed between evaluation spaces “C” and “D”. These results indicate that a certain threshold of absorption area must be exceeded to feel the difference in these sensations.
An analysis of variance (ANOVA) was performed between the average absorption coefficients of the five patterns and eight evaluation items. The main effect of changing the absorption area was not significant in terms of “sense of room volume”, F (4, 20) = 2.20, p = 0.11 and “feeling of oppression”, F (4, 20) = 0.28, p = 0.89, but showed 1% significance for the other six evaluation items. The correlation coefficients of these six items were calculated and are listed in Table 3. The absorption installation may influence “difference in feeling of silence”, r(5) = 0.81, p < 0.01, “reverberance”, r(5) = −0.94, p < 0.01, ”feeling of silence”, r(5) = 0.97, p < 0.01, “feeling of serenity”, r(5) = 0.98, p < 0.01, “sense of quality”, r(5) = 0.94, p < 0.01, and “user preference”, r(5) = 0.90, p < 0.01 (all values at 500 Hz).
We analyzed the relationship between objective measurements and subjective experiments in detail. Only for “reverberance”, the absorption pattern “B” with an arithmetic average of the absorption coefficients of 0.12 from 500 to 4000 Hz significantly differed from pattern “A”. This shows that an absorption coefficient of 0.12 is not sufficient to create the auditory effect of the room. Similarly, the absorption pattern “C” (arithmetic average of absorption coefficient: 0.17) could provide a lower “reverberance” and higher “feeling of serenity” and “user preference”. However, it could not provide a “feeling of silence” and “sense of quality”. Absorption pattern “D” (arithmetic average of the absorption coefficient: 0.25) could provide a higher “feeling of silence” and “sense of quality”, considerably lower “reverberance”, and considerably higher “feeling of serenity” and “user preference”. Thus, the effect of the absorbent material was increased at an absorption coefficient of 0.17 and was further increased at an absorption coefficient of 0.25.

3. Subjective Evaluation Using Recording Sources and Headphone Listening

The subjective test described in the previous section using a full-scale room model requires considerable time and human resources to switch the absorption pattern. To reduce these resources and provide a more convenient comparison, we recorded the sound fields of five absorption patterns with a dummy-head microphone system and replayed binaural resources with headphones.

3.1. Binaural Recording

The sound fields of the five absorption patterns, i.e., “A”–“E”, in the full-scale room model were recorded using a dummy-head microphone system. In each pattern, the environmental sound (kitchen fan noise) was played at 33 dB, as in the former subjective experiment. A KEMAR 45BA dummy head and two GRAS 40AD high-sensitivity microphones were used for recording. The height of the ear external canal was 1.5 m. The sounds were digitized using 24-bit, 48-kHz pulse-code modulation. As shown in Figure 6a, the experimenter held the dummy head with both hands and moved from the front chamber to evaluation space 1, generating a stepping sound. In the former experiment, the participants were allowed to generate noise and voice, and almost all spoke something to verify the sound. In this case, if the experimenter spoke something and recorded it, the participant would have to listen to the experimenter’s voice. However, it is slightly strange to listen to another person’s voice for a subjective test. Thus, we decided to record only the sound of the steps. We aimed to provide a constant moving pitch and walking speed throughout the recording. However, the repeatability may not be perfect.

3.2. Procedure of the Subjective Experiment

The subjective test was analyzed using headphone reproduction in a very quiet traditional Japanese room with 10 sheets of “tatami” mats (approximately 18.2 m2), where the A-weighted 10-s equivalent continuous sound pressure level (LAeq,10s) was 22.7 dB. The recorded sounds were reproduced from a personal computer to a SENNHEISER H25-1 headphone through an RME Fireface UC as a Digital to Analog (DA) converter. The reproduction level was manually adjusted to be almost equal to the level in the full-scale room model, and the volume control was fixed to reproduce the level difference of the absorption pattern. Before the experiment, the headphones were placed on the dummy head, and the sound sources of the five absorption patterns were reproduced and recorded. The A-weighted single-event sound exposure levels (LEA) of absorption patterns A–E were 72.6, 67.4, 64.2, 60.0, and 56.3 dB, respectively. The frequency characteristics of the last step in each absorption pattern are shown in Figure 6b.
The subjective experiment using headphones was organized with Nakaya’s modified method of Scheffé’s paired comparisons, with the 10 pairs, as in the former test for the full-scale room model. The subjective items were the same as those in the former test, as shown in Table 2. The participants, who different from those in the former test, were six people in their 20s. The experimenter instructed that the object for evaluation was not “the room you can see” but “the sound you hear”. The participants rated the difference between a pair of sound sets for the eight items and were allowed to listen to a pair of sound sets again if they wanted.

3.3. Results

The results of the subjective tests are shown in Figure 7. Error bars represent 5% significant yardsticks. All results of all items with headphones follow a similar tendency to that of the full-scale room model in Figure 5. Table 4 shows the results of the ANOVA on the main effects of the absorption coefficient on the eight evaluation items. “Sense of room volume”, F (4, 20) = 2.20, p = 0.11 and “feeling of oppression”, F (4, 20) = 0.28, p = 0.89 in the full-scale room model test and “sense of quality”, F (4, 20) = 1.66, p = 0.20 in the headphone listening were not significant. “Difference in feeling of silence”, “reverberance”, “feeling of silence”, and “feeling of serenity” were significant with respect to the absorption coefficient as well as in the result of the former test with the full-scale room model. The experimenter conducted interviews with all the participants after the experiment. The “sense of quality” was not significant in all sound fields because a participant group (three participants) replied a “feeling of silence and appropriate reverberance” for the space “E”, whereas the other group replied “feeling a high ceiling as in an entrance of a high graded hotel” for the space “A”. These responses were also obtained for “user preference”, which explains the yardstick of “user preference” being as large as that of “sense of quality”.
The correlation coefficients between the psychological scores and the absorption coefficients of the five patterns were calculated. The calculation results are presented in Table 5. These five items are strongly correlated with the absorption coefficient. Thus, the primitive sensations, such as “reverberance”, “feeling of silence”, and “feeling of serenity”, were stably evaluated using the headphone test with recorded resources by the dummy head as well as using the full-scale room model. In contrast, the “sense of quality” and “user preference” depended on the preference of the participant.

4. Reverberation Times in Dwellings

4.1. Measurement

After these subjective experiments, we conducted acoustic investigations in modern Japanese dwellings. Three model houses for sale, with a wooden panel system, were selected for the investigation. The measurement was planned in bedrooms, living and dining (LD) combined rooms, and child rooms of each house for comparison. All walls and ceilings of these rooms were finished with vinyl cloths on plaster boards. Other specifications of the rooms are listed in Table 6. Photographs of these nine furnished rooms are presented in Figure 8, Figure 9 and Figure 10. The LD room of House A had a raised seating area, and that of House B had a part of double height. The impulse responses were measured using a dodecahedral loudspeaker and a TSP signal. The reverberation times T30 were calculated according to ISO3382-2 [58] using these responses. Subsequently, the average absorption coefficients of the nine rooms were calculated.

4.2. Results

The results of the reverberation time measurements are presented in Table 7 and Figure 11. The absorption coefficients are presented in Table 7 and Figure 12. The reverberation times were 0.34–0.51 s in the bedrooms, slightly longer at mid and high frequency bands; 0.52–0.84 s in the LD rooms, and also longer at mid and high frequency bands except that of room C; and 0.36–0.67 s in the child rooms, with larger values at mid and high frequency bands. We compared these results to the averages of 11,457 furnished room reverberation times reported by Díaz et al. [5,6] at 500 Hz and 1 kHz, and observed that the values were very similar. However, the reverberation times of the LD rooms and child rooms were approximately 0.1–0.2 s longer than that reported by Díaz et al., because these rooms were finished by wooden floors. At 125 and 250 Hz, the values of this measurement were approximately 0.1–0.2 s shorter than that reported by Díaz et al. The panel absorption of the walls and ceilings might be the main reason.
The absorption coefficients of the bedroom in House C were larger than those in the other houses. The shorter reverberation times were caused by the two beds and the thick-piled carpet in the bedroom. The values of the LD rooms did not differ among the three houses. The high absorption coefficient values at 125 and 250 Hz were due to the panel absorption of the walls and ceilings. The values of the child room in House B were slightly larger than those in the other rooms because the room had a bed.

5. Subjective Evaluation of Recoding Sources in the Dwellings

5.1. Binaural Recordings

The binaural recording was organized such that the experimenter held the dummy head and walked through the room with a foot-stepping sound, as shown in Figure 13. The following procedure was adopted: the experimenter wore room shoes, walked from the outside into the back of the room, stopped at a certain position, stepped a few times at that position, turned around, and went back to the outside through the same way. In sequence, the stepping sound of the experimenter and background noise were recorded in nine rooms (three rooms in three houses). The same experimenter followed this procedure in the nine rooms. The other experimenters removed their shoes to avoid stepping sounds. The 24-bit/48-kHz digital recording settings and volume control were fixed throughout the nine recordings to compare the sounds.

5.2. Procedure of the Subjective Experiment

The subjective experiment was conducted in a quiet room and consisted of headphone listening. The test sounds were reproduced from a personal computer to a SENNHEISER H25-1 headphone through the RME Fireface UC as the DA converter. The reproduction level was controlled to be the same as that in the recorded rooms and was fixed throughout the test by the experimenter.
A total of 36 pairs of comparison sets were used for subjective tests. The test was based on Nakaya’s modified Scheffé’s paired comparison method. The seven evaluation items except “difference in feeling of silence between the inside and outside”, as shown in Table 2, were selected. The participants were 13 people (age: 20s). The experimenter did not instruct them on the specifications and photographs of the nine recording rooms and instructed them to evaluate only by sound listening. The participants rated the degrees of difference in seven steps and were allowed to listen to a pair of sound sets again if they wanted.

5.3. Results and Discussion

The psychological scores of the nine rooms for each evaluation item are shown in Figure 14, the results of the ANOVA of the psychological scores and main effects for each evaluation item are shown in Table 8, and the correlation coefficients between psychological scores and absorption coefficients in each frequency band are shown in Table 9. The ANOVA shows a 5% significance for “feeling of oppression” F (8, 96) = 2.20, p = 0.04, and 1% significance for the other six items. The participants were able to evaluate the differences in the acoustic environments of each dwelling room. Seven items, not including “feeling of oppression”, r(9) = −0.05 at 500 Hz, had high correlations at all octave bands. Table 9 indicates that the increase in the absorption coefficient decreased “reverberance”, r(9) = −0.79, and increased the “feeling of silence”, r(9) = 0.88, and “feeling of serenity”, r(9) = 0.84 (at 500 Hz).
The arithmetic means of the absorption coefficients at 500 Hz to 4 kHz in each room were calculated. Those of the bedrooms were 0.18 to 0.23, those of the LD rooms were 0.13 to 0.14, and those of the child rooms were 0.13 to 0.17. Only those of the bedrooms exceeded 0.17. As shown in Figure 14, the “reverberance” values of the bedrooms were lower than those of the other rooms, whereas the “feeling of silence” and “feeling of serenity” values were higher. This supports the results of the subjective experiment in Section 2 and Section 3.

6. Discussion

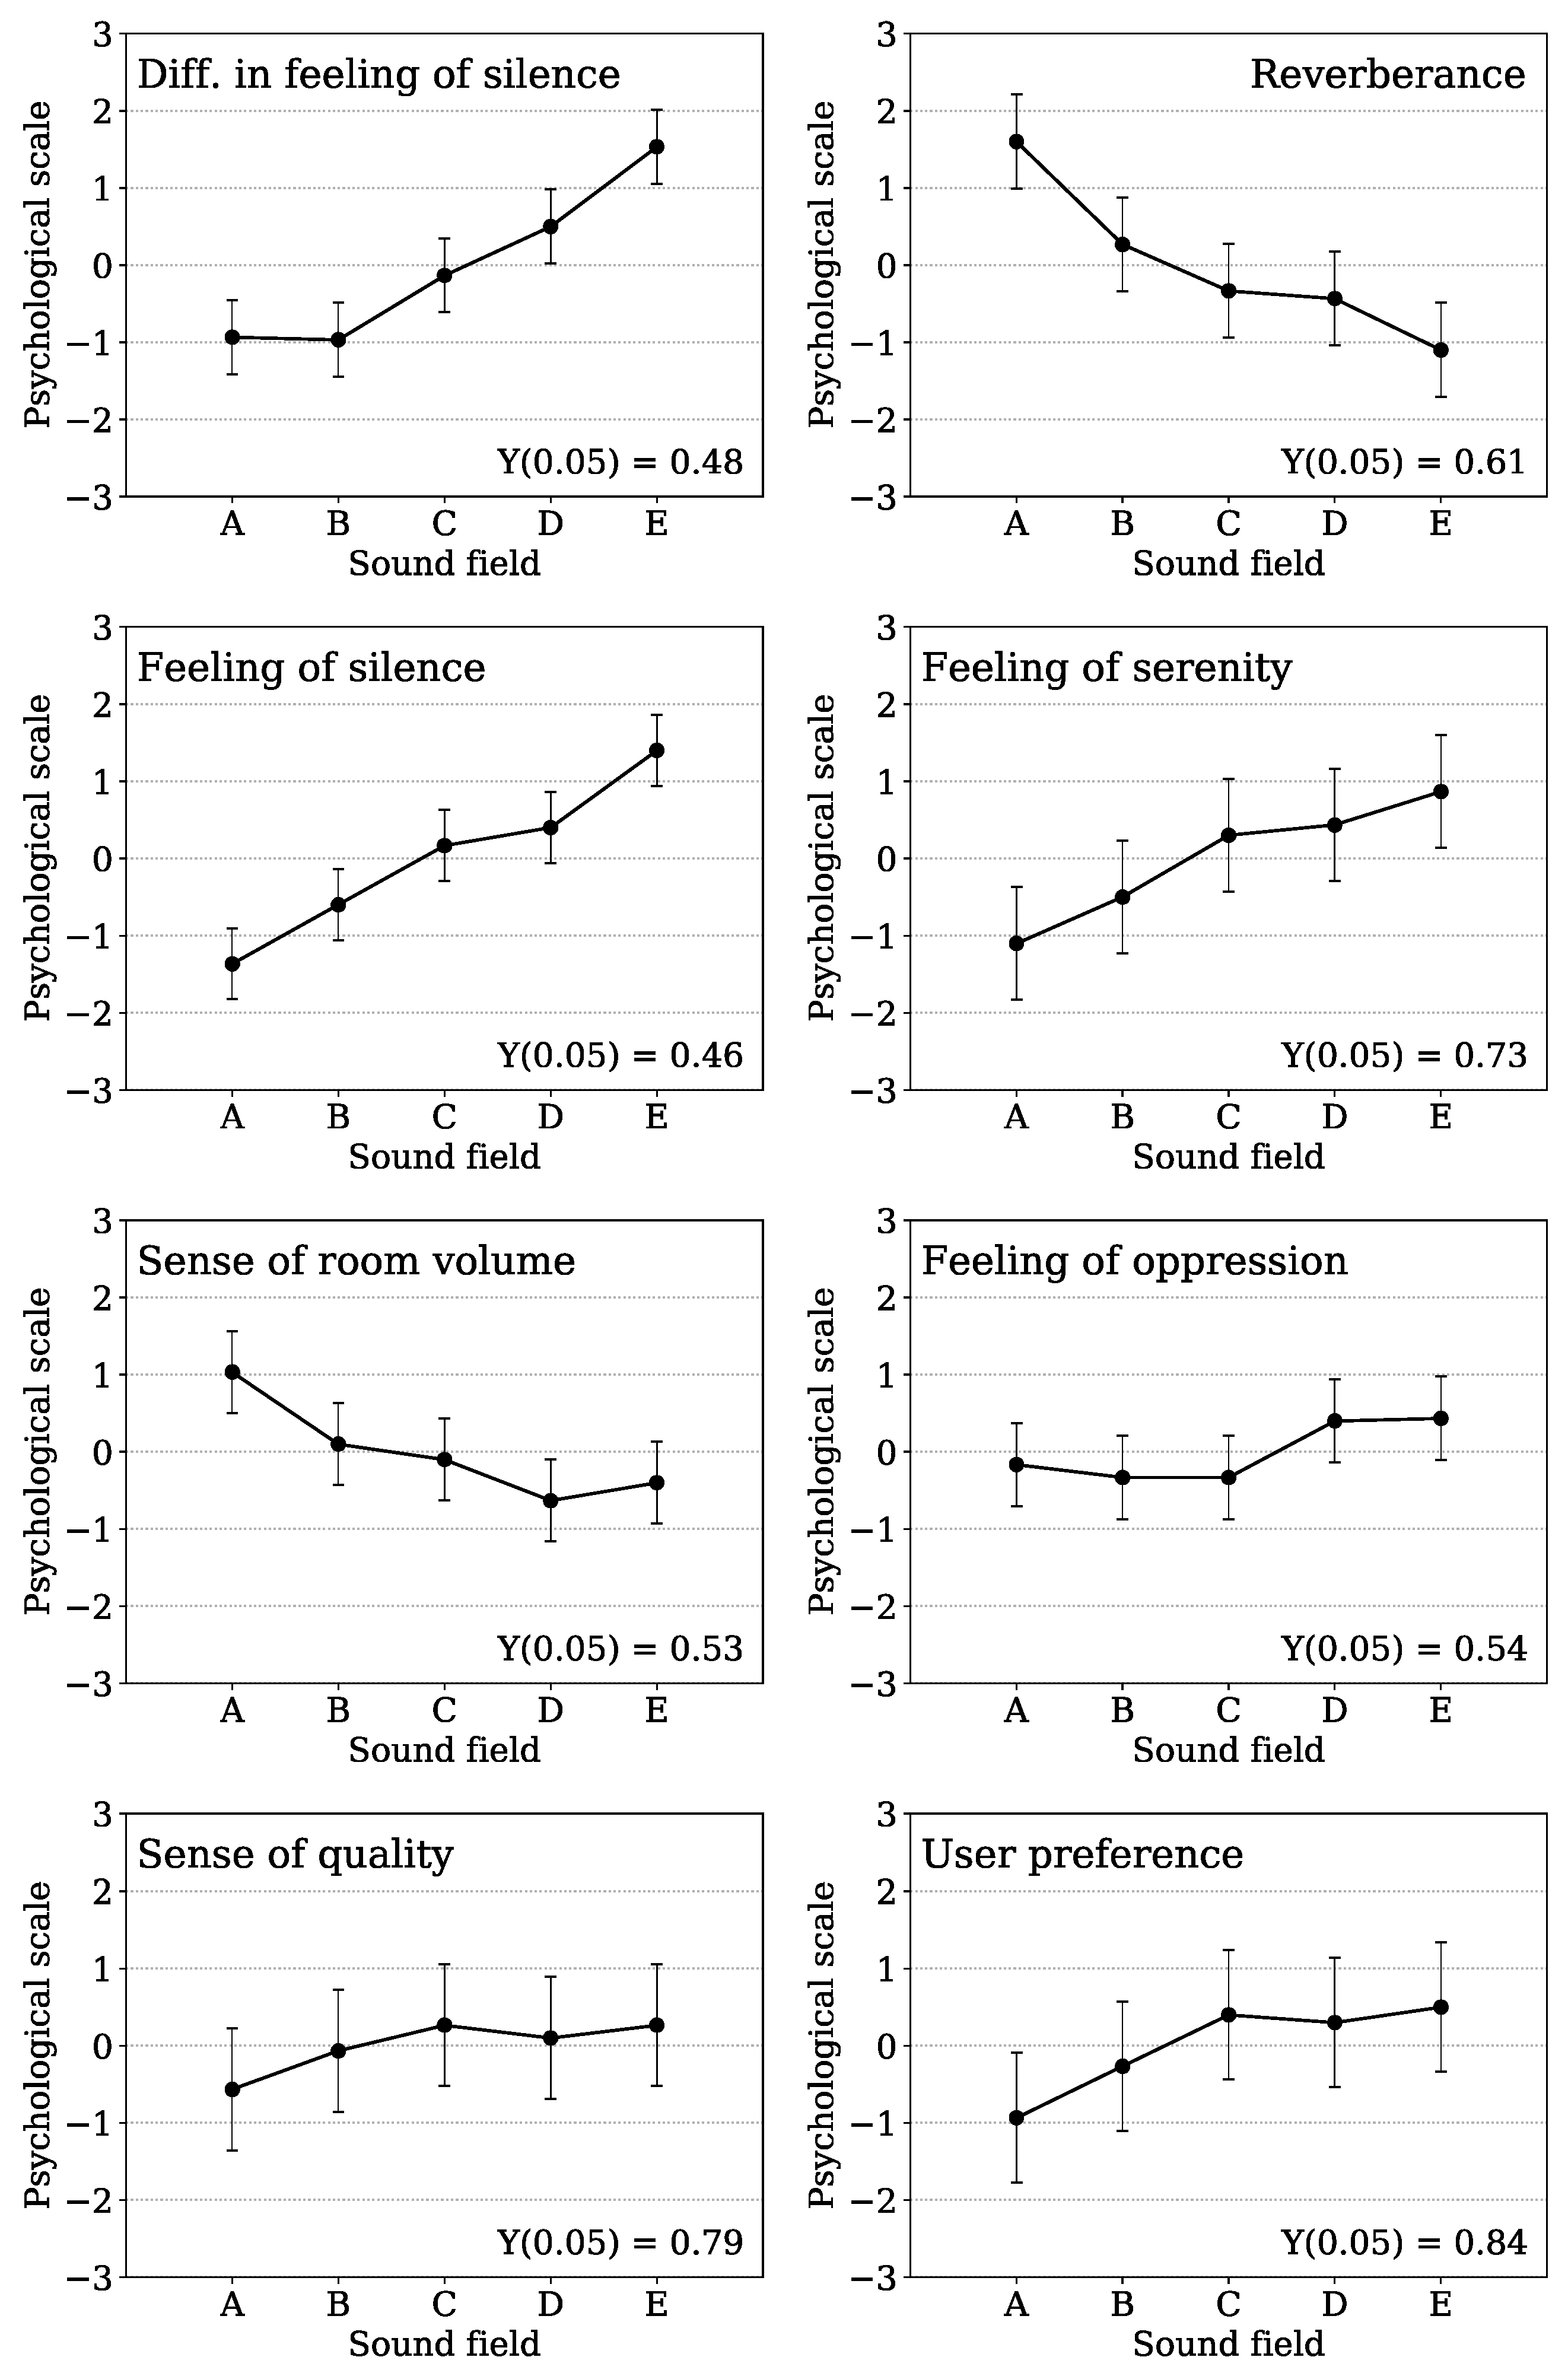
The aforementioned “feeling of silence” and “feeling of serenity” were clearly affected by the absorption coefficients of the room. However, the “feeling of silence” is commonly known to be influenced by the absolute sound pressure level as well. In this section, we discuss the relationship between the “feeling of silence” and background noise level.
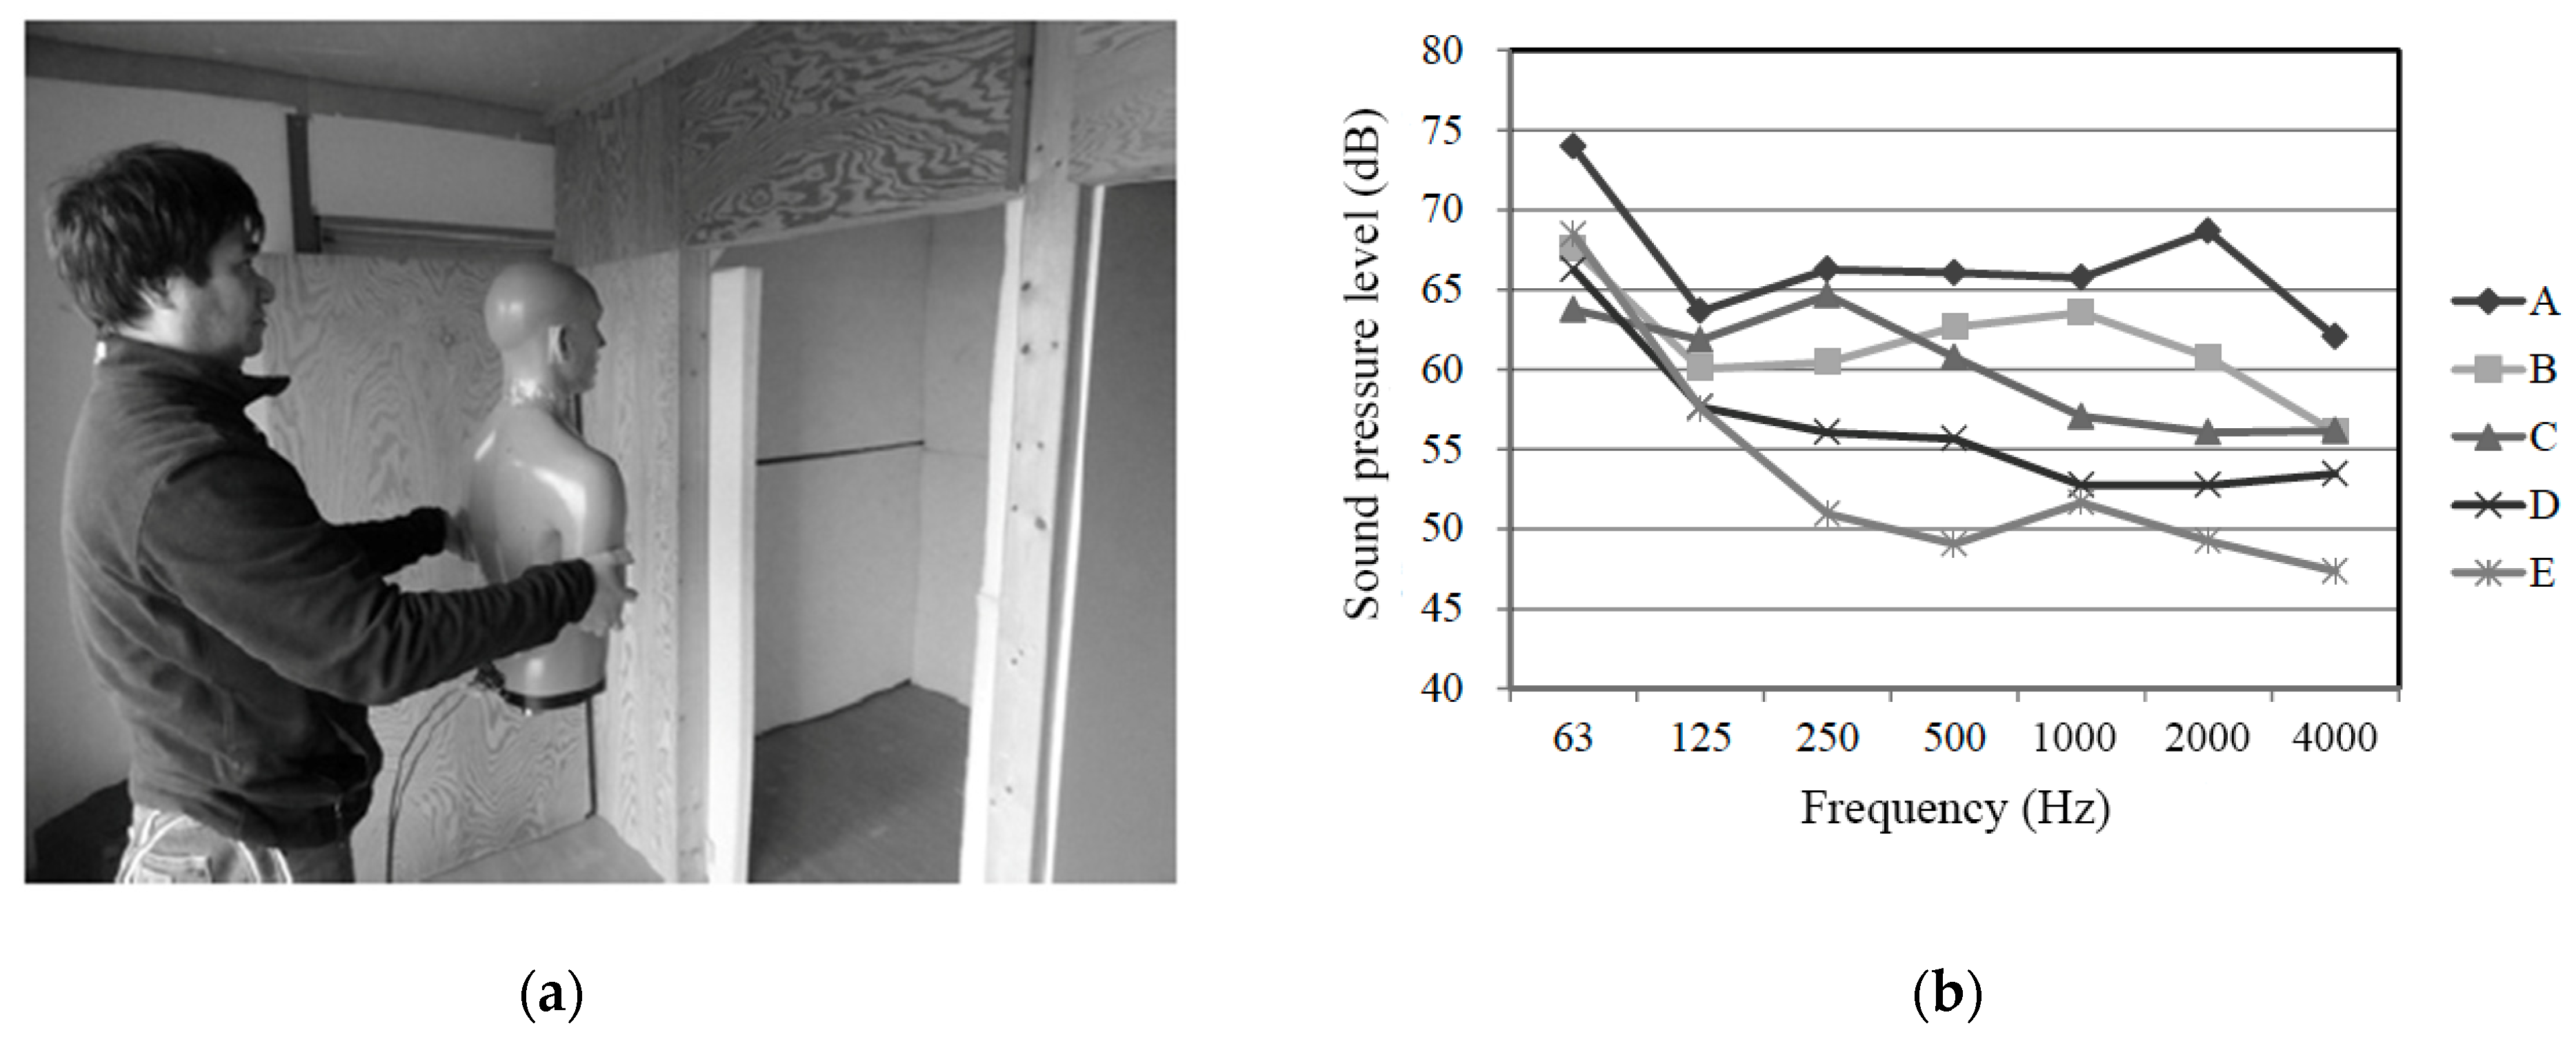
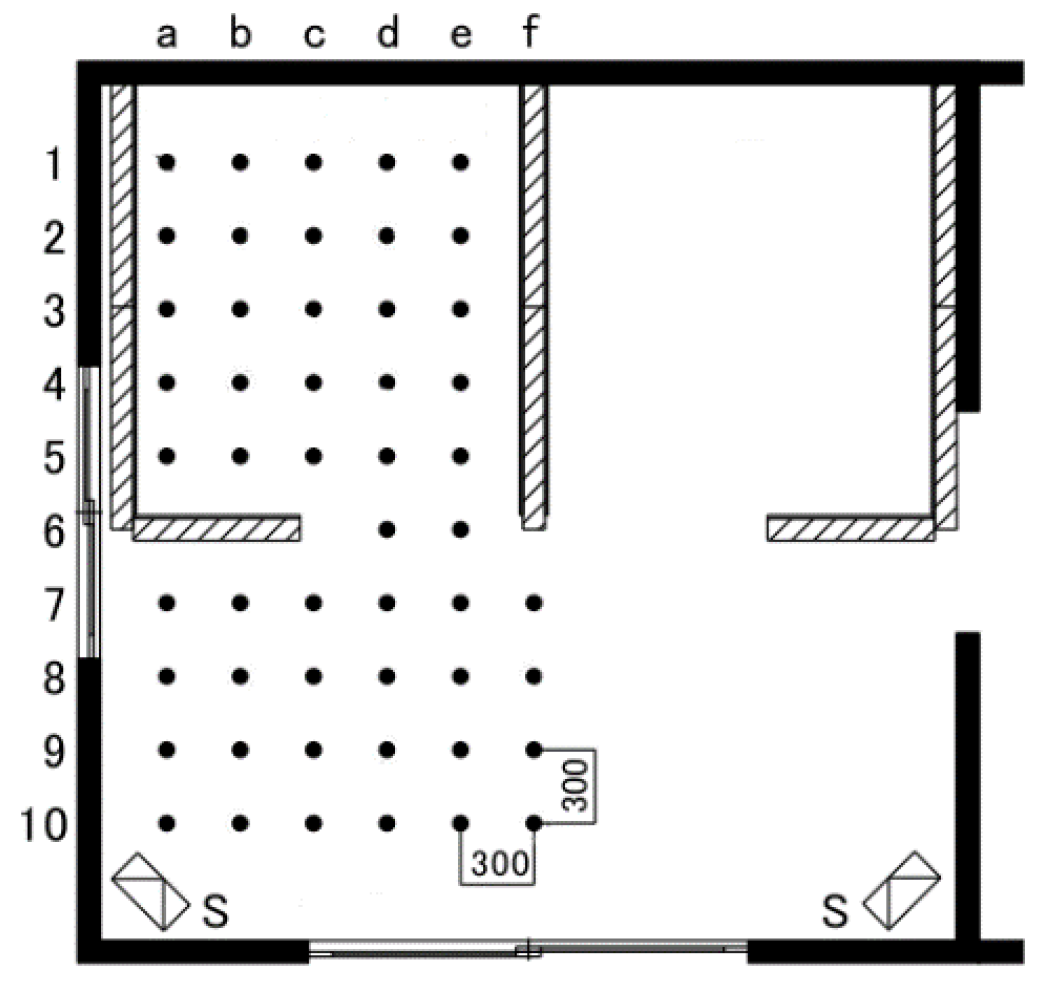
We measured not only the reverberation time but also the sound pressure levels of each absorption pattern at the point marked positions, as shown in Figure 15. Then, the exposed fan noise level was increased to 67 dB from the subjective test setting to improve the signal-to-noise ratio. The measurement results of column “d” are shown in Figure 16 and Figure 17. 
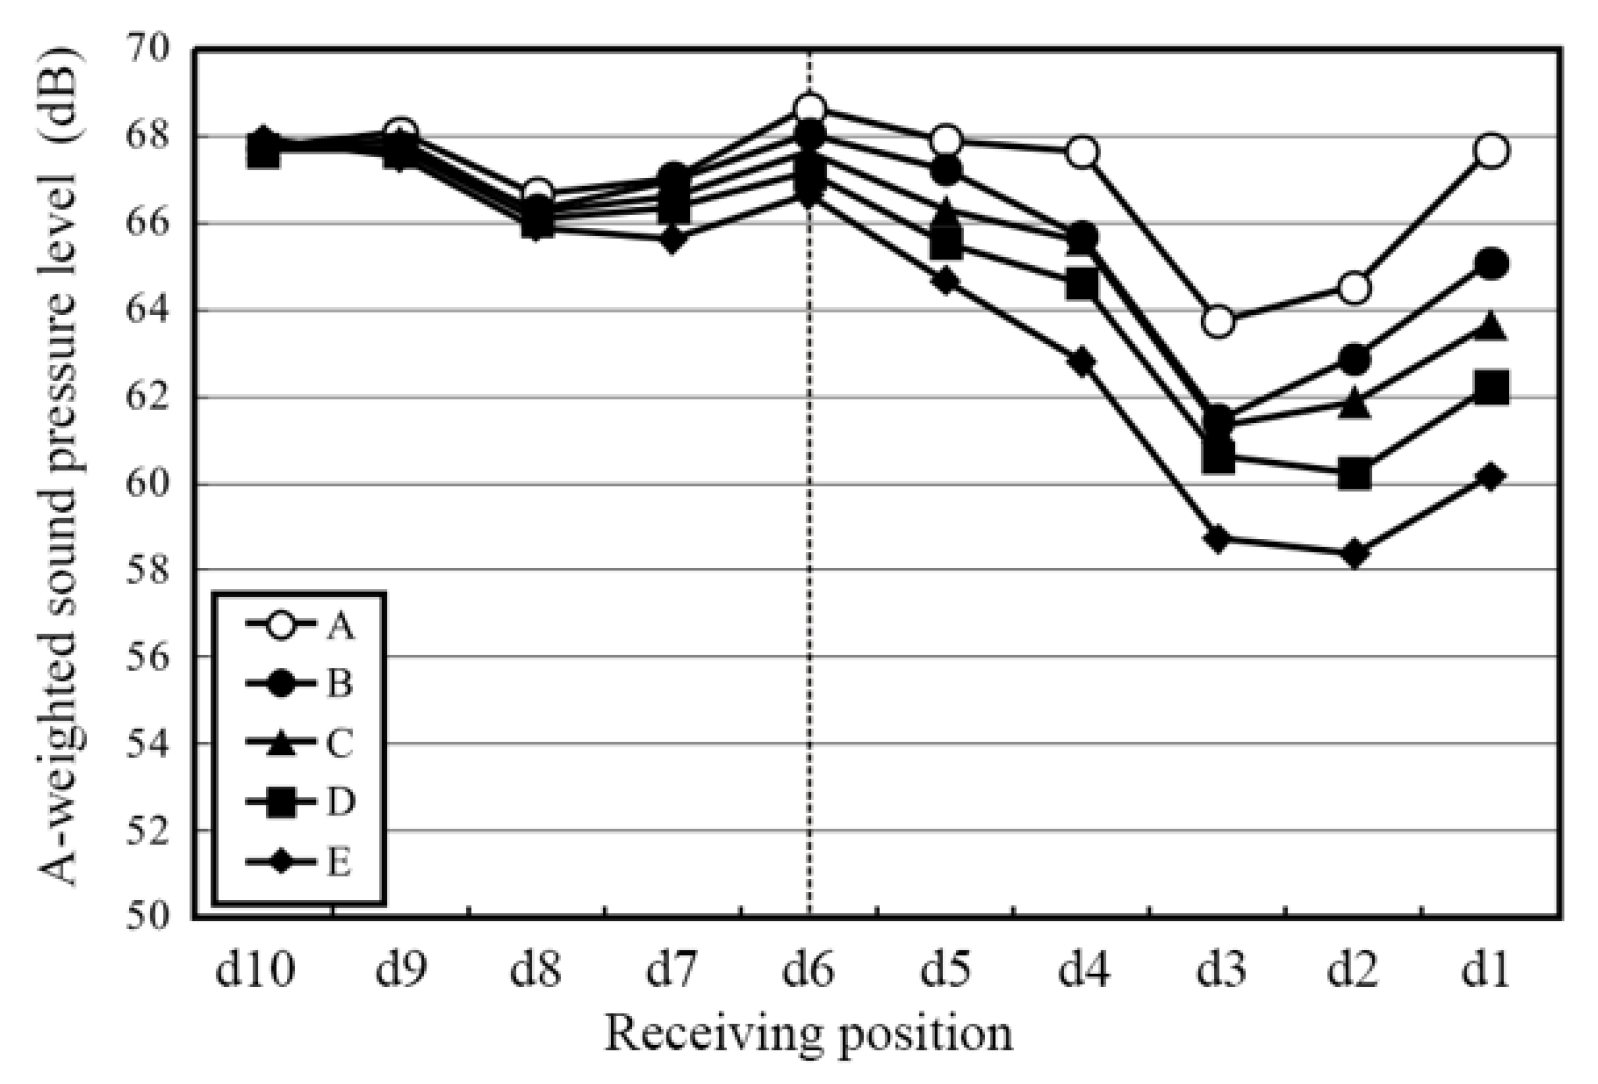
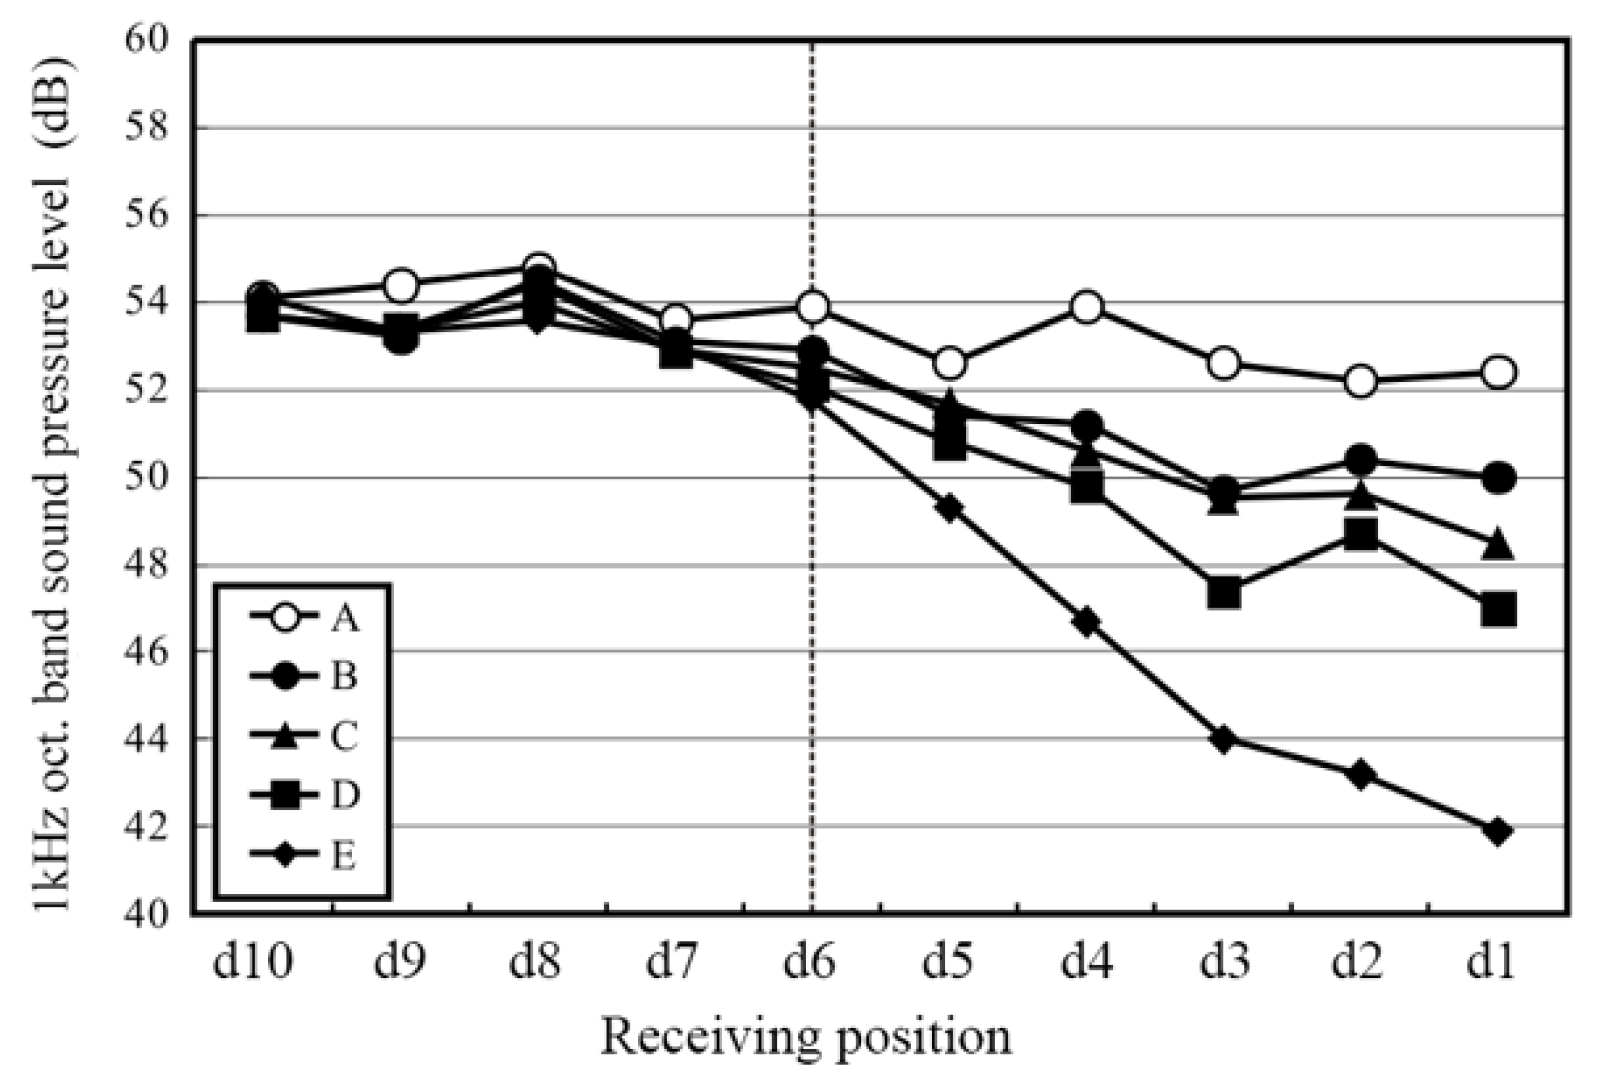
Figure 16 shows the results of the A-weighted values, and Figure 17 shows those of the 1 kHz octave-band values. The sound pressure levels decreased from the boundary position “d6”. The amount of decrease differed for each absorption condition. The larger the absorption area, the larger the decrease in the value. The A-weighted values at “d1” and “d2” were larger than that at “d3”. The rising levels at low-frequency bands could be considered because the receiving positions were near the forward wall.
Using these results, the correlation coefficients between the sound pressure levels at position “d3”, around the center of the room, and the psychological scale values of each subjective item in Section 2 were calculated. Table 10 lists the results of these calculations. The items “feeling of silence”, “feeling of serenity”, “sense of quality”, and “user preference” had strong negative correlation with sound pressure levels. "Feeling of silence" and "feeling of serenity" were found to be related to the absorption coefficient of the room from the subjective tests in Section 2, Section 3, Section 4 and Section 5. However, these subjective items were also related to the absolute sound pressure levels of the room used in the subjective evaluation. From these discussions, we could not identify whether the dominant factor was the “absorption coefficient of the room” or the “absolute sound pressure level”.
We also measured background noise levels in nine rooms in modern Japanese dwellings, as described in Section 4 and Section 5. Table 11 presents the measurement results. All rooms had A-weighted levels of less than 45 dB. Table 12 shows the correlation coefficients between the background noise levels and psychological scale values. Compared to the results in Table 9, the coefficients of all items were low in every octave band and A-weighted levels in Table 12. The coefficient values of “feeling of silence” and “feeling of serenity” were also under 0.6. From these calculations, the background noise level could not be directly associated with the “Feeling of silence” and “Feeling of serenity” in dwellings.
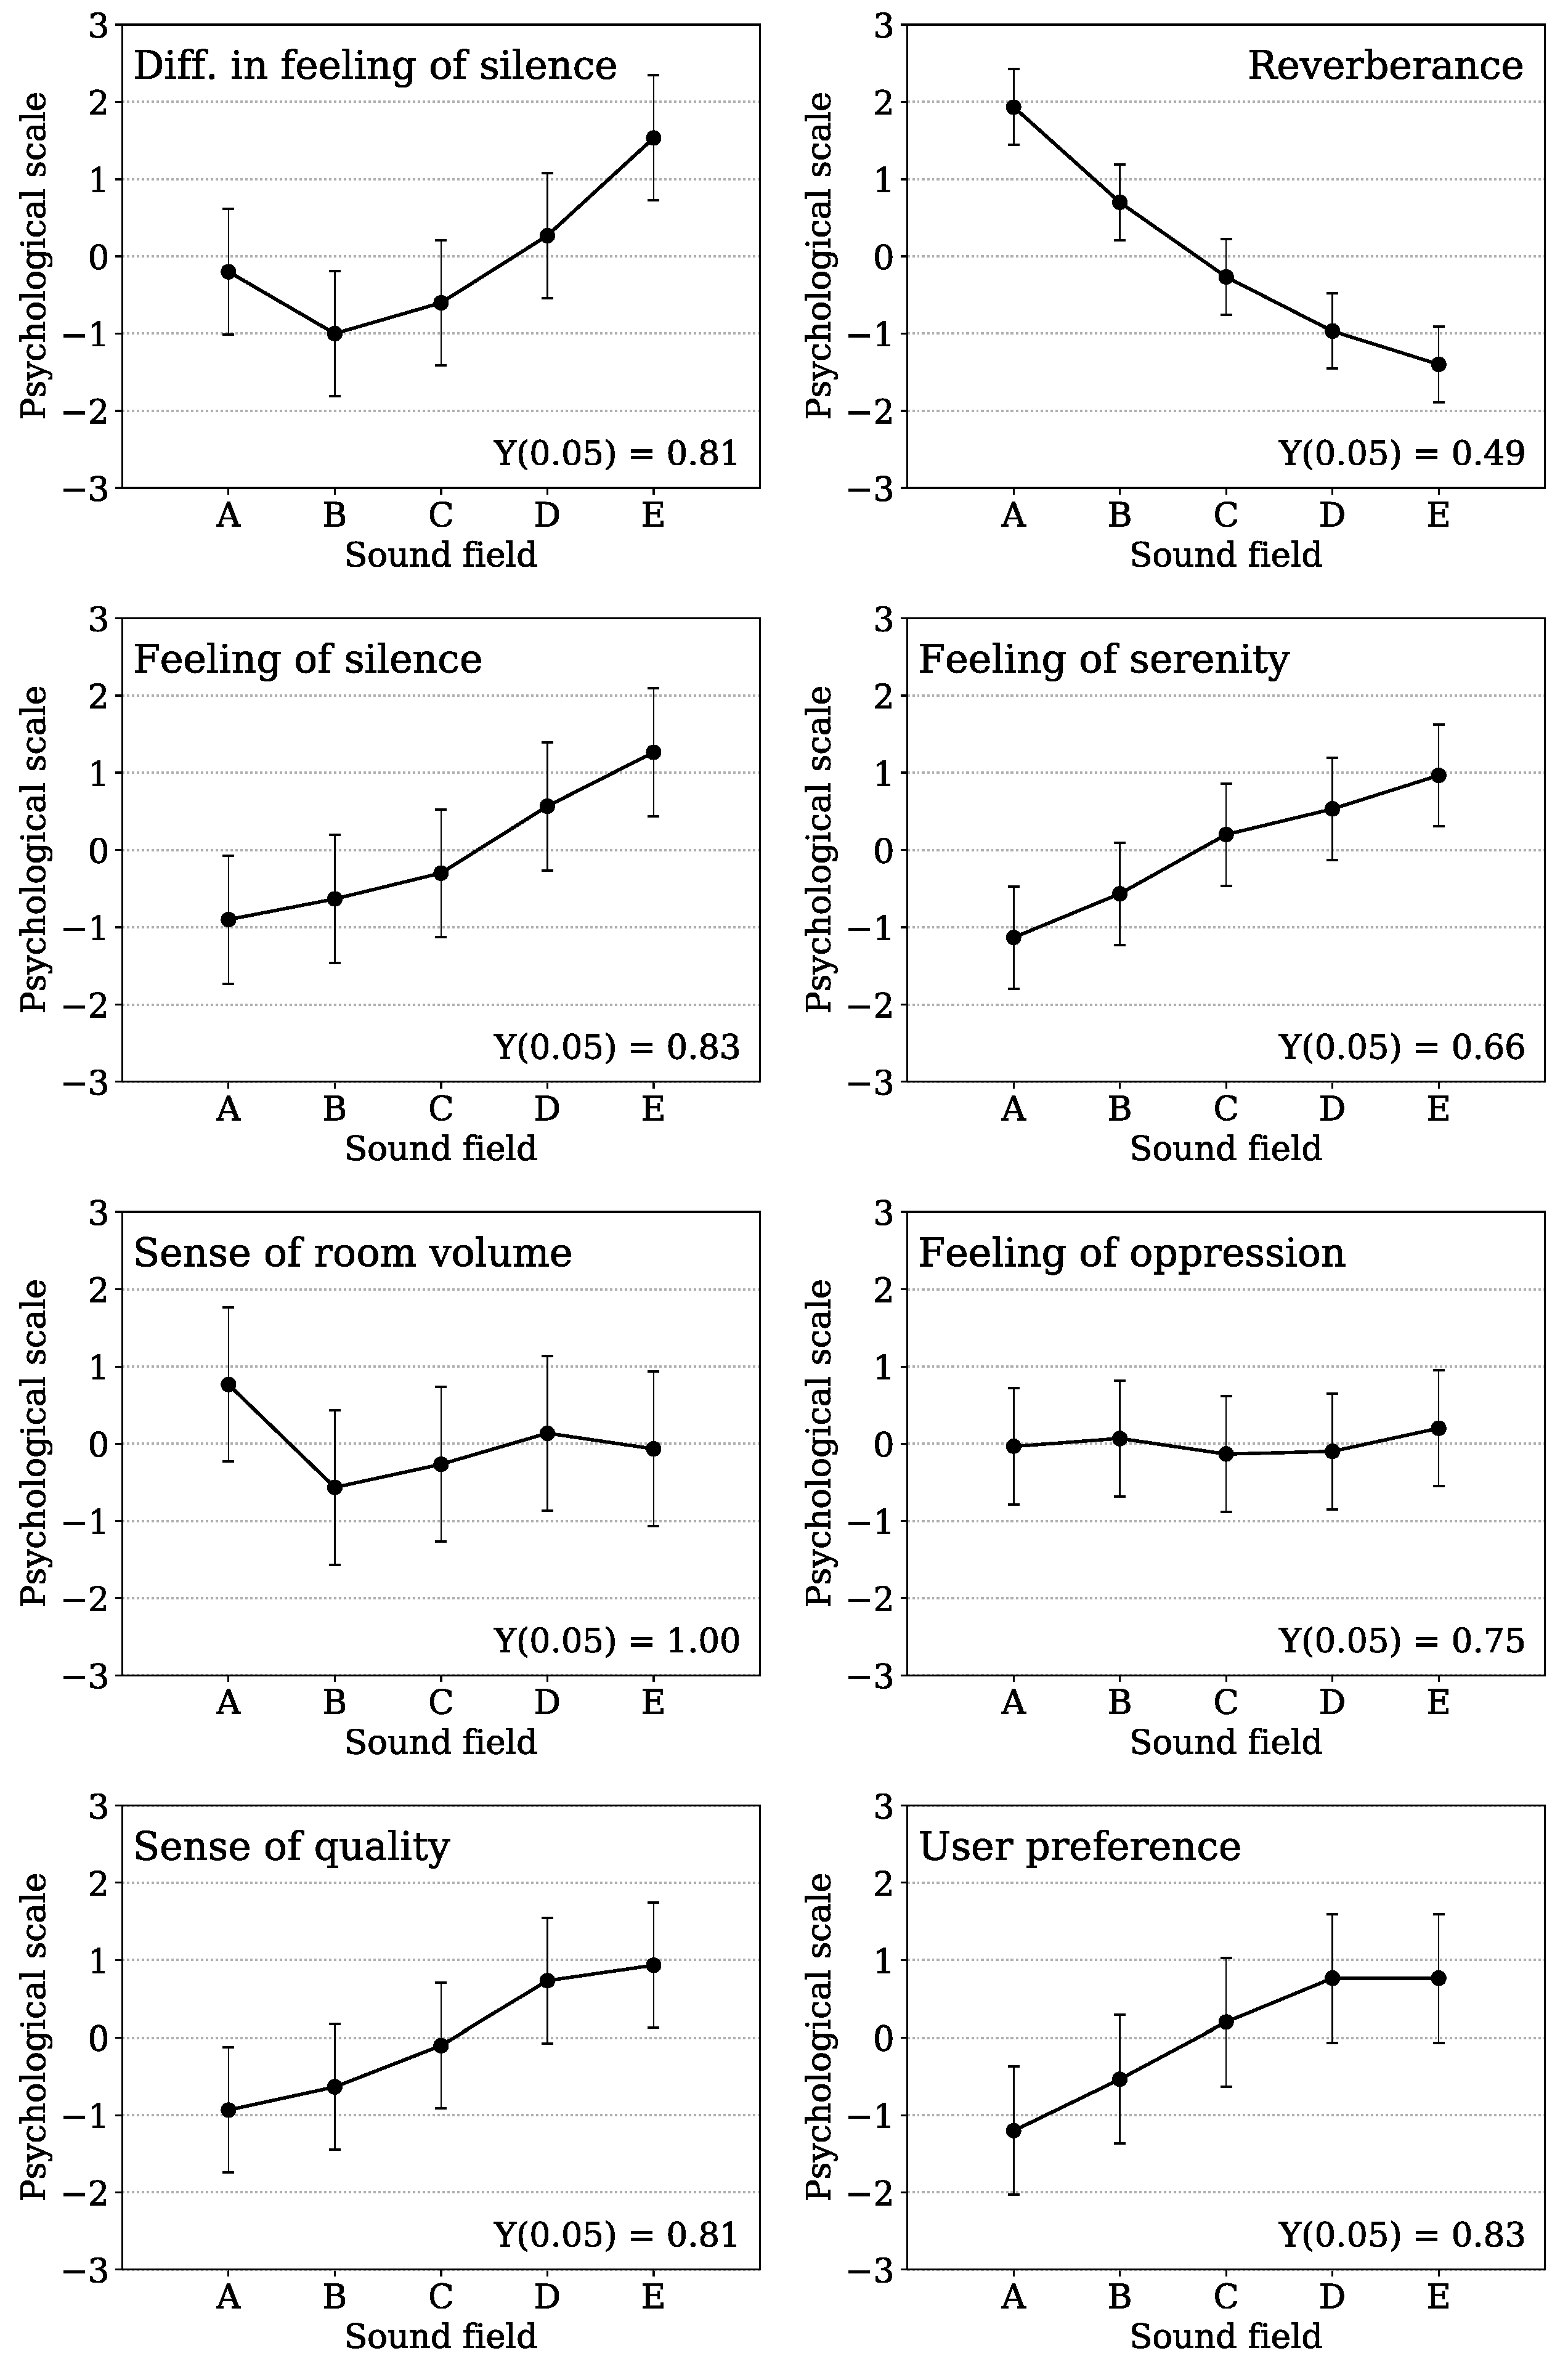
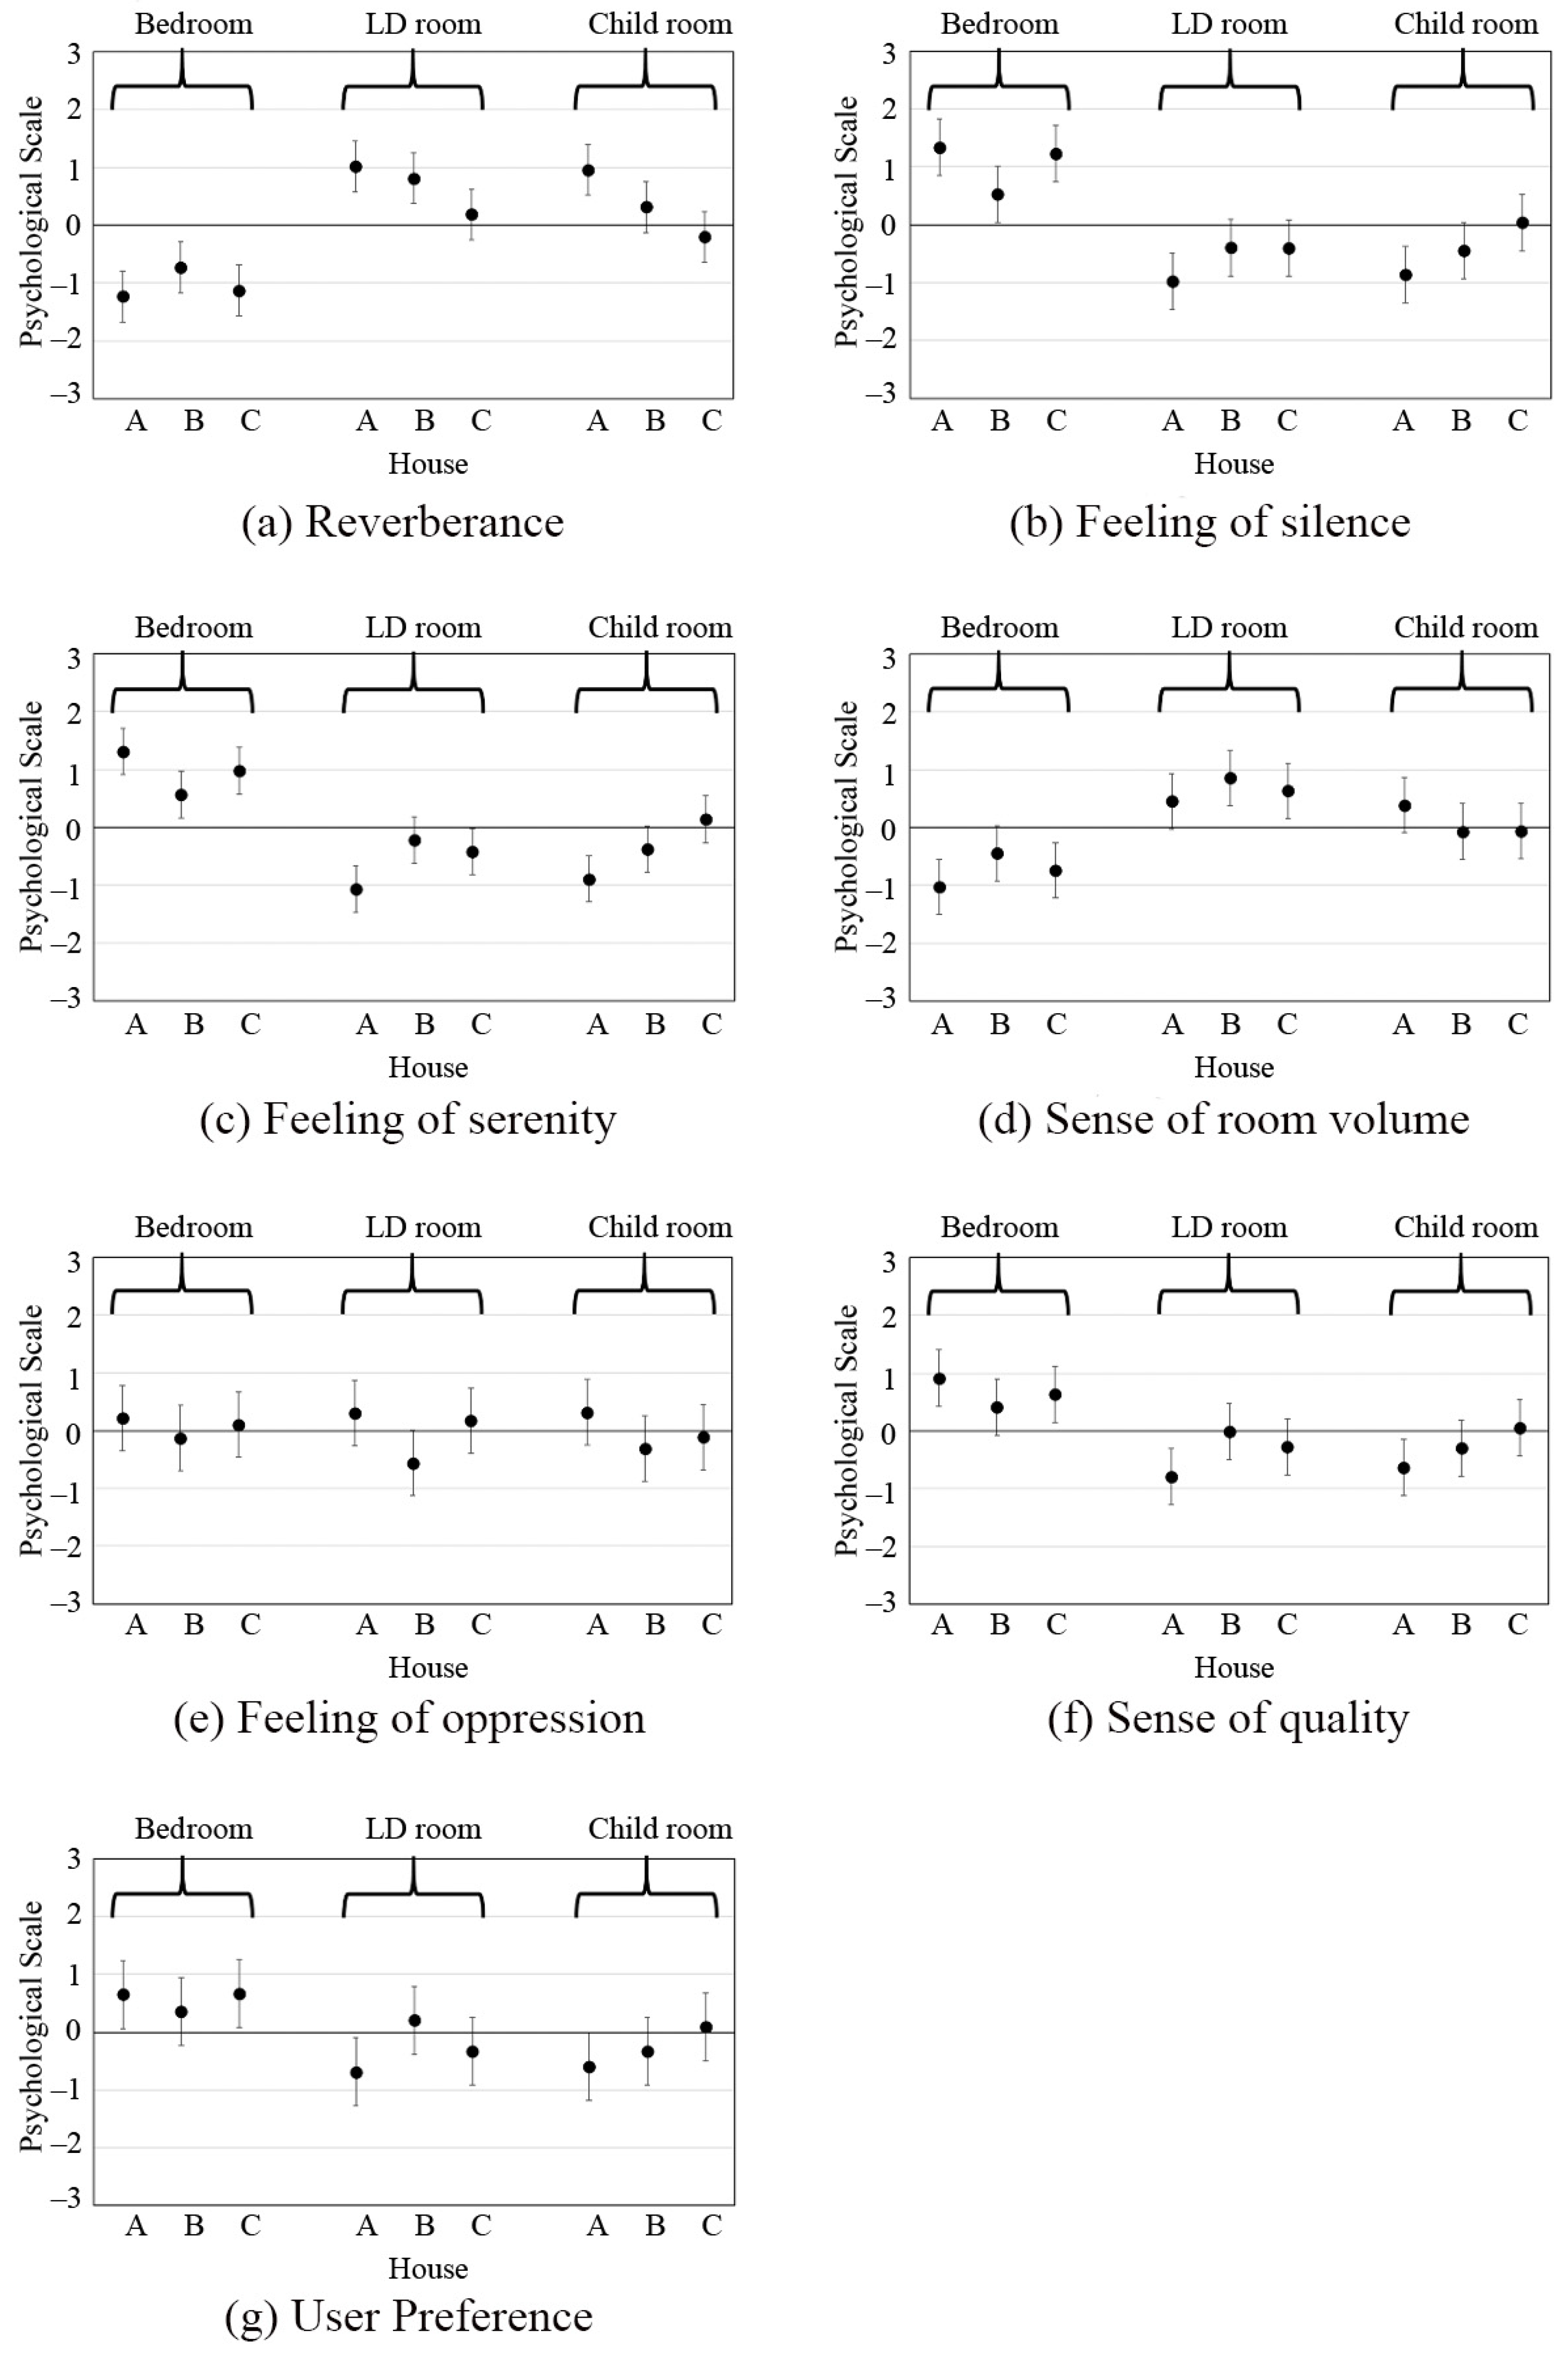
In general, we perceive a feeling of silence under the condition of a lower noise level. According to our series of studies, when we are in a quiet room, the “feeling of silence” or “feeling of serenity” can be influenced by the “reverberance” sound coming from several sounds caused by themselves, other people, or several machines in a room. “Reverberance” is inversely correlated with “feeling of silence” and “feeling of serenity”. Thus, we may perceive the “feeling of silence” or the “feeling of serenity” when reverberance is not perceived. From the results of our subjective tests, it was revealed that “feeling of silence” and “feeling of serenity” could be clearly perceived with an absorption coefficient above 0.25, as mentioned in Section 2. From this discussion, it is implied that an absorption coefficient of 0.25 can be one of the criteria for creating serene spaces in ordinary dwellings.

7. Conclusions

In this study, we investigated the influence of sound absorption in general dwellings on the subjective evaluation of acoustics. First, a subjective experiment was conducted using a full-scale room model. “feeling of silence” and “feeling of serenity” could be felt at an absorption coefficient above 0.17 and were clearly felt above values of 0.25. Second, we used the recorded binaural sounds obtained in the full-scale room model for a subjective test because this model examination required considerable time and human resources. This test showed that “reverberance”, “feeling of silence”, and “feeling of serenity” can also be evaluated using headphone listening.
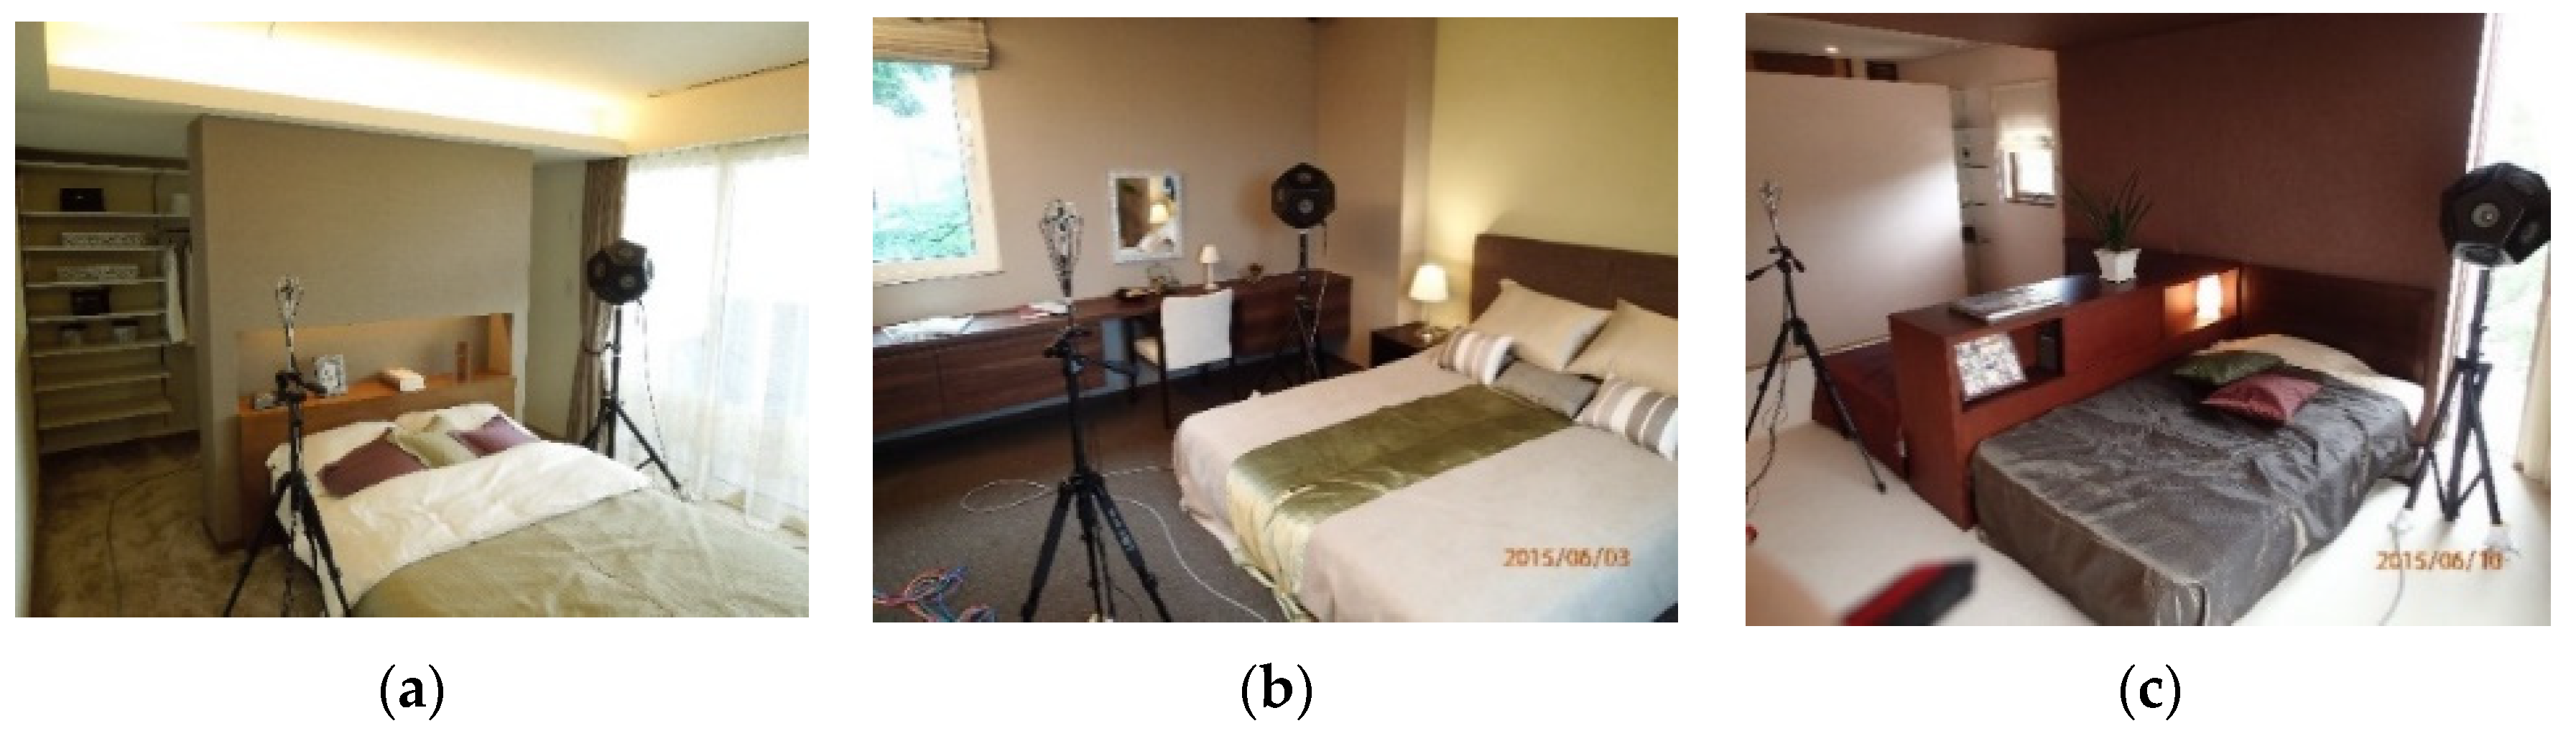
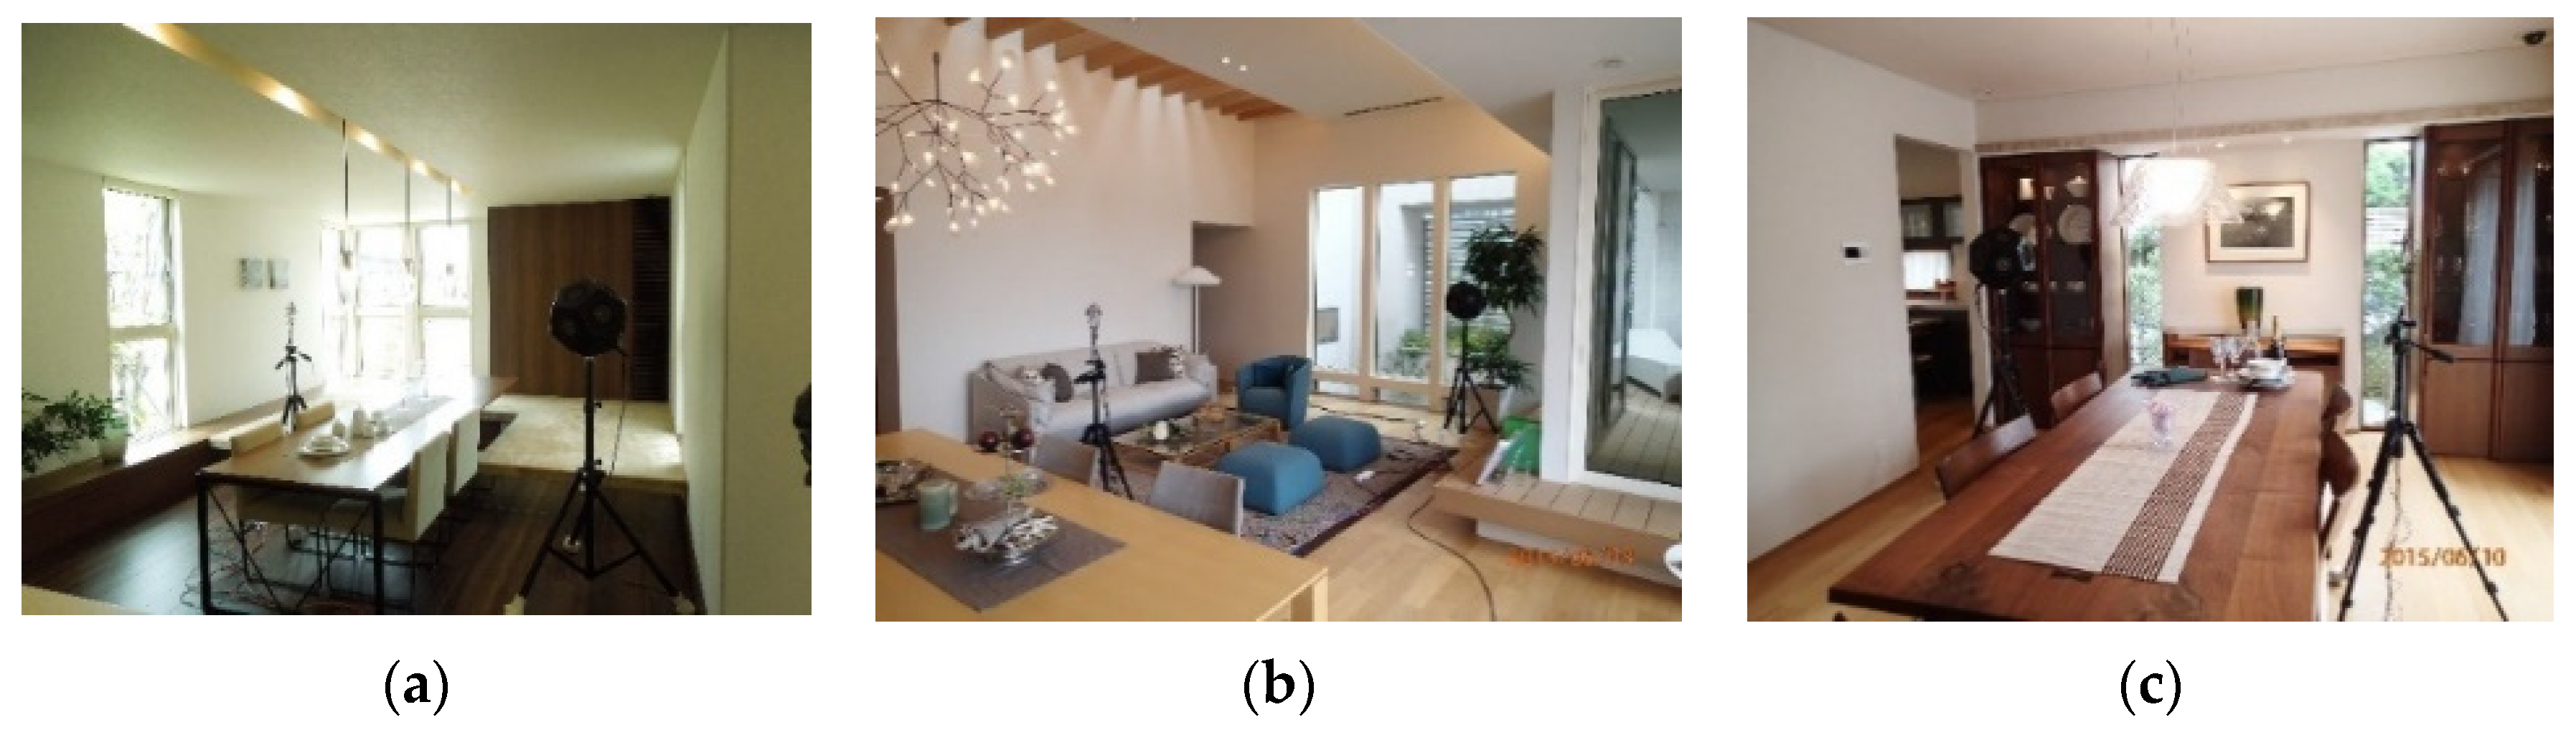
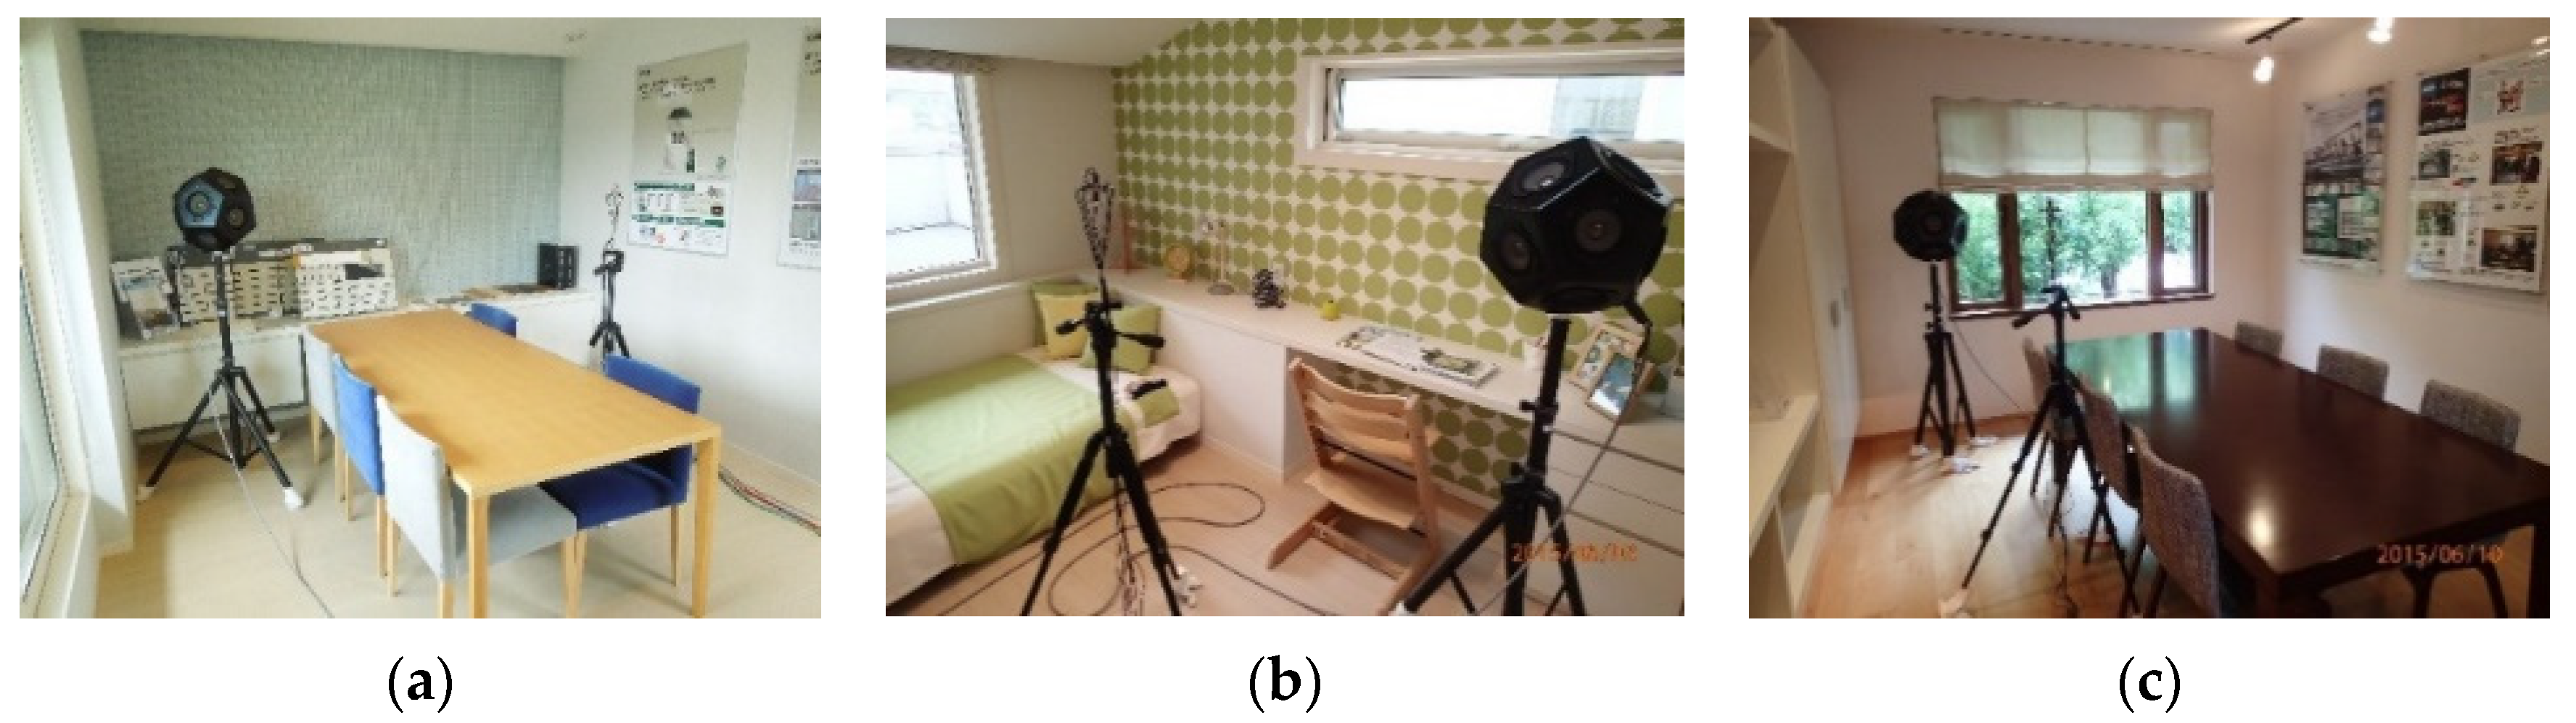
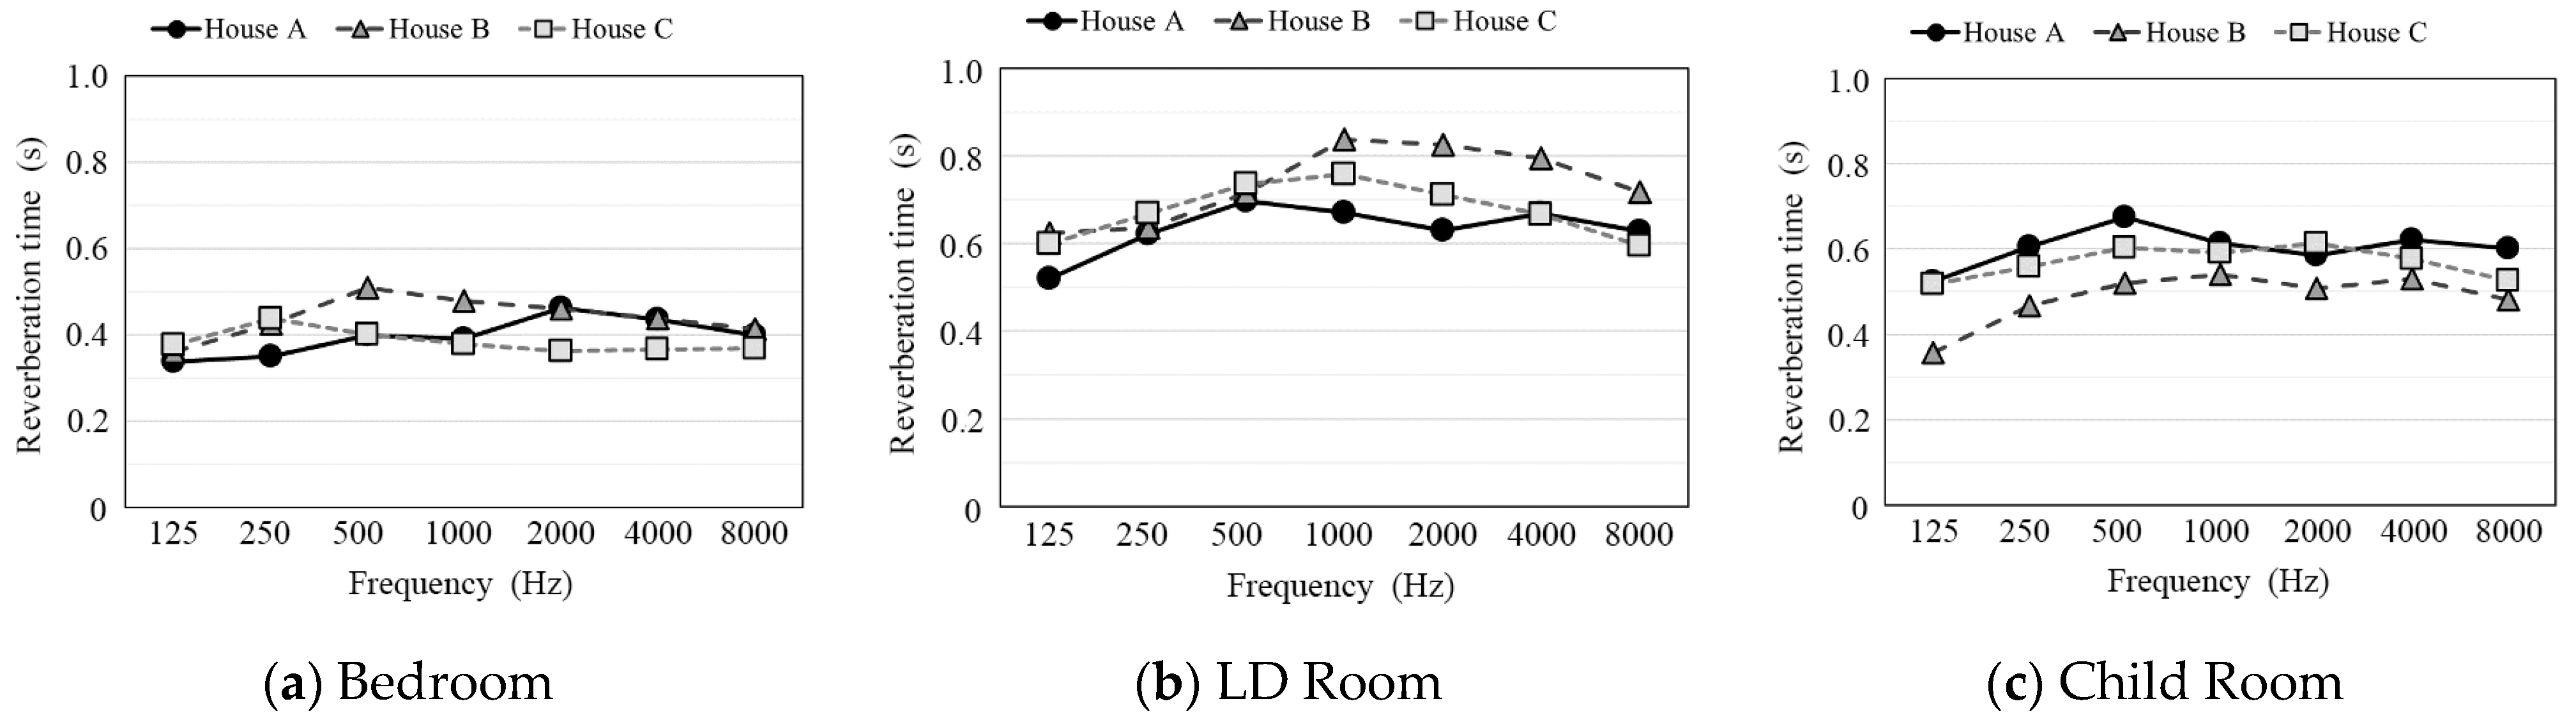
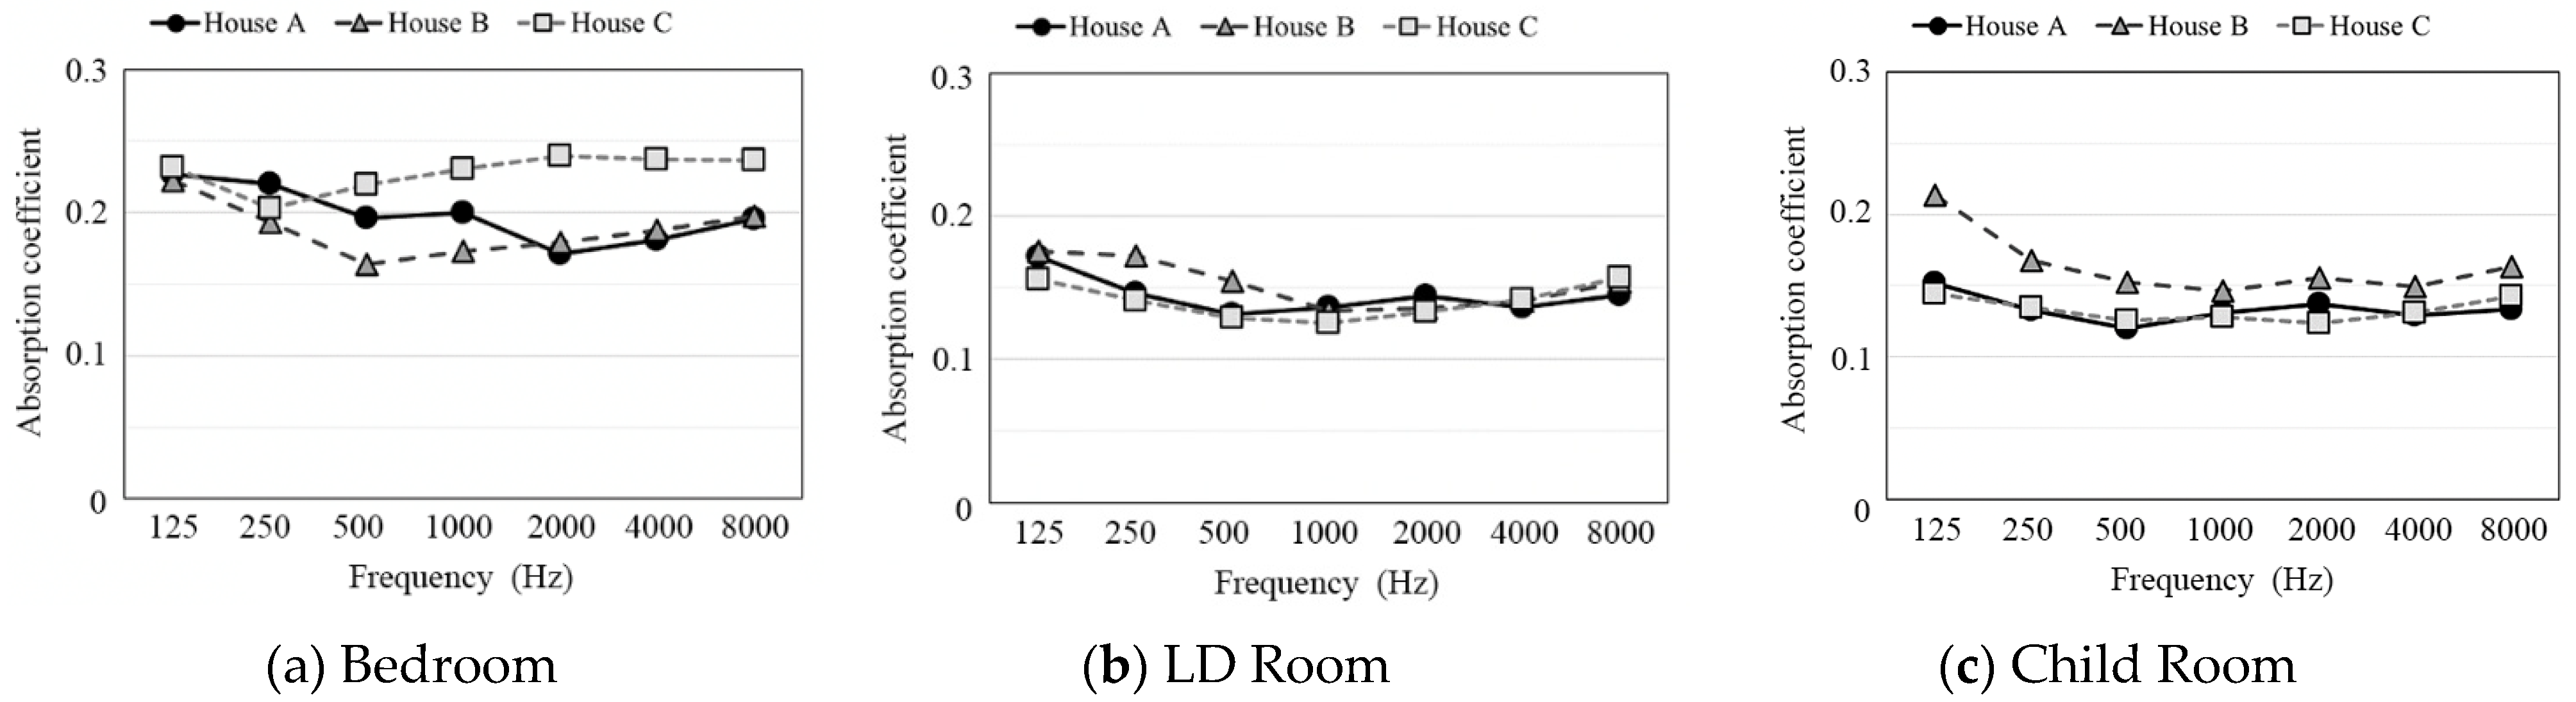
We also measured the reverberation time and recorded the sound environment in the bedrooms, LD rooms, and child rooms in three modern Japanese dwellings to verify the results of the former experiments. The reverberation times of LD and child rooms in this study were longer than the other reported furnished rooms by approximately 0.1–0.2 s [1,2,3,4,5,6,9,10]. In particular, those of the child rooms were long, despite the small room volume of approximately 30 m3. The wooden floor and lack of absorption materials could be the cause of longer reverberation times. The average absorption coefficients of the LD and child rooms were smaller than 0.17, in the range of 500 Hz to 4 kHz. Therefore, we analyzed the subjective effect of the absorption by a psychological test using the binaural recorded sounds in the nine rooms and observed that the bedrooms with absorption coefficients of 0.18 to 0.23 were significantly less reverberant, quieter, and serener than the other rooms. The results may be caused by the wooden floor and low absorption of the ceiling and walls in all LD and child rooms. From the discussion, it was revealed that the absorption coefficient above 0.25 may become one of the criteria for creating a silent and serene space when a room has low background noise level.
As you feel stiffening in an anechoic room, considerable absorption may not make us comfortable. There may be upper limit of the absorption area to provide a feeling of comfort and serenity in a room. Further studies are required to clarify this aspect. Additionally, to prevent booming or fluttering echo in a small room, the amount and position of the absorption area are important factors to be considered. Although scattering treatment does not reduce reverberant energy by itself, it can induce an adequate absorption effect. Therefore, moderate acoustic scattering treatment could be important for creating a serenity room and should be further investigated.

Author Contributions

Conceptualization, K.H., T.H., and D.W.; methodology, T.H. and D.W.; software, K.H., T.H., and R.S.; validation, K.H., T.H., and R.S.; formal analysis, T.H.; investigation, K.H., T.H., R.S., and D.W.; resources, T.H. and D.W.; data curation, K.H., T.H., R.S., and D.W.; writing—original draft preparation, K.H. and T.H.; writing—review and editing, K.H. and T.H.; visualization, K.H, and R.S.; supervision, T.H. and D.W.; project administration, T.H. All authors have read and agreed to the published version of the manuscript.

Funding

This research received no external funding.

Institutional Review Board Statement

Not applicable.

Informed Consent Statement

Informed consent was obtained from all subjects involved in the study.

Acknowledgments

The authors are grateful to Megumi Hasegawa and Jun Nakatani affiliated with MISAWA HOMES for introducing design projects in their company and advising our examinations.

Conflicts of Interest

The authors declare no conflict of interest.

References

  1. Parkin, W.E.; Purkis, P.H.; Scholes, P.H. Field measurements of sound insulation between dwellings. In National Building Studies Research Paper; HMSO (His/Her Majesty’s Stationery Office): London, UK, 1960. [Google Scholar]
  2. Jackson, G.M.; Leventhall, H.G. The acoustics of domestic rooms. Appl. Acoust. 1972, 5, 265–277. [Google Scholar] [CrossRef]
  3. Burgess, M.A.; Utley, W.A. Reverberation times in British living rooms. Appl. Acoust. 1985, 18, 369–380. [Google Scholar] [CrossRef]
  4. Bradley, J.S. Acoustical measurements in some Canadian homes. Can. Acoust. 1986, 14, 19–25. [Google Scholar]
  5. Díaz, C.; Pedrero, A. The reverberation time of furnished rooms in dwellings. Appl. Acoust. 2005, 66, 945–956. [Google Scholar] [CrossRef]
  6. Díaz, C.; Pedrero, A. The reverberation time and equivalent sound absorption area of rooms in dwellings. Noise Vib. Worldw. 2007, 38, 12–20. [Google Scholar] [CrossRef]
  7. International Organization for Standardization. ISO 16283-1:2014/AMD 1:2017, Acoustics—Field Measurement of Sound Insulation in Buildings and of Building Elements—Part 1: Airborne Sound Insulation—Amendment 1; International Organization for Standardization: Geneva, Switzerland, 2017. [Google Scholar]
  8. International Organization for Standardization. ISO 16283-2:2020, Acoustics—Field Measurement of Sound Insulation in Buildings and of Building Elements—Part 2: Impact Sound Insulation; International Organization for Standardization: Geneva, Switzerland, 2020. [Google Scholar]
  9. Nowicka, E.; Szudrowicz, B. The reverberation conditions in the modern dwellings. In Proceedings of the 37th International Congress and Exposition on Noise Control Engineering, Shanghai, China, 26–29 October 2008. [Google Scholar]
  10. Mašović, D. Analysis of reverberation time field measurement results in building acoustics. Telfor J. 2013, 5, 145–150. [Google Scholar]
  11. Takala, J.; Kylliäinen, M. Room acoustics and background noise levels in furnished Finnish dwellings. In Proceedings of the Inter-Noise 2013, the 42nd International Congress and Exposition on Noise Control Engineering, Innsbruck, Austria, 15–18 September 2013. [Google Scholar]
  12. Kylliäinen, M.; Takala, J.; Oliva, D.; Hongisto, V. Justification of standardized level differences in rating of airborne sound insulation between dwellings. Appl. Acoust. 2016, 102, 12–18. [Google Scholar] [CrossRef]
  13. Jeong, J.H.; Lee, B.K.; Jeon, J.Y. A Study on the Reverberation Time Characteristics of Inside Space of Apartment Buildings. Trans. Korean Soc. Noise Vib. Eng. 2015, 25, 291–298. (In Korean) [Google Scholar] [CrossRef]
  14. Lim, H.; Hong, J.; Jeon, J. Uncertainty of measuring reverberation time at low frequency in a residential building. In Proceedings of the Inter-Noise 2015, the 44th International Congress and Exposition on Noise Control Engineering, San Francisco, CA, USA, 9–12 August 2015. [Google Scholar]
  15. International Organization for Standardization. ISO 12913-1:2014, Acoustics—Soundscape—Part 1: Definition and Conceptual Framework; International Organization for Standardization: Geneva, Switzerland, 2014. [Google Scholar]
  16. International Organization for Standardization. ISO/TS 12913-2:2018, Acoustics—Soundscape—Part 2: Data Collection and Reporting Requirements; International Organization for Standardization: Geneva, Switzerland, 2018. [Google Scholar]
  17. International Organization for Standardization. ISO/TS 12913-3:2019, Acoustics—Soundscape—Part 3: Data Analysis; International Organization for Standardization: Geneva, Switzerland, 2019. [Google Scholar]
  18. Axelsson, Ö.; Nilsson, M.E.; Berglund, B. A principal components model of soundscape perception. J. Acoust. Soc. Am. 2010, 128, 2836–2846. [Google Scholar] [CrossRef]
  19. Koçlar, G.; Alpin, O.; Yener, K.; Bayazit, N.T. Building envelope design with the objective to ensure thermal, visual and acoustic comfort conditions. Build. Environ. 2004, 39, 281–287. [Google Scholar]
  20. Dokmeci Yorukoglu, P.N.; Kang, J. Development and testing of Indoor soundscape questionnaire for evaluating contextual experience in public spaces. Build. Acoust. 2017, 24, 307–324. [Google Scholar] [CrossRef] [Green Version]
  21. Aletta, F.; Astolfi, A. Soundscapes of buildings and built environments. Build. Acoust. 2018, 25, 195–197. [Google Scholar] [CrossRef] [Green Version]
  22. Van Den Bosch, K.A.; Andringa, T.C.; Post, W.J.; Ruijssenaars, W.A.; Vlaskamp, C. The relationship between soundscapes and challenging behavior: A small-scale intervention study in a healthcare organization for individuals with severe or profound intellectual disabilities. Build. Acoust. 2018, 25, 123–135. [Google Scholar] [CrossRef]
  23. Torresin, S.; Aletta, F.; Babich, F.; Bourdeau, E.; Harvie-Clark, J.; Kang, J.; Lavia, L.; Radicchi, A.; Albatici, R. Acoustics for supportive and healthy buildings: Emerging themes on indoor soundscape research. Sustainability 2020, 12, 6054. [Google Scholar] [CrossRef]
  24. Xiao, J.; Aletta, F. A soundscape approach to exploring design strategies for acoustic comfort in mod- ern public libraries: A case study of the Library of Birmingham. Noise Map 2016, 3, 264–273. [Google Scholar]
  25. Dokmeci Yorukoglu, P.N.; Kang, J. Analysing sound environment and architectural characteristics of libraries through indoor soundscape framework. Arch. Acoust. 2016, 41, 203–212. [Google Scholar] [CrossRef] [Green Version]
  26. Lindborg, P. Psychoacoustic, physical, and perceptual features of restaurants: A field survey in Singapore. Appl. Acoust. 2015, 92, 47–60. [Google Scholar] [CrossRef]
  27. Lindborg, P. A taxonomy of sound sources in restaurants. Appl. Acoust. 2016, 110, 297–310. [Google Scholar] [CrossRef] [Green Version]
  28. Wilczek, T.; Steffens, J.; Weinzierl, S. Room acoustics, soundscapes and customer satisfaction in restaurants—A field study. In Proceedings of the ICA2019, the 23rd International Congress of Acoustics, Aachen, Germany, 9–13 September 2019. [Google Scholar]
  29. Yilmazer, S.; Bora, Z. Understanding the indoor soundscape in public transport spaces: A case study in Akköprü metro station, Ankara. Build. Acoust. 2017, 24, 325–339. [Google Scholar] [CrossRef]
  30. Kulak, S.; Bayazit, N.T. Subjective evaluation of acoustic quality classes in dwelling. In Proceedings of the ICA2019, the 23rd International Congress of Acoustics, Aachen, Germany, 9–13 September 2019. [Google Scholar]
  31. Dedieu, R.; Lavandier, C.; Camier, C.; Berger, S. Pleasantness of typical acoustic environments inside a living room in a European residential context. In Proceedings of the ICA2019, the 23rd International Congress of Acoustics, Aachen, Germany, 9–13 September 2019. [Google Scholar]
  32. Torresin, S.; Albatici, R.; Aletta, F.; Babich, F.; Kang, J. Assessment methods and factors determining positive indoor soundscapes in residential buildings: A systematic review. Sustainability 2019, 11, 5290. [Google Scholar] [CrossRef] [Green Version]
  33. Torresin, S.; Alabatici, R.; Aletta, F.; Babich, F.; Oberman, T.; Siboni, S.; Kang, J. Indoor soundscape assessment: A principal components model of acoustic perception in residential buildings. Build. Environ. 2020, 182, 107152. [Google Scholar] [CrossRef]
  34. Jeon, J.Y. Subjective evaluation of floor impact noise based on the model of ACF/IACF. J. Sound Vib. 2001, 241, 147–155. [Google Scholar] [CrossRef]
  35. Jeon, J.Y.; Jeong, J.H.; Vorländer, M.; Thaden, R. Evaluation of floor impact sound insulation in reinforced concrete buildings. Acta Acust. United Acust. 2004, 90, 313–318. [Google Scholar]
  36. Lee, P.J.; Kim, J.H.; Jeon, J.Y. Psychoacoustical characteristics of impact ball sounds on concrete floors. Acta Acust. United Acust. 2009, 95, 707–717. [Google Scholar] [CrossRef]
  37. Jeon, J.Y.; Sato, S. Annoyance caused by heavyweight floor impact sounds in relation to the autocorrelation function and sound quality metrics. J. Sound Vib. 2008, 311, 767–785. [Google Scholar] [CrossRef]
  38. Jeon, J.Y.; Lee, P.J.; Kim, J.H.; Yoo, S.Y. Subjective evaluation of heavy-weight floor impact sounds in relation to spatial characteristics. J. Acoust. Soc. Am. 2009, 125, 2987–2994. [Google Scholar] [CrossRef] [PubMed]
  39. Ryu, J.; Sato, H.; Kurakata, K.; Hiramitsu, A.; Tanaka, M.; Hirota, T. Relation between annoyance and single-number quantities for rating heavy-weight floor impact sound insulation in wooden houses. J. Acoust. Soc. Am. 2011, 129, 3047–3055. [Google Scholar] [CrossRef]
  40. Gover, B.N.; Bradley, J.; Schoenwald, S.; Zeitler, B. Subjective ranking of footstep and low-frequency impact sounds on lightweight wood-framed floor assemblies. In Proceedings of the Forum Acusticum 2011, Aalborg, Denmark, 26 June 2011. [Google Scholar]
  41. Späh, M.; Hagberg, K.; Bartlomeé, O.; Weber, L.; Leistner, P.; Liebl, A. Subjective and objective evaluation of impact noise sources in wooden buildings. Build. Acoust. 2013, 20, 193–214. [Google Scholar] [CrossRef]
  42. Kylliäinen, M.; Hongisto, V.; Oliva, D.; Rekola, L. Subjective and objective rating of impact sound insulation of a concrete floor with various coverings. Acta Acust. United Acust. 2017, 103, 236–250. [Google Scholar] [CrossRef]
  43. Park, H.K.; Kim, K.M.; Kim, S.W. Comparison of the Standard Floor Impact Sound with Living Impact Source by Subjective Evaluation. Korea Indust. Eco. Arch. Environ. J. 2014, 14, 39–48. [Google Scholar] [CrossRef]
  44. Ma, K.W.; Wong, H.M.; Mak, C.M. A systematic review of human perceptual dimensions of sound: Meta-analysis of semantic differential method applications to indoor and outdoor sound. Build. Environ. 2018, 133, 123–150. [Google Scholar] [CrossRef]
  45. Vardaxis, N.-G.; Bard, D.; Waye, K.P. Review of acoustic comfort evaluation in dwellings—Part I: Associations of acoustic field data to subjective responses from building surveys. Build. Acoust. 2018, 25, 151–170. [Google Scholar] [CrossRef] [Green Version]
  46. Öqvist, R.; Ljunggren, F.; Johnsson, R. Listening test of walking noise from 20 Hz in dwellings. In Proceedings of the Inter-Noise 2017, the 46th International Congress and Exposition on Noise Control Engineering, Hong Kong, China, 27–30 August 2017; pp. 3935–3942. [Google Scholar]
  47. Monteiro, C.; Machimbarrena, M.; De la Prida Caballero, D.; Rychtaárikovaá, M. Subjective and objective acoustic performance ranking of heavy and light weight walls. Appl. Acoust. 2016, 110, 268–279. [Google Scholar] [CrossRef]
  48. Rychtáriková, M.; Muellner, H.; Chmelík, V.; Roozen, N.B.; Urbán, D.; Garcia, D.P.; Glorieux, C. Perceived loudness of neighbour sounds heard through heavy and light-weight walls with equal Rw + C50–5000. Acta Acust. United Acust. 2016, 102, 58–66. [Google Scholar] [CrossRef] [Green Version]
  49. Park, H.K.; Bradley, J.S.; Gover, B.N. Evaluating airborne sound insulation in terms of speech intelligibility. J. Acoust. Soc. Am. 2008, 123, 1458–1471. [Google Scholar] [CrossRef] [PubMed]
  50. Park, H.K.; Bradley, J.S. Evaluating standard airborne sound insulation measures in terms of annoyance, loudness and audibility ratings. J. Acoust. Soc. Am. 2009, 126, 208–219. [Google Scholar] [CrossRef] [PubMed]
  51. Hongisto, V.; Oliva, D.; Keränen, J. Subjective and objective rating of airborne sound insulation—Living sounds. Acta Acust. United Acust. 2014, 100, 848–864. [Google Scholar] [CrossRef]
  52. Virjonen, P.; Hongisto, V.; Oliva, D. Optimized single-number quantity for rating the airborne sound insulation of constructions: Living sounds. J. Acoust Soc. Am. 2016, 140, 4428–4436. [Google Scholar] [CrossRef]
  53. Watanabe, D.; Hasegawa, E.; Nakatani, J.; Hanyu, T.; Hoshi, K. Fundamental study of sound absorption for comfortable sound environments in residences. J. Environ. Eng. Archit. Inst. Jpn. 2011, 76, 345–353. (In Japanese) [Google Scholar] [CrossRef] [Green Version]
  54. Hanyu, T.; Hoshi, K.; Watanabe, D. Listening test method for investigating effect of sound absorption on comfort provided by sound environments in residences. J. Environ. Eng. Archit. Inst. Jpn. 2014, 79, 141–148. (In Japanese) [Google Scholar]
  55. Hanyu, T.; Hoshi, K.; Suzuki, R.; Watanabe, D. Field survey in model houses investigating effect of sound absorption on comfort provided by sound environments in residences. J. Environ. Eng. Archit. Inst. Jpn. 2021. in printing. (In Japanese) [Google Scholar]
  56. Lee, Y.; Joo, C. Sound absorption properties of recycled polyester fibrous assembly absorbers. AUTEX Res. J. 2003, 3, 78–84. [Google Scholar]
  57. International Organization for Standardization. ISO 3382-2:2009. Acoustics—Measurement of Room Acoustic Parameters—Part. 2: Reverberation Time in Ordinary Rooms; International Organization for Standardization: Geneva, Switzerland, 2009. [Google Scholar]
  58. Scheffeé, H. An analysis of variance for paired comparisons. J. Am. Stat. Assoc. 1952, 47, 381–400. [Google Scholar]
  59. Scheffeé, H. The Analysis of Variance; Wiley: New York, NY, USA, 1999. [Google Scholar]
  60. Ura, S. An analysis of a paired comparison experiment. Stat. Qual. Control. 1959, 10, 78–80. (In Japanese) [Google Scholar]
  61. Nakaya, S. A Modification of Scheffé’s method for paired comparisons. In Proceedings of the 11th Meeting of Sensory Test; 1970; pp. 1–12. (In Japanese). [Google Scholar]
  62. Sato, S. Statistical Sensory Evaluation; JUSE Press: Tokyo, Japan, 1985. (In Japanese) [Google Scholar]
  63. Namba, S.; Kuwano, S. Method of Psychological Measurement for Hearing Research; Corona Publishing: Tokyo, Japan, 1998. (In Japanese) [Google Scholar]
  64. Nagasawa, S. Improvement of the Scheffe’s method for paired comparisons. Kansei Eng. Intnl. 2002, 3, 47–56. [Google Scholar] [CrossRef] [Green Version]
Figure 1. Two evaluation spaces and front chamber (scale unit: millimeter). (a) Floor plan of the full-scale model for the subjective experiment; (b) loudspeaker and microphone positions for the reverberation time measurements.
Applsci 11 02709 g001
Figure 2. Five absorption patterns used for the pair comparison experiment. Polyester nonwoven absorbers installed at the colored positions.
Applsci 11 02709 g002
Figure 3. Results of the measurement in the front chamber (O) and five absorption patterns (A–E): (a) Reverberation time (s); (b) Absorption coefficient.
Applsci 11 02709 g003
Figure 4. Two evaluation spaces used for the Nakaya’s modified method of Scheffé’s paired comparisons. The participants experience the two evaluation spaces successively and state the differences between these two spaces for eight subjective items.
Applsci 11 02709 g004
Figure 5. Results of psychological experiments using the full-scale room model. The eight figures show the psychological values of the five absorption patterns (A–E) for each subjective item. The error bars represent the 5% significant yardsticks.
Applsci 11 02709 g005
Figure 6. Binaural recording: (a) The experimenter holds the dummy head microphone and walks from the front chamber to the evaluation space generating a footstep sound; (b) frequency characteristics of the last step for each absorber’s condition.
Applsci 11 02709 g006
Figure 7. Results of the psychological experiment using recording sources and headphone listening. The eight figures show the psychological values of the five absorption patterns (A–E) for each subjective item. The error bars represent the 5% significant yardsticks.
Applsci 11 02709 g007
Figure 8. Measurement of impulse response in the three bedrooms: houses (a) A, (b) B, and (c) C.
Applsci 11 02709 g008
Figure 9. Measurement of impulse response in the three LD rooms: houses (a) A, (b) B, and (c) C.
Applsci 11 02709 g009
Figure 10. Measurement of impulse responses in the three child rooms: houses (a) A, (b) B, and (c) C.
Applsci 11 02709 g010
Figure 11. Frequency characteristics of the reverberation times in the nine rooms: (a) bedrooms; (b) LD rooms; (c) child rooms.
Applsci 11 02709 g011
Figure 12. Frequency characteristics of the absorption coefficients in the nine rooms: (a) bedrooms; (b) LD rooms; (c) child rooms.
Applsci 11 02709 g012
Figure 13. Binaural recording in the LD room. The experimenter holds the dummy head and walks around the room generating a footstep sound.
Applsci 11 02709 g013
Figure 14. Results of the psychological experiments in the nine rooms using recording sources and headphone listening. These seven figures show the psychological values of the nine rooms for each subjective item. The error bars represent the 5% significant yardsticks.
Applsci 11 02709 g014
Figure 15. One evaluation space is used for sound-pressure-level measurement. The levels were obtained at dot positions on each absorption pattern (A–E shown in Figure 4).
Applsci 11 02709 g015
Figure 16. Results of the A-weighted sound pressure level on line “d” on each absorption pattern. The dotted line represents the boundary of the front room and evaluation space.
Applsci 11 02709 g016
Figure 17. Results of the 1-kHz octave-band sound pressure level on line “d” in each absorption pattern. The dotted line represents the boundary between the front room and evaluation space.
Applsci 11 02709 g017
Table 1. Results of the measurement in the front chamber (O) and five absorption patterns (A–E).
ParameterPatternOctave Band Frequency (Hz)
125250500100020004000
Reverberation TimeA0.290.660.910.830.750.65
B0.260.450.460.400.390.38
C0.220.320.320.280.270.24
D0.140.210.250.170.150.16
E0.140.180.140.110.110.14
O0.260.390.490.600.600.53
Absorption CoefficientA0.160.070.050.060.060.07
B0.170.110.100.120.120.12
C0.200.140.140.160.170.19
D0.290.210.180.250.280.27
E0.300.240.310.350.370.30
O0.220.150.120.100.100.11
Table 2. Evaluation items for the paired comparison experiment.
Evaluation Item
Difference in feeling of silence between the inside and outside of the room
Reverberance
Feeling of silence
Feeling of serenity
Sense of room volume
Feeling of oppression
Sense of quality
User preference
Table 3. Correlation coefficients between the average absorption coefficients and psychological values of each evaluation item.
Item125 Hz250 Hz500 Hz1000 Hz2000 Hz4000 Hz
Difference in feeling of silence0.79 *0.77 *0.81 *0.80 *0.80 *0.72
Reverberance−0.93 **−0.97 **−0.94 **−0.97 **−0.97 **−0.99 **
Feeling of silence0.97 **0.98 **0.97 **0.99 **0.99 **0.96 **
Feeling of serenity0.93 **0.98 **0.98 **0.98 **0.97 **0.99 **
Sense of room volume------
Feeling of oppression------
Sense of quality0.99 **1.00 **0.94 **0.98 **0.99 **0.99 **
User preference0.94 **0.97 **0.90 **0.95 **0.95 **0.99 **
** p < 0.01, * p < 0.05.
Table 4. Results of significant-difference tests of the main effects of the average absorption coefficient on the evaluation items.
ItemMain Effects F (4, 20)
Full-Scale ModelHeadphone Listening
Difference in feeling of silence 12.76 **42.36 **
Reverberance65.00 **24.07 **
Feeling of silence10.17 **45.79 **
Feeling of serenity14.10 **10.22 **
Sense of room volume2.2012.79 **
Feeling of oppression0.284.38 *
Sense of quality9.00 **1.66
User preference9.38 **4.48 **
F0.99 (4, 20) = 4.431, F0.95 (4, 20) = 2.866
** p < 0.01, * p < 0.05.
Table 5. Correlation coefficients between the psychological values of the full-scale modeling experiment and those of the headphone listening experiment for each evaluation item.
ItemCorrelation Coefficient
Difference in feeling of silence 0.90 **
Reverberance0.98 **
Feeling of silence0.93 **
Feeling of serenity0.97 **
Sense of room volume0.55
Feeling of oppression0.36
Sense of quality0.76 *
User preference0.96 **
** p < 0.01, * p < 0.05.
Table 6. Specifications of the bedrooms, living and dining (LD) rooms, and child rooms of the three houses.
Volume, m3Surface Area, m2Floor Area, m2Floor Finish
BedroomHouse A42.478.618.8Carpet
House B42.374.916.6
House C66.3107.627.6
LD roomHouse A78.6128.934.5Wood
House B174.6233.656.8
House C74.0117.130.2
Child roomHouse A30.957.711.7Wood
House B32.560.914.0
House C30.159.912.5
Table 7. Reverberation times and absorption coefficients in the nine rooms.
ParameterRoomHouseOctave Band Frequency (Hz)
1252505001000200040008000
Reverberation TimeBedroomA0.340.350.400.390.460.440.40
B0.360.420.510.480.460.440.41
C0.380.440.400.380.360.370.37
LD roomA0.520.620.700.670.630.670.63
B0.620.640.720.840.830.800.72
C0.600.670.740.760.710.670.59
Child roomA0.520.610.670.610.590.620.60
B0.360.470.520.540.510.530.48
C0.520.560.600.590.610.580.53
Absorption CoefficientBedroomA0.230.220.200.200.170.180.20
B0.220.190.160.170.180.190.20
C0.230.200.220.230.240.240.24
LD roomA0.170.150.130.140.140.140.14
B0.180.170.150.130.140.140.15
C0.160.140.130.130.130.140.16
Child roomA0.150.130.120.130.140.130.13
B0.210.170.150.150.160.150.16
C0.140.130.130.130.120.130.14
Table 8. Results of the ANOVA of the psychological scales and main effects for each evaluation item.
ItemMain Effects F (8, 96)
Reverberance31.20 **
Feeling of silence23.77 **
Feeling of serenity32.61 **
Sense of room volume14.22 **
Feeling of oppression2.20 *
Sense of quality10.69 **
User preference5.96 **
F0.99 (8, 96) = 2.702, F0.95 (8, 96) = 2.036
** p < 0.01, * p < 0.05.
Table 9. Correlation coefficients between the average sound absorption coefficient and psychological value of each evaluation item.
Item125 Hz250 Hz500 Hz1000 Hz2000 Hz4000 Hz
Reverberance−0.70 **−0.77 **−0.79 **−0.83 **−0.70 **−0.81 **
Feeling of silence0.73 **0.85 **0.88 **0.88 **0.74 **0.84 **
Feeling of serenity0.71 **0.85 **0.84 **0.83 *0.66 **0.78 **
Sense of room volume−0.77 **−0.76 **−0.76 **−0.85 **−0.71 **−0.75 **
Feeling of oppression−0.11−0.13−0.050.160.120.07
Sense of quality0.70 **0.86 **0.83 **0.80 *0.63 **0.76 **
User preference0.66 **0.84 **0.84 **0.78 *0.64 **0.76 **
** p < 0.01, * p < 0.05.
Table 10. Correlation coefficients between the sound pressure levels at position “d3” in the evaluation space and psychological value of each evaluation item.
ItemA-Weighted1000 Hz
Reverberance0.94 **0.93 **
Feeling of silence−0.95 **−0.97 **
Feeling of serenity−0.94 **−0.93 **
Sense of room volume0.430.36
Feeling of oppression−0.54−0.57
Sense of quality−0.92 **−0.93 **
User preference−0.90 **−0.88 **
** p < 0.01.
Table 11. Background noise levels (dB) in nine rooms in modern Japanese dwellings.
125 Hz250 Hz500 Hz1000 Hz2000 Hz4000 HzA-Weighted
BedroomHouse A41.135.032.524.216.912.333.4
House B36.131.123.618.914.613.227.6
House C44.438.132.925.917.313.834.4
LD roomHouse A37.934.730.826.617.113.032.3
House B47.442.435.026.720.617.437.8
House C42.644.341.637.031.225.542.3
Child roomHouse A38.237.938.735.826.917.839.7
House B39.938.932.128.020.415.134.4
House C41.236.730.222.816.717.832.6
Table 12. Correlation coefficients between the background noise levels in nine rooms in modern Japanese dwellings and the psychological values of each evaluation item.
Item125 Hz250 Hz500 Hz1000 Hz2000 Hz4000 HzA-Weighted
Reverberance−0.050.370.400.530.470.350.45
Feeling of silence0.19−0.33−0.36−0.53−0.50−0.42−0.40
Feeling of serenity0.21−0.32−0.38−0.58−0.51−0.40−0.42
Sense of room volume0.200.60 *0.500.560.60 *0.63 *0.58
Feeling of oppression−0.46−0.240.250.360.22−0.010.13
Sense of quality0.27−0.27−0.36−0.57−0.49−0.37−0.38
User preference0.39−0.22−0.38−0.61 *−0.53−0.37−0.38
* p < 0.05.
Publisher’s Note: MDPI stays neutral with regard to jurisdictional claims in published maps and institutional affiliations.

