
Probabilistic Assessment of Roof Snow Load and the Calibration of Shape Coefficients in the Eurocodes


Department of Civil and Industrial Engineering-Structural Division, University of Pisa, Largo Lucio Lazzarino 1, 56122 Pisa, Italy
*
Author to whom correspondence should be addressed.
Appl. Sci. 2021, 11(7), 2984; https://0-doi-org.brum.beds.ac.uk/10.3390/app11072984
Submission received: 28 February 2021
/
Revised: 19 March 2021
/
Accepted: 22 March 2021
/
Published: 26 March 2021
(This article belongs to the Special Issue Advances on Structural Engineering, Volume II)
Abstract
:In modern structural codes, the reference value of the snow load on roofs is commonly given as the product of the characteristic value of the ground snow load at the construction site multiplied by the shape coefficient. The shape coefficient is a conversion factor which depends on the roof geometry, its wind exposure, and its thermal properties. In the Eurocodes, the characteristic roof snow load is either defined as the value corresponding to an annual probability of exceedance of 0.02 or as a nominal value. In this paper, an improved methodology to evaluate the roof snow load characterized by a given probability of exceedance (e.g., in one year) is presented based on appropriate probability density functions for ground snow loads and shape coefficients, duly taking into account the influence of the roof’s geometry and its exposure to wind. In that context, the curves for the design values of the shape coefficients are provided as a function of the coefficient of variation (COVg) of the yearly maxima of the snow load on the ground expected at a given site, considering three relevant wind exposure conditions: sheltered or non-exposed, semi-sheltered or normal, and windswept or exposed. The design shape coefficients for flat and pitched roofs, obtained considering roof snow load measurements collected in Europe during the European Snow Load Research Project (ESLRP) and in Norway, are finally compared with the roof snow load provisions given in the relevant existing Eurocode EN1991-1-3:2003 and in the new version being developed (prEN1991-1-3:2020) for the “second generation” of the Eurocodes.
1. Introduction
The collapse of roof structures under extreme snow loads can have catastrophic consequences, as confirmed by the failures of large-span lightweight structures that have recently occurred in Europe [1,2,3]. In recent years, following the collapses of a considerable number of structures during the winter of 2005–2006, a debate on the structural reliability of roofs exposed to snow load has been initiated [4,5], particularly with regard to whether the partial factors for climatic actions provided in modern structural codes are adequate or not. That criticism is based on the suspicion that the values of partial factors given in the Eurocodes as well as in most other international standards, like those issued by the International Organization for Standards (ISO), the American Society of Civil Engineers (ASCE), often underestimate the effects of climatic action uncertainties in lightweight structures. A proper evaluation of snow load is thus crucial for the structural design of such roofs, which are particularly sensitive to variable loads.
In the evaluation of the snow loads on roofs, a major source of uncertainty is undoubtedly the limited availability of data regarding snow deposition patterns on roofs characterized by different shapes. Moreover, uncertainties are further emphasized if other relevant parameters influencing the snow deposition are considered, such as wind transportation, climatic conditions during and after snowfall, snow melting caused by heat transfer through the roof, exposure of the roof snow cover to solar radiation, accumulation processes due to snow precipitation during the winter season, and many other factors. For these reasons, the proper evaluation of the relationship between the ground snow load and the roof snow loads is a challenging task.
In modern building codes for structural design, roof snow loads are usually derived from the ground snow loads at the site [6] by means of suitable conversion factors.
In the Eurocodes, where the reference value of the ground snow load is characterized by a given probability of exceedance (e.g., in one year [7]) the design value of the roof snow load is the product of the ground snow load multiplied by the so-called shape coefficient. The shape coefficient, which depends on the exposure, the slope, and the thermal conditions of the roof, usually varies in the interval of 0.4–1.1 [6]. This high variability should be duly considered in establishing design loads for roofs [8].
Until now, due to the limited number of the available direct in situ, the values of the shape coefficients provided in modern codes have usually been derived by supplementing that restricted statistical information with nominal safe-sided estimates, based on the physics of the phenomenon and engineering judgement. Of course, if the ground snow load is treated as a random variable and the conversion factors are assigned in terms of nominal safe-sided values, the obtained roof snow load will not have the same probability of exceedance of the ground snow loads, rather being a kind of notional value. Notwithstanding that this approach is specifically adopted in the Eurocodes, the introduction of more sophisticated methods for transforming ground snow loads into roof snow loads with the same probability of exceedance could be extremely helpful.
A first attempt to derive design roof snow loads based on a probabilistic approach was proposed in [8,9] for the United States, assuming a log-normal distribution for both ground snow loads and conversion factors. In that way, suitable design conversion factors were thus derived considering 128 sites in the United States [9].
To the authors’ knowledge, no similar studies are available for Europe, where an extreme value distribution is commonly adopted for ground snow loads [10,11].
In view of the development of the second generation of Eurocode EN 1991 (Part 1–3—Snow Loads) [12] by Mandate M/515 of the European Commission [13] to the European Committee for Standardization (CEN) [14], an in-depth assessment of roof snow load value design is illustrated in the paper, based on the statistical analyses of an extensive database of measurements directly collected by in-situ measurements from many European buildings.
The proposed methodology aims to evaluate the reference value of roof snow loads, accounting for uncertainties affecting both ground snow loads and conversion factors. First, appropriate probability density functions (pdfs) of ground and roof snow loads are defined starting from the in-situ measurements taken in Europe [10,15,16]. Subsequently, the joint pdfs and the design conversion factors (shape coefficients) to be used for structural design are determined in such a way that the reference values of roof snow load and ground snow load are associated with the same probability of exceedance (e.g., in one year).
Since the design values of the conversion factors are mainly dependent on the scattering of ground snow load, curves for the derivation of design conversion factors are provided as a function of the coefficient of variation of ground snow loads (), accounting for the roof’s geometry and its exposure to wind. In the study, in accordance with [12], three relevant wind exposure conditions are considered: sheltered or non-exposed, semi-sheltered or normal, and windswept or exposed.
Finally, the design conversion factors for flat and pitched roofs are compared with the values provided in EN1991-1-3:2003 [12] and in the new version being developed [17], showing the estimated probability of exceedance of snow loads on roofs in association with the Eurocode models.
It must be stressed that available roof snow load data generally cover limited periods of observation, relying on the assumption of the stationarity of the atmospheric phenomena and of the exposure conditions. Consequently, the potential influence of climate change cannot be directly assessed by looking at the existing measurements. Methodologies for the elaboration of climate projections can provide tools to tackle that issue, as has already been done for ground snow load [1,2], but it must be underlined that refined information about the dependance of the shape coefficients on the local climate evolution at the building scale is still lacking. Moreover, specific studies show that future trends of wind velocity due to climate change are not so significant as to modify exposure conditions [18,19].
2. Stochastic Modeling of Roof Snow Load
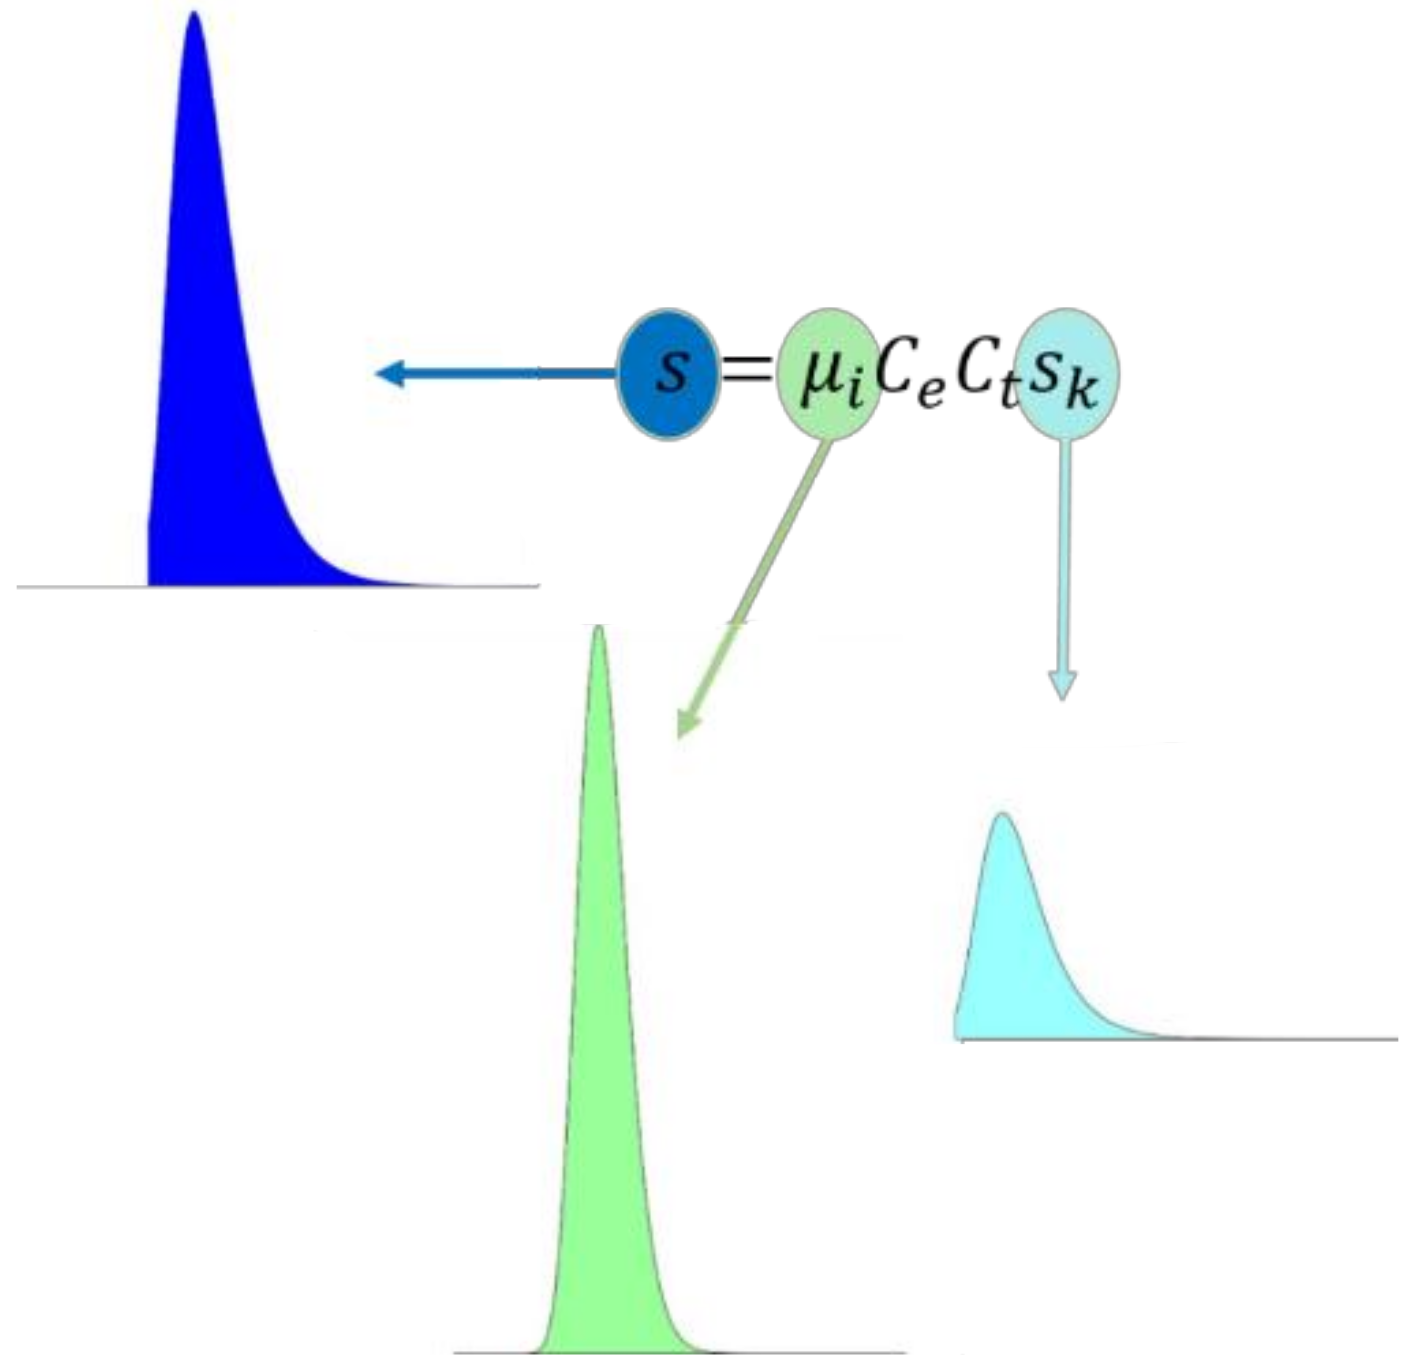
According to EN1991-1-3:2003 [12], the snow load on roof is given by the following general expression:
where
- is the snow load on the roof;
- , depending on the location of the construction site, is the characteristic value of the ground snow load, having a probability of exceedance in one year. is derived from the ground snow load map of the pertinent European country, as provided in the National Annex to the Eurocode;
- is the exposure coefficient, which defines the reduction or increase in the snow load on a roof of an unheated building caused by wind erosion. The exposure coefficient, depending on the roof’s exposure to wind, is the ratio between the snow load remaining on the roof in the actual exposure condition and the snow load on a normally exposed roof. As already mentioned, three different wind exposure conditions are considered: sheltered (), normal (), and exposed (). These depend not only on the terrain’s roughness (e.g., the terrain category [20]) but also on the wind velocity at the construction site during the winter season [21].
- is the thermal coefficient accounting for the variation of roof snow load as a function of the heat flux through the roof, which, in general, results in a melting of the snow cover and in a reduction in the roof load;
- is the snow load shape coefficient, i.e., the ratio of the snow load on the roof to the undrifted snow load on the ground, disregarding the influence of exposure and thermal effects and depending on the roof’s shape: flat, pitched, or curved
According to [16], the shape coefficient can also be considered as a function of the site’s exposure conditions. A new formulation of depending on has been proposed in the new draft of prEN1991-1-3:2020 [17], leading to the following expression:
The aim is to obtain a model better representing the snow load redistribution process due to the wind transport of snow particles from the windward to the leeward side [16], thus avoiding the inconsistencies resulting from the application of the current version of the standard in the case of exposed conditions, which leads to a general reduction of snow loads for both the leeward and windward sides of the roofs.
When using Equation (1) or Equation (2), the exposure coefficient and the thermal coefficient are usually considered as deterministic parameters, while the ground snow load (for which measurements are available) and the shape coefficient are described by random variables. Figure 1 illustrates the stochastic distribution of the parameters in the chain defining the actions induced by snow on roofs.
2.1. Ground Snow Loads
The ground snow load is the basic information needed to determine snow load for structural design [10,11]. Characteristic load values are usually estimated under the assumption of a stationary climate [1,2], starting with the statistical analysis of extreme values of snow water equivalent data, or snow depth measurements supplemented by an appropriate snow density model (generally depending on the climatic zone).
The best-fitting extreme distribution of ground snow load data depends on the specific climate conditions as well. The most widely used extreme distribution in Europe is the Gumbel distribution, which was adopted for the development of the majority of maps presented in Annex C to EN1991-1-3:2003 [10,11]. Considering specific local conditions, some countries consider alternative distributions: for example, the interactive snow map developed in Czech Republic [22] is based on the log-normal distribution.
The climatic snow load maps provide a synoptic or interactive representation of the characteristic values of ground snow load () at any potential construction site within a given geographical region.
In the Eurocode system, climatic maps for wind, snow, and temperature are included in the National Annexes, as prepared by the National Standard Body of each European country member of the European Committee for Standardization (CEN).
Generally, maps of snow load on ground are plotted virtually in reference to the sea level; the specific value pertaining to the considered site is thus derived by means of suitable snow load–site altitude relationships, depending on the climatic zone.
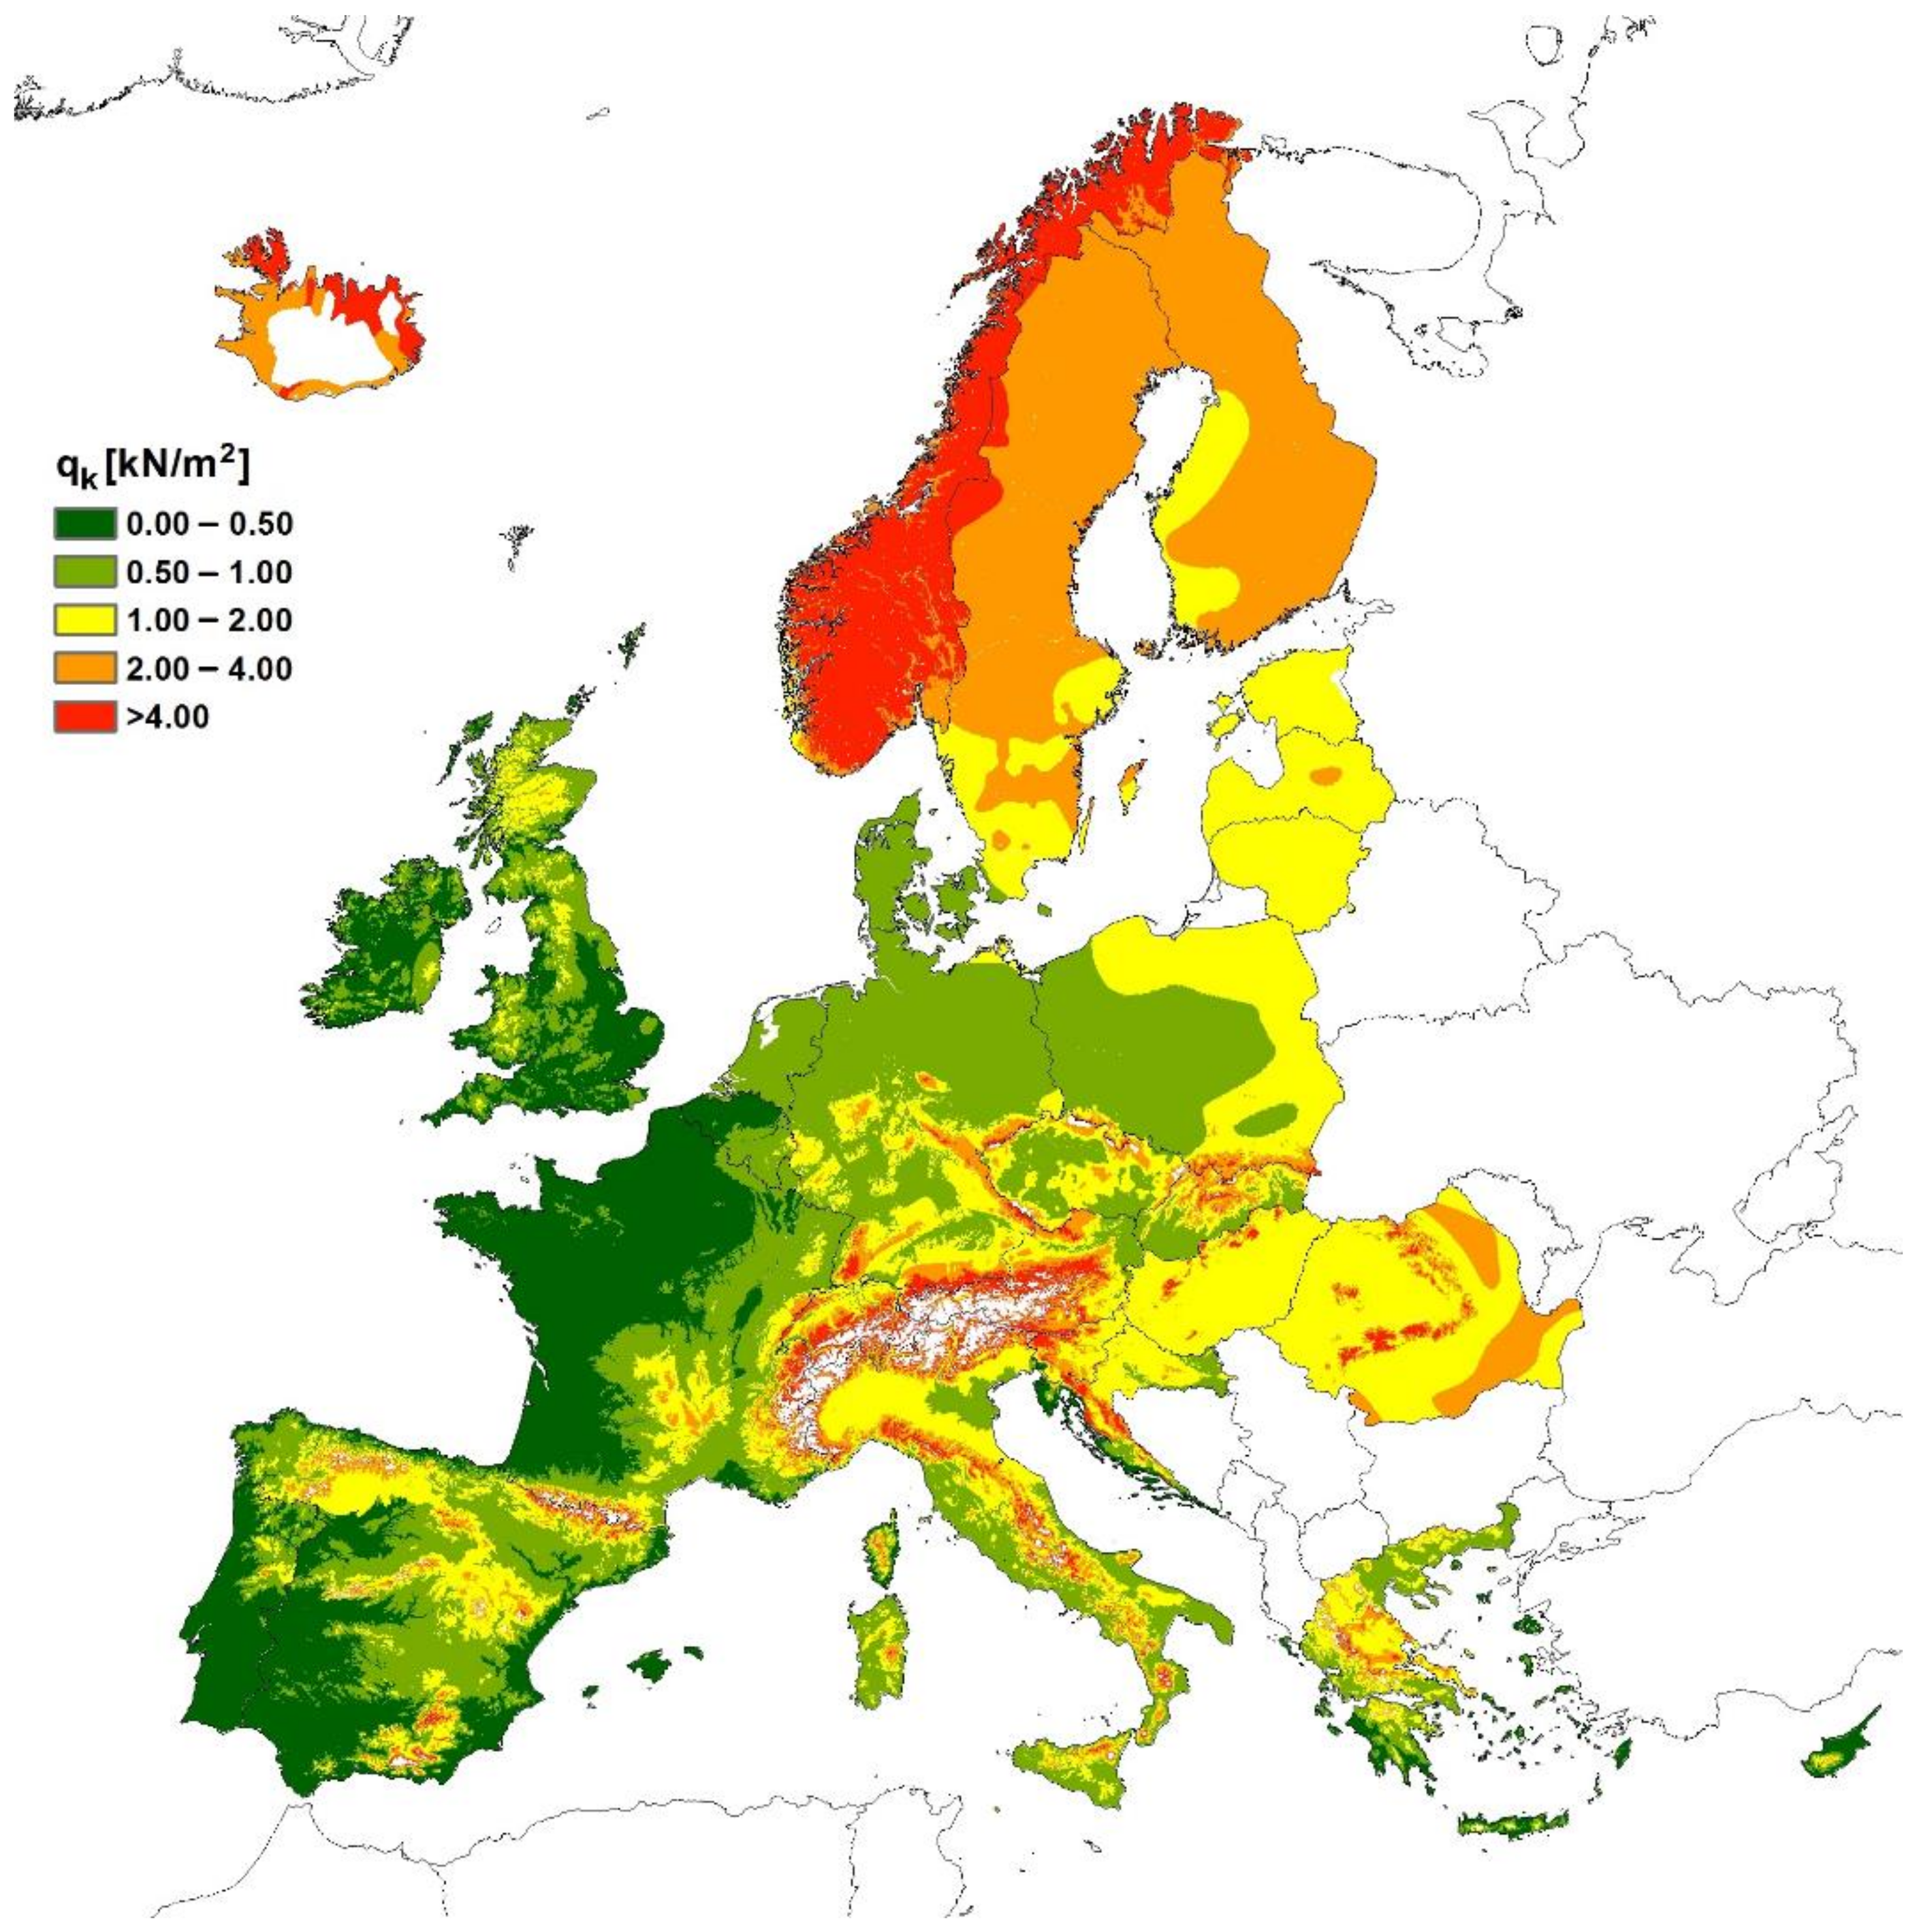
A critical review of the current definition of snow load maps in structural codes can be found in [11]. An example of modern map is summarized in Figure 2, where ground snow loads resulting from the assembly of all the National Annexes to EN1991-1-3_2003 [12] are plotted at the European scale.
It must be stressed that the distribution of the annual maxima of the ground snow load is often characterized by a high coefficient of variation (), especially in temperate climates [10,15]. This statement was also confirmed by the outcomes of European Snow Load Research Project (ESLRP) [10,15], which was funded by the European Commission. In fact, in the 18 European countries involved in the project, the of the snow extremes varied in a range between 0.2 and 2, with values reaching 6.0 in the Iberian Peninsula. Generally, is a function of the altitude of the site. Of course, low-altitude regions, where snow events are more irregular, are characterized by higher values. A synthesis of the most relevant data characterizing the 10 European climatic regions defined in the ESLRP is reported in Table 1, but more exhaustive information can be found in Annex 3 of the final report of the ESLRP [15].
2.2. Shape Coefficients
As pointed out before, the shape coefficient, allowing for the conversion of ground snow load into roof snow load, is a function of the roof’s geometry, the exposure of the site (i.e., the location of the roof relative to its surroundings [23]), and the wind conditions (e.g., the wind velocity at the building’s site during the winter season). Three different conditions are commonly defined: sheltered, semi-sheltered (normal condition), and windswept (exposed condition), depending on how trees, taller buildings, and other obstructions in the surroundings shelter the constructed roof.
Although in recent years ground snow load data have been collected and extensively studied all over the Europe [10,11], information about the shape coefficients is still inadequate [9].
Aiming to derive an appropriate probability density function for roof snow loads, a broad measurement campaign was performed in the United States [9,23], allowing for a statistical calibration of roof conversion factors for structural design.
Assuming a log-normal distribution for both ground and roof snow loads, design values of the shape coefficients () can be determined as
where and are the parameters of the distribution of roof snow load, and are the parameters of the distribution of ground snow load, and is the annual probability of exceedance ( in EN1990 [7]).
Snow data on roofs in Switzerland, Italy, the United Kingdom, and Germany were also collected over the course of the European Snow Load Research Project [15], but the dataset covers a limited number of years of records and roof geometries.
A significant database of nearly 1300 measurements of snow loads on roofs was collected by Høibø [24,25] for more than 200 agricultural buildings in Norway, covering the period 1966–1986. This large dataset of roof snow measurements, described in [16], has been used to define a new model for gable roofs, and has been included in the draft proposal of the new Eurocode on snow loads on structures (prEN1991-1-3:2020).
The mean values () and the standard deviations () of shape factors () for flat roofs in different exposure conditions, as derived from available measurements, are summarized in Table 2 for Europe, the United States, and Norway. Generally, mean values are higher for Europe than for the United States and Norway, while coefficients of variations for Europe and Norway are smaller than for the United States.
According to the assumption made in [9] for data from the United States, in the following a log-normal distribution is adopted for the conversion factors in Europe. However, since the ground snow load for Europe is generally not described by a log-normal distribution, Equation (3) cannot be directly applied to derive design shape coefficients, and a specific procedure to combine the pdfs of ground snow loads and conversion factors is proposed in view of the reliability assessment of the reliability of roof structures and the calibration of partial factors for snow loads.
Such a procedure, as described in the following section, suitably combines the uncertainties in both ground snow load and conversion factors, and also allows for the evaluation of design shape coefficients.
3. Evaluation of Design Shape Coefficients
As introduced in the previous section, the roof snow load can be obtained by multiplying two random variables: the ground snow load, , commonly described in Europe by an extreme value type I distribution (Gumbel), and the shape coefficient or conversion factor () described by a log-normal distribution. Under the assumption of independence of the two variables, the probability distribution function for the annual maximum of the roof snow load can be derived as
Consequently, the probability that a given value of roof snow load is not exceeded can be computed as
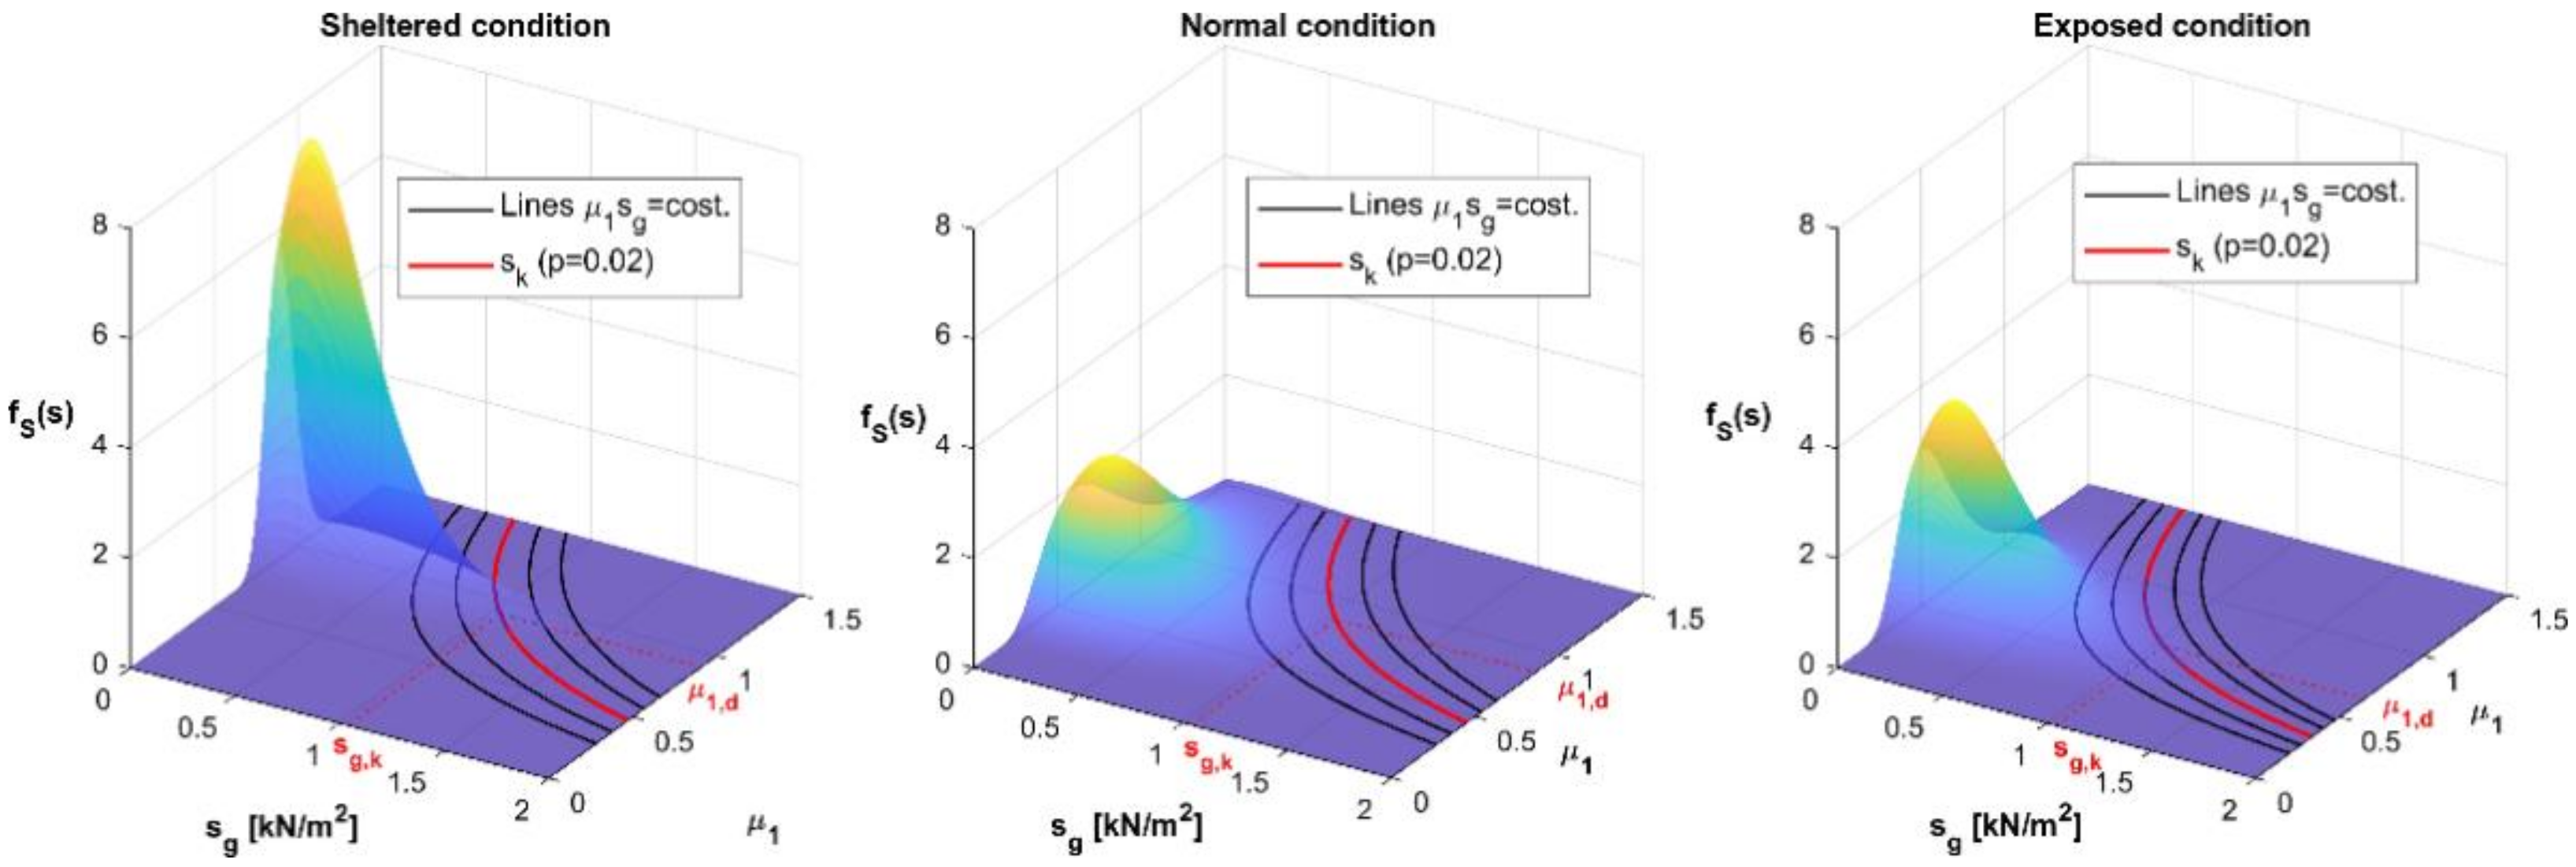
No closed forms of these joint pdfs or cumulative distribution functions (CDFs) are available, but they can be obtained by suitable numerical approaches. The evaluation of the shape coefficient for flat roofs () in a relevant case study is illustrated in the following.
The case study illustrates the evaluation of the shape coefficient for flat roofs in different exposure conditions, considering the Lodi weather station in Italy where the snow load on ground is characterized by .
In the study, the typical European values already given in Table 2 have been assumed for mean values () and standard deviations () of the shape coefficients.
In that case, Equation (5) is the volume under the joint pdf delimited by the vertical sectional area described by constant values [26], i.e., the black curves in Figure 3, which can be computed by using the Monte Carlo method.
Once the characteristic value of roof snow load is derived, with an annual probability of exceedance , the design shape coefficient results in
where is the characteristic value of the ground snow load.
In Figure 3, the evaluation of design shape coefficient is provided by the intersection between the red dashed line corresponding to the characteristic ground snow load and the red curve corresponding to the characteristic value of snow load on roofs . In the considered case study, assuming an annual probability of exceedance , the design values of the shape coefficients () are thus equal to 0.91, 0.86, and 0.65 for sheltered, normal, and exposed conditions, respectively.
4. Design Values of Shape Coefficients
Despite the fact that actual structural codes generally provide constant values for shape coefficients, more refined approaches should duly consider their variations as a function of the climatic region.
Design values of shape coefficients should be derived in such a way so as to transform the characteristic value of the ground snow load into the characteristic value of the roof snow load. Assuming an extreme value type I distribution, the CDF of the ground snow load is given by
with and being the location and the scale parameter, respectively.
By means of the procedure described in the previous section, the design shape coefficient can be obtained for different ground snow load distributions, suitably varying the two descriptors and . In this way, curves for design values of shape coefficients can be derived as a function of the product between and , following the procedure proposed in [26] for wind loads. However, since the statistical parameters and may not always be accessible, in the present study the curves are derived as a function of the coefficient of variation of the annual maxima of the snow load on the ground (). Indeed, the extreme value parameters can be estimated from the mean value and the coefficient of variation of the annual maxima of the snow load by means of the method of moments:
To give a broad view of the results characterizing different weather stations and exposure conditions and to provide a tool for designers, curves for the design values of roof shape coefficients for flat roofs () and pitched roofs () are summarized in the next subsections as a function of .
4.1. Flat Roofs
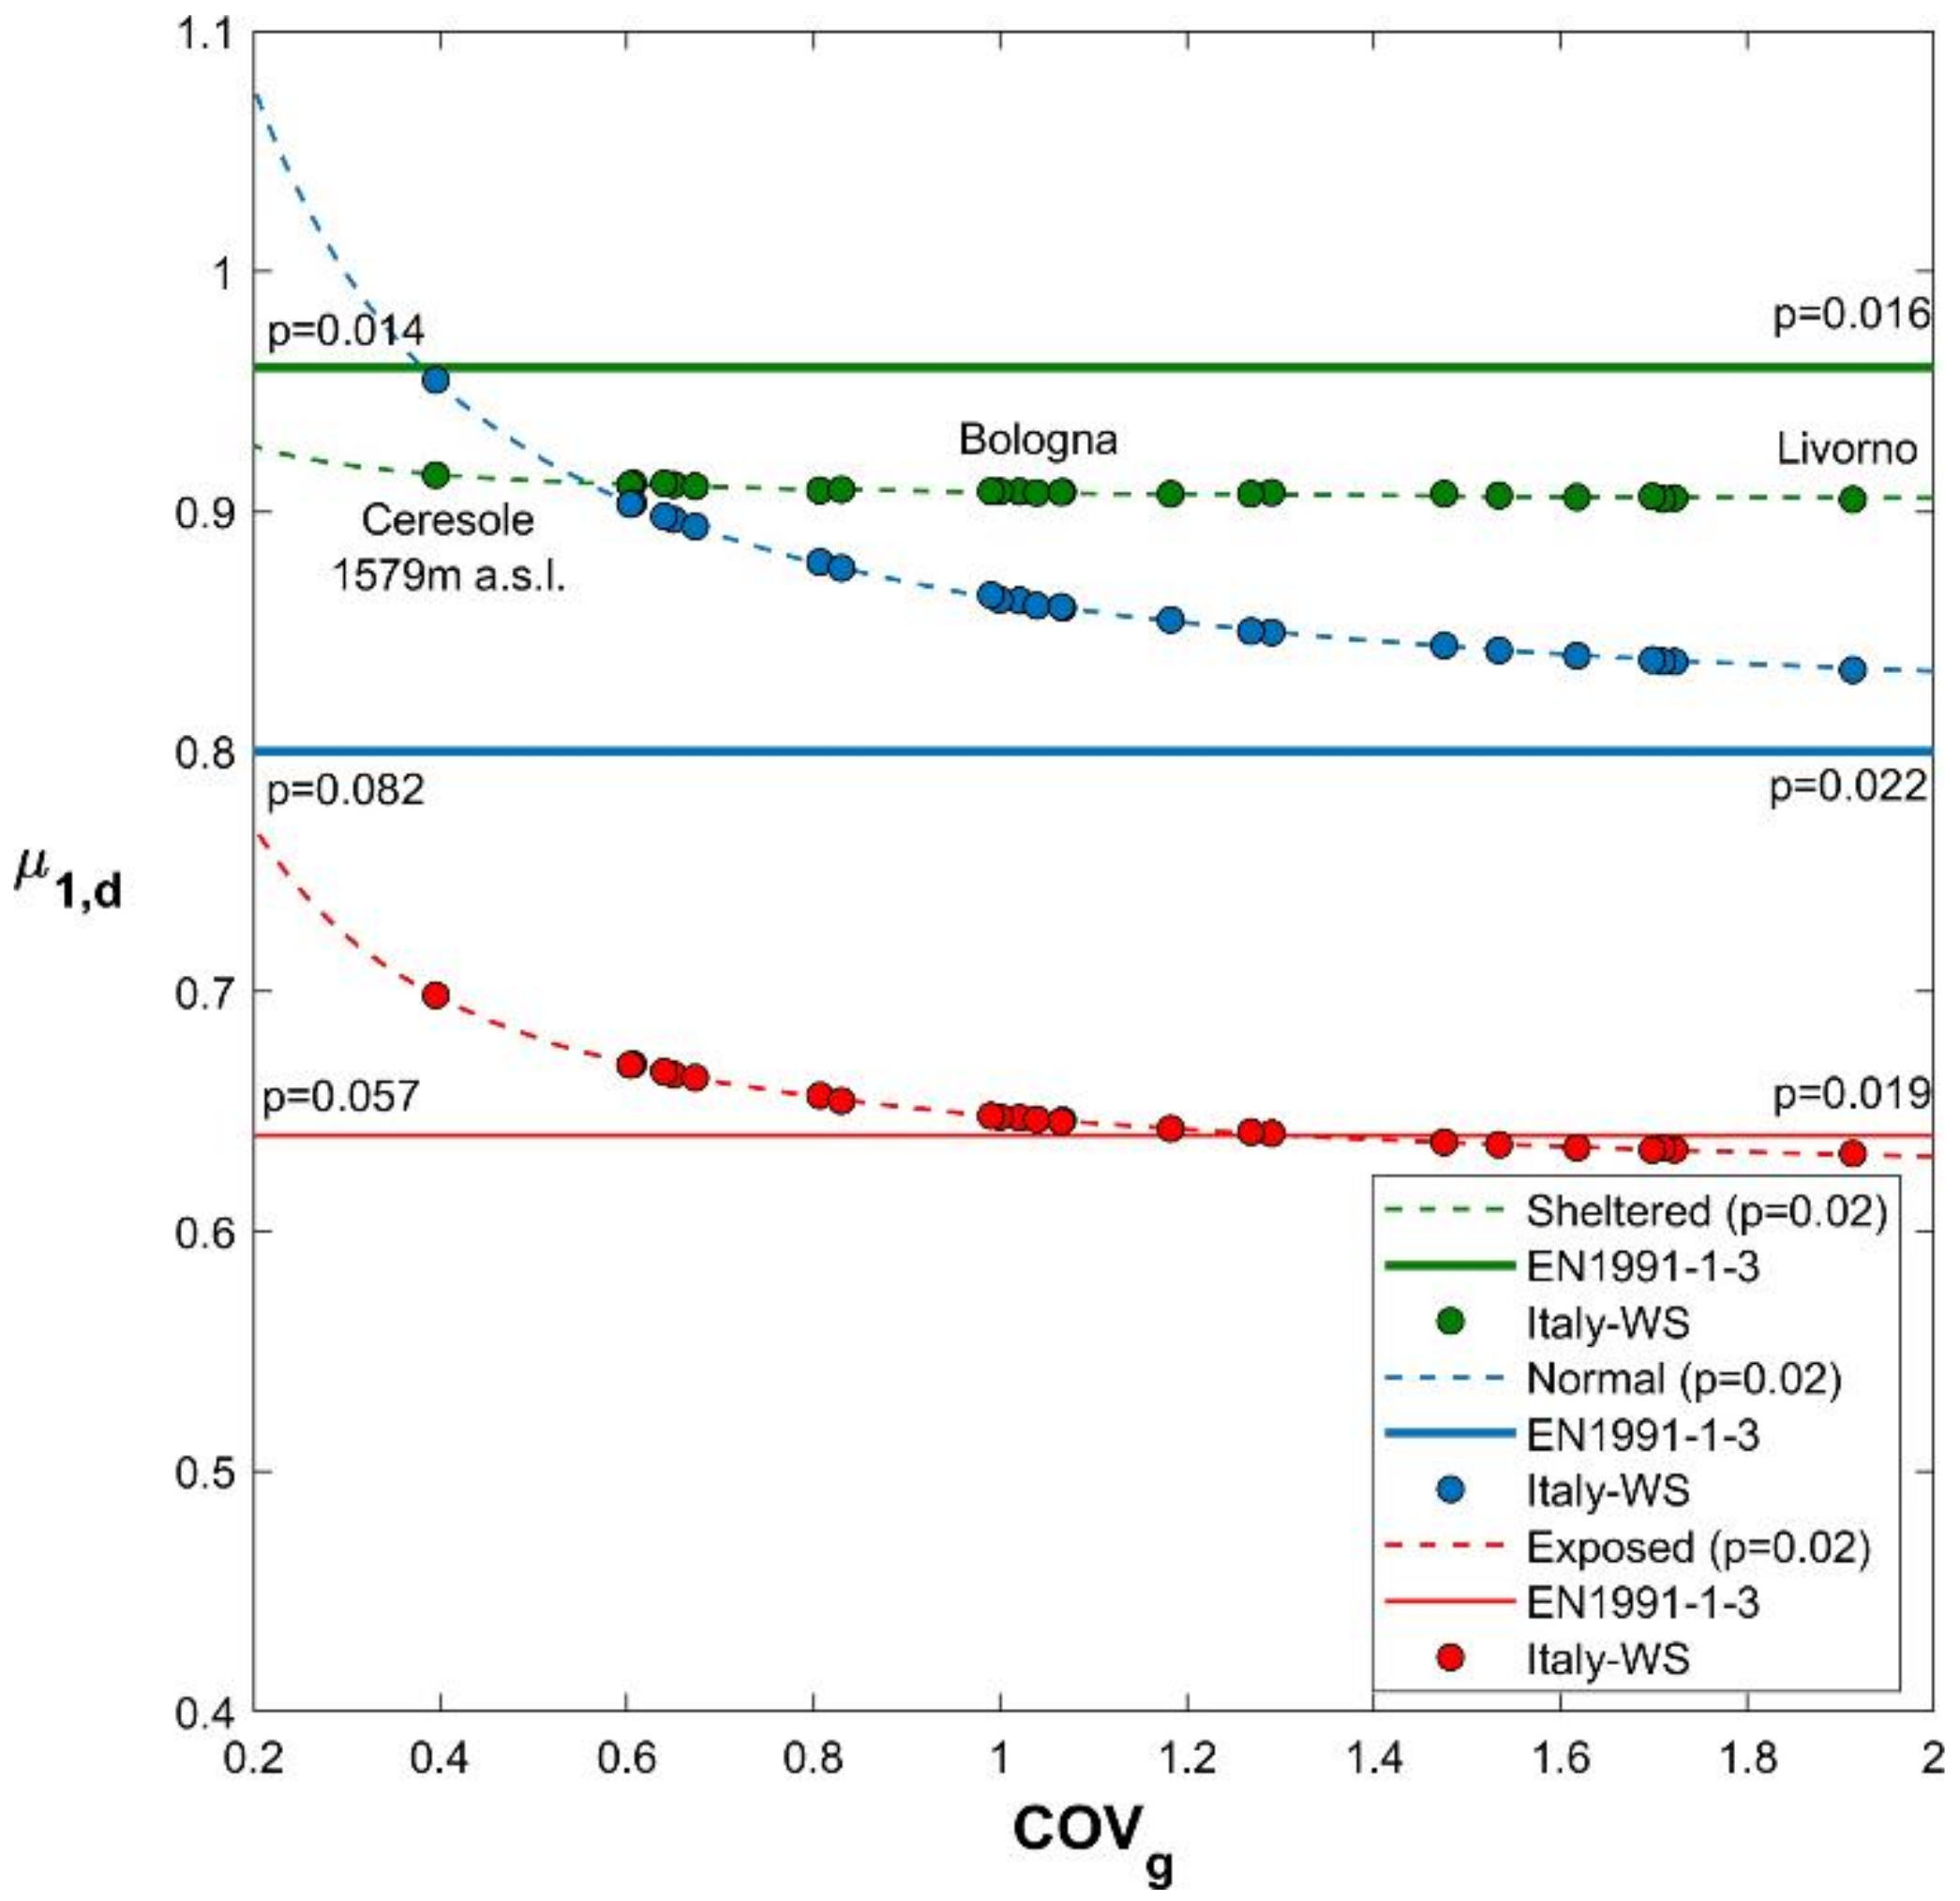
Design values of shape coefficients of flat roofs () are illustrated in Figure 4 as a function of the coefficient of variation of the annual maxima of ground snow load (). In the diagram, where each dashed curve corresponds to a specific exposure condition (the green curve to the sheltered condition, the blue curve to normal condition, and the red curve to the exposed condition), the analogous, green, blue, and red, horizontal solid lines corresponding to the constant values of the provided in EN1991-1-3:2003 have also been reported. These have been kept unchanged in the prEN1991-1-3:2020. The considered range of , , has been chosen to cover all the values that can be realistically expected in Europe (see Section 2.1).
Figure 4 shows the point values derived, in the three exposure conditions, from the data available from 25 Italian weather stations, suitably covering lowland (), medium altitude (), and mountain () sites.
To facilitate the interpretation of the results, Figure 4 shows the annual probabilities of exceedance correlated with the design value of the snow load on roofs derived using the constant value shape coefficients provided in the Eurocode, in the case the coefficient of variation of the extreme value distribution of the snow load on the ground equals its lower or upper bound, i.e., or .
Eurocode provisions lead to roof snow loads characterized by an annual probability of exceedance varying between , if , and , if , in case of normal exposure conditions. These vary between , if , and , if the in exposed conditions. It is worth noting that, in sheltered conditions, owing to the fact that the variations of the measured conversion factors are small, the Eurocode leads to roof snow loads characterized by nearly constant annual probabilities of exceedance ().
Looking at the results reported in Figure 4, it appears that the Eurocode approach (adopted in EN1991-1-3:2003 as well as in prEN1991-1-3:2020) is slightly unconservative for normal conditions, while it fits the target probability for exposed conditions, and is slightly conservative for sheltered conditions. In any case, the differences are generally limited and comparable with those linked with the usual model uncertainties.
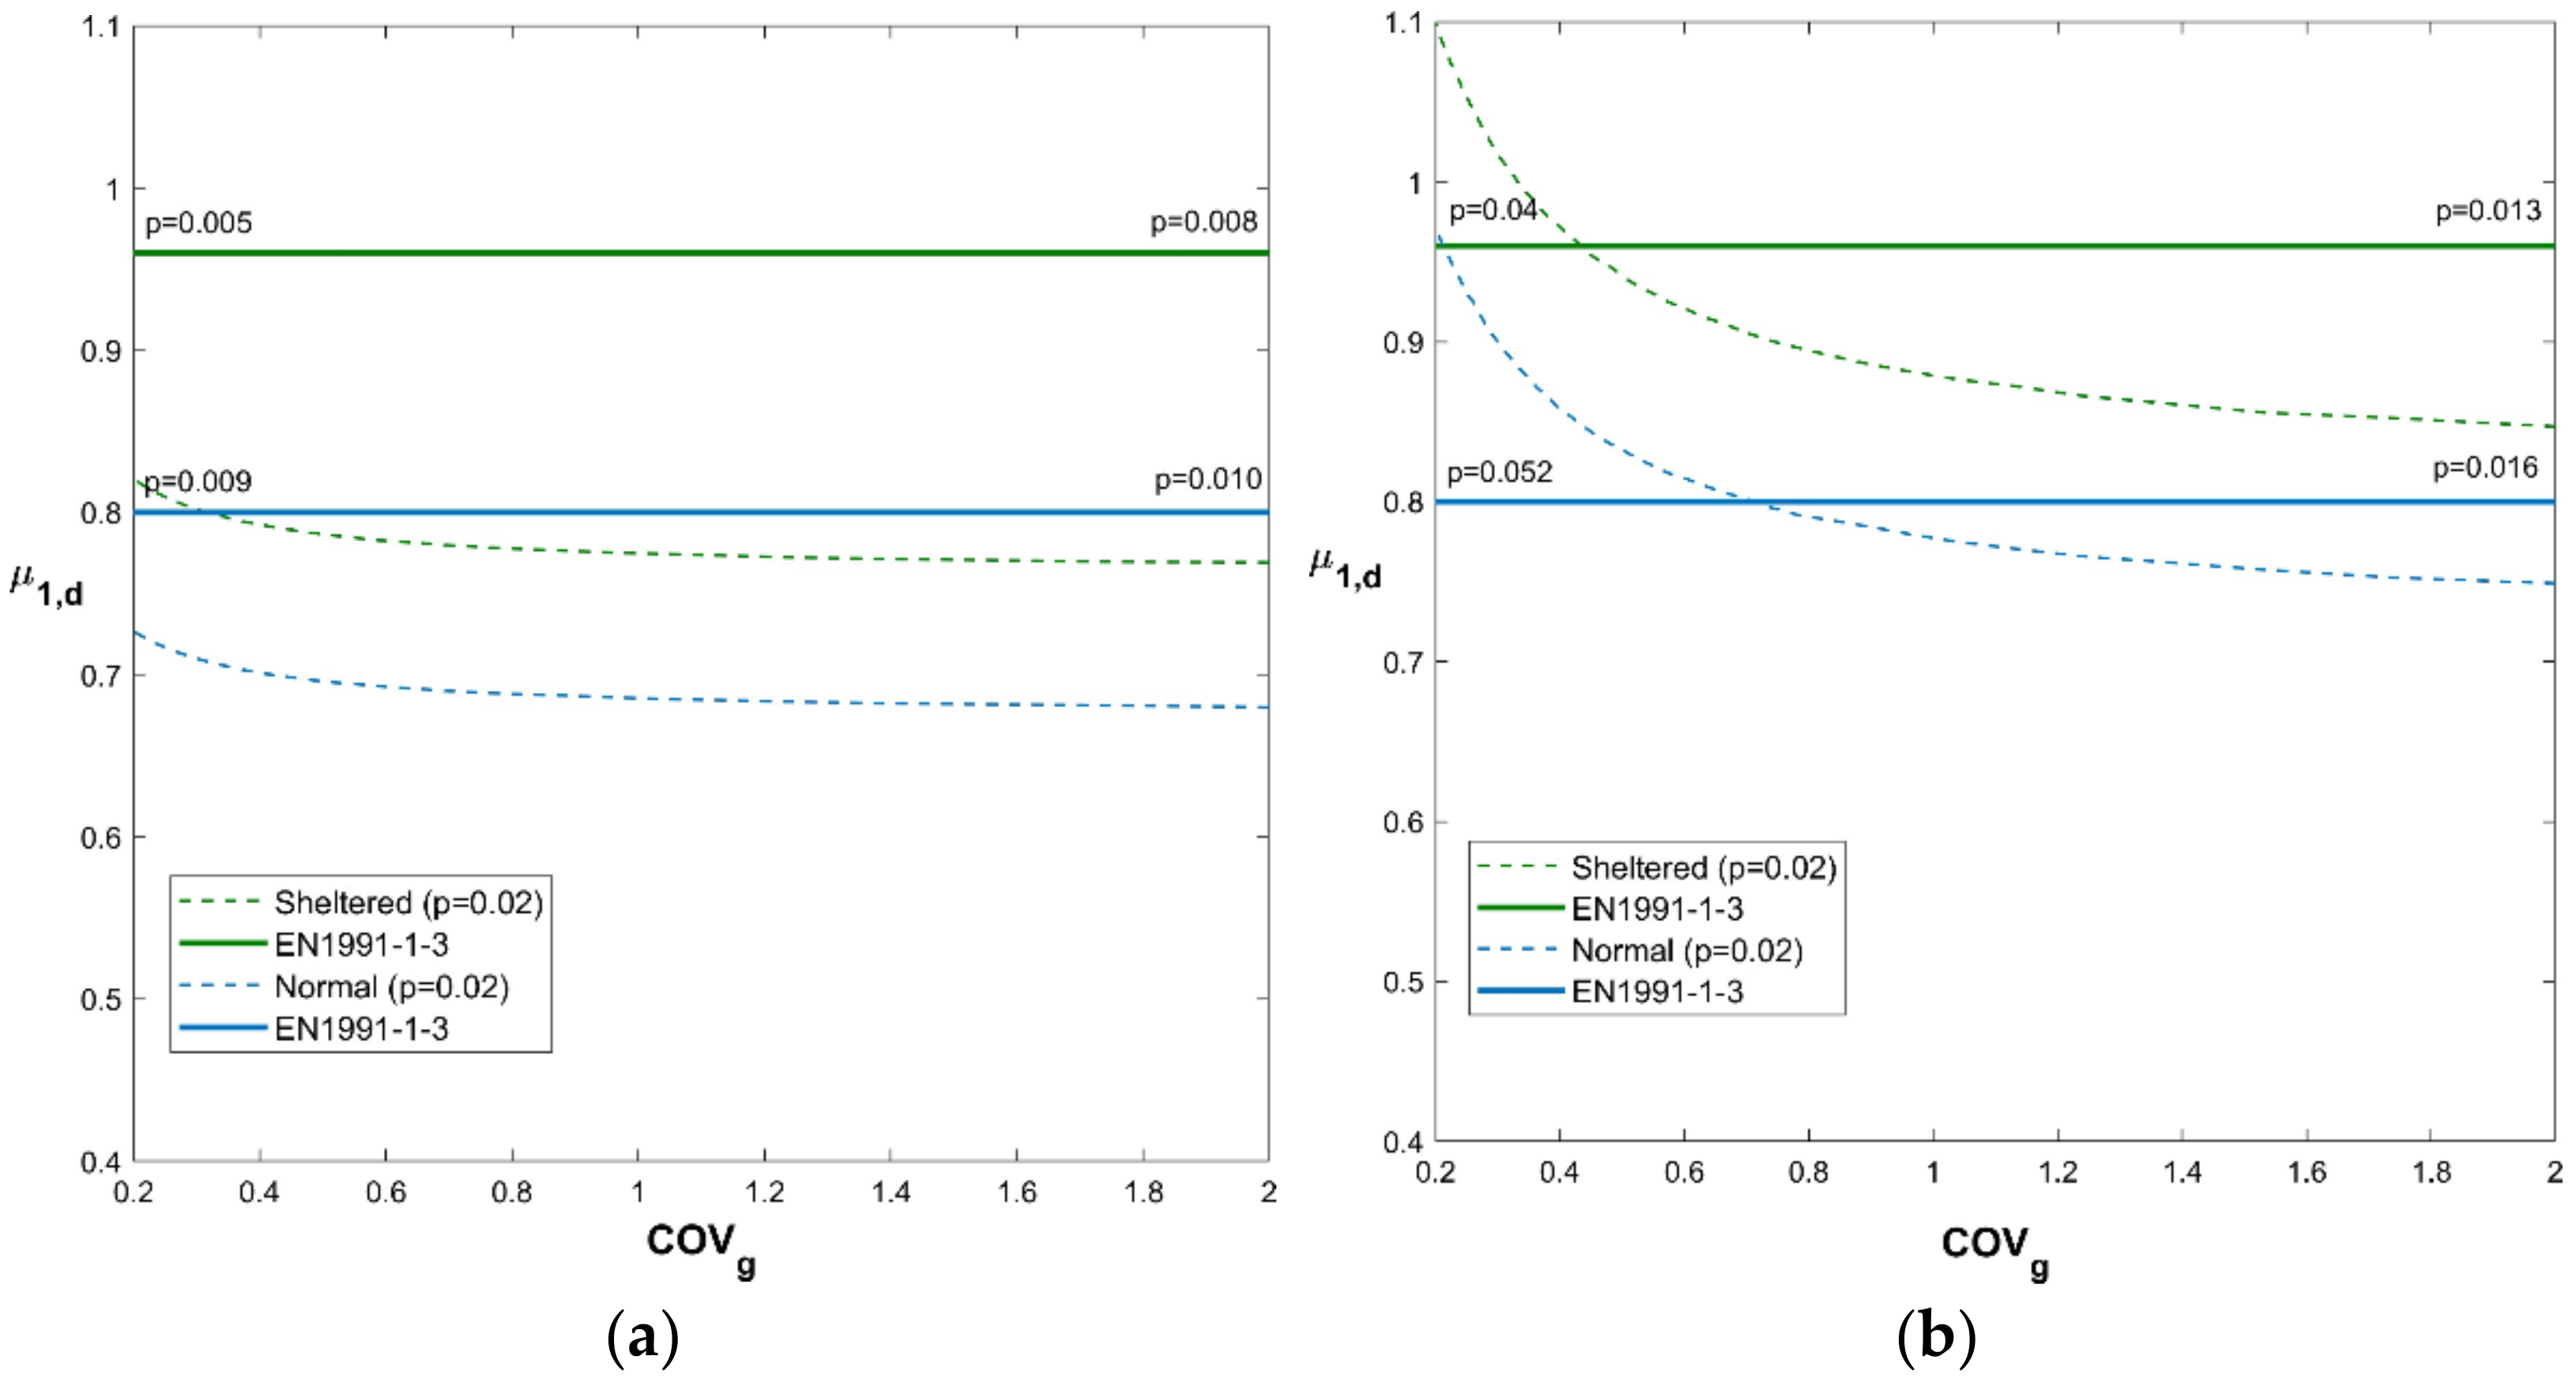
Moreover, considering the Norwegian database [16,24,25], where snow load on roofs is usually characterized by low values of the coefficient of variation (see Table 2), different outcomes are obtained for flat roofs (see Figure 5a). In fact, in that case, the design shape coefficients determined using the Eurocode approach are conservative both for sheltered () and normal exposure (), while no data are available for exposed conditions.
Considering that in other climatic European regions higher variability can be expected for snow load on roofs, the applicability of the Norwegian dataset to different climates has been also checked, adopting a safe-sided approach using an artificial increase in the coefficient of variation of the shape factor (), thus assuming .
The obtained results are summarized in Figure 5b. It must be underlined that in that case the Eurocode obviously leads to increased annual probabilities of exceedance, with for sheltered exposure and for normal exposure.
Clearly, the design shape coefficient curves depend on the assumed distribution for ground snow load extremes. As mentioned, while in Europe a Gumbel distribution, also said type I extreme value distribution (EVI), is usually adopted [10,11], in the United States a log-normal distribution seems more suitable to model ground snow load extremes, as suggested in [9].
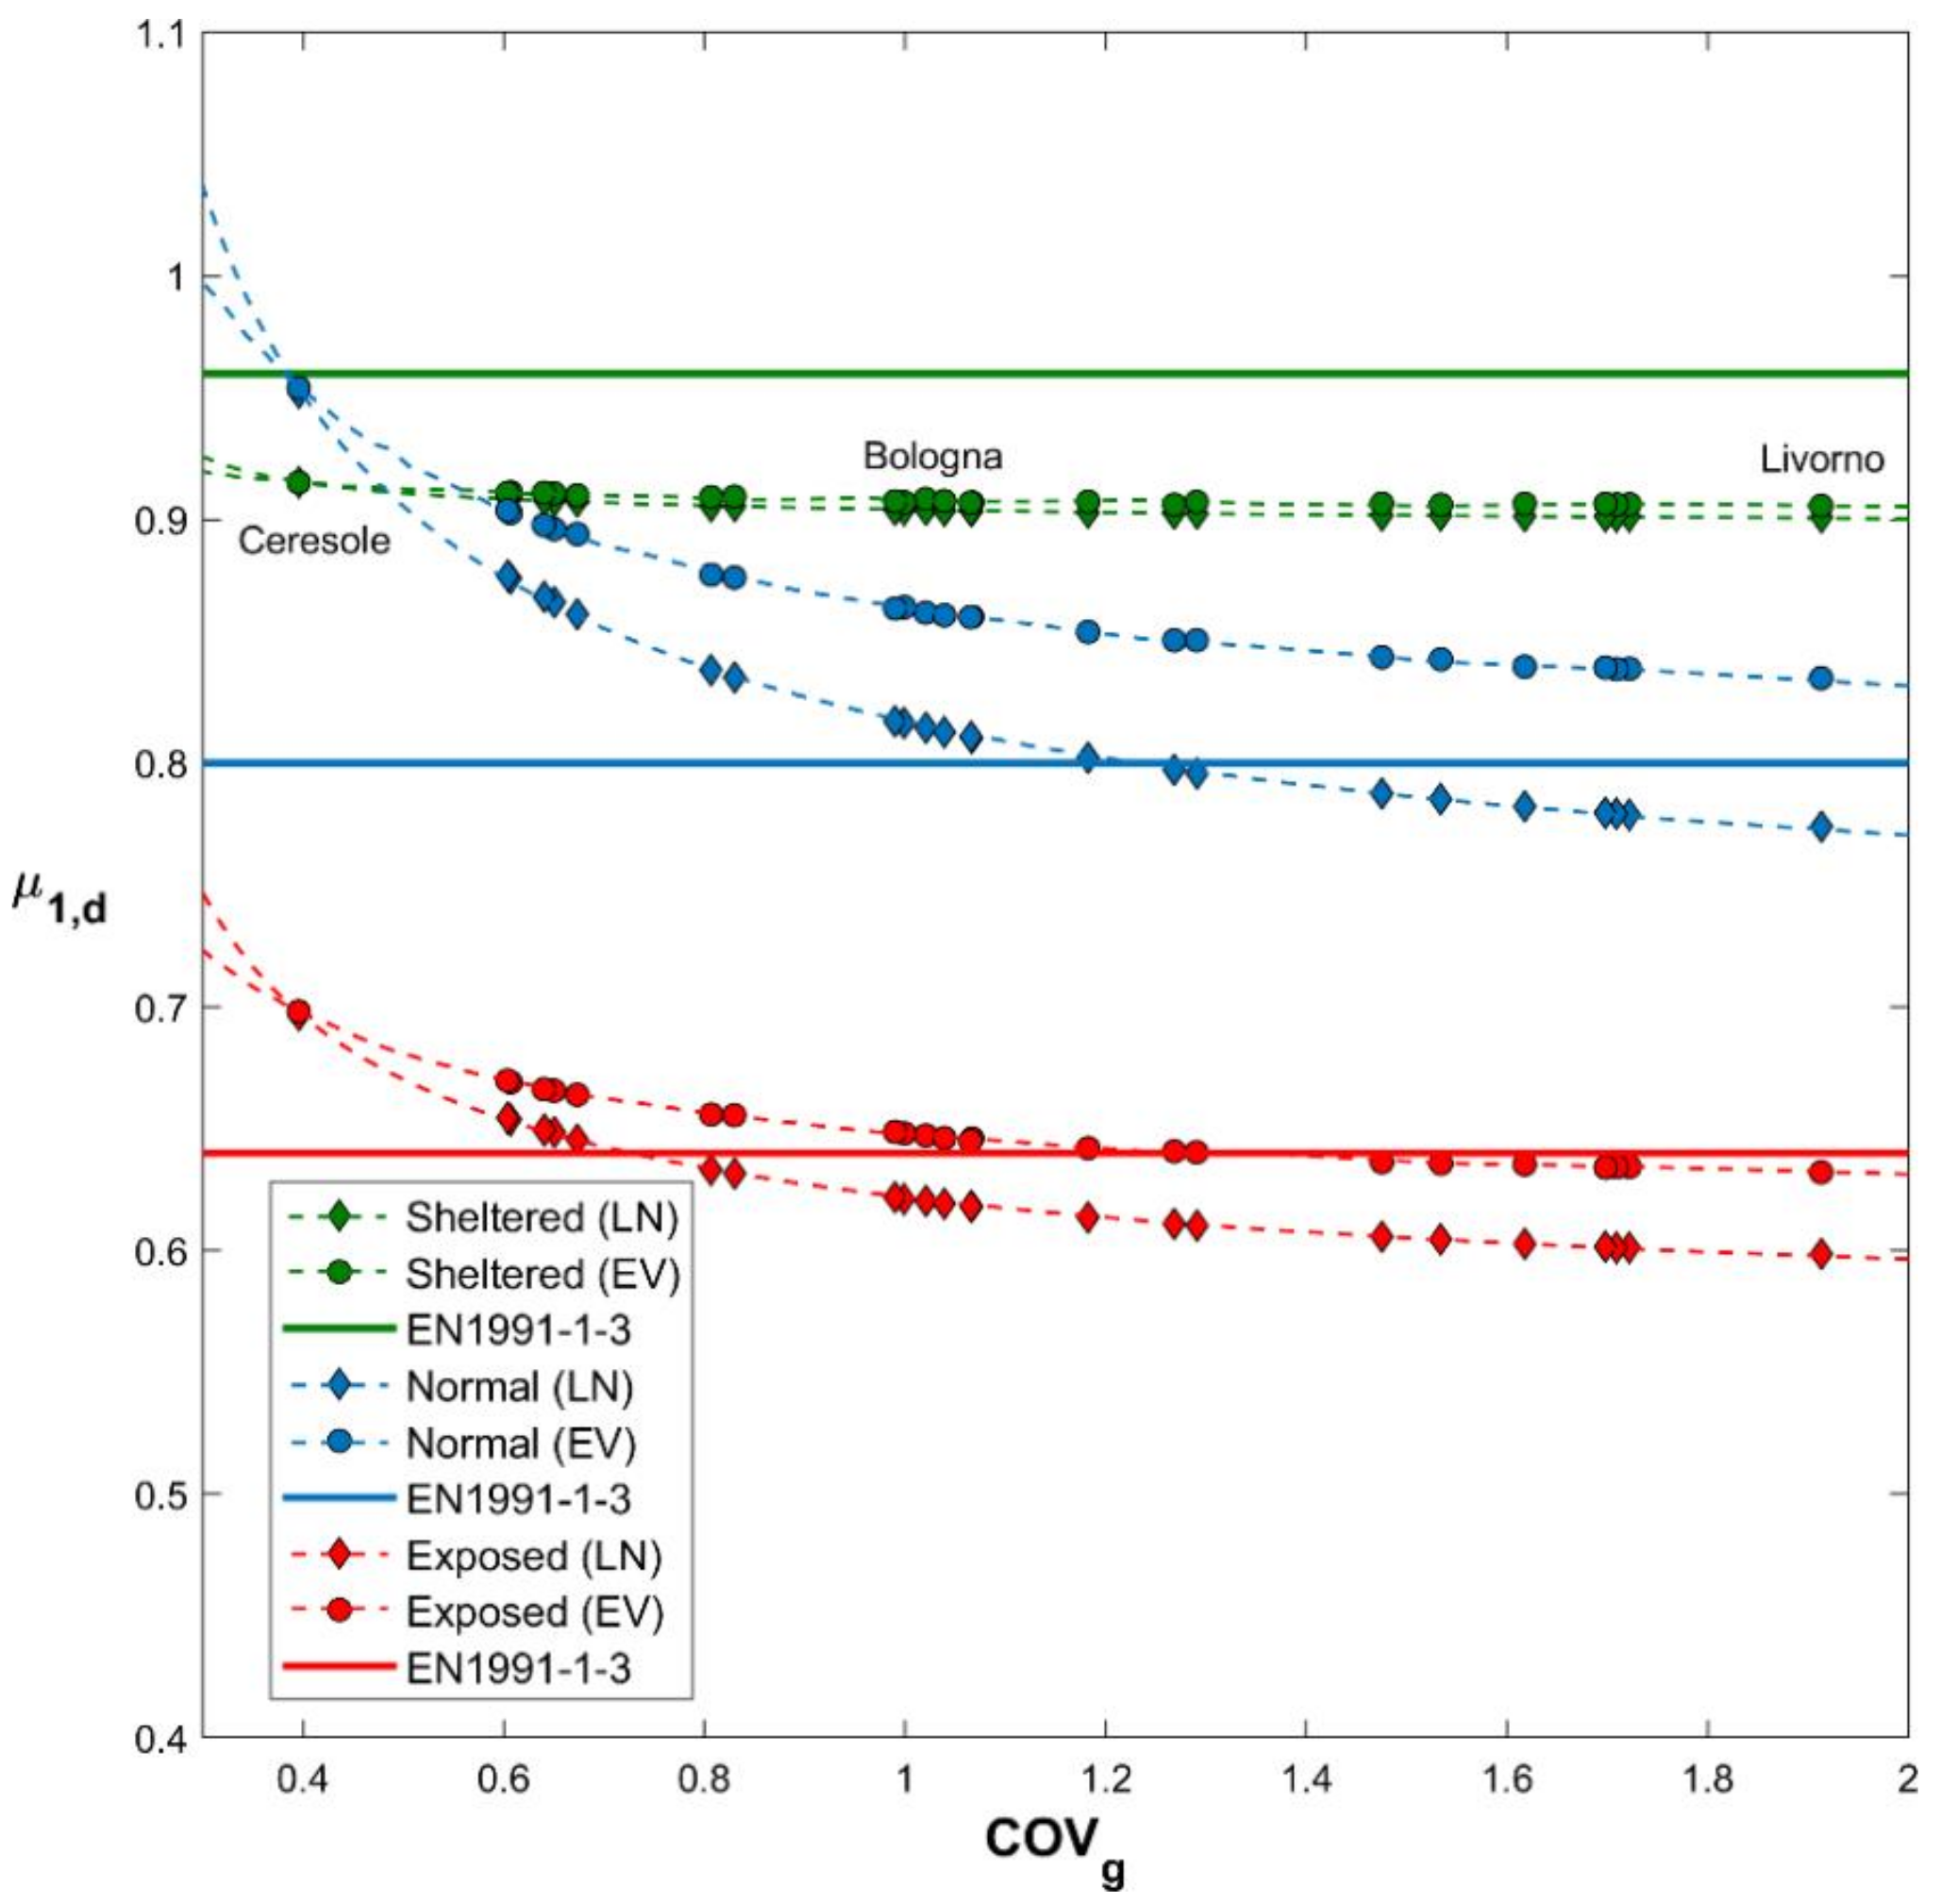
Aiming to assess the influence of the assumed extreme value distribution of the snow load on ground on the shape coefficient, the shape coefficient () curves obtained adopting a log-normal distribution (see Equation (3)) are compared in Figure 6 with those obtained adopting the Gumbel distribution for the 25 Italian weather stations considered here.
In the diagram, which takes into account a belonging to the interval , curves with circular markers pertain to log-normal distribution, and curves with lozenge markers pertain to the Gumbel distribution. The comparison demonstrates that assuming a Gumbel distribution generally leads to more conservative results in terms of the estimation of the design shape coefficient.
4.2. Pitched Roofs
Owing the fact that few data for pitched roofs have been collected in the framework of the European Snow Load Research Project [15], in the present study the main reference is the previously mentioned database of Høibø [24,25], which contains information on more than 200 buildings located in various Norwegian areas. In these areas, the ground snow loads associated with an annual probability of exceedance belong to the interval , and mostly vary between and .
That database, representing one of the most comprehensive collections of measurements for snow load on roofs, has been also used for the development of the new model for gabled/pitched roofs provided in the new version of the EN1991-1-3 [17].
Following [16], the observed data are grouped in different exposure classes as a function of the so-called asymmetry coefficient (), which is the ratio between the snow load on the leeward side and the snow load on the windward side of the roof.
The asymmetry coefficient usually satisfies the inequalities of
in sheltered conditions,
in normal conditions, and
in exposed conditions.
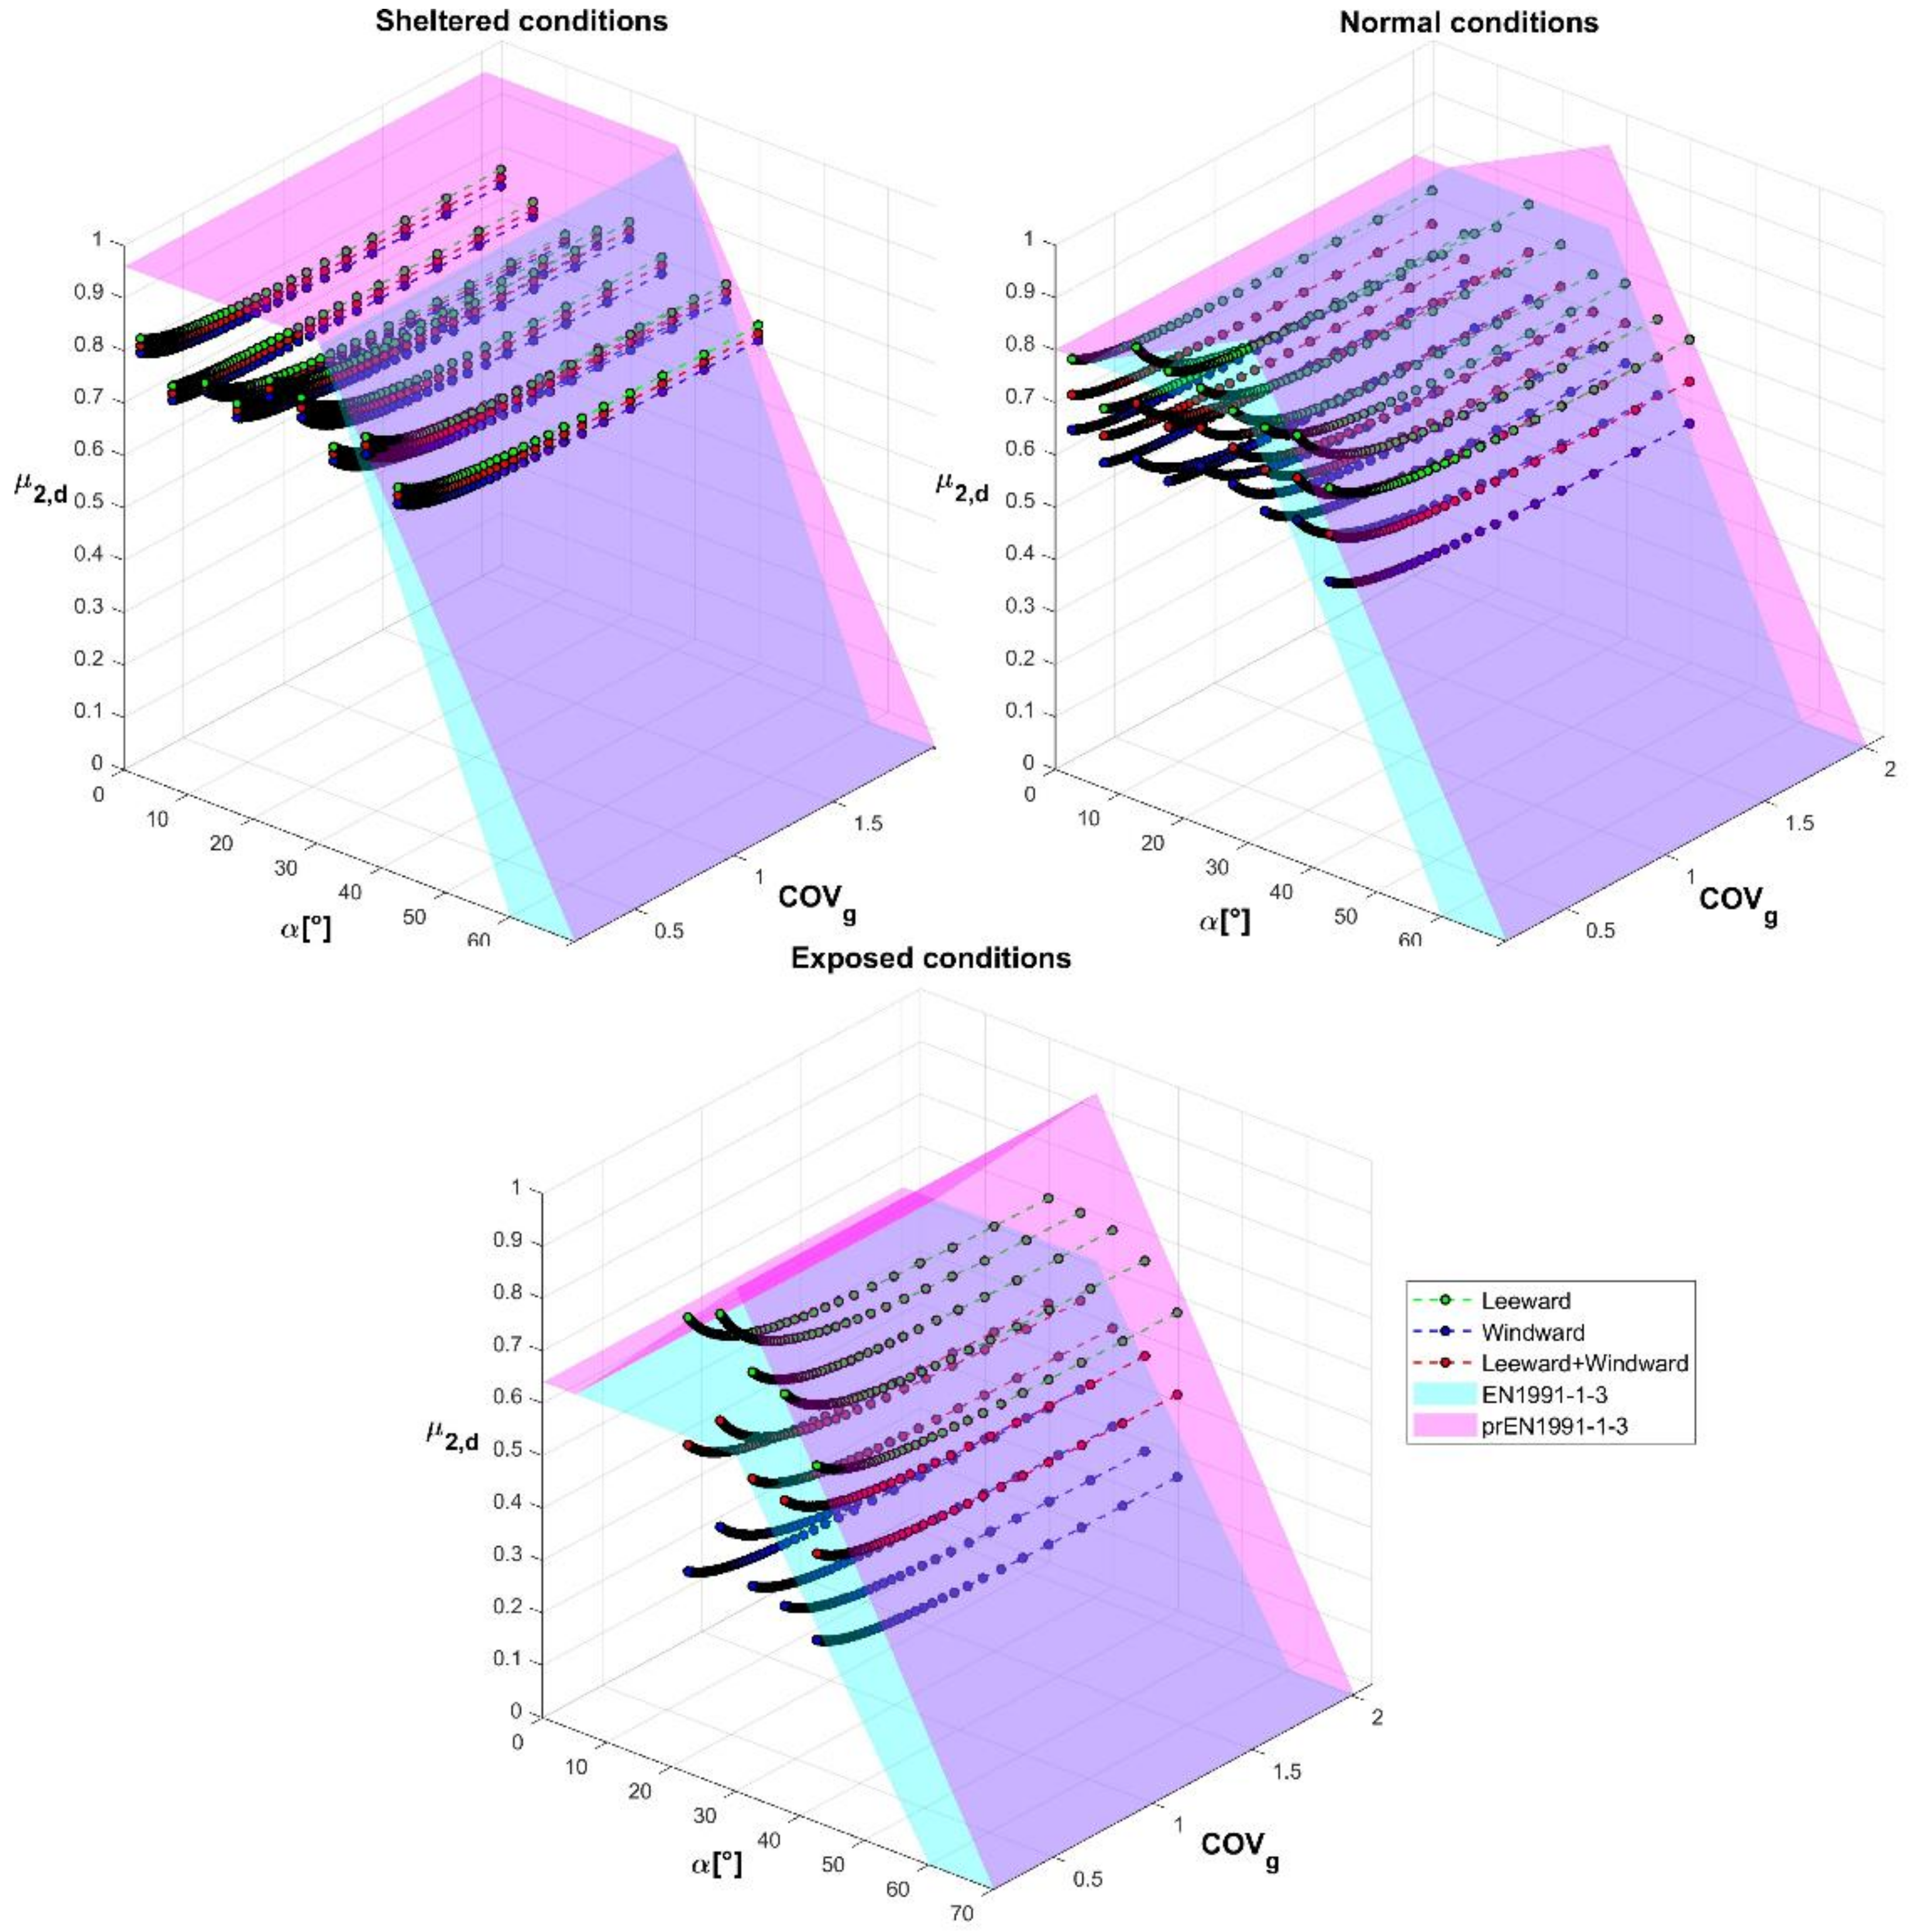
Starting from the data collected in the above recalled database, design shape coefficients () have been evaluated for pitched roofs of different slopes, according to the procedure already presented for flat roofs in the previous section. The results are summarized in Figure 7, which illustrates the variation of design shape coefficients as a function of the pitch angle and for different exposure conditions (exposed, normal, and sheltered) in the leeward and windward sides of the roofs.
The outcomes are compared with the provisions of the EN1991-1-3 model (in cyan) and the prEN1991-1-3 model (in magenta). The diagram shows the so-called “leeward+windward” curves, which correspond to a “balanced” situation and are obtained as the mean value between the leeward and windward side values.
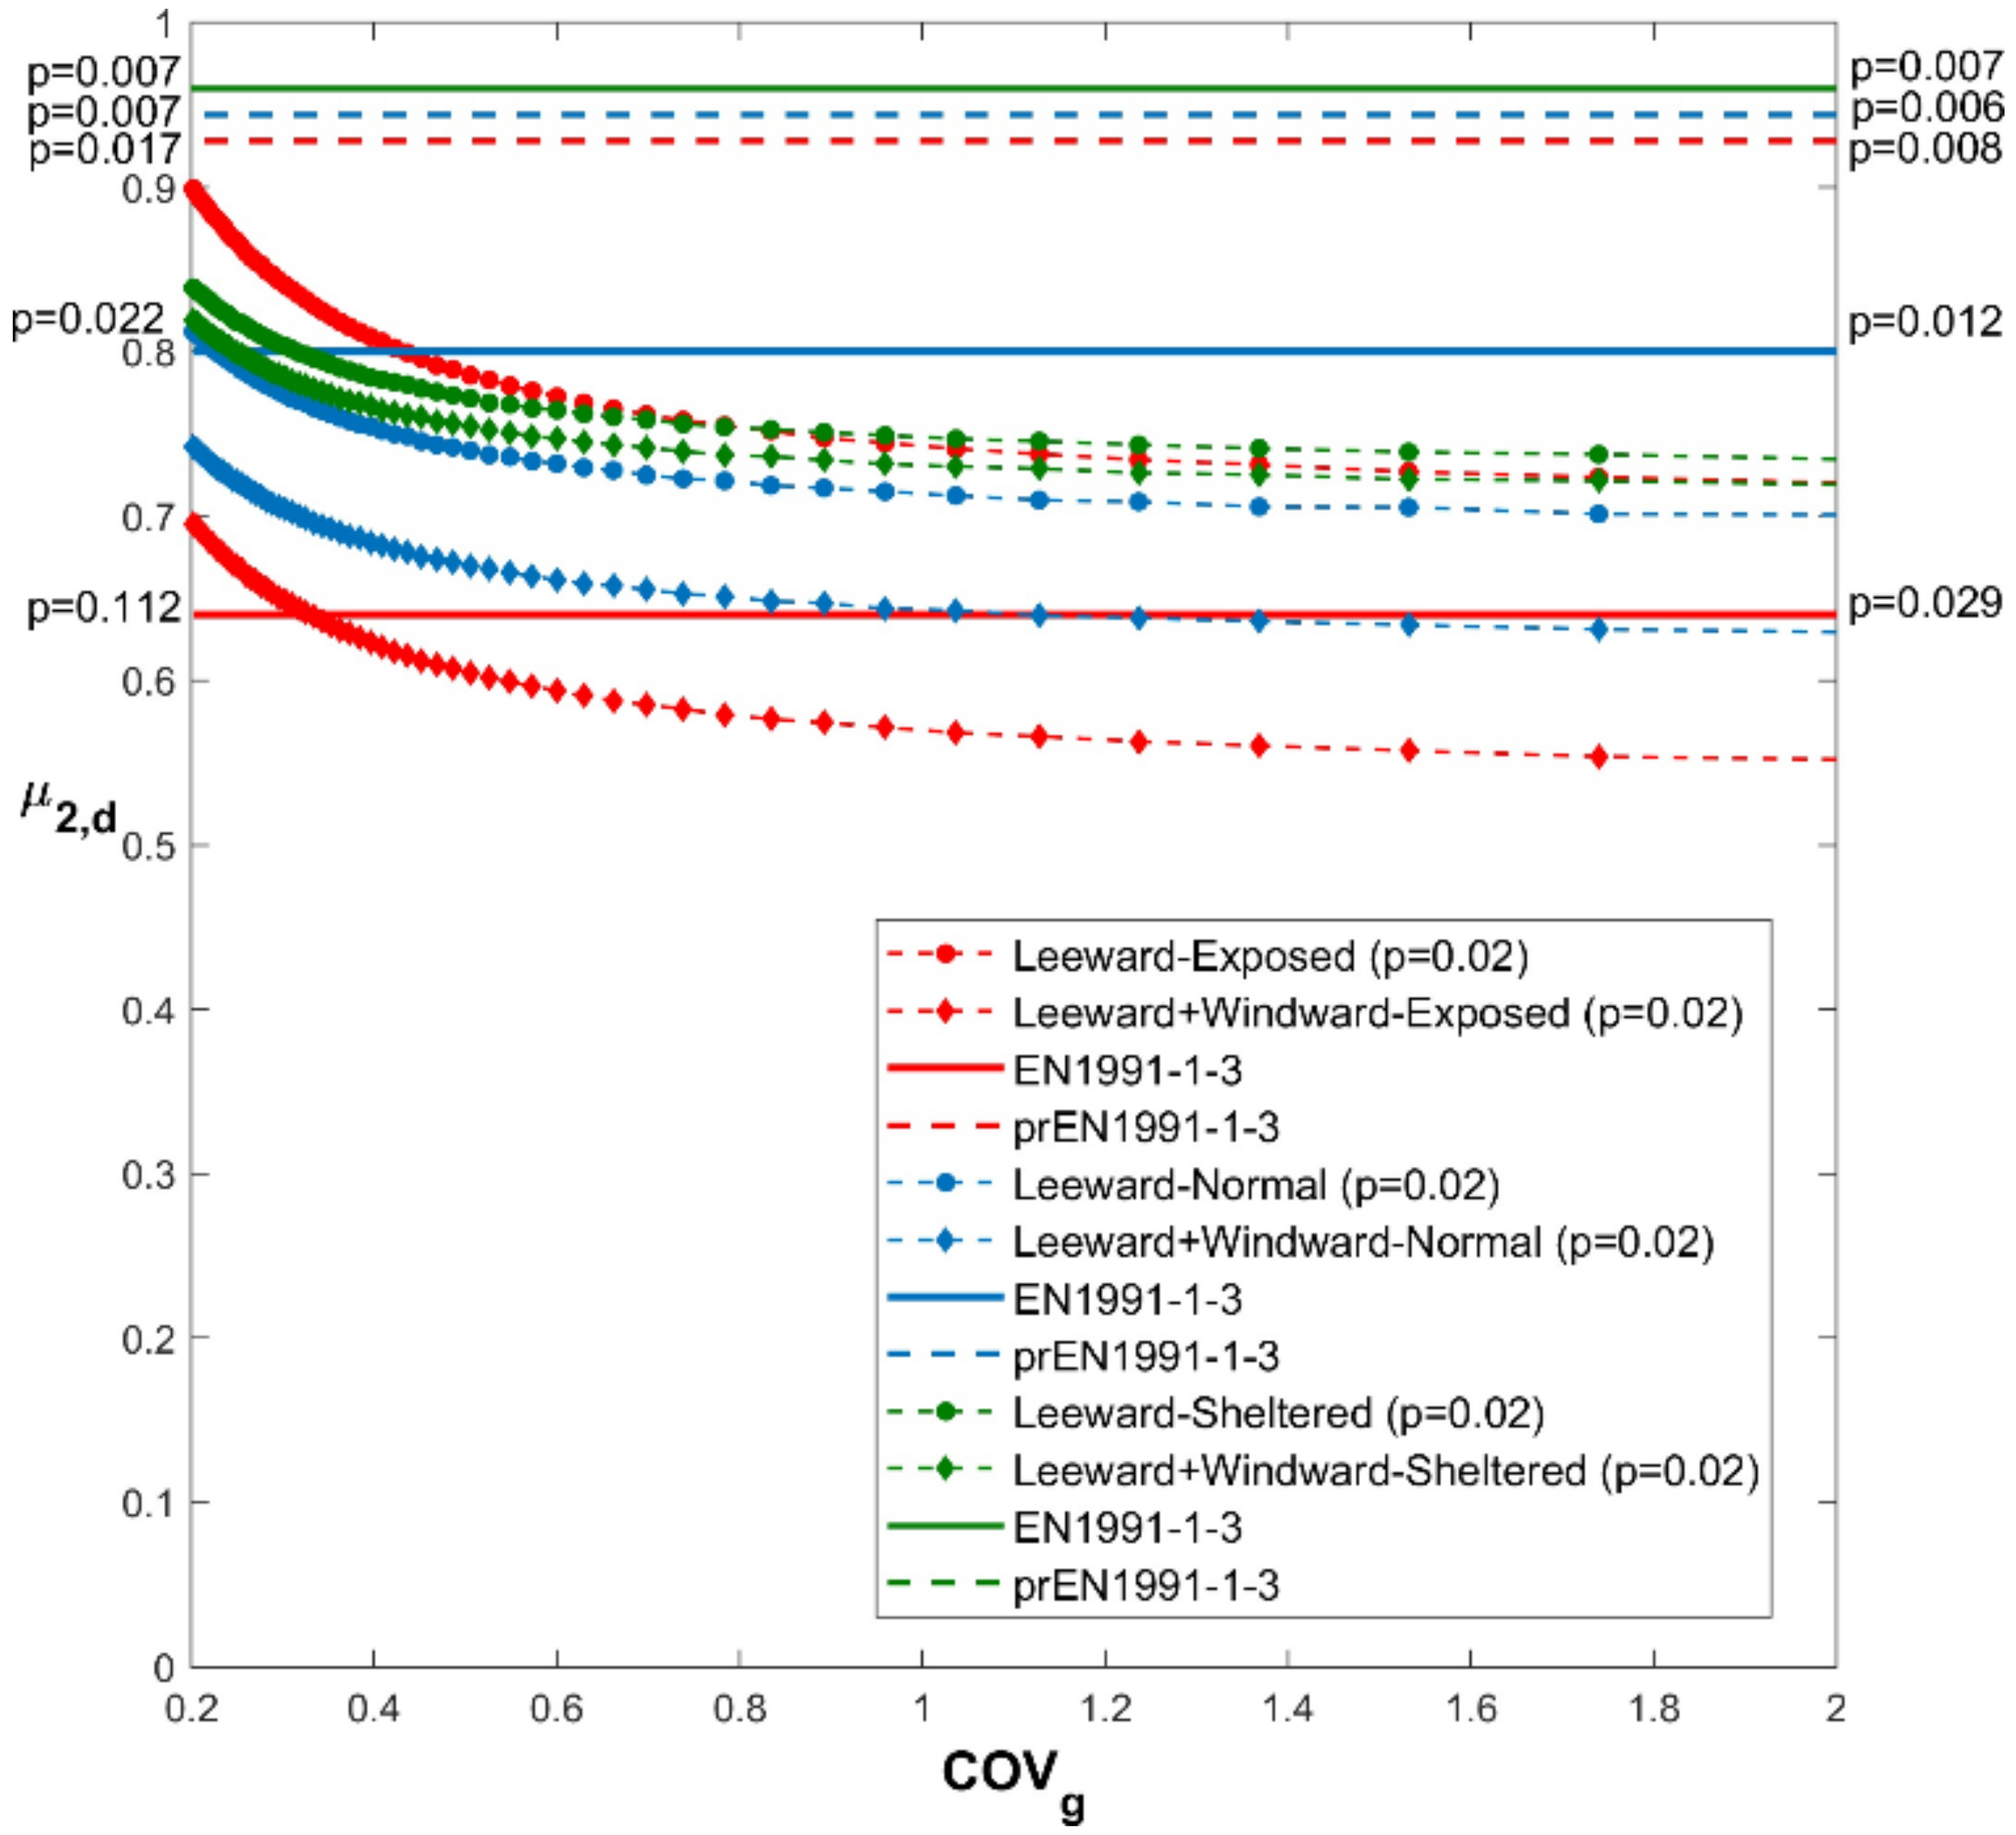
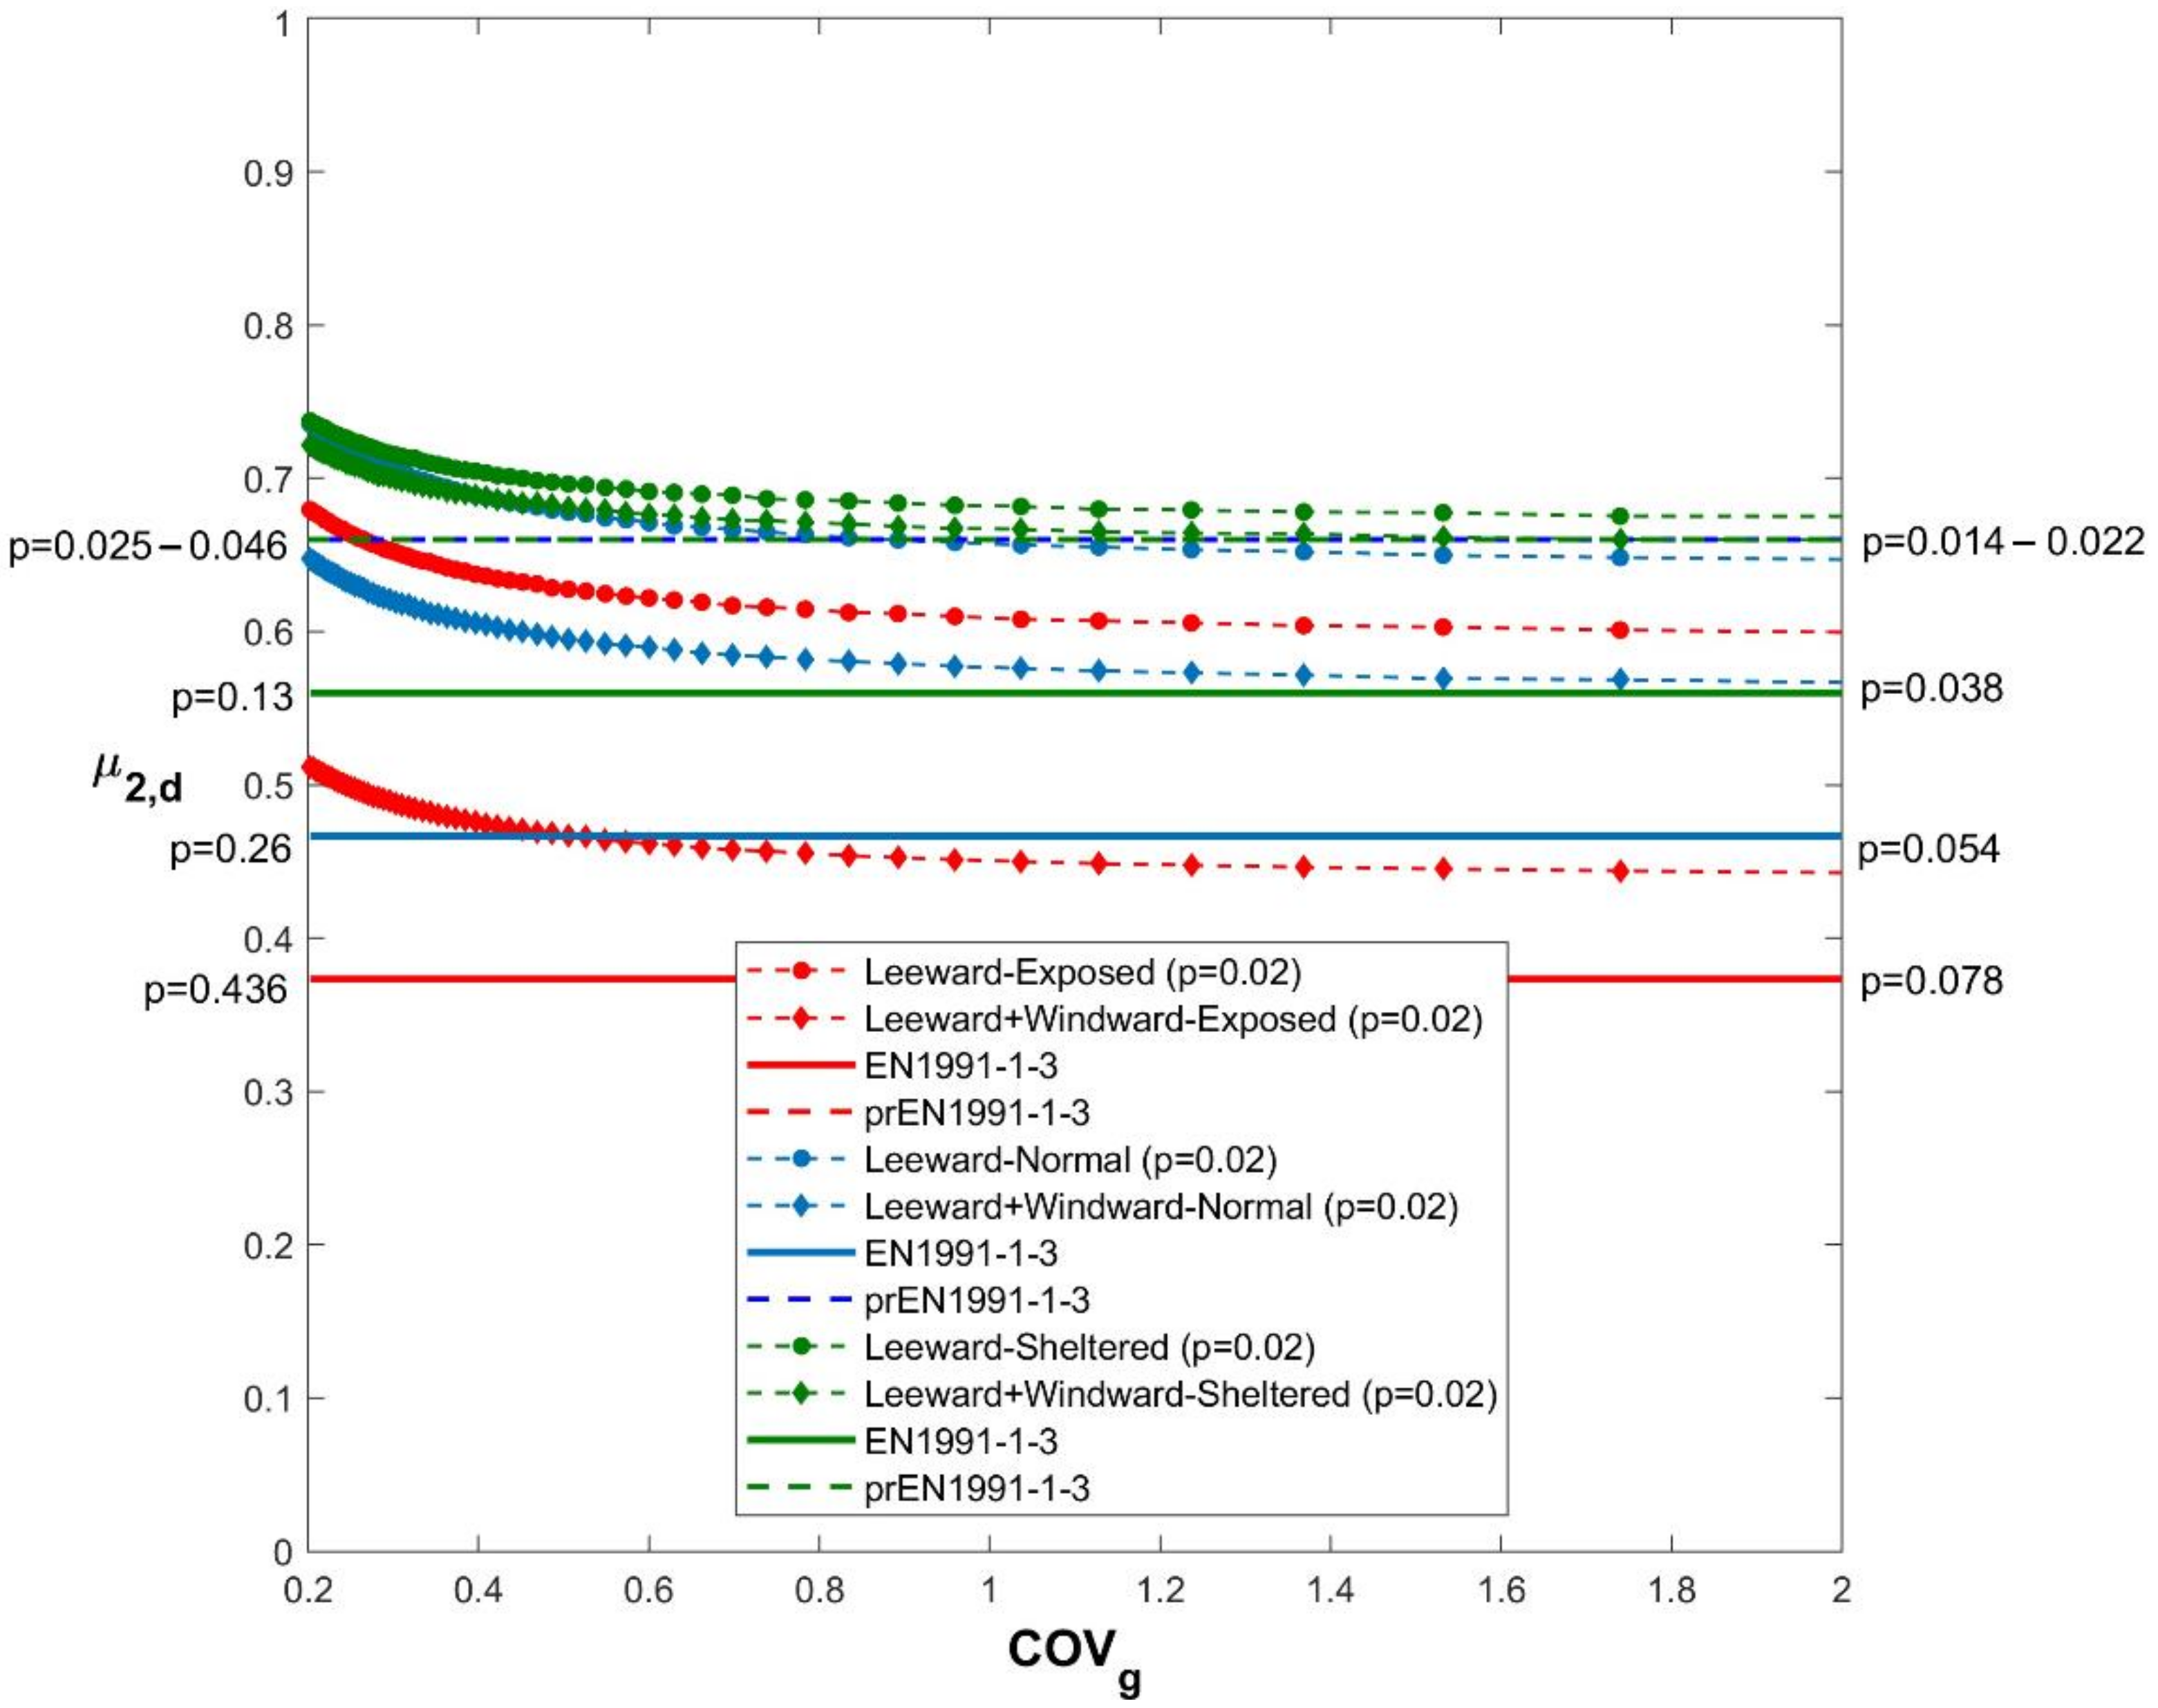
Similar to those given in Figure 4, the curves can be derived for pitched roofs for given intervals of the pitch angle. The curves thus obtained, again characterized by an annual probability of exceedance are compared with the values given in EN1991-1-3:2003 or in prEN1991-1-3:2020 in Figure 8, Figure 9 and Figure 10.
In these figures, solid horizontal lines represent constant shape coefficients () provided in EN1991-1-3:2003, while the dashed horizontal lines represent constant shape coefficients provided in prEN1991-1-3:2020 for gabled roofs.
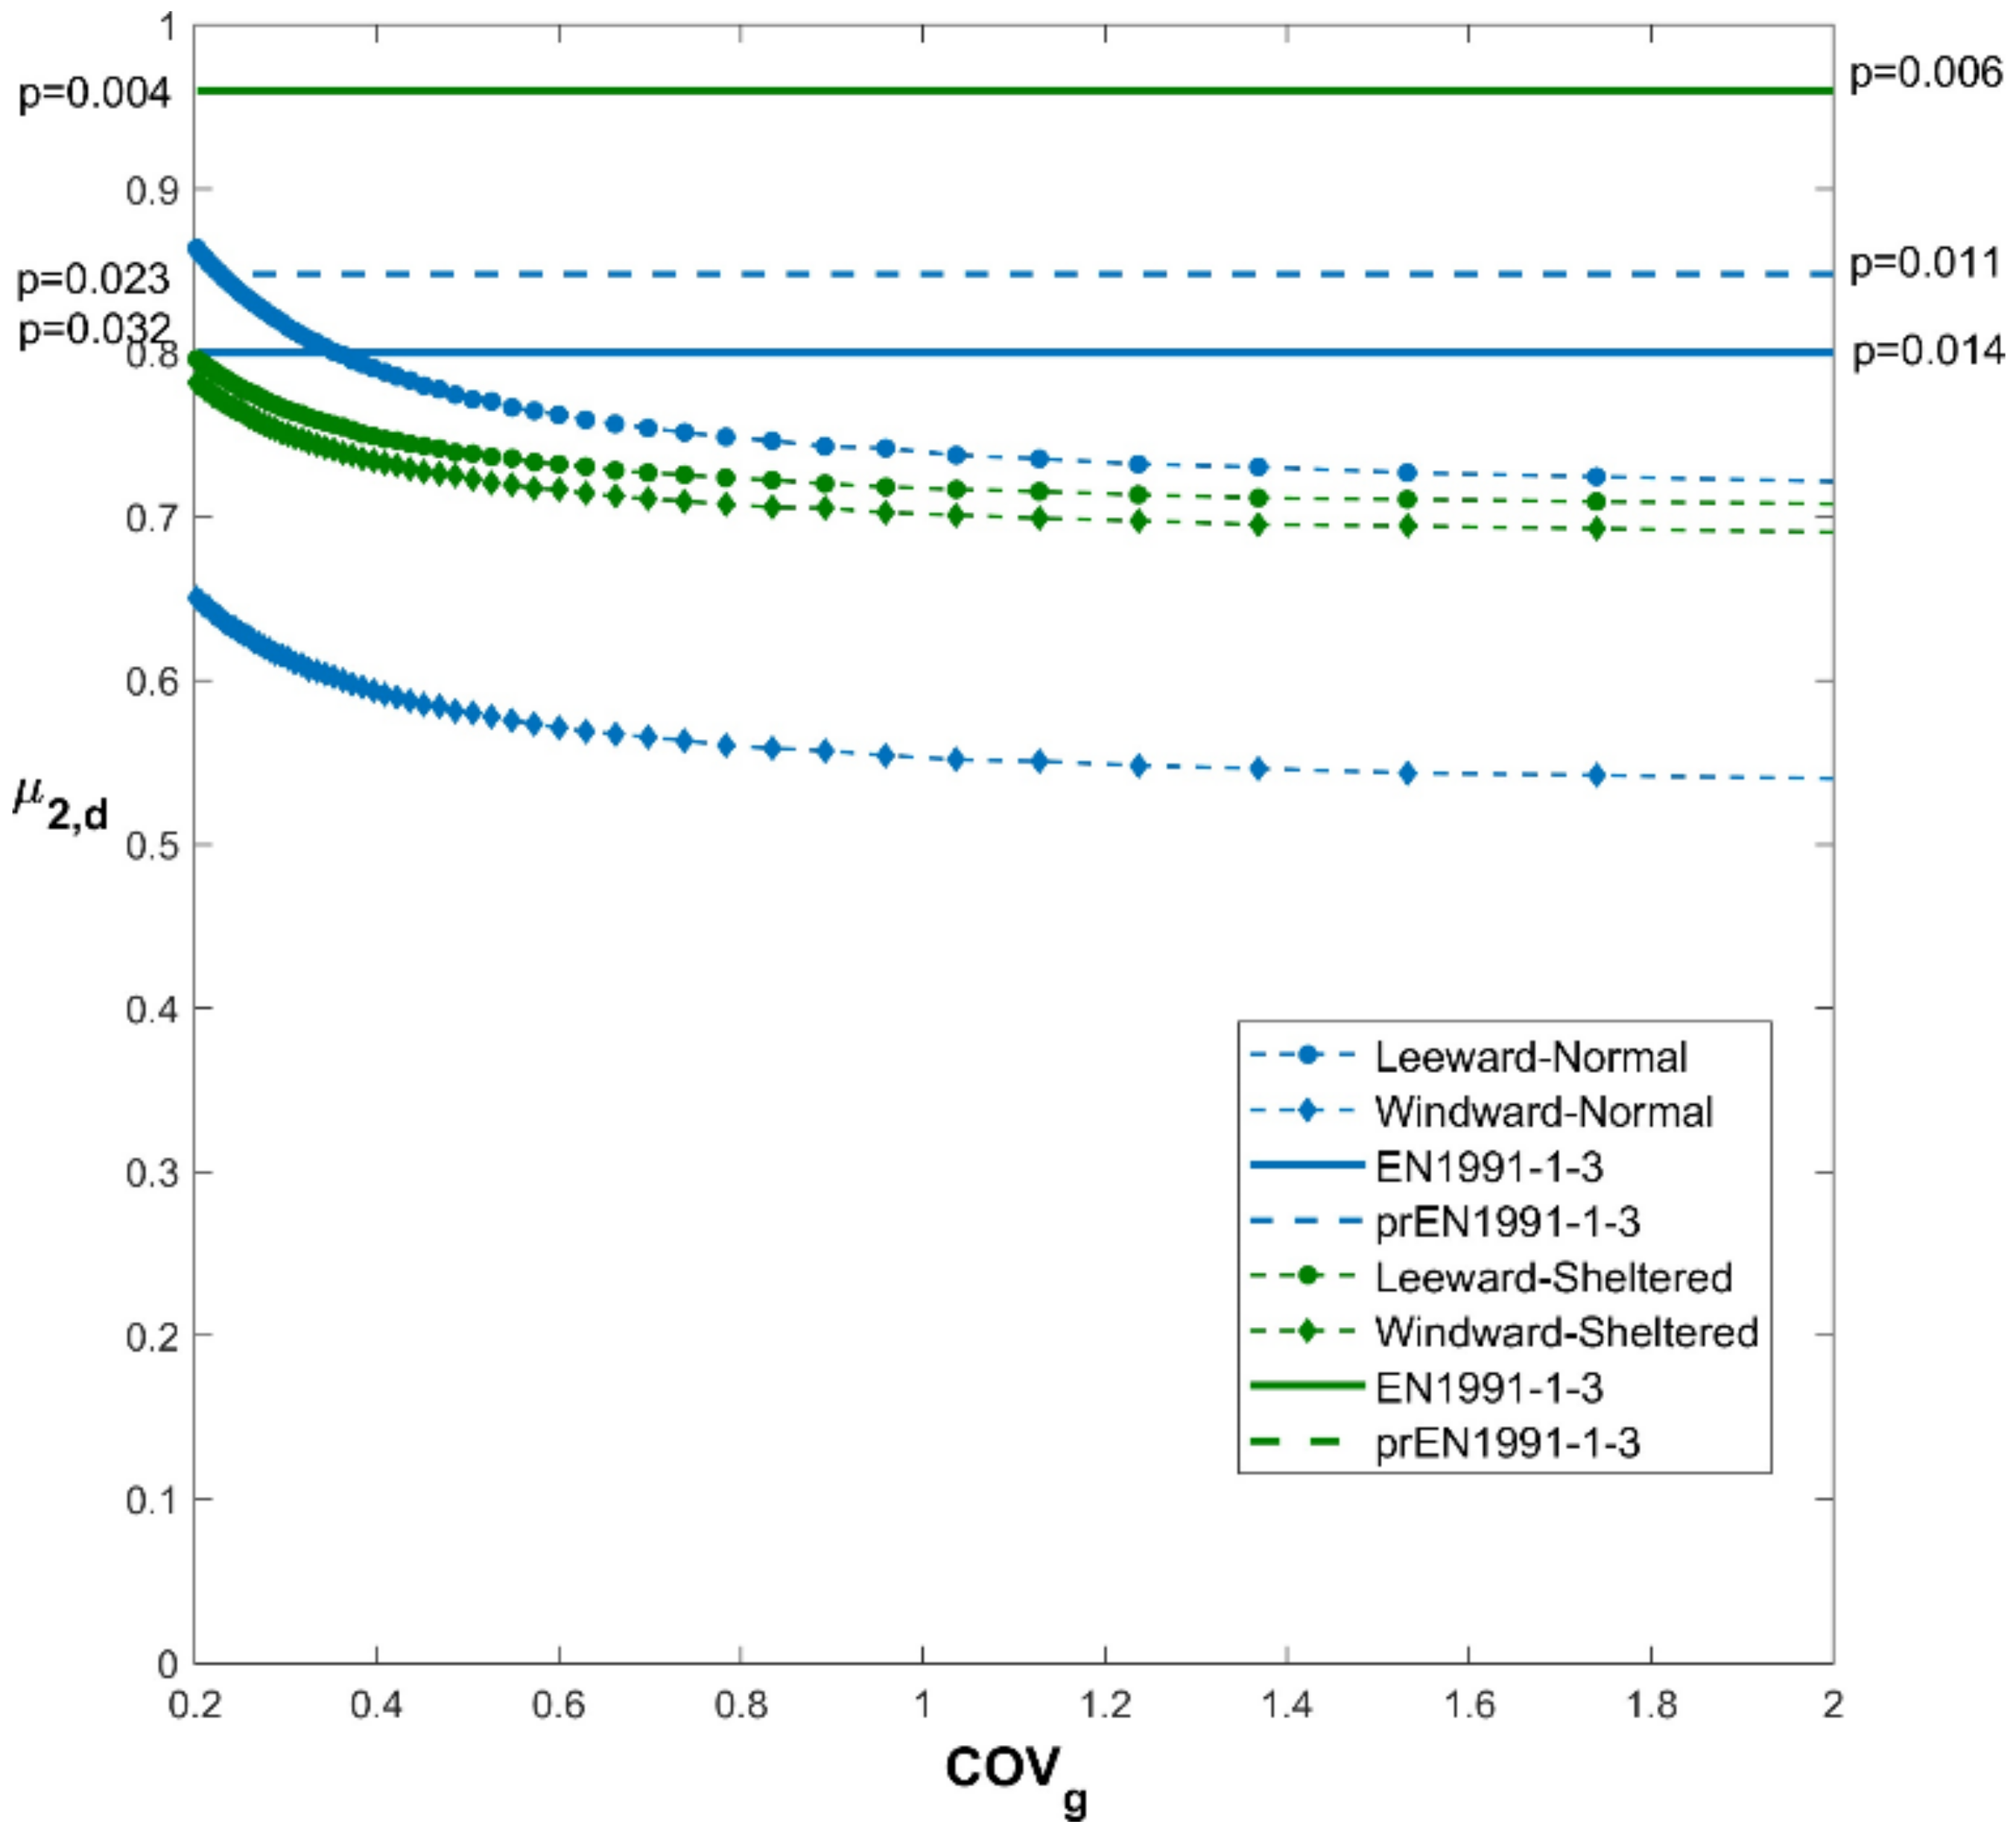
Due to the lack of information in exposed conditions for such roofs, in Figure 8, which refers to pitch angles , only two exposure conditions are considered: sheltered (green curves) and normal (blue curves).
In Figure 9 and Figure 10, which refer to pitch angles and , respectively, the exposed condition is also taken into account.
In these figures, curves characterized by lozenge markers represent iso-probability shape factors for the leeward side of the roof, while curves characterized by circle markers represent shape factor curves for the windward side in Figure 8, and balanced shape factors in Figure 9 and Figure 10.
Analogously to what was done before, in Figure 8, Figure 9 and Figure 10 the annual probability of exceedance granted by the provisions of EN1991-1-3 and prEN1991-1-3 is also indicated for when the snow load on the ground distribution is characterized by and .
The results confirm that the model in EN1991-1-3 is generally slightly unconservative for exposed conditions when the horizontal snow transport increases.
If the pitch angle is , the EN1991-1-3 model leads to some reduction in the roof snow load: in fact, in this case the probability of exceedance of the roof snow load is in the range of . If the pitch angle is , by applying the EN1991-1-3 model a greater reduction can be observed (). It must be underlined that, in the latter case, the greatest differences are concentrated in the region where is small. Moreover, in case of high pitch angles (see Figure 10), the EN1991-1-3 model is slightly unconservative for the normal and sheltered conditions.
5. Conclusions
The reference roof snow load for structural design is generally defined as the product of characteristic ground snow load, characterized by an annual probability of exceedance and a nominal or notional roof conversion factor known as the shape factor. Consequently, roof snow loads do not necessarily have the same probability of exceedance of ground snow loads, since the uncertainty in the conversion factors from the ground to roof loads is not directly considered. In this context, it is important to develop stochastic models for roof snow loads which consider the roof’s geometry and the wind exposure conditions based on the available results of experimental measurement campaigns. The development of such models is a necessary starting point for performing robust reliability analysis and it is also becoming crucial considering the current debate on the calibration of partial factors for climatic actions.
In this paper, a methodology to evaluate design shape coefficient was illustrated in order to obtain values of roof snow loads characterized by a given annual probability of exceedance. In that way, it was possible to derive suitable design shape factors which allow to transform snow load on the ground having a given probability of exceedance, , in the snow load on the roof having the same probability of exceedance .
Starting from experimental data, design values of shape coefficients for flat and pitched roofs were derived as a function of the coefficient of variation () of the annual maxima of ground snow load expected at the site, considering different wind exposure conditions of the structure, i.e., sheltered, semi-sheltered (normal condition), and windswept (exposed condition).
The results obtained for relevant weather stations were finally compared with the provisions given in the actual version of the Eurocode for snow loads EN1991-1-3:2003 [12] and in the new draft proposal prEN1991-1-3:2020 [17], while also discussing the actual probability of exceedance associated with these normative provisions.
The outcomes of the study confirmed that the shape factors provided in EN1991-1-3 are somewhat unconservative, while those of the improved model adopted in prEN1991-1-3 are more consistent with the available measurements, especially for pitched roofs. In fact, the new model led to design values of roof loads for the different exposure conditions and roof slopes that, while slightly conservative, were much more in line with the expected probability of exceedance specified in the EN1990 [7].
The proper evaluation of roof snow load together with the associated probability distribution allows for a refined structural reliability analysis for roof structures designed according to the Eurocode provisions for snow loads [27].
Author Contributions
Conceptualization, P.C., P.F., and F.L.; methodology, P.C., P.F., and F.L.; software, P.C., P.F., and F.L.; validation, P.C., P.F., and F.L.; writing—original draft preparation, P.C., P.F., and F.L.; writing—review and editing, P.C., P.F., and F.L.; resources, P.C. All authors have read and agreed to the published version of the manuscript.
Funding
This research received no external funding.
Institutional Review Board Statement
Not applicable.
Informed Consent Statement
Not applicable.
Data Availability Statement
The data presented in this study are available on request from the corresponding author. The data are not publicly available as they cannot be used for commercial purposes.
Conflicts of Interest
The authors declare no conflict of interest.
References
- Croce, P.; Formichi, P.; Landi, F.; Mercogliano, P.; Bucchigiani, E.; Dosio, A.; Dimova, S. The snow load in Europe and the climate change. Clim. Risk Manag. 2018, 20, 138–154. [Google Scholar] [CrossRef]
- Croce, P.; Formichi, P.; Landi, F.; Marsili, F. Climate change: Impact on snow loads on structures. Cold Reg. Sci. Technol. 2018, 150, 35–50. [Google Scholar] [CrossRef] [Green Version]
- Ice Rink Roof Collapses Due to Snow. Available online: https://www.ansa.it/english/news/general_news/2021/02/10/ice-rink-roof-collapses-due-to-snow_9996af04-f0a0-43bc-8741-91269e2c7c3d.html (accessed on 13 February 2021).
- Holicky, M. Safety design of lightweight roofs exposed to snow load. Eng. Sci. 2007, 58, 51–57. [Google Scholar] [CrossRef] [Green Version]
- Sykora, M.; Holicky, M. Reliability-based design of roofs exposed to a snow load. In Reliability Engineering—Proceedings of the International Workshop on Reliability Engineering and Risk Management IWRERM 2008; Li, J., Zhao, Y.-G., Chen, J., Eds.; Tongji University Press: Shanghai, China, 2008; pp. 183–188. [Google Scholar]
- Kozak, D.L.; Liel, A.B. Reliability of steel roof structures under snow loads. Struct. Saf. 2015, 54, 46–56. [Google Scholar] [CrossRef]
- EN 1990. Eurocode—Basis of Structural Design; CEN: Brussels, Belgium, 2002. [Google Scholar]
- Ellingwood, B.; O’Rourke, M. Probabilistic models of snow loads on structures. Struct. Saf. 1985, 2, 291–299. [Google Scholar] [CrossRef]
- O’Rourke, M.J.; Stiefel, U. Roof Snow Loads for Structural Design. J. Struct. Eng. 1983, 109, 1527–1537. [Google Scholar] [CrossRef]
- Sanpaolesi, L.; Del Corso, R.; Formichi, P.; Currie, D.; Sims, P.; Sacré, C.; Stiefel, U.; Lozza, S.; Eiselt, B.; Peckham, R.; et al. Phase 1 Final Report to the European Commission, Scientific Support Activity in the Field of Structural Stability of Civil Engineering Works: Snow Loads, Department of Structural Engineering, University of Pisa. 1998. Available online: http://www2.ing.unipi.it/dic/snowloads/Final%20Report%20I.pdf (accessed on 18 January 2021).
- Croce, P.; Formichi, P.; Landi, F.; Marsili, F. Harmonized European ground snow load map: Analysis and comparison of national provisions. Cold Reg. Sci. Technol. 2019, 168, 102875. [Google Scholar] [CrossRef]
- EN 1991-1-3. Eurocode 1: Actions on Structures—Part 1–3: General Actions—Snow Loads; CEN: Brussels, Belgium, 2003. [Google Scholar]
- European Commission. M/515 EN—Mandate for Amending Existing Eurocodes and Extending the Scope of Structural Eurocodes; European Commission: Brussels, Belgium, 2012. [Google Scholar]
- CEN/TC250. Response to Mandate M/515—Towards a Second-Generation of Eurocodes; CEN-TC250—N 993: Brussels, Belgium, 2013. [Google Scholar]
- Sanpaolesi, L.; Del Corso, R.; Formichi, P.; Brettle, M.; Currie, D.; Dillon, P.; Sims, P.; Delpech, P.; Dufresne, M.; Sacré, C.; et al. Phase 2 Final Report to the European Commission, Scientific Support Activity in the Field of Structural Stability of Civil Engineering Works: Snow Loads, Department of Structural Engineering, University of Pisa. 1999. Available online: http://www2.ing.unipi.it/dic/snowloads/Final%20Report%20II.pdf (accessed on 18 January 2021).
- Thiis, T.K.; O’Rourke, M. Model for Snow Loading on Gable Roofs. J. Struct. Eng. 2015, 141, 1–9. [Google Scholar] [CrossRef]
- prEN 1991-1-3. Eurocode 1: Actions on Structures—Part 1–3: General Actions—Snow Loads; CEN: Brussels, Belgium, 2020. [Google Scholar]
- Moemken, J.; Reyer, M.; Feldmann, H.; Pinto, J.G. Future Changes of Wind Speed and Wind Energy Potentials in EURO-CORDEX Ensemble Simulations. J. Geophys. Res. Atmos. 2018, 123, 1–17. [Google Scholar] [CrossRef]
- Croce, P.; Formichi, P.; Landi, F. Climate Change: Impacts on Climatic Actions and Structural Reliability. Appl. Sci. 2019, 9, 5416. [Google Scholar] [CrossRef] [Green Version]
- EN 1991-1-4. Eurocode 1: Actions on Structures—Part 1–4: General Actions—Wind Actions; CEN: Brussels, Belgium, 2005. [Google Scholar]
- Meløysund, V.; Lisø, K.R.; Hygen, H.O.; Høiseth, K.V.; Leira, B. Effects of wind exposure on roof snow loads. Build. Environ. 2007, 42, 3726–3736. [Google Scholar] [CrossRef]
- CZ Map of the Snow Load on the Ground. Available online: https://clima-maps.info/snehovamapa/ (accessed on 13 February 2021).
- O’Rourke, M.J.; Redfield, R.; von Bradsky, P. Uniform snow load on structures. J. Struct. Div. 1982, 108, 2781–2798. [Google Scholar] [CrossRef]
- Høibø, H. Snow load on gable roofs—Results from snow load 609 measurements on farm buildings in Norway. In Proceedings of the First International Conference on Snow Engineering, Santa Barbara, CA, USA, 10–15 July 1988; pp. 95–104. [Google Scholar]
- Høibø, H. Form factors for snow load on gable roofs: Extending use of snow load data from inland districts to wind exposed areas. In Proceedings of the 11th International Congress on Agricultural Engineering, Dublin, Ireland, 4–8 September 1989; Balkema: Rotterdam, The Netherlands, 1989. [Google Scholar]
- Cook, N.J.; Mayne, J.R. A refined working approach to the assessment of wind loads for equivalent static design. J. Wind Eng. Ind. Aerodyn. 1980, 6, 125–137. [Google Scholar] [CrossRef]
- Croce, P.; Formichi, P.; Landi, F. Reliability of roof structures subjected to snow loads. In Proceedings of the 30th European Safety and Reliability Conference and the 15th Probabilistic Safety Assessment and Management Conference, Venice, Italy, 1–5 November 2020; Baraldi, P., Di Maio, F., Zio, E., Eds.; Research Publishing: Singapore, 2020; pp. 4765–4770. [Google Scholar] [CrossRef]
Figure 1.
Stochastic distributions of snow action parameters assuming normal exposure condition (exposure coefficient ) and unheated building (thermal coefficient ).
Figure 1.
Stochastic distributions of snow action parameters assuming normal exposure condition (exposure coefficient ) and unheated building (thermal coefficient ).

Figure 2.
European ground snow load map resulting from European Committee for Standardization (CEN) National Annexes to EN1991-1-3:2003.
Figure 2.
European ground snow load map resulting from European Committee for Standardization (CEN) National Annexes to EN1991-1-3:2003.

Figure 3.
Joint probability density function (pdf) of ground snow load () and shape coefficient () for flat roofs (Lodi weather station) under different exposure conditions (black curves represent a constant roof load (), while the red curve corresponds to ).
Figure 3.
Joint probability density function (pdf) of ground snow load () and shape coefficient () for flat roofs (Lodi weather station) under different exposure conditions (black curves represent a constant roof load (), while the red curve corresponds to ).

Figure 4.
Design shape coefficient for flat roofs () as a function of the coefficient of variation () of ground snow load, parameterized in terms of exposure conditions (sheltered: green lines, normal: blue lines, exposed: red lines) for 25 Italian weather stations.
Figure 4.
Design shape coefficient for flat roofs () as a function of the coefficient of variation () of ground snow load, parameterized in terms of exposure conditions (sheltered: green lines, normal: blue lines, exposed: red lines) for 25 Italian weather stations.

Figure 5.
Design shape coefficient for flat roofs () as a function of the coefficient of variation of ground snow load (), parameterized in terms of exposure conditions (sheltered: green lines, normal: blue lines). (a) Norwegian database; (b) Norwegian database assuming .
Figure 5.
Design shape coefficient for flat roofs () as a function of the coefficient of variation of ground snow load (), parameterized in terms of exposure conditions (sheltered: green lines, normal: blue lines). (a) Norwegian database; (b) Norwegian database assuming .

Figure 6.
Design shape coefficient for flat roofs () as a function of the coefficient of variation () of ground snow load, parameterized in terms of exposure conditions (sheltered: green lines, normal: blue lines, exposed: red lines) and distribution of the snow load on ground (log-normal: circular markers, Gumbel: lozenge markers) for 25 Italian weather stations.

Figure 7.
Design shape coefficient for pitched roofs () in different exposure conditions, depending on the coefficient of variation of ground snow load () and the pitch angle of the roof (). A comparison with the EN1991-1-3:2003 and prEN1991-1-3:2019 models is made.
Figure 7.
Design shape coefficient for pitched roofs () in different exposure conditions, depending on the coefficient of variation of ground snow load () and the pitch angle of the roof (). A comparison with the EN1991-1-3:2003 and prEN1991-1-3:2019 models is made.

Figure 8.
Design shape coefficient for pitched roofs () with as a function of the coefficient of variation () of ground snow load, parameterized in terms of exposure conditions (sheltered: green lines, normal: blue lines).
Figure 8.
Design shape coefficient for pitched roofs () with as a function of the coefficient of variation () of ground snow load, parameterized in terms of exposure conditions (sheltered: green lines, normal: blue lines).

Figure 9.
Design shape coefficient for pitched roofs () with as a function of the coefficient of variation () of the ground snow load, parameterized in terms of exposure conditions (sheltered: green lines, normal: blue lines, exposed: red lines).
Figure 9.
Design shape coefficient for pitched roofs () with as a function of the coefficient of variation () of the ground snow load, parameterized in terms of exposure conditions (sheltered: green lines, normal: blue lines, exposed: red lines).

Figure 10.
Design shape coefficient for pitched roofs () with as a function of the coefficient of variation () of the ground snow load, parameterized in terms of exposure conditions (sheltered: green lines, normal: blue lines, exposed: red lines).
Figure 10.
Design shape coefficient for pitched roofs () with as a function of the coefficient of variation () of the ground snow load, parameterized in terms of exposure conditions (sheltered: green lines, normal: blue lines, exposed: red lines).


Table 1.
Coefficient of variations of the annual maxima of ground snow load (COVg) in Europe [15].
Table 1.
Coefficient of variations of the annual maxima of ground snow load (COVg) in Europe [15].
| Climatic Region | Altitude
(m a.s.l.) | Range | Dependence |
|---|---|---|---|
| Alpine region (except for the German part) | if if | ||
| Alpine region (German part) | not significant | ||
| United Kingdom and Eire | if | ||
| Iberian Peninsula | mostly | ||
| Mediterranean region | mostly | ||
| Central East | if if but mostly | ||
| Central West | not significant | ||
| Greece | not significant | ||
| Norway | not significant | ||
| Finland–Sweden | not significant | ||
| Iceland | not significant |
Publisher’s Note: MDPI stays neutral with regard to jurisdictional claims in published maps and institutional affiliations. |
© 2021 by the authors. Licensee MDPI, Basel, Switzerland. This article is an open access article distributed under the terms and conditions of the Creative Commons Attribution (CC BY) license (http://creativecommons.org/licenses/by/4.0/).
Share and Cite
MDPI and ACS Style
Croce, P.; Formichi, P.; Landi, F. Probabilistic Assessment of Roof Snow Load and the Calibration of Shape Coefficients in the Eurocodes. Appl. Sci. 2021, 11, 2984. https://0-doi-org.brum.beds.ac.uk/10.3390/app11072984
AMA Style
Croce P, Formichi P, Landi F. Probabilistic Assessment of Roof Snow Load and the Calibration of Shape Coefficients in the Eurocodes. Applied Sciences. 2021; 11(7):2984. https://0-doi-org.brum.beds.ac.uk/10.3390/app11072984
Chicago/Turabian StyleCroce, Pietro, Paolo Formichi, and Filippo Landi. 2021. "Probabilistic Assessment of Roof Snow Load and the Calibration of Shape Coefficients in the Eurocodes" Applied Sciences 11, no. 7: 2984. https://0-doi-org.brum.beds.ac.uk/10.3390/app11072984
Note that from the first issue of 2016, this journal uses article numbers instead of page numbers. See further details here.