
Graphene Deposition on Glass Fibers by Triboelectrification


1
Department of Industrial Engineering, University of Trento, 38123 Trento, Italy
2
National Interuniversity Consortium of Materials Science, 38123 Trento, Italy
*
Authors to whom correspondence should be addressed.
Appl. Sci. 2021, 11(7), 3123; https://0-doi-org.brum.beds.ac.uk/10.3390/app11073123
Submission received: 23 February 2021
/
Revised: 24 March 2021
/
Accepted: 26 March 2021
/
Published: 1 April 2021
(This article belongs to the Special Issue Surface Modification of Glass Fibers)
Abstract
:In this work, a novel nanomaterial deposition technique involving the triboelectrification (TE) of glass fibers (GF) to create attractive charges on their surface was investigated. Through TE, continuous GF were positively charged thus, attracting negatively charged graphene oxide (GO) nanoparticles dispersed in a solution. The electrical charges on the glass fibers surface increased with the intensity of the TE process. The deposited GO coating was then chemically treated to obtain reduced graphene oxide (rGO) on the surface of GFs. The amount of coating obtained increased with the GO solution concentration used during the deposition process, as revealed by FESEM analysis. However, the same increment could not be noticed as a function of the intensity of the process. Both uncoated and coated GF were used to obtain single fiber microcomposites by using a bicomponent epoxy matrix. The fiber/matrix interfacial shear strength was evaluated through micro debonding tests, which revealed an increment of fiber/matrix adhesion up to 45% for rGO coated GF in comparison to the uncoated ones. A slight improvement in the electrical conductivity of rGO coated fibers through TE compared to conventional dip coating was also observed in terms of volumetric resistivity by a four-point probe setup.
1. Introduction
Fiber-reinforced polymer composites, providing high strength-to-weight as well as stiffness-to-weight ratios, have substituted metal counterparts in an array of high-performance structural applications in aerospace, automotive, and sports fields [1]. Their increasing importance in structural components naturally requires improved mechanical performances.
Generally, a typical composite structure consists of a continuous phase (i.e., the matrix) whose purpose is to transfer the applied load to the fibers and/or filler (reinforcing phase). The efficiency of the load transfer from the polymer matrix to the reinforcing fibers markedly dictates their final mechanical properties. Therefore, the possibilities to tailor the interfacial properties between the fiber and the matrix are thoroughly investigated [2]. Between the matrix and the reinforcing phases, an intermediate region named interphase is found. It is well established that the load transfer capability of the interphase in composites depends on the fiber/matrix adhesion, which may be based on either physical (frictional) or chemical interactions between the composite constituents (intermolecular interactions, phase separation phenomena, chemical reactions, surface-induced crystallizations, etc.). Chemical interactions are generally considered to be of primary importance in polymer composites but, in some cases, frictional forces have also been considered to play an important role in the enhancement of interfacial adhesion [2]. The common methods reported in the past for interface engineering to improve the interfacial adhesion can be generally classified in (i) interphase tailoring via sizing/coating on the fibers, (ii) creation of hierarchical fibers by nanostructures, (iii) fiber surface modifications by polymer deposition and (iv) matrix modifications with effects on the interphase formation.
Interphase tailoring by sizing or coating by nanofillers (like carbon nanotubes and graphene) on reinforcing fibers (glass or carbon) has been approached through various techniques, like spraying [3,4,5,6,7], solution coating [8,9], dip coating [10,11,12,13,14,15,16], electrophoretic deposition (EPD) [17,18,19,20,21], and immersion [22,23]. These methods allow the nanofillers to “anchor” on the fiber surface due to the chemical reactions between the functionalized nanofillers and the fiber’s surface groups. In addition, it increases the local modulus of the interphase, along with its shear strength [2]. Moreover, such modifications may introduce multifunctional properties in the laminates, depending on the nanofiller type [24,25,26]. Most of the nanofiller deposition methods reported above require a tedious and energy-consuming setup. For example, in the case of spraying, special air brushes and high air pressures are required to deposit nanofillers with high dispersibility. It is reported that during this process, agglomeration of nanofiller in the air brush results in a non-uniform deposition of nanofiller on the substrate [3]. Moreover, EPD is based on a setup involving DC current source and particular electrodes to carry out the deposition [27]. The effectiveness of dip coating or immersion, on the other hand, depends either on the quality of the dispersion used to deposit the nanofiller and on the substrate’s surface energy, since no energy is used to “force” the nanofiller towards the substrate.
In very recent years, graphene has become a potential candidate for fiber coating since a limited filler content is required to provide excellent improvement of interlaminar properties [28]. This permits almost no degradation of the laminate’s in-plane properties. Since its advent in 2004 [29], graphene has received unprecedented attention from the scientific community. Graphene, a single-layer carbon sheet with a hexagonal structure, possesses a remarkable array of properties, such as a high Young’s modulus (~1 TPa) [30], large theoretical specific surface area (2630 m2 g−1) [31], high carrier mobility at room temperature (~10,000 cm2/V·s) [29], good optical transparency (~97.7%) [32] and excellent thermal conductivity (3000–5000 Wm−1K−1) [33]. Motivated by its unique and extraordinary properties, scientists around the world are constantly trying to exploit the full advantages of graphene in combination with various polymer matrices. However, the full technical exploitation of graphene in engineering applications is still a challenge.
Interestingly, triboelectrification (TE), involving the generation of charges on the fiber surface, has never been investigated as a technique for fiber coating with nanofillers. TE is also known as contact electrification (CE), which technically means the creation of charges due to physical contact between (at least) two surfaces. Briefly, TE is a tribological process involving two dissimilar materials that, when come in contact or are rubbed with each other, creates an electrical charge on their surfaces. Under given contact conditions, the magnitude and type of charges depend on the specific triboelectrification behavior of the materials in contact. This is summarized in the form of the so-called triboelectric series, which rank different materials according to their “tendency” to gain or lose electrons during the process [34]. Separation or delivery of charges between the surfaces could be influenced by mechanical friction [35]. TE is often considered a negative phenomenon since it can result in dangerous electrical discharges, friction, energy losses, blending in pharmaceutical processes, etc. In the modern age, however, some applications of TE have been developed, e.g., xerography [36], laser printing [37], electrostatic separations [38], electrostatic [39] or triboelectric nanogenerators [40,41].
According to the conventional triboelectric series [34], glass is found on the top of the list, while polytetrafluoroethylene (PTFE) is at the bottom of the series. Rubbing or even touching these two materials results in a high charge transfer on both of them. On the basis of this natural phenomenon, in this manuscript, an innovative method is proposed to deposit graphene oxide (GO) nanosheets dispersed in a water solution onto glass fibers (GF) surface by contact electrification with PTFE. In particular, a glass fiber roving was passed at different velocities over one or two PTFE surfaces, and the amount of charge developed by CE on GF was analyzed. In another step, such triboelectrified fibers were passed through GO solutions at different concentrations. Next, GO coatings were chemically reduced to create rGO coated GF. Such coating, having an electrically conductive nature, could provide the possibility to achieve multi-functionality in composite materials. The morphological and electrical properties of the coated GF were analyzed to evaluate the quality of the coating. In particular, the influence of graphene-coated GF on the interfacial properties of epoxy/glass composites was investigated by the micro debonding test.
2. Experimental Part
2.1. Materials
PPG 2001 E-glass fibers (bundle of 2400 tex), provided by PPG Industries Fiber Glass, were used as a substrate for the TE based coating process. The fibers, having a density of about 2.5 g/cm3 (measured with a helium pycnometer) and an average diameter of 24.5 ± 1.9 μm, had a multi-compatible sizing agent and were used as received. Mechanical tests on single fibers (not reported for brevity) revealed a Young’s modulus of 75.3 GPa, a Weibull scale parameter of 2188 MPa (at 30 mm length) and a Weibull shape parameter of 2.5.
A graphene oxide (GO) solution provided by Graphenea (San Sebastián, Spain), with a concentration of 4 mg/mL of GO in water, was used as a source of GO nanosheets. By diluting this solution using deionized water, GO solutions at three different concentrations (0.005, 0.05, and 0.1 wt%) were produced. These solutions were ultrasonicated for 30 min at room temperature using a Labsonic LBS1 ultrasonic water bath (FALC Instruments S.r.l., Bergamo, Italy). In this way, a homogeneous dispersion of GO in water was achieved. A bicomponent epoxy was used as a polymer matrix for micro debonding tests. The epoxy system consisted of an epoxy base (EC157.1) and an aminic hardener (W342), both provided by Elantas Italia S.r.l. (Collecchio, Italy). These two components were mixed at a ratio of 100:30 and cured for 24 h at room temperature followed by 15 h at 60 °C, as indicated by the producer’s data sheet. Differential scanning calorimetry (DSC) and thermogravimetric analysis (TGA) on the cured epoxy system (not reported for brevity) evidenced a glass transition temperature (Tg) equal to 83.8 °C and a thermal degradation temperature (evaluated as the maximum mass loss rate) of 352 °C.
2.2. Samples Preparation
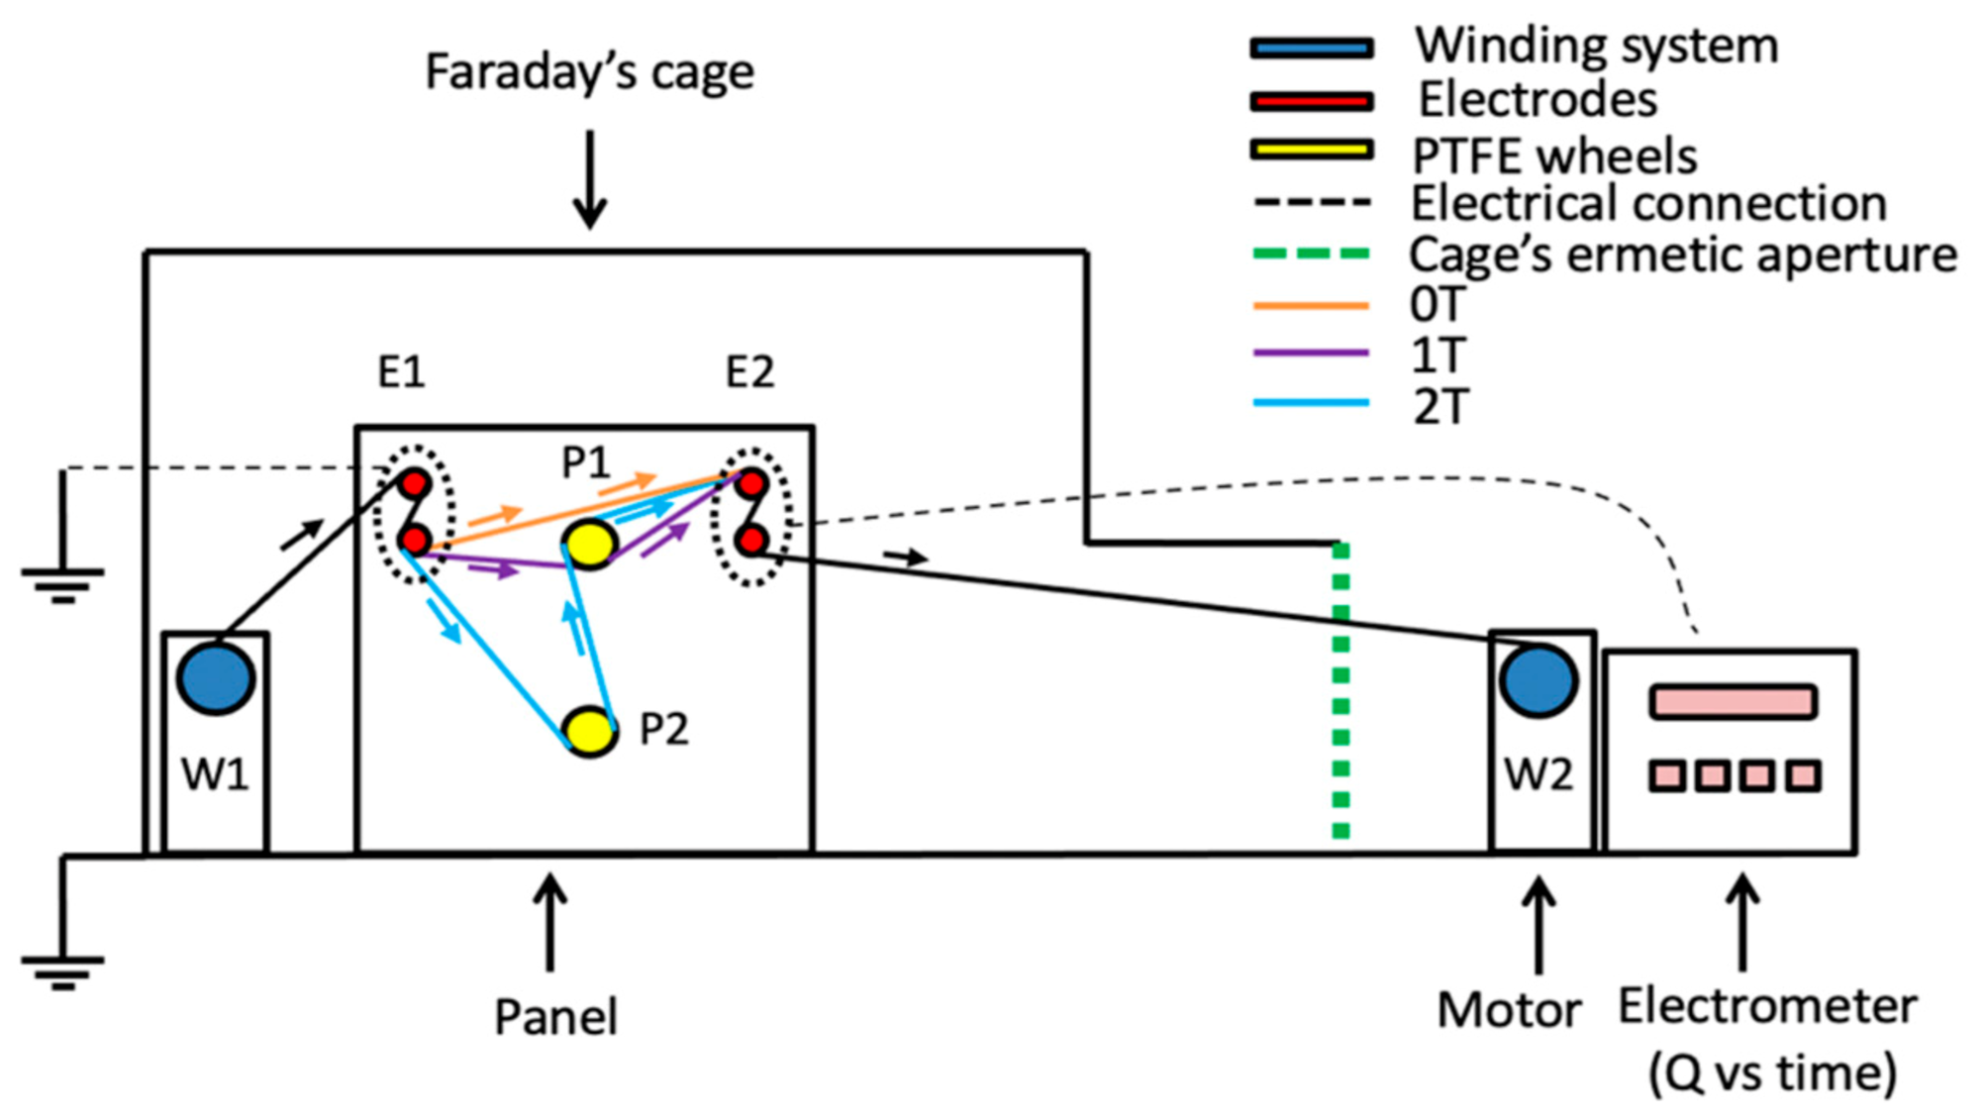
A schematic description of the lab-made setup for the TE of glass fibers is represented in Figure 1. The system is composed of two fibers winding systems, the first containing the wounded fibers (W1), while the second drew the fibers with the help of an electrical motor (W2). The device is composed of a vertical insulating wood panel containing two grounded steel electrodes (E1), two PTFE wheels (P1 and P2) mounted in the center, and two other steel electrodes (E2) connected to a Keithley 6517A electrometer/high resistance meter (Tektronix Inc., Beaverton, OR, USA). The electrometer was controlled with a MATLAB program for real-time acquisition of the surface charge on GFs as a function of the fibers scrolling time. All the system (except the electrometer) was placed inside a grounded Faraday’s cage. Initially, the TE process of GF involved the scrolling of fibers from W1 to E1. The placement of the two electrodes in E1 allowed both sides of the fibers to touch the electrodes to discharge the as-received fibers from any pre-existing electrification. Then, for the analysis of the TE process, the discharged fibers followed three different paths. For the analysis of discharged fibers only (0T), the fibers passed over E2 electrodes for charge measurement, while for the TE of fibers by one PTFE (1T), GF passed over P1 only and then passed over E2 electrodes for charge measurement. For the CE by two PTFE (2T), GF passed over P2 and P1 before passing over E2 electrodes for charge measurement.
The 0T path was useful to evaluate pre-existing electrification phenomena on the fibers. The 1T path was used to evaluate the contact electrification effect on fibers using one PTFE contact, while the 2T path was useful to understand if there is an effect on the electrification level by an increased number of contact points between fibers and PTFE. The temperature and humidity values inside the cage were registered during the tests since they can influence the charge measurement. In literature, it is reported that, for having a reliable charge measurement, the recommended temperature should be around 23 °C with an optimal humidity between 20% to 25% [42]. The whole TE process was performed at three different scrolling velocities (0.61 cm/s, 1.19 cm/s, and 4.05 cm/s) to evaluate their effect on the surface charge development.
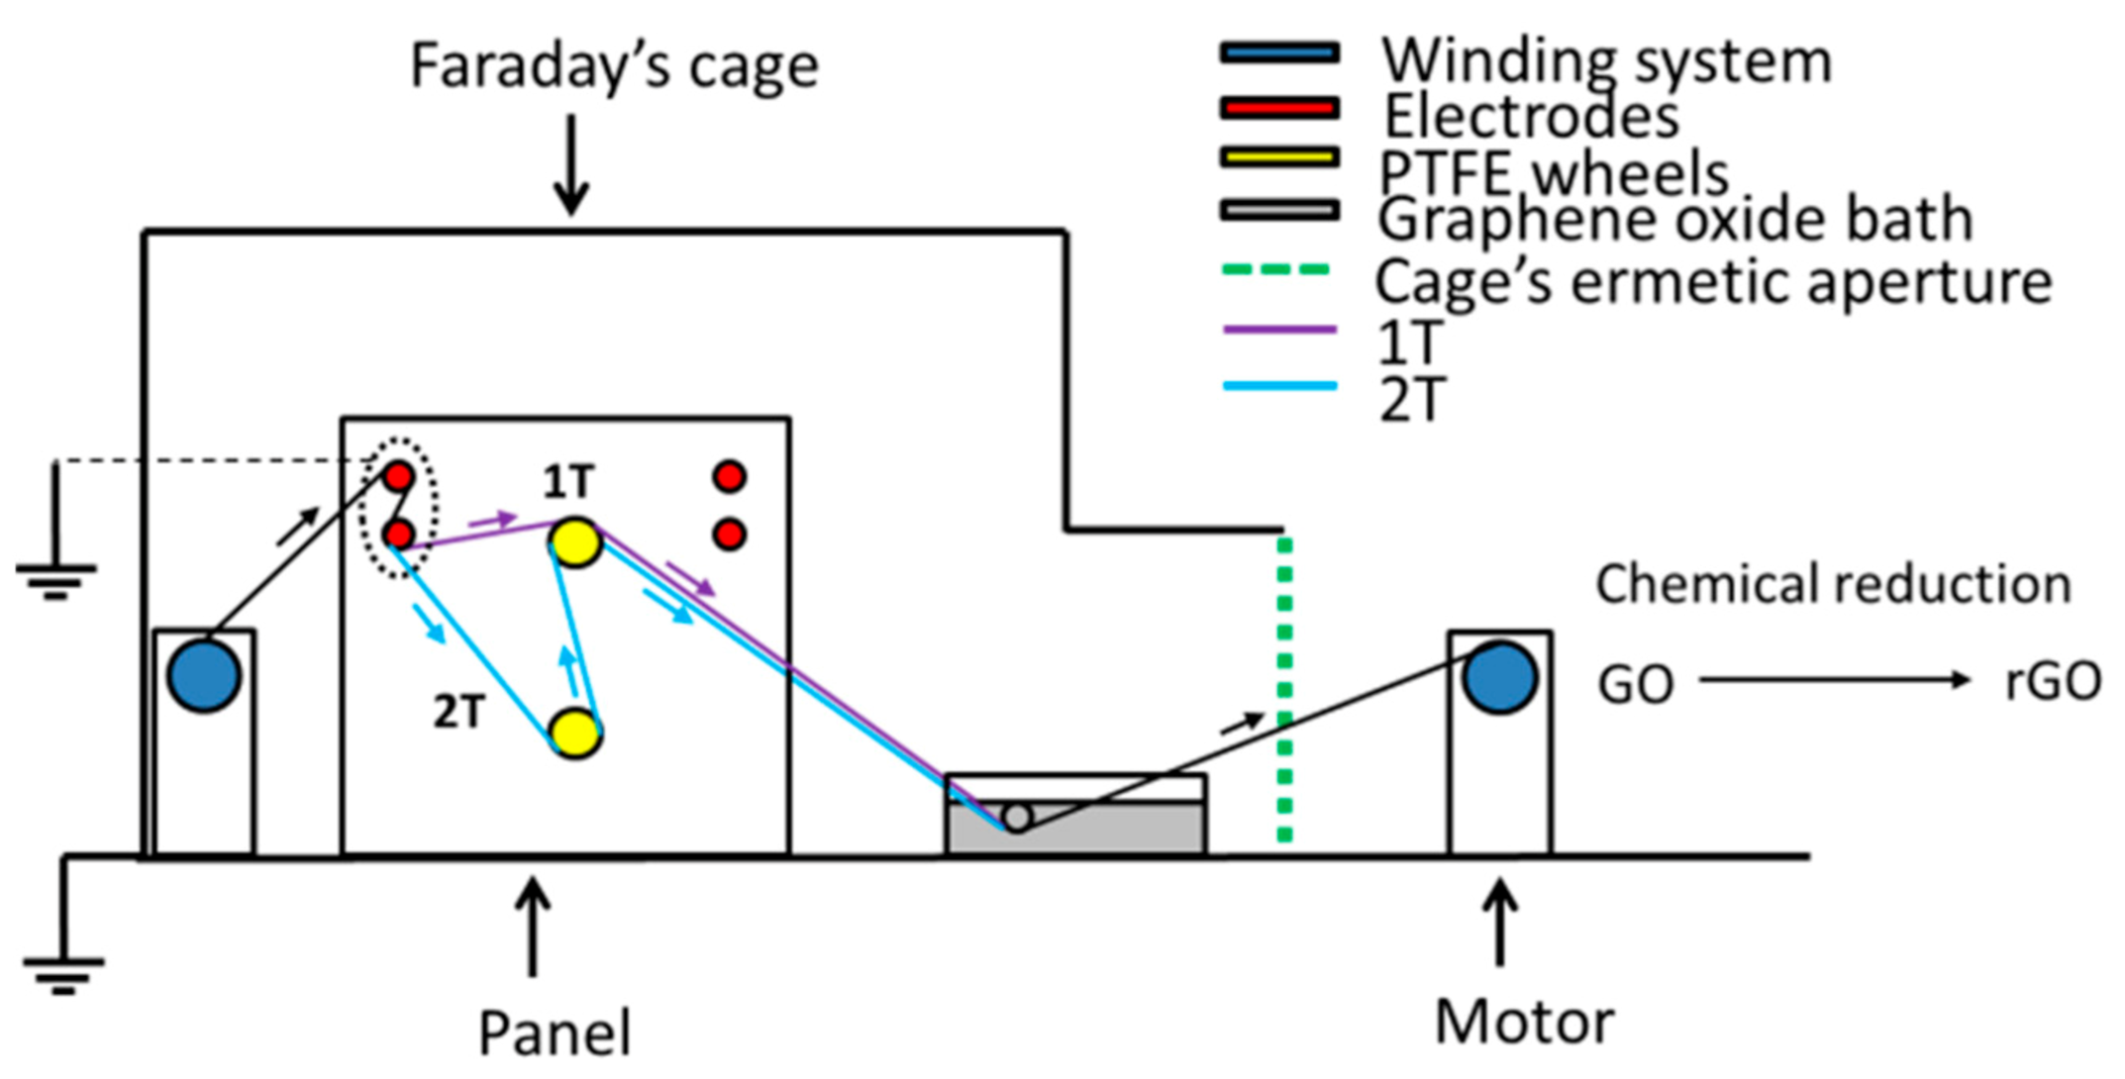
For the TE based deposition of GO, the same setup was used, with the difference being that the fibers did not pass over the second set of electrodes, E2, but they passed through a graphene oxide bath after following paths 1T or 2T, as reported in Figure 2. Electrified coated fibers were then compared with non-electrified fibers (NEF), whose GO coating was obtained by manually dipping the discharged fibers in a GO bath. After the deposition, all the coated fibers were dried in an oven for at least 12 h at 50 °C under vacuum. The chemical reduction of GO-coated glass fibers was performed by exposing them at 100 °C in a hydrazine hydrate-rich environment for 24 h [28].
The list of the produced GO and rGO coated glass fibers, together with their designation, is reported in Table 1. The first number represents the initial graphene oxide concentration, then the coating type (GO or rGO) and the electrification process is reported.
2.3. Experimental Techniques
The morphological analyses of received GFs and rGO coated glass fibers were performed by field emission scanning electron microscopy (FESEM) using a Zeiss Supra 40 microscope (Berlin, Germany). Prior to this analysis, the samples were coated by a Pt/Pd alloy coating (80:20) to make them conductive.
Epoxy microdroplets (having an average length of 477.1 ± 62.5 μm) were deposited onto single fiber filaments of as received GFs and rGO coated fibers glued on a paper frame. The size of microdroplets was measured by a Nikon SMZ25 optical microscope equipped with a Nikon DS-Fi2 digital camera. The deposited epoxy microdroplets were left at room temperature for 24 h, then cured at 60 °C for 15 h. Micro debonding tests were conducted at a crosshead speed of 1 mm/min by an Instron® 4502 universal testing machine (Norwood, MA, USA), equipped with a 2.5 N load cell. During these tests, the paper tab attached to one end of the glass fiber was slowly pulled up, while the droplet was constrained by a shearing plate fixed on a stationary support. The interfacial shear strength (IFSS) was calculated according to Equation (1):
where Fmax is the maximum load detected from the load-displacement curve, d is the fiber diameter, and L is the length of the microdroplet.
The volumetric resistivity of rGO coated glass fibers was evaluated by using a four-point probe setup according to Equation (2):
where V is the measured voltage, w and t are the width and thickness of the samples, I is the measured current, and L is a fixed distance.
3. Results and Discussion
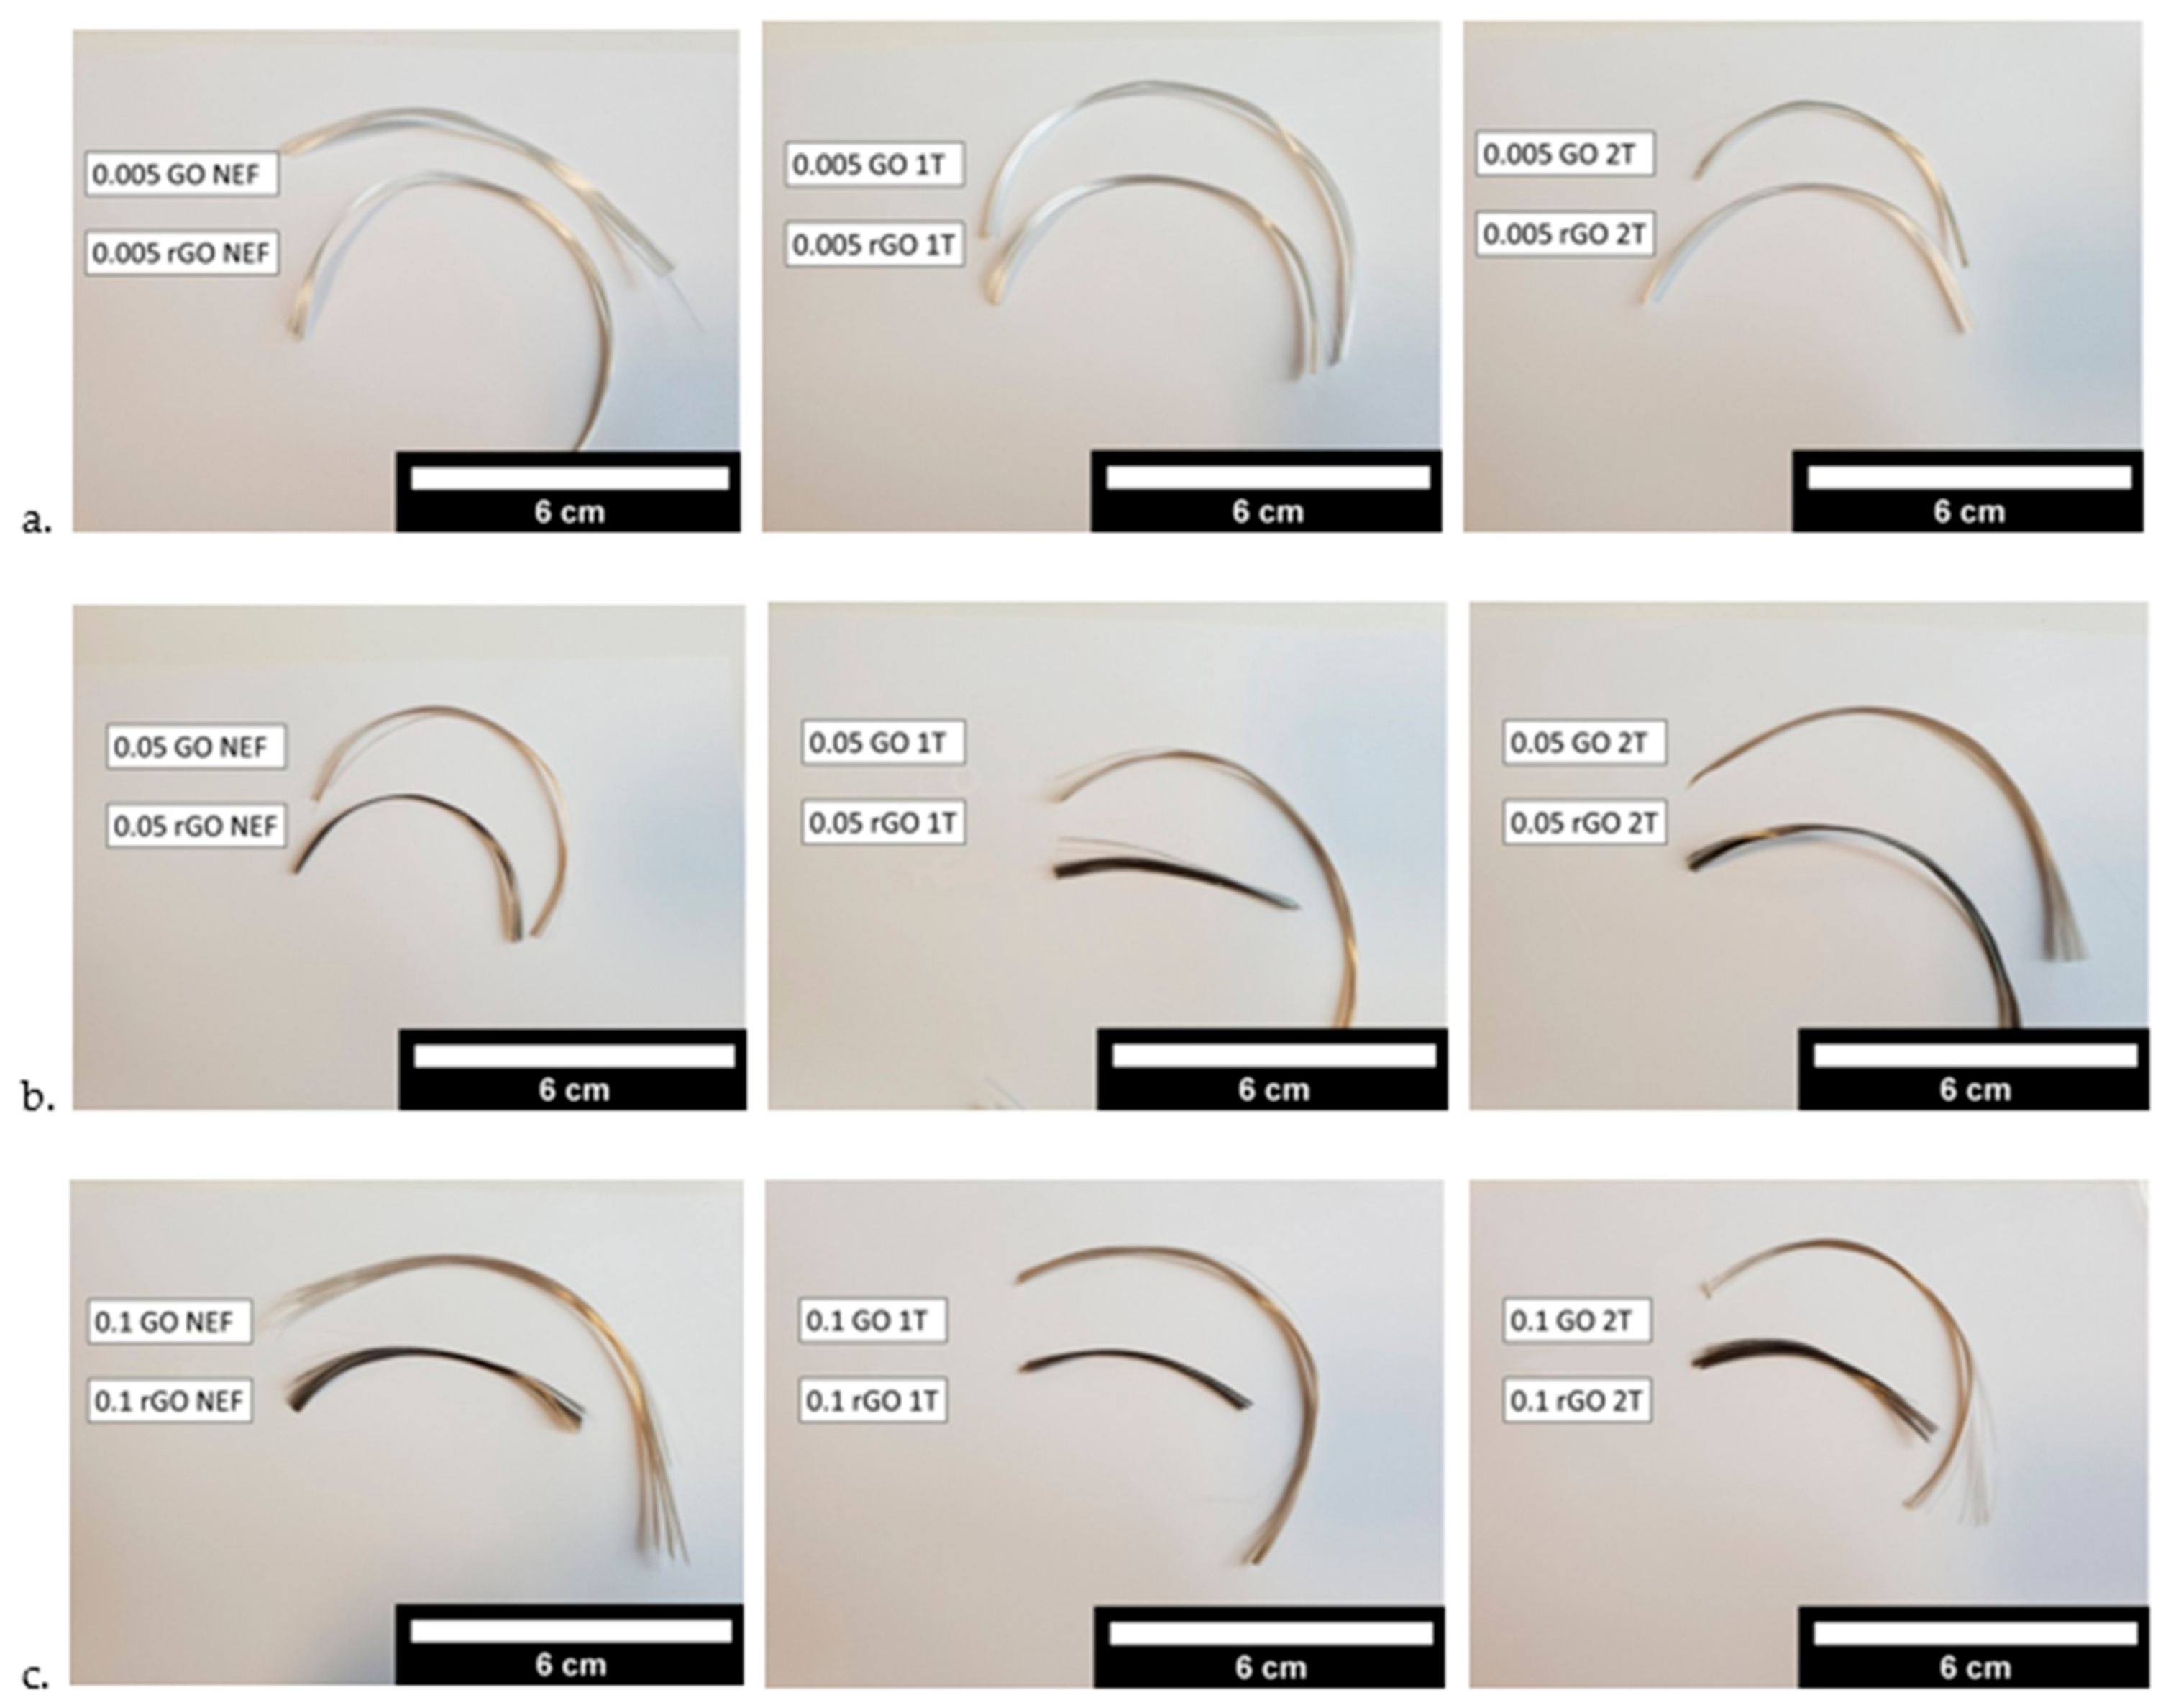
The physical appearances of glass fibers coated by the TE method are compared in Figure 3a–c. GO-coated fibers showed a light brown color, while rGO coated glass fibers assumed a darker color due to the chemical reduction process [43]. The darkening effect could be better seen on GF-coated fibers with higher GO concentrations, probably because of the higher amount of deposited nanomaterial. Apparently, the effect of triboelectrification of GF on the GO deposition is not so evident, as NEF, 1T, and 2T specimens obtained with the same GO concentration have a similar optical appearance.
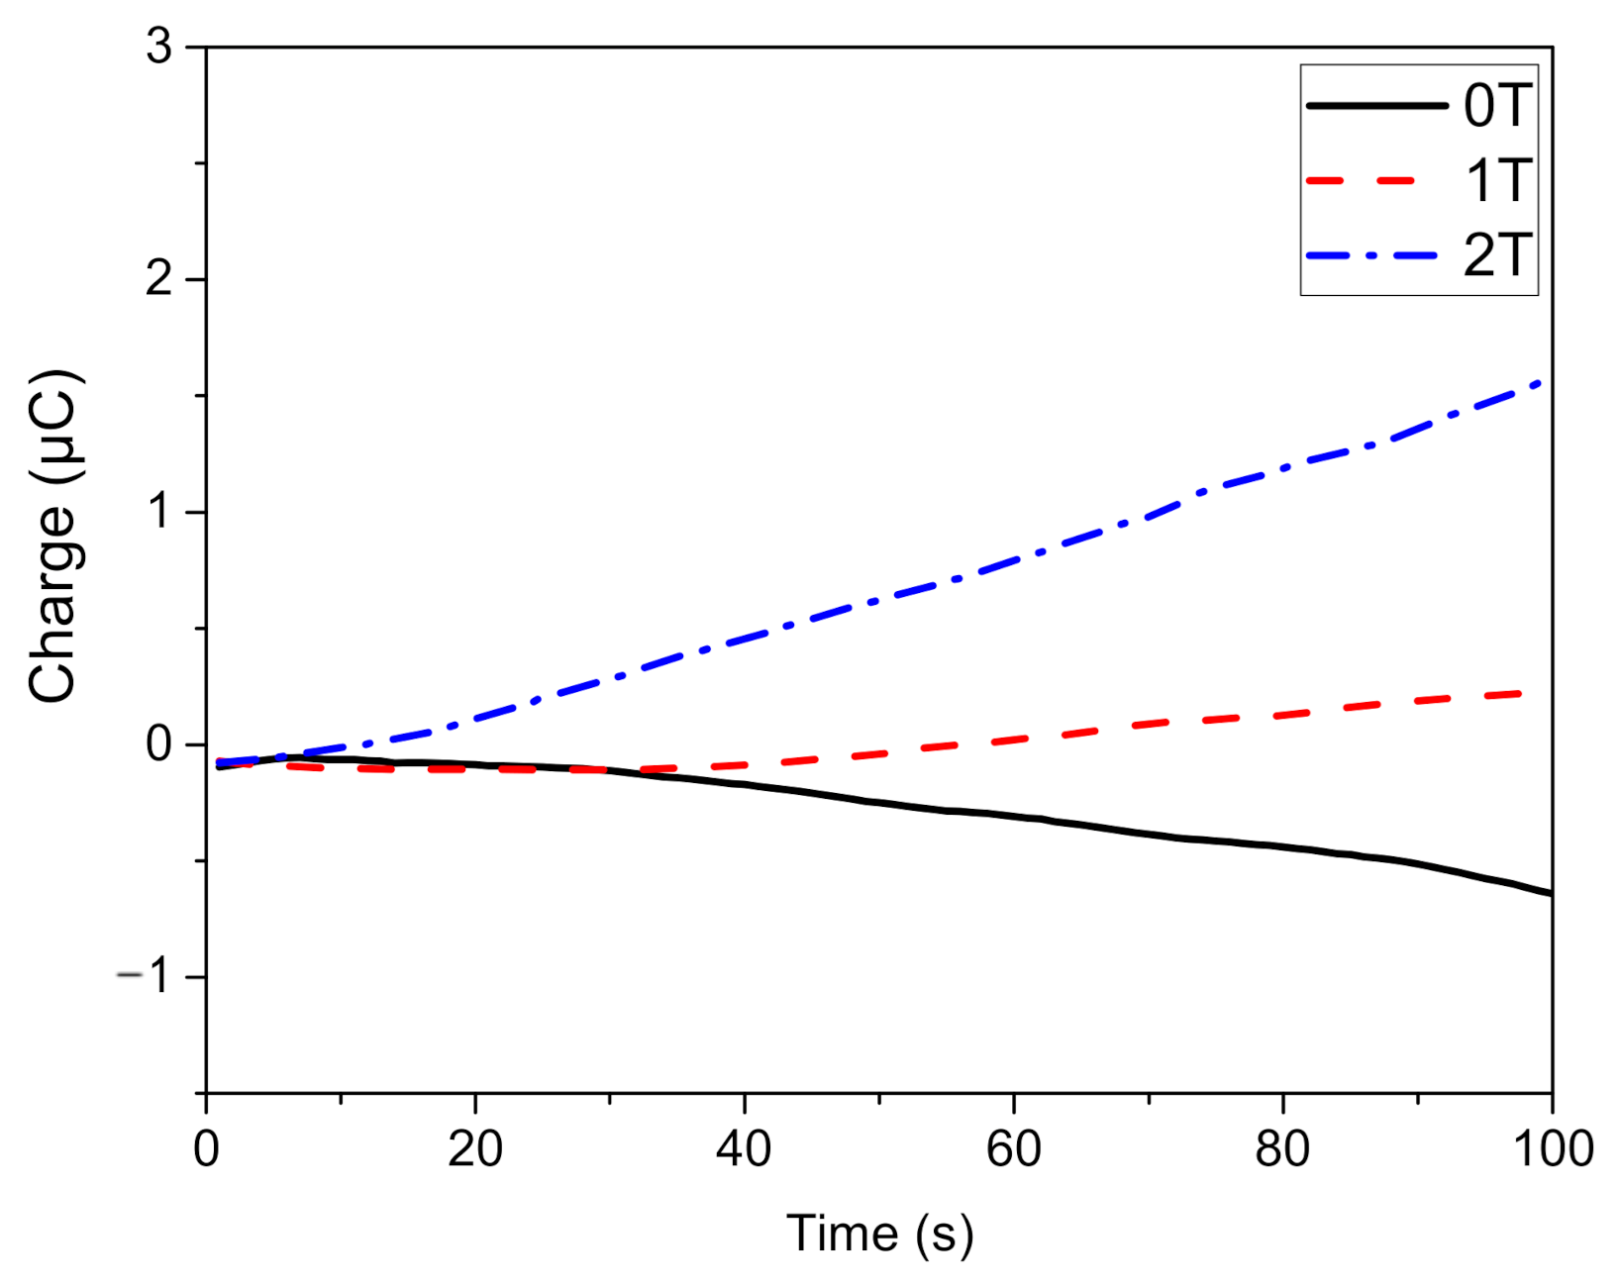
The amount of electrical charges accumulated onto the glass within 100 s of 0T, 1T, and 2T paths is summarized in Figure 4. For these preliminary charge measurements, the scrolling velocity was chosen arbitrarily equal to 2.8 rpm. The GF that followed the path, 0T, showed a partially negative pre-existing surface electrification owing to the rubbing of fibers with other materials during their storage. The grounded electrodes allowed the fibers to be partially discharged. The use of efficiently grounded electrodes could be a valid possibility for improving the discharging of the fibers. Nevertheless, a completely discharged GF surface was not strictly necessary since the curve obtained from the 0T path accounted for the charge background. This was eventually subtracted from the curves obtained from 1T and 2T paths, allowing us to detect the neat triboelectrification effect on the GF surface. GF, as expected, assumed a positive surface charge when rubbed against the PTFE wheels, thus indicating that an effective triboelectrification process occurred. The increased number of contact points given by the contact with the second PTFE wheel allowed a furthermore intense surface charge electrification.
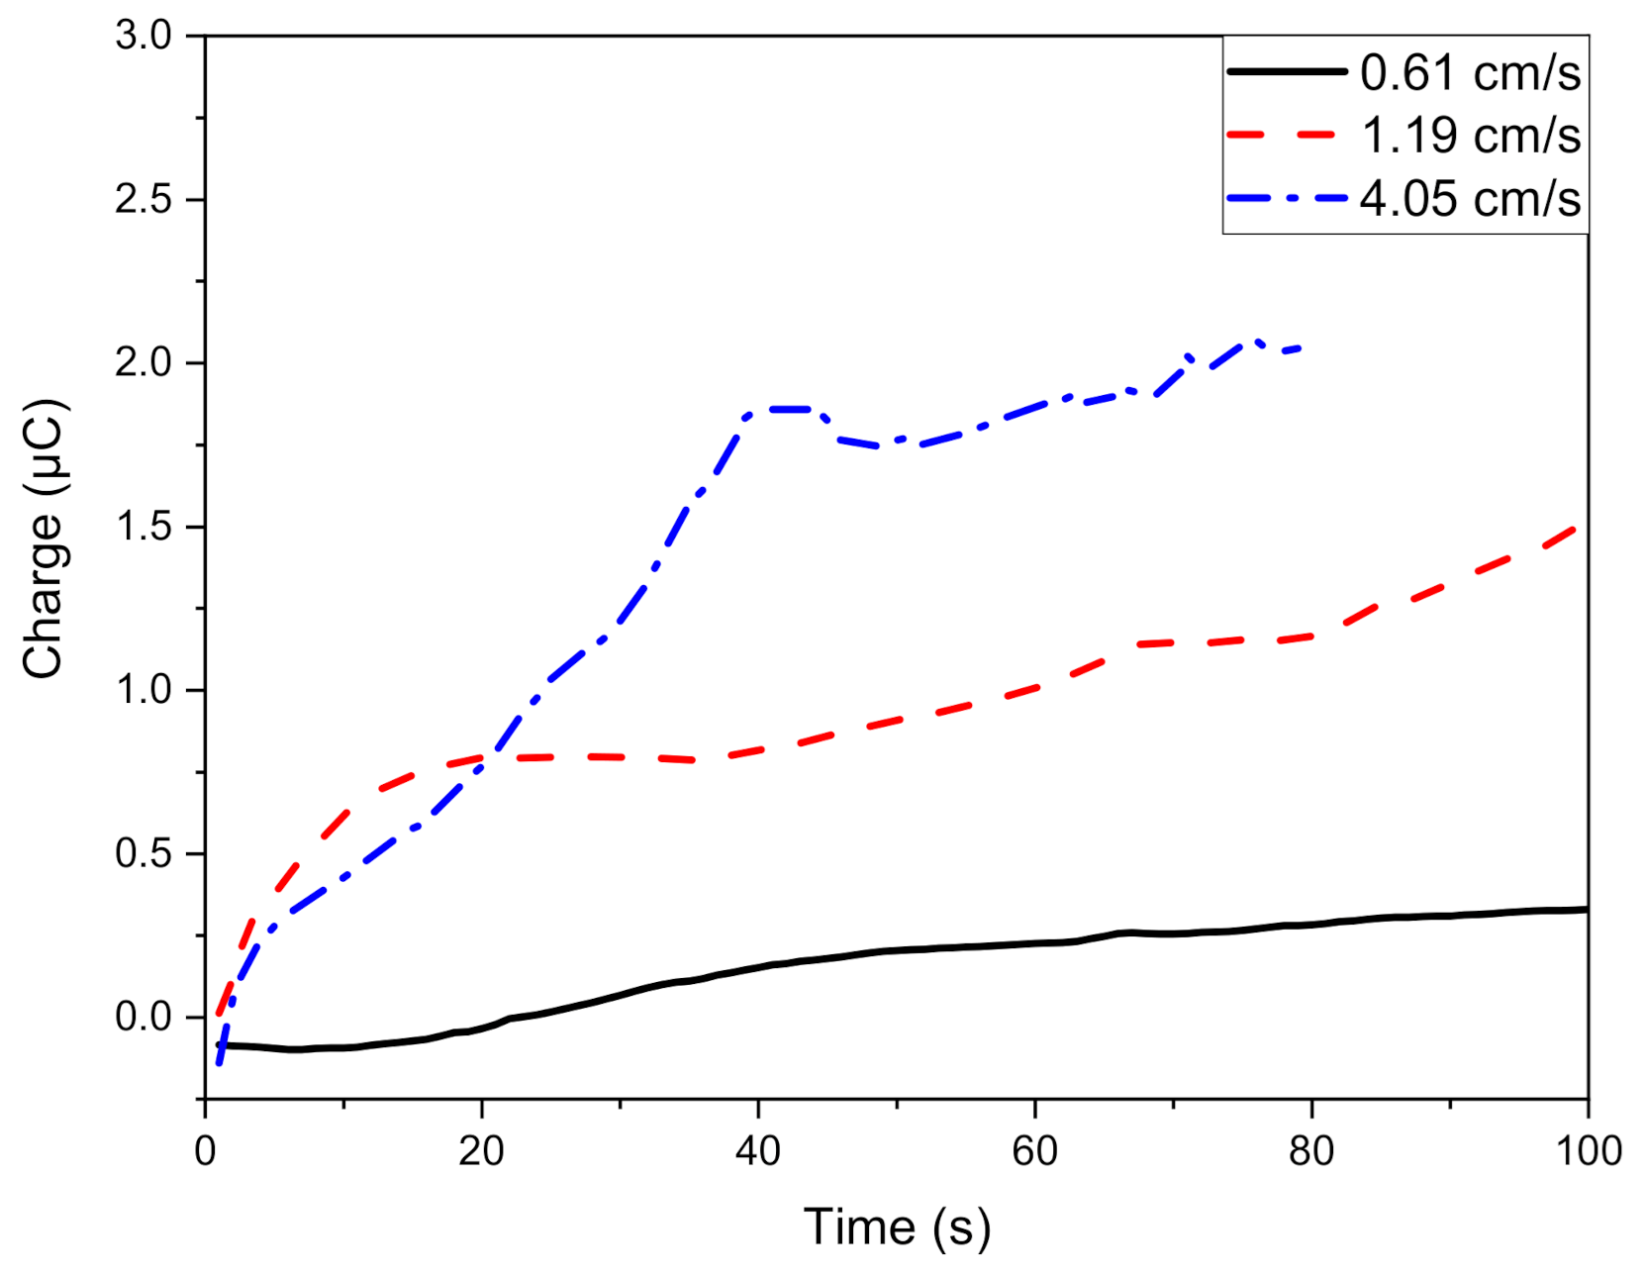
In Figure 5, the GF surface charge electrification curves obtained at three different scrolling velocities (i.e., 0.61 cm/s, 1.19 cm/s, and 4.05 cm/s), and following 1T path are reported. It can be seen that the higher the scrolling velocity, the greater the contact electrification. High scrolling velocity results in low contact time between fibers and PTFE wheels and thus in a high contact frequency. This means that the fibers were not discharged in air before being analyzed by the electrometer. Moreover, a high scrolling velocity induced an elevated contact pressure between the fibers and PTFE since the motor applied a higher tension on the fibers. High contact frequency and tension allowed to have a higher contact efficiency and thus a higher triboelectrification effect. However, an excessive scrolling velocity led to an unstable charge measurement due to the limitations on the maximum amount of charge measurable by the electrometer used (±2 µC). In fact, the curve obtained at the highest velocity (18.4 rpm) showed a rapid increment of the surface electrification up to 40 s, then the electrification stabilized showing a plateau approaching 2 µC. At about 80 s the measurement stopped since the detectable charge limit was reached. Thus, for the coating process, a scrolling velocity equal to 5.4 rpm was selected since it represented a good compromise between the intensity of the surface electrification and the requirement to minimize the force applied on the fibers to preserve their mechanical properties.
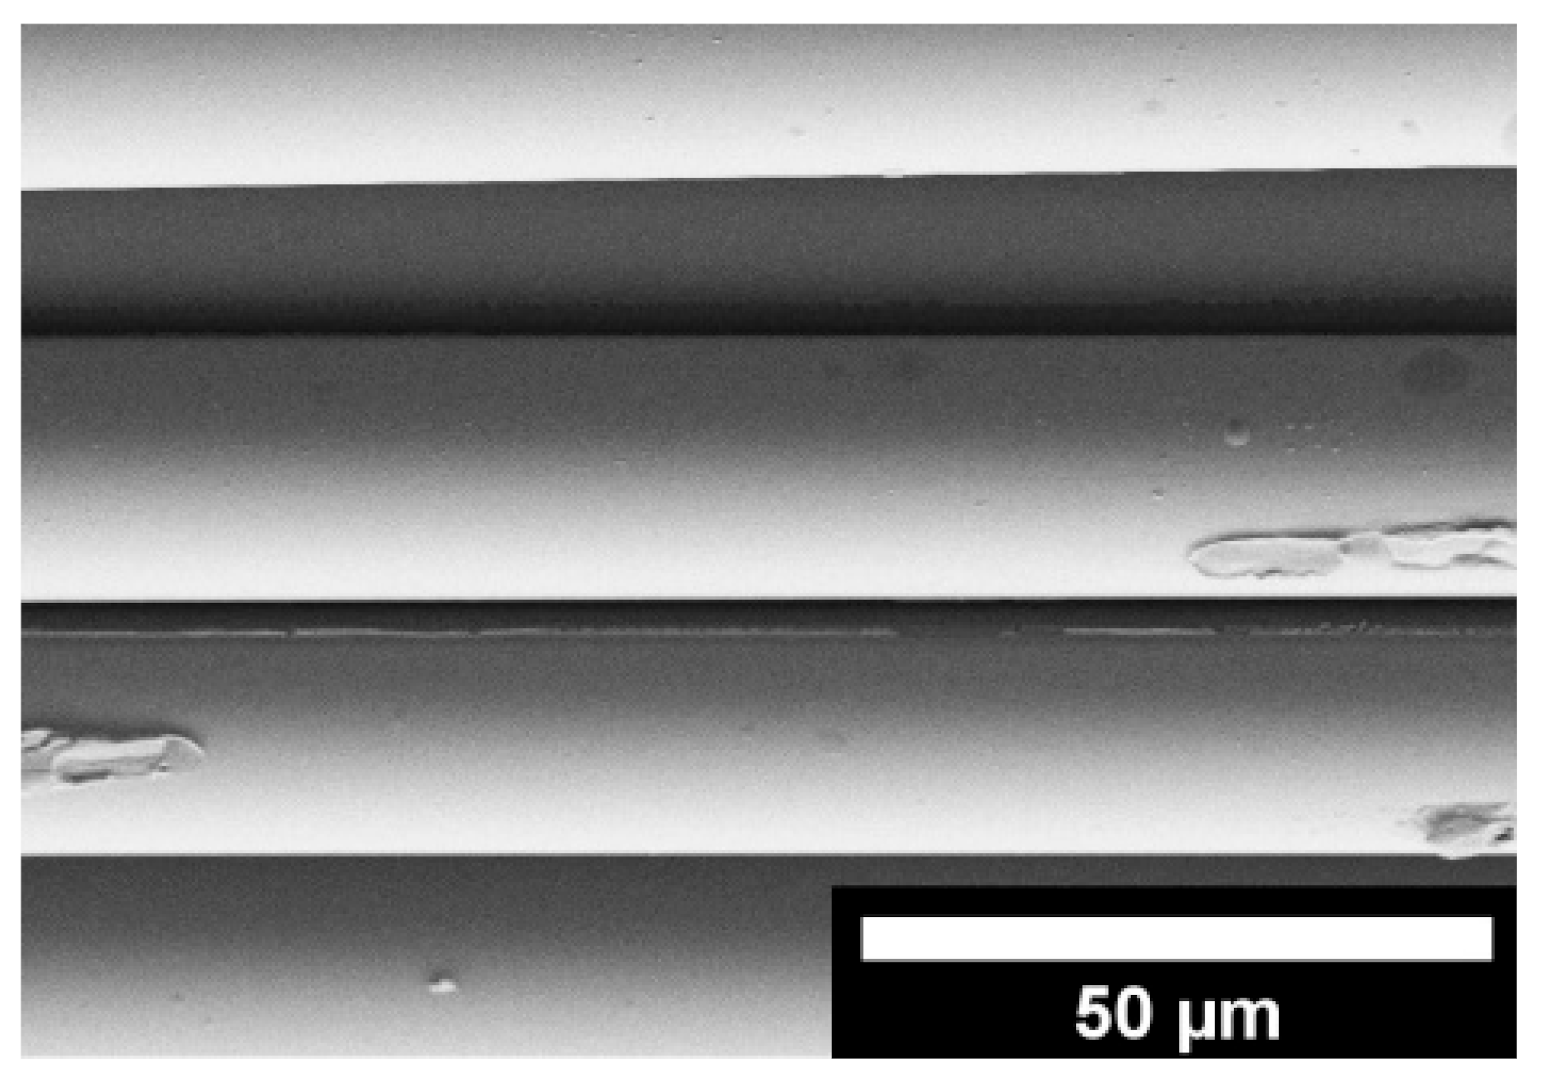
In Figure 6, a SEM image of a pristine GF specimen is shown. The surface appears to be smooth with no substantial defects except for the presence of the sizing agent since the GF was used without any pretreatment.
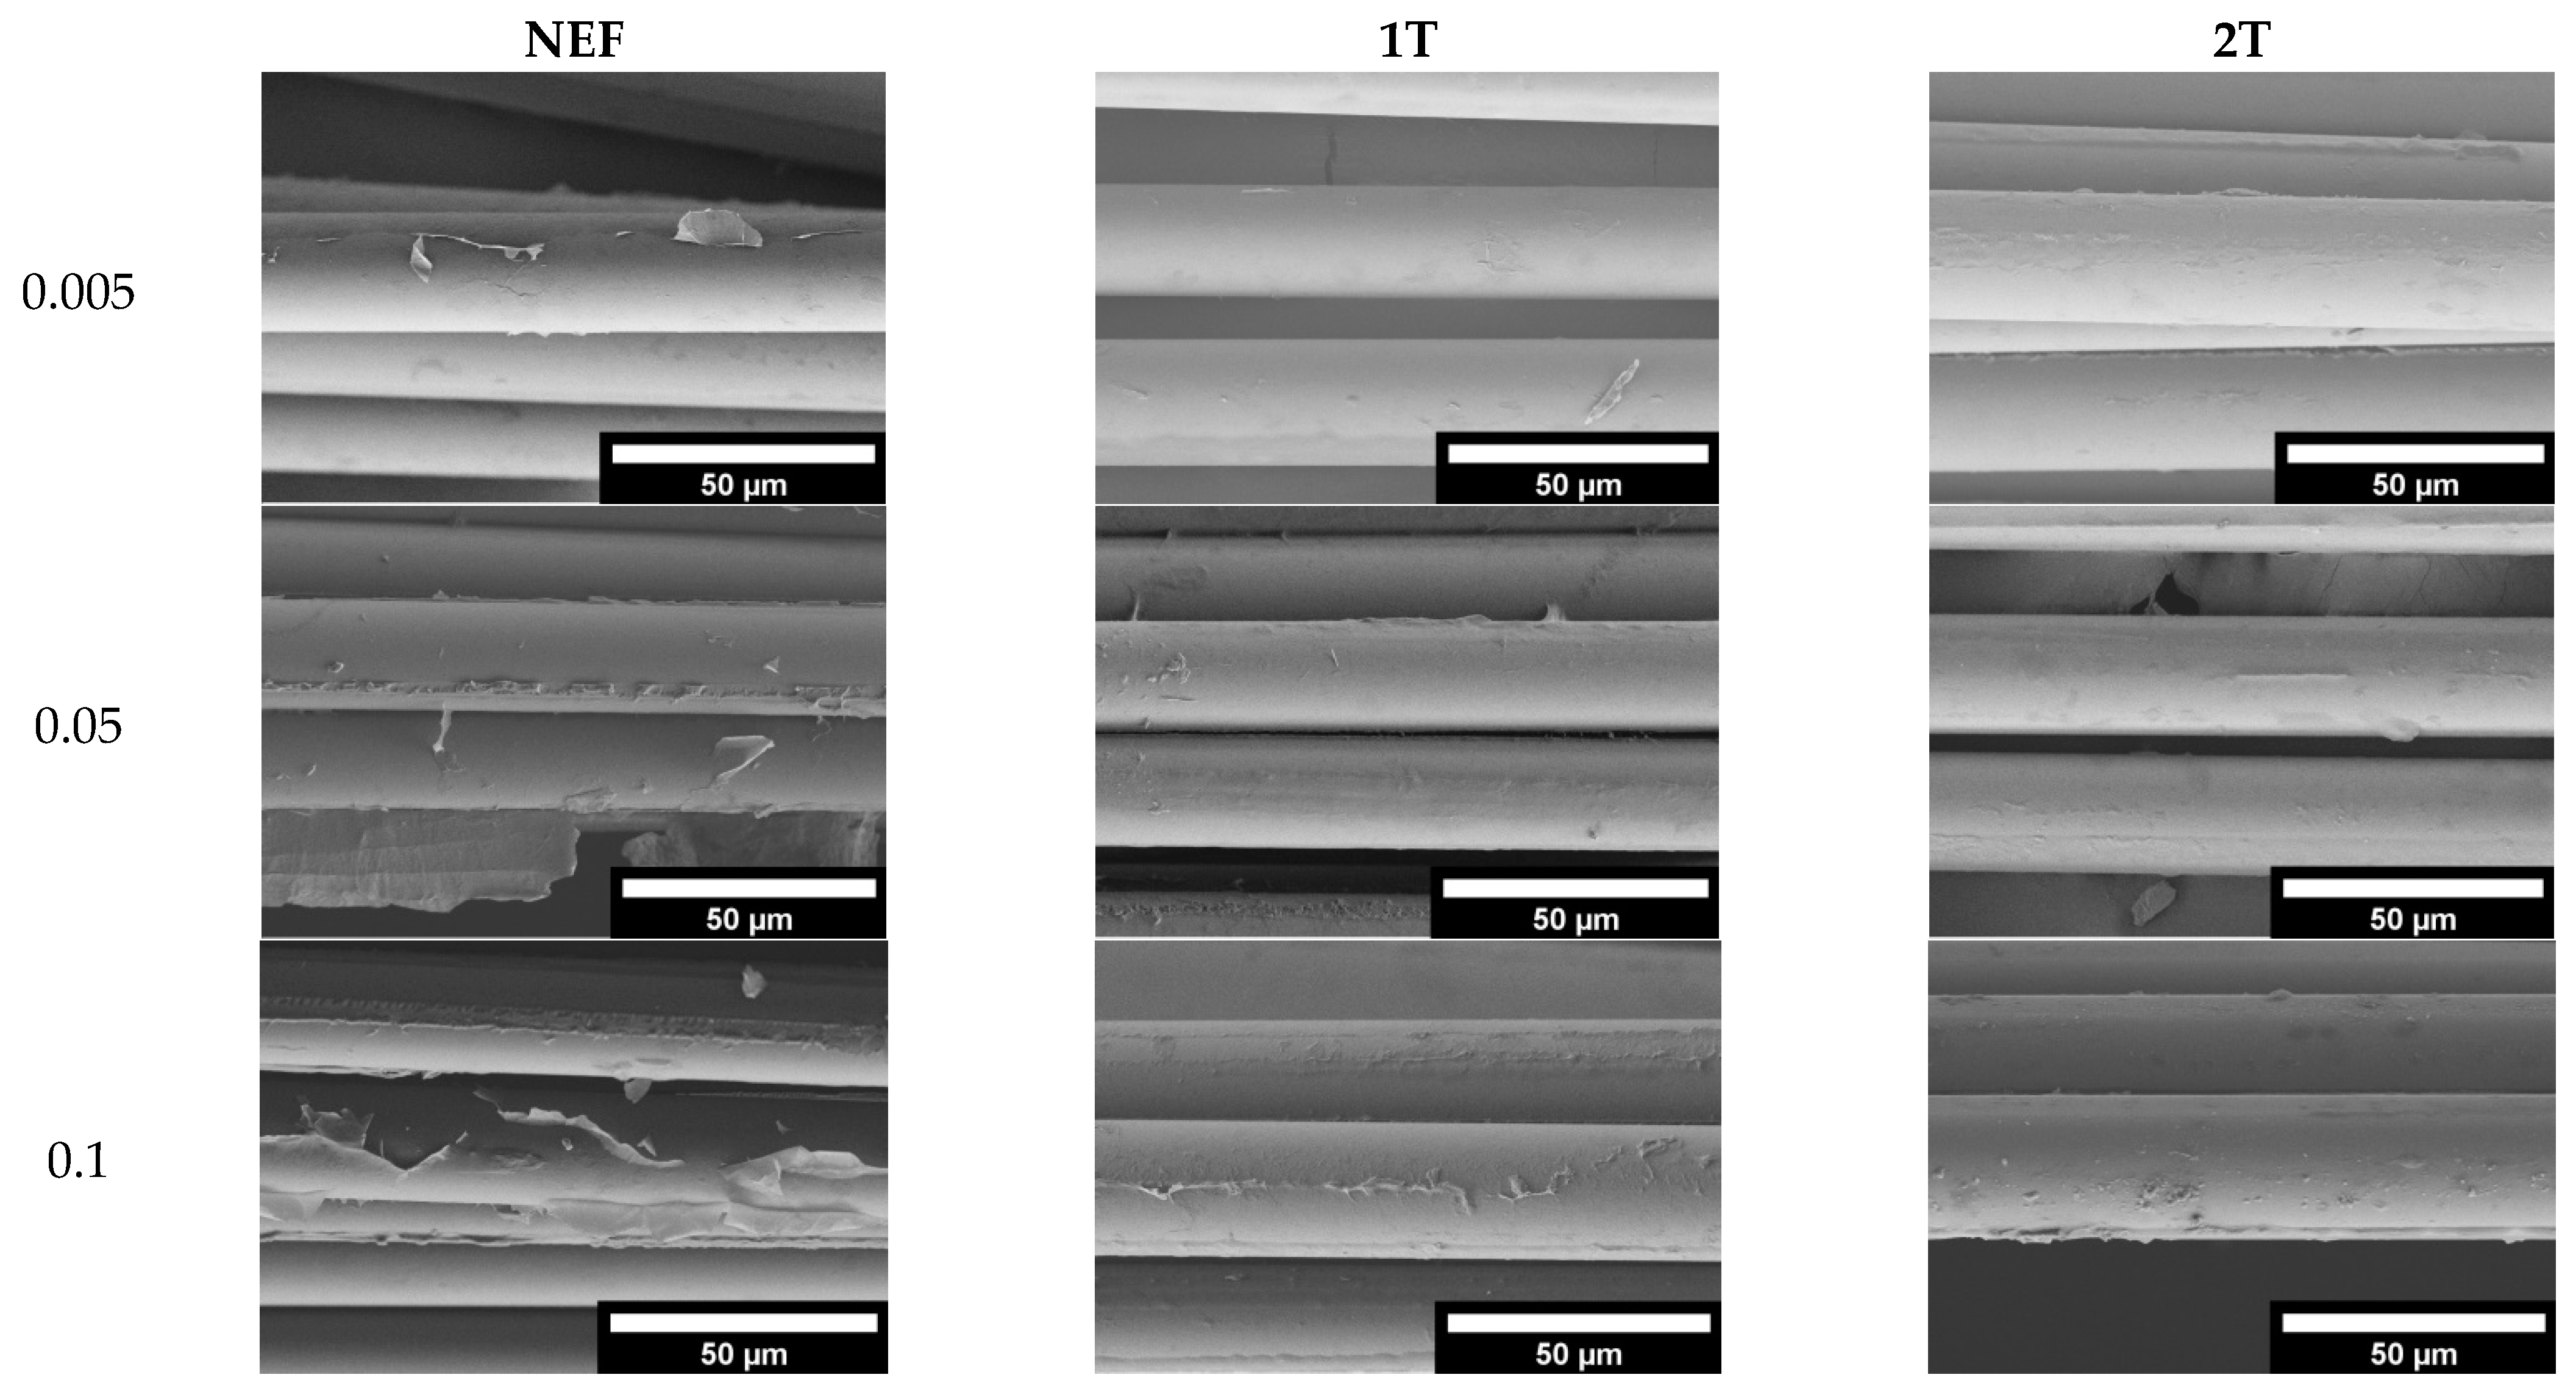
The surface morphology of the fibers after the rGO deposition as a function of CE intensity and the GO solution concentration can be evaluated in Figure 7. It can be seen that for all GO solutions, the rGO nanosheets appear to be more homogeneously attached to the GF by increasing the intensity of the TE process (i.e., moving from NEF to 1T or 2T). This is due to the creation of an increasing amount of positive charges on the GF surface by TE, which electrostatically attracted the negatively charged graphene sheets on the fibers. Qualitatively, SEM images confirm the increase of rGO deposition with the concentration of the GO solution. The same conclusions cannot be drawn considering the intensity of the TE process, since the difference of the rGO amount deposited passing from NEF to 2T is too small to be detected by SEM analysis. Further quantitative investigations, for example by using friction force microscopy (FFM) [27,44], could give more information on the effective quantity of the nanomaterial deposited upon the electrification. It can be, however, deduced that a physical interaction between GO nanosheets with charged GF takes place due to the creation of attractive surface charges on the latter. At a general level, it can be stated that the obtained homogeneity level of the deposited nanomaterial is a promising indication of an efficient deposition method.
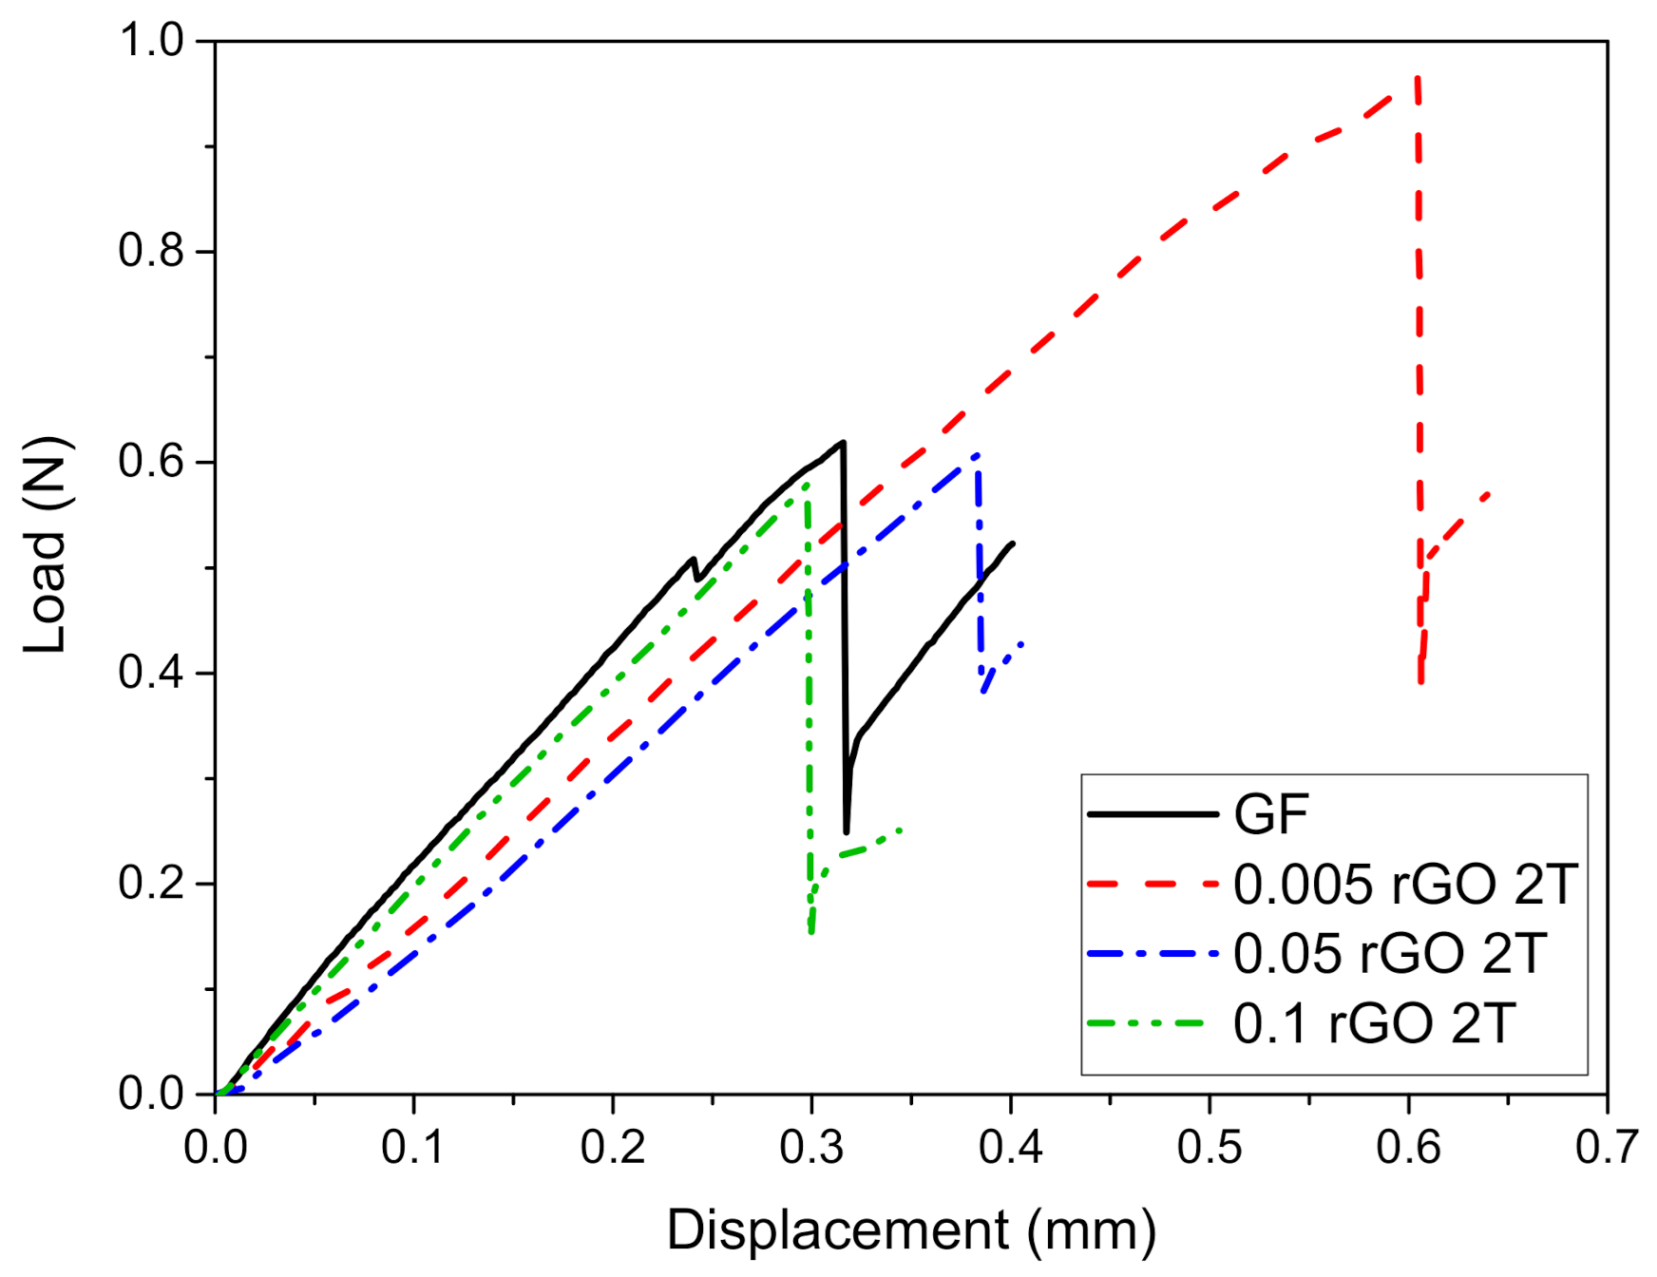
Representative load–displacement curves obtained from microdebonding tests on rGO coated glass fibers characterized by 2T electrification are reported in Figure 8 and compared with those of the uncoated GF sample. For each specimen, the obtained values of the pull-out force (Fmax) were used for the calculation of the interfacial shear strength (IFSS), as indicated in Equation (1).
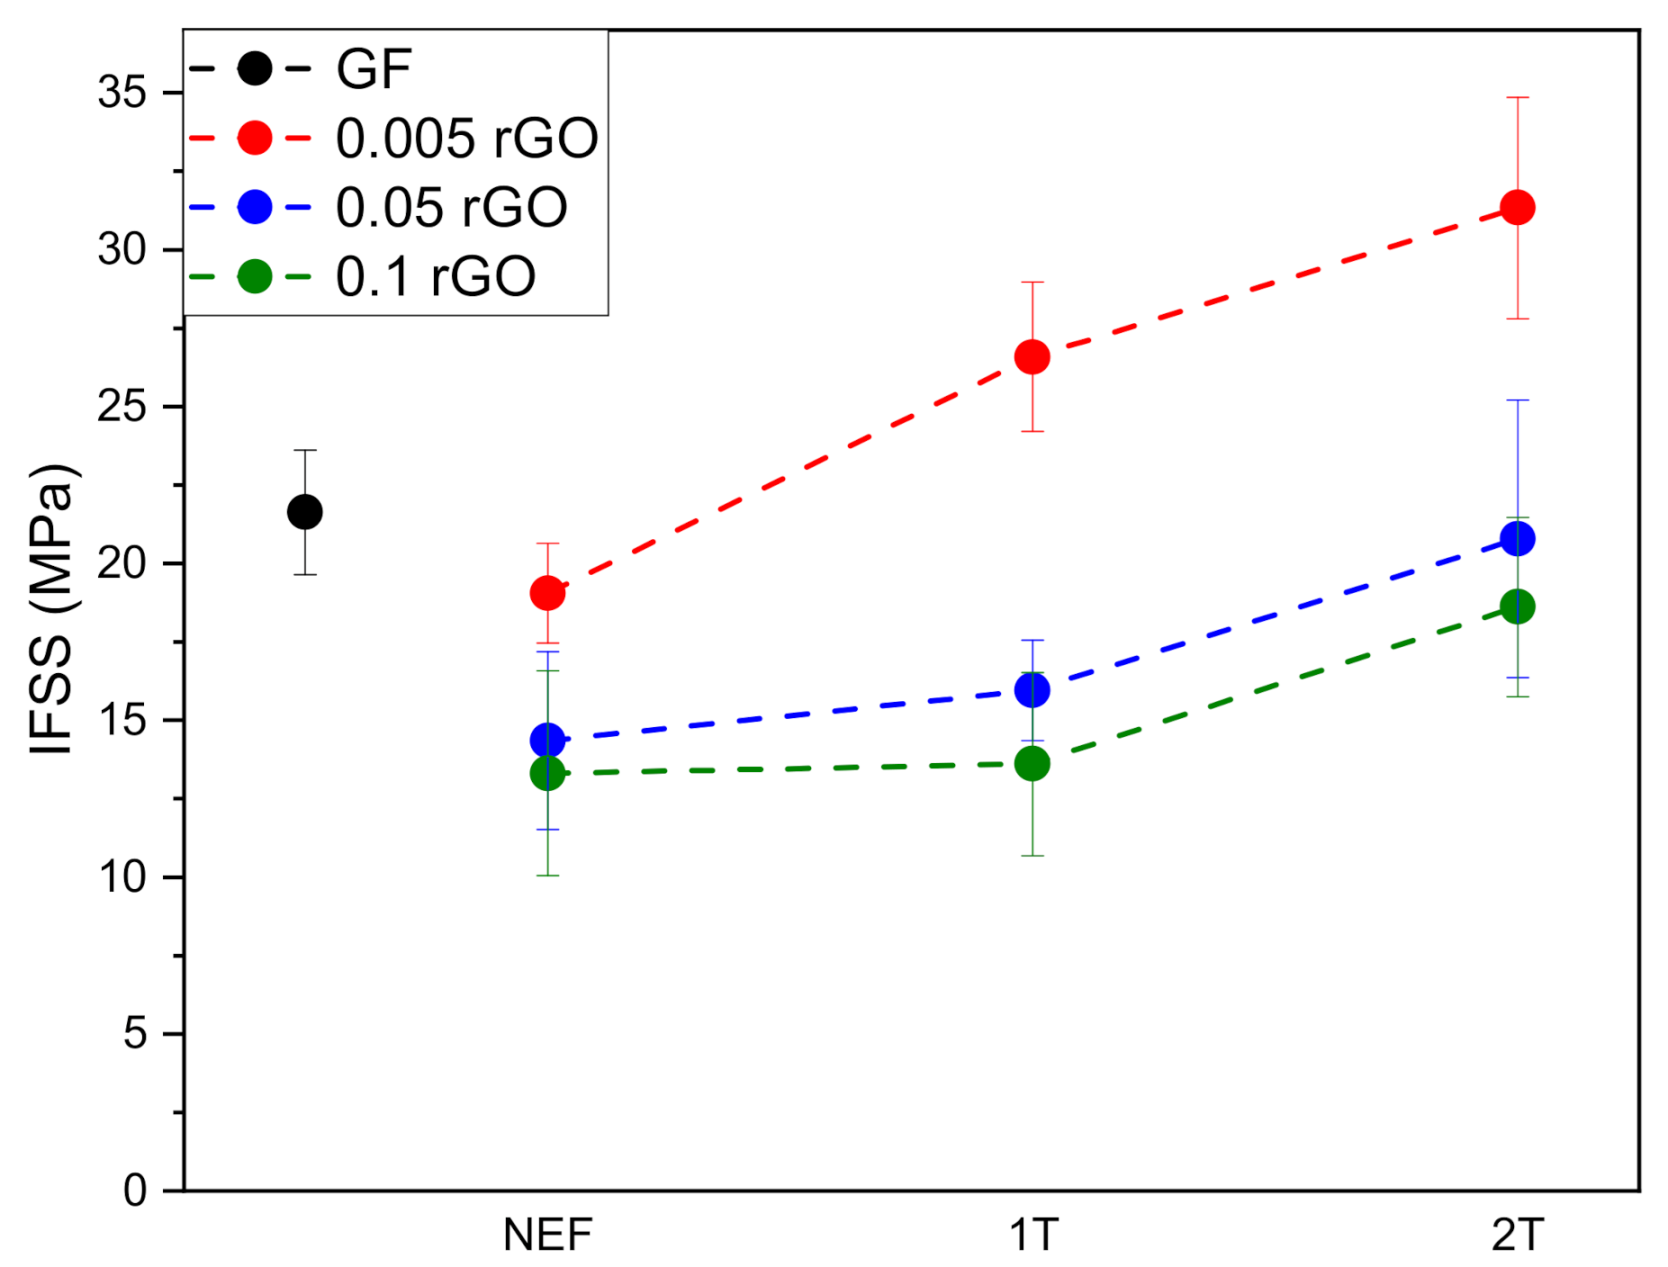
A comparison of the average IFSS values of uncoated and rGO coated GF is shown in Figure 9. A decrease of IFSS values is observed by increasing the GO content in the solution, while a considerable increment of IFSS values from NEF to 2T can be registered in the case of 0.005 rGO coated fibers (+45% with respect to GF). It can be deduced that the TE-based coating under 2T conditions from the GO solution at the lowest concentration lead to the creation of an optimized rGO interphase that favored an enhancement of fiber/matrix interfacial adhesion. The positive effect of the electrification could be connected to the fact that the electrification promoted good compaction of the deposited coating since the GO sheets are electrostatically attracted by the opposite surface charges of the fibers. This may result in a lower relative sliding of the rGO sheets, thus favoring the adhesion of the matrix on the coated fibers. This compaction is probably partially lost, increasing the amount of nanomaterial deposited thus allowing an easier sliding between nanosheets and a decrease of the matrix/fiber adhesion. However, further analyses should be made to confirm this hypothesis.
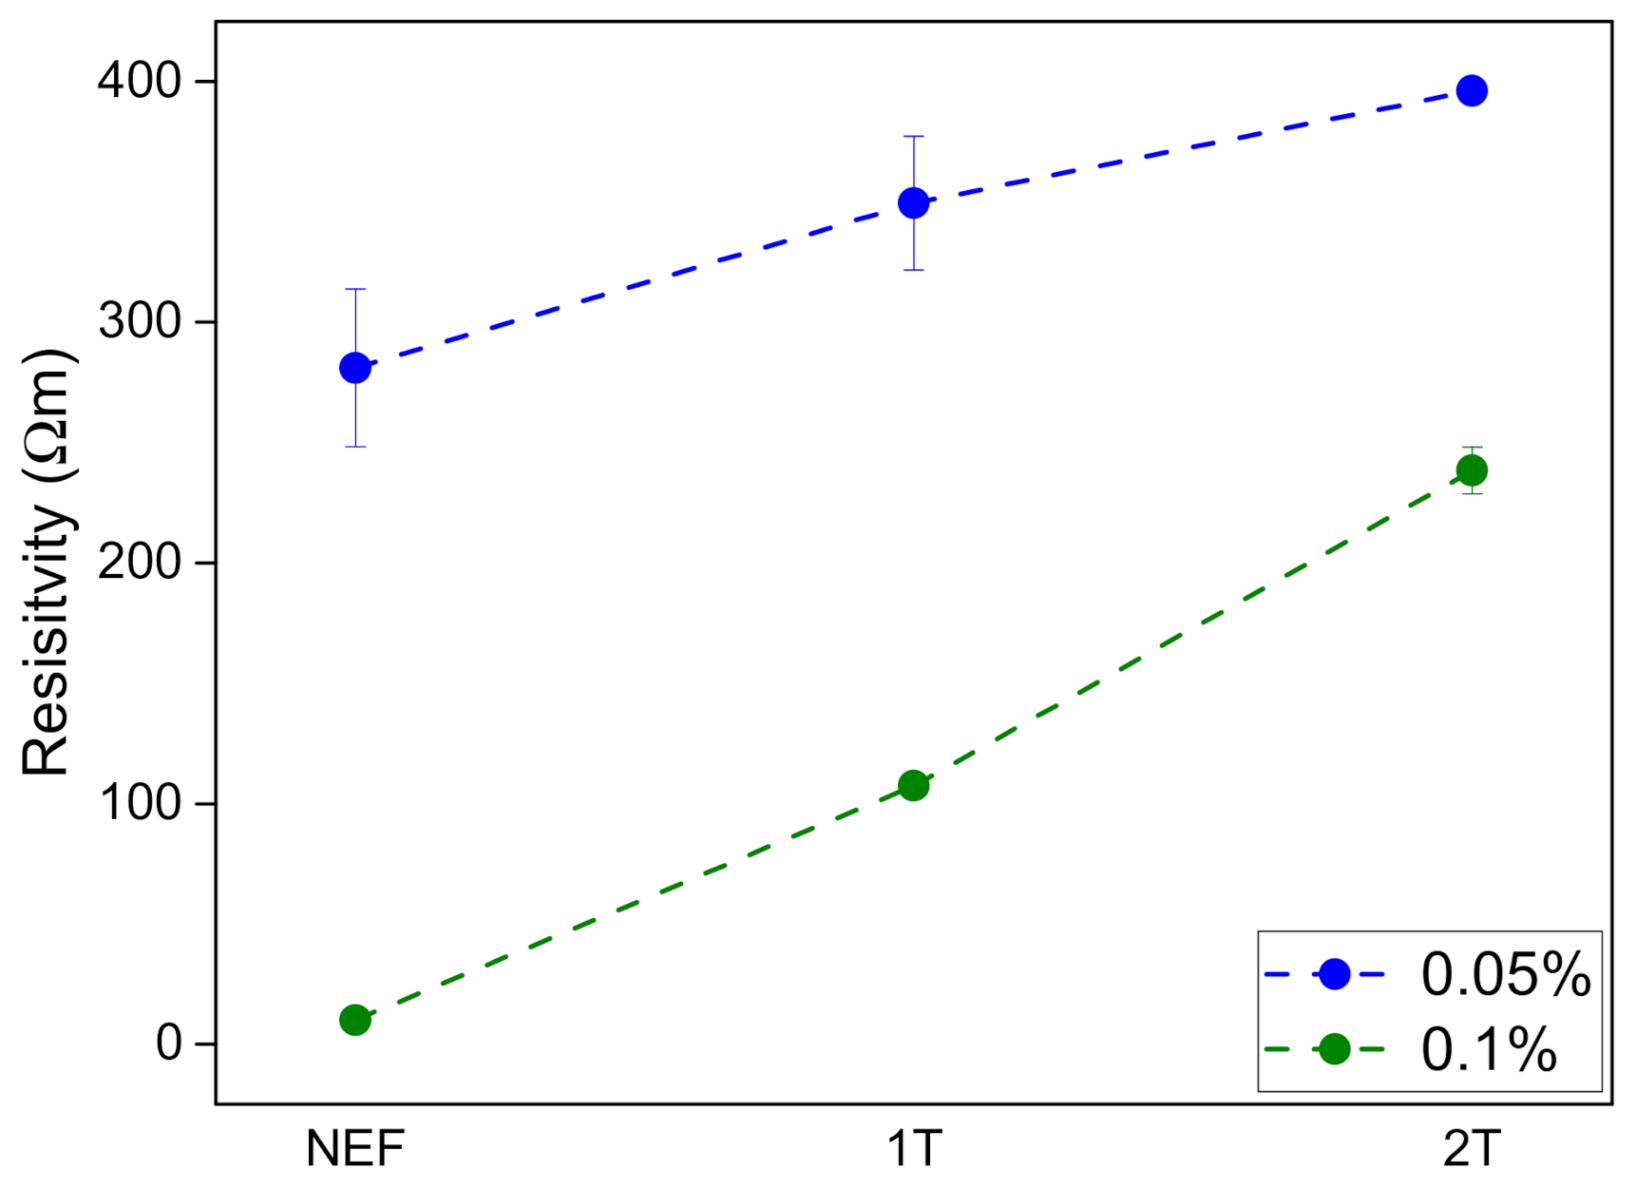
All rGO coated glass fibers were subjected to surface electrical resistivity measurements to evaluate the extent of the reduction of GO to rGO, and electrical resistivity values are reported in Figure 10. As expected, the presence of the conductive rGO layer on the fibers imparted electrical conductivity to the insulating GF, thus demonstrating the validity of the deposition method. However, this is true only for the fibers coated with an elevated GO concentration, i.e., 0.05 and 0.1 rGO coated glass fibers. In the case of 0.005 rGO coated glass fibers, the resistivity measurement was not possible. An explanation could be that, for this sample, the percolation limit, i.e., the formation of a continuous network of reduced graphene oxide on the fiber surface, was not reached, and therefore electrical conductivity is too low to be measured. For 0.05 and 0.1 rGO coated GF, the electrical resistivity showed lower values in the case of 0.1 rGO coated glass fibers. Having such fibers resistivity values much lower than glass, the successful reduction of GO to rGO is confirmed. However, the TE process does not significantly affect the resistivity values of rGO coated fibers. This suggests that the TE process for graphene coating does not significantly increase the amount of GO coating, rather than it only improves the quality of the coatings produced.
4. Conclusions
For the first time, triboelectrification was proposed as a viable method for the deposition of charged nanoparticles onto continuous glass fibers. The GF roving was rubbed against PTFE surface to generate surface charges by contact electrification. As per the triboelectric series, positive charges were created on the GF, and these naturally attracted negatively charged GO in an aqueous dispersion. It was found that the electrical charge on the GF surface increased with the intensity of the TE process. GO coating on GF was then chemically reduced to produce rGO coated GF. FESEM analysis confirmed the presence of the coating of rGO on GF, as the TE process forced the rGO sheets to completely adhere onto the GF surface. Micro composites were created by depositing epoxy drops on both uncoated and coated GF. The micro debonding tests highlighted an enhancement of the fiber/matrix interfacial shear strength of 45% in the case of rGO coated fibers in comparison to the uncoated ones. Moreover, electrical resistivity values significantly decreased to the presence of a continuous rGO coating onto the GF surface.
Author Contributions
Conceptualization, H.M., A.D., and A.P.; methodology, H.M., A.D., and A.P.; software, H.M. and L.S.; validation, H.M., A.D. and A.P.; formal analysis, A.P.; investigation, H.M., L.S., A.D.; resources, A.D. and A.P.; data curation, H.M. and A.D.; writing—original draft preparation, H.M., and L.S.; writing—review and editing, A.D. and A.P.; visualization, H.M., A.D. and A.P.; supervision, H.M., A.D. and A.P.; project administration, H.M., A.D. and A.P.; funding acquisition, A.D. and A.P. All authors have read and agreed to the published version of the manuscript.
Funding
This research received no external funding.
Informed Consent Statement
Not applicable.
Data Availability Statement
Not available.
Acknowledgments
The authors are greatly thankful to Matteo Favaro for his support in the data acquisition from Keithley 6517A electrometer.
Conflicts of Interest
The authors declare no conflict of interest.
References
- Garg, A.C.; Mai, Y.-W. Failure mechanisms in toughened epoxy resins—A review. Compos. Sci. Technol. 1988, 31, 179–223. [Google Scholar] [CrossRef]
- Karger-Kocsis, J.; Mahmood, H.; Pegoretti, A. Recent advances in fiber/matrix interphase engineering for polymer composites. Prog. Mater. Sci. 2015, 73, 1–43. [Google Scholar] [CrossRef]
- Ismail, N.H.; Akindoyo, J.O.; Mariatti, M. Solvent mediated dispersion of carbon nanotubes for glass fibre surface modification—Suspensions stability and its effects on mechanical, interlaminar and dynamic mechanical properties of modified glass fibre reinforced epoxy laminates. Compos. Part A Appl. Sci. Manuf. 2020, 139, 106091. [Google Scholar] [CrossRef]
- Zhang, H.; Liu, Y.; Kuwata, M.; Bilotti, E.; Peijs, T. Improved fracture toughness and integrated damage sensing capability by spray coated CNTs on carbon fibre prepreg. Compos. Part A Appl. Sci. Manuf. 2015, 70, 102–110. [Google Scholar] [CrossRef]
- Zhang, H.; Liu, Y.; Huang, M.L.; Bilotti, E.; Peijs, T. Dissolvable thermoplastic interleaves for carbon nanotube localization in carbon/epoxy laminates with integrated damage sensing capabilities. Struct. Health Monit. 2016, 17, 59–66. [Google Scholar] [CrossRef]
- Gnidakouong, J.R.N.; Roh, H.D.; Kim, J.-H.; Park, Y.-B. In situ process monitoring of hierarchical micro-/nano-composites using percolated carbon nanotube networks. Compos. Part A Appl. Sci. Manuf. 2016, 84, 281–291. [Google Scholar] [CrossRef]
- Liao, L.; Wang, X.; Fang, P.; Liew, K.M.; Pan, C. Interface Enhancement of Glass Fiber Reinforced Vinyl Ester Composites with Flame-Synthesized Carbon Nanotubes and Its Enhancing Mechanism. ACS Appl. Mater. Interfaces 2011, 3, 534–538. [Google Scholar] [CrossRef]
- Siddiqui, N.A.; Li, E.L.; Sham, M.-L.; Tang, B.Z.; Gao, S.L.; Maeder, E.; Kim, J.-K. Tensile strength of glass fibres with carbon nanotube–epoxy nanocomposite coating: Effects of CNT morphology and dispersion state. Compos. Part A Appl. Sci. Manuf. 2010, 41, 539–548. [Google Scholar] [CrossRef] [Green Version]
- Barber, A.H.; Zhao, Q.; Wagner, H.D.; Baillie, C.A. Characterization of E-glass–polypropylene interfaces using carbon nanotubes as strain sensors. Compos. Sci. Technol. 2004, 64, 1915–1919. [Google Scholar] [CrossRef]
- Gao, S.-L.; Zhuang, R.-C.; Zhang, J.; Liu, J.-W.; Mäder, E. Glass Fibers with Carbon Nanotube Networks as Multifunctional Sensors. Adv. Funct. Mater. 2010, 20, 1885–1893. [Google Scholar] [CrossRef]
- Warrier, A.; Godara, A.; Rochez, O.; Mezzo, L.; Luizi, F.; Gorbatikh, L.; Lomov, S.V.; VanVuure, A.W.; Verpoest, I. The effect of adding carbon nanotubes to glass/epoxy composites in the fibre sizing and/or the matrix. Compos. Part A Appl. Sci. Manuf. 2010, 41, 532–538. [Google Scholar] [CrossRef]
- Zhang, J.E.; Zhuang, R.C.; Liu, J.W.; Mäder, E.; Heinrich, G.; Gao, S.L. Functional interphases with multi-walled carbon nanotubes in glass fibre/epoxy composites. Carbon 2010, 48, 2273–2281. [Google Scholar] [CrossRef]
- Liao, W.-H.; Tien, H.-W.; Hsiao, S.-T.; Li, S.-M.; Wang, Y.-S.; Huang, Y.-L.; Yang, S.-Y.; Ma, C.-C.M.; Wu, Y.-F. Effects of Multiwalled Carbon Nanotubes Functionalization on the Morphology and Mechanical and Thermal Properties of Carbon Fiber/Vinyl Ester Composites. ACS Appl. Mater. Interfaces 2013, 5, 3975–3982. [Google Scholar] [CrossRef]
- Chen, L.; Jin, H.; Xu, Z.W.; Shan, M.J.; Tian, X.; Yang, C.Y.; Wang, Z.; Cheng, B.W. A design of gradient interphase reinforced by silanized graphene oxide and its effect on carbon fiber/epoxy interface. Mater. Chem. Phys. 2014, 145, 186–196. [Google Scholar] [CrossRef]
- Jones, A.R.; Blaiszik, B.J.; White, S.R.; Sottos, N.R. Full recovery of fiber/matrix interfacial bond strength using a microencapsulated solvent-based healing system. Compos. Sci. Technol. 2013, 79, 1–7. [Google Scholar] [CrossRef]
- Jones, A.R.; Cintora, A.; White, S.R.; Sottos, N.R. Autonomic Healing of Carbon Fiber/Epoxy Interfaces. ACS Appl. Mater. Interfaces 2014, 6, 6033–6039. [Google Scholar] [CrossRef] [PubMed]
- Zhang, J.; Liu, J.; Zhuang, R.; Mäder, E.; Heinrich, G.; Gao, S. Single MWNT-Glass Fiber as Strain Sensor and Switch. Adv. Mater. 2011, 23, 3392–3397. [Google Scholar] [CrossRef] [PubMed]
- An, Q.; Rider, A.N.; Thostenson, E.T. Hierarchical Composite Structures Prepared by Electrophoretic Deposition of Carbon Nanotubes onto Glass Fibers. ACS Appl. Mater. Interfaces 2013, 5, 2022–2032. [Google Scholar] [CrossRef]
- Bekyarova, E.; Thostenson, E.T.; Yu, A.; Kim, H.; Gao, J.; Tang, J.; Hahn, H.T.; Chou, T.-W.; Itkis, M.E.; Haddon, R.C. Multiscale Carbon Nanotube−Carbon Fiber Reinforcement for Advanced Epoxy Composites. Langmuir 2007, 23, 3970–3974. [Google Scholar] [CrossRef]
- Schaefer, J.D.; Rodriguez, A.J.; Guzman, M.E.; Lim, C.-S.; Minaie, B. Effects of electrophoretically deposited carbon nanofibers on the interface of single carbon fibers embedded in epoxy matrix. Carbon 2011, 49, 2750–2759. [Google Scholar] [CrossRef] [Green Version]
- Battisti, A.; Esque-de los Ojos, D.; Ghisleni, R.; Brunner, A.J. Single fiber push-out characterization of interfacial properties of hierarchical CNT-carbon fiber composites prepared by electrophoretic deposition. Compos. Sci. Technol. 2014, 95, 121–127. [Google Scholar] [CrossRef]
- Jin, S.-Y.; Young, R.J.; Eichhorn, S.J. Hybrid carbon fibre–carbon nanotube composite interfaces. Compos. Sci. Technol. 2014, 95, 114–120. [Google Scholar] [CrossRef]
- Tsirka, K.; Karalis, G.; Paipetis, A.S. Raman Strain Sensing and Interfacial Stress Transfer of Hierarchical CNT-Coated Carbon Fibers. J. Mater. Eng. Perform. 2018, 27, 5095–5101. [Google Scholar] [CrossRef]
- Pedrazzoli, D.; Dorigato, A.; Pegoretti, A. Monitoring the mechanical behaviour of electrically conductive polymer nanocomposites under ramp and creep conditions. J. Nanosci. Nanotechnol. 2012, 12, 4093–4102. [Google Scholar] [CrossRef]
- Dorigato, A.; Pegoretti, A.; Quaresimin, M. Thermo-mechanical characterization of epoxy/clay nanocomposites as matrices for carbon/nanoclay/epoxy laminates. Mater. Sci. Eng. A 2011, 528, 6324–6333. [Google Scholar] [CrossRef]
- Dorigato, A.; Morandi, S.; Pegoretti, A. Effect of nanoclay addition on the fiber/matrix adhesion in epoxy/glass composites. J. Compos. Mater. 2011, 46, 1439–1451. [Google Scholar] [CrossRef]
- Mahmood, H.; Tripathi, M.; Pugno, N.; Pegoretti, A. Enhancement of interfacial adhesion in glass fiber/epoxy composites by electrophoretic deposition of graphene oxide on glass fibers. Compos. Sci. Technol. 2016, 126, 149–157. [Google Scholar] [CrossRef]
- Mahmood, H.; Vanzetti, L.; Bersani, M.; Pegoretti, A. Mechanical properties and strain monitoring of glass-epoxy composites with graphene-coated fibers. Compos. Part A Appl. Sci. Manuf. 2018, 107, 112–123. [Google Scholar] [CrossRef]
- Novoselov, K.S.; Geim, A.K.; Morozov, S.V.; Jiang, D.; Zhang, Y.; Dubonos, S.V.; Grigorieva, I.V.; Firsov, A.A. Electric field effect in atomically thin carbon films. Science 2004, 306, 666–669. [Google Scholar] [CrossRef] [PubMed] [Green Version]
- Lee, C.; Wei, X.; Kysar, J.W.; Hone, J. Measurement of the elastic properties and intrinsic strength of monolayer graphene. Science 2008, 321, 385–388. [Google Scholar] [CrossRef] [PubMed]
- Stoller, M.D.; Park, S.; Zhu, Y.; An, J.; Ruoff, R.S. Graphene-Based Ultracapacitors. Nano Lett. 2008, 8, 3498–3502. [Google Scholar] [CrossRef]
- Nair, R.R.; Blake, P.; Grigorenko, A.N.; Novoselov, K.S.; Booth, T.J.; Stauber, T.; Peres, N.M.R.; Geim, A.K. Fine Structure Constant Defines Visual Transparency of Graphene. Science 2008, 320, 1308. [Google Scholar] [CrossRef] [PubMed] [Green Version]
- Balandin, A.A.; Ghosh, S.; Bao, W.; Calizo, I.; Teweldebrhan, D.; Miao, F.; Lau, C.N. Superior Thermal Conductivity of Single-Layer Graphene. Nano Lett. 2008, 8, 902–907. [Google Scholar] [CrossRef] [PubMed]
- Mccarty, L.S.; Whitesides, G.M. Electrostatic Charging Due to Separation of Ions at Interfaces: Contact Electrification of Ionic Electrets. Angew. Chem. Int. Ed. 2008, 47, 2188–2207. [Google Scholar] [CrossRef] [PubMed]
- Wang, Z.L.; Wang, A.C. On the origin of contact-electrification. Mater. Today 2019, 30, 34–51. [Google Scholar] [CrossRef]
- Schein, L.B. Electrophotography and Development Physics; Laplacian Press: Morgan Hill, CA, USA, 1996. [Google Scholar]
- Pai, D.M.; Springett, B.E. Physics of electrophotography. Rev. Mod. Phys. 1993, 65, 163–211. [Google Scholar] [CrossRef]
- Kwetkus, B.A. Particle Triboelectrification and Its Use in the Electrostatic Separation Process. Part. Sci. Technol. 1998, 16, 55–68. [Google Scholar] [CrossRef]
- Liu, C.; Bard, A.J. Electrostatic electrochemistry at insulators. Nat. Mater. 2008, 7, 505–509. [Google Scholar] [CrossRef]
- Fan, F.-R.; Tian, Z.-Q.; Wang, Z.L. Flexible triboelectric generator. Nano Energy 2012, 1, 328–334. [Google Scholar] [CrossRef]
- Wang, Z.L. Triboelectric Nanogenerators as New Energy Technology for Self-Powered Systems and as Active Mechanical and Chemical Sensors. ACS Nano 2013, 7, 9533–9557. [Google Scholar] [CrossRef]
- Thomas, S.W., III; Vella, S.J.; Kaufman, G.K.; Whitesides, G.M. Patterns of Electrostatic Charge and Discharge in Contact Electrification. Angew. Chem. Int. Ed. 2008, 47, 6654–6656. [Google Scholar] [CrossRef] [PubMed]
- Mahmood, H.; Dorigato, A.; Pegoretti, A. Temperature Dependent Strain/Damage Monitoring of Glass/Epoxy Composites with Graphene as a Piezoresistive Interphase. Fibers 2019, 7, 17. [Google Scholar] [CrossRef] [Green Version]
- Tripathi, M.; Mahmood, H.; Novel, D.; Iacob, E.; Vanzetti, L.; Bartali, R.; Speranza, G.; Pegoretti, A.; Pugno, N. Nanoscale friction of graphene oxide over glass-fibre and polystyrene. Compos. Part B Eng. 2018, 148, 272–280. [Google Scholar] [CrossRef]
Figure 1.
Schematic representation of lab-made setup for the triboelectrification of glass fibers and charge measurements tests.
Figure 1.
Schematic representation of lab-made setup for the triboelectrification of glass fibers and charge measurements tests.

Figure 2.
Schematic representation of the triboelectrification deposition process of graphene oxide on glass fibers.
Figure 2.
Schematic representation of the triboelectrification deposition process of graphene oxide on glass fibers.

Figure 3.
Representative images of (a) 0.005 GO/rGO, (b) 0.05 GO/rGO, (c) 0.1 GO/rGO fibers (NEF, 1T, 2T).
Figure 3.
Representative images of (a) 0.005 GO/rGO, (b) 0.05 GO/rGO, (c) 0.1 GO/rGO fibers (NEF, 1T, 2T).

Figure 4.
GF electrification curves obtained from 0T, 1T, and 2T paths at a scrolling velocity equal to 2.8 rpm.
Figure 4.
GF electrification curves obtained from 0T, 1T, and 2T paths at a scrolling velocity equal to 2.8 rpm.

Figure 5.
GF electrification curves at different scrolling velocities obtained following 1T path.

Figure 6.
SEM image of GF.

Figure 7.
SEM images of rGO coated samples with varying graphene oxide (GO) concentrations and electrification process.
Figure 7.
SEM images of rGO coated samples with varying graphene oxide (GO) concentrations and electrification process.

Figure 8.
Comparison of load–displacement curves from microdebonding tests of uncoated GF and rGO coated GF, with electrification 2T.
Figure 8.
Comparison of load–displacement curves from microdebonding tests of uncoated GF and rGO coated GF, with electrification 2T.

Figure 9.
Comparison of interfacial shear strength (IFSS) values obtained from micro debonding tests on uncoated and rGO coated GF.
Figure 9.
Comparison of interfacial shear strength (IFSS) values obtained from micro debonding tests on uncoated and rGO coated GF.

Figure 10.
Electrical resistivity values of rGO coated fibers.


Table 1.
Uncoated and coated fibers designation.
| Sample Name | Graphene Oxide Concentration (%) | Electrification Process |
|---|---|---|
| GF * | - | - |
| 0.005 GO NEF/0.005 rGO NEF | 0.005 | NEF |
| 0.005 GO 1T/0.005 rGO 1T | 0.005 | 1T |
| 0.005 GO 2T/0.005 rGO 2T | 0.005 | 2T |
| 0.05 GO NEF/0.05 rGO NEF | 0.05 | NEF |
| 0.05 GO 1T/0.05 rGO 1T | 0.05 | 1T |
| 0.05 GO 2T/0.05 rGO 2T | 0.05 | 2T |
| 0.1 GO NEF/0.1 rGO NEF | 0.1 | NEF |
| 0.1 GO 1T/0.1 rGO 1T | 0.1 | 1T |
| 0.1 GO T/0.1 rGO T | 0.1 | 2T |
* Glass fibers neither triboelectrified nor coated with graphene oxide.
Publisher’s Note: MDPI stays neutral with regard to jurisdictional claims in published maps and institutional affiliations. |
© 2021 by the authors. Licensee MDPI, Basel, Switzerland. This article is an open access article distributed under the terms and conditions of the Creative Commons Attribution (CC BY) license (https://creativecommons.org/licenses/by/4.0/).
Share and Cite
MDPI and ACS Style
Mahmood, H.; Simonini, L.; Dorigato, A.; Pegoretti, A. Graphene Deposition on Glass Fibers by Triboelectrification. Appl. Sci. 2021, 11, 3123. https://0-doi-org.brum.beds.ac.uk/10.3390/app11073123
AMA Style
Mahmood H, Simonini L, Dorigato A, Pegoretti A. Graphene Deposition on Glass Fibers by Triboelectrification. Applied Sciences. 2021; 11(7):3123. https://0-doi-org.brum.beds.ac.uk/10.3390/app11073123
Chicago/Turabian StyleMahmood, Haroon, Laura Simonini, Andrea Dorigato, and Alessandro Pegoretti. 2021. "Graphene Deposition on Glass Fibers by Triboelectrification" Applied Sciences 11, no. 7: 3123. https://0-doi-org.brum.beds.ac.uk/10.3390/app11073123
Note that from the first issue of 2016, this journal uses article numbers instead of page numbers. See further details here.