1. Introduction
Phone cameras released in the early 2000s had a very large pixel size because of the low number of pixels [
1]. For this reason, tolerance for the sensor assembly error was large, and no serious issue occurs without needing to correct the change in the image surface according to the object distance. However, the phone camera installed on the body of the latest phones has a very high number of pixels. Therefore, correcting the change in the image surface is necessary according to the distance of the object. This image-surface correction is called a focus adjustment, which is a technique commonly used in compact cameras and interchangeable lenses [
2]. However, because the phone camera is very small and light, it needs to perform focusing by moving the entire optical system [
3].
Several studies on such phone cameras have been conducted. After focusing on the optical system, a study was conducted on the equipment that automatically checks the uniformity of the image and various defects in the optical system [
3,
4,
5,
6]. Mostly, the captured images of compact camera modules assembled onto a charge-coupled device or complementary metal–oxide–semiconductor package, were automatically checked to detect some errors due to human operators. The proposed inspection processes that use a specialized image-processing algorithm were designed to reduce the overall assembly time and defects for compact camera module assembly. In addition, a real-time non-contact eccentric-error-measurement system that uses an optical setup without a rotating and clamping mechanism [
7] and a method for detecting foreign substances on the lens surface were also proposed [
8,
9]. The system could assess the 2D surface defects and non-uniformity of the 3D film thickness of specific materials using pattern recognition and morphological techniques. Because distinguishing the defect between the intensity of the defect itself and the background is difficult, an image-processing algorithm that uses multiple Laplacian of Gaussian masks were implemented to detect the defects of the micro lens. Moreover, a dynamic focus region from several narrow region of interests across the vision screen was used to increase the sharpness and determine the focal distance and focal point for better image acquisition [
10]. Various computation methods that use the gray-level difference, Tenengrad measurement, correlation evaluation, statistical approaches, Fourier transform, wavelet, and edge-based measurement have helped to reduce the processing time and increase the sharpness [
10]. The computation methods could be obtained from a flat surface at a single focal distance. Multi-focus application from the synthesis of differently focused images has been investigated to evaluate the sharpness. However, these studies did not focus on the measurement of the resolution of optical systems. In addition, a complex algorithm-based inspection procedure was automatically performed, but detecting the defects, error status, and accuracy increment would take time. In the present paper, we propose a method that can measure the resolution according to the change in the object distance without moving the resolution chart.
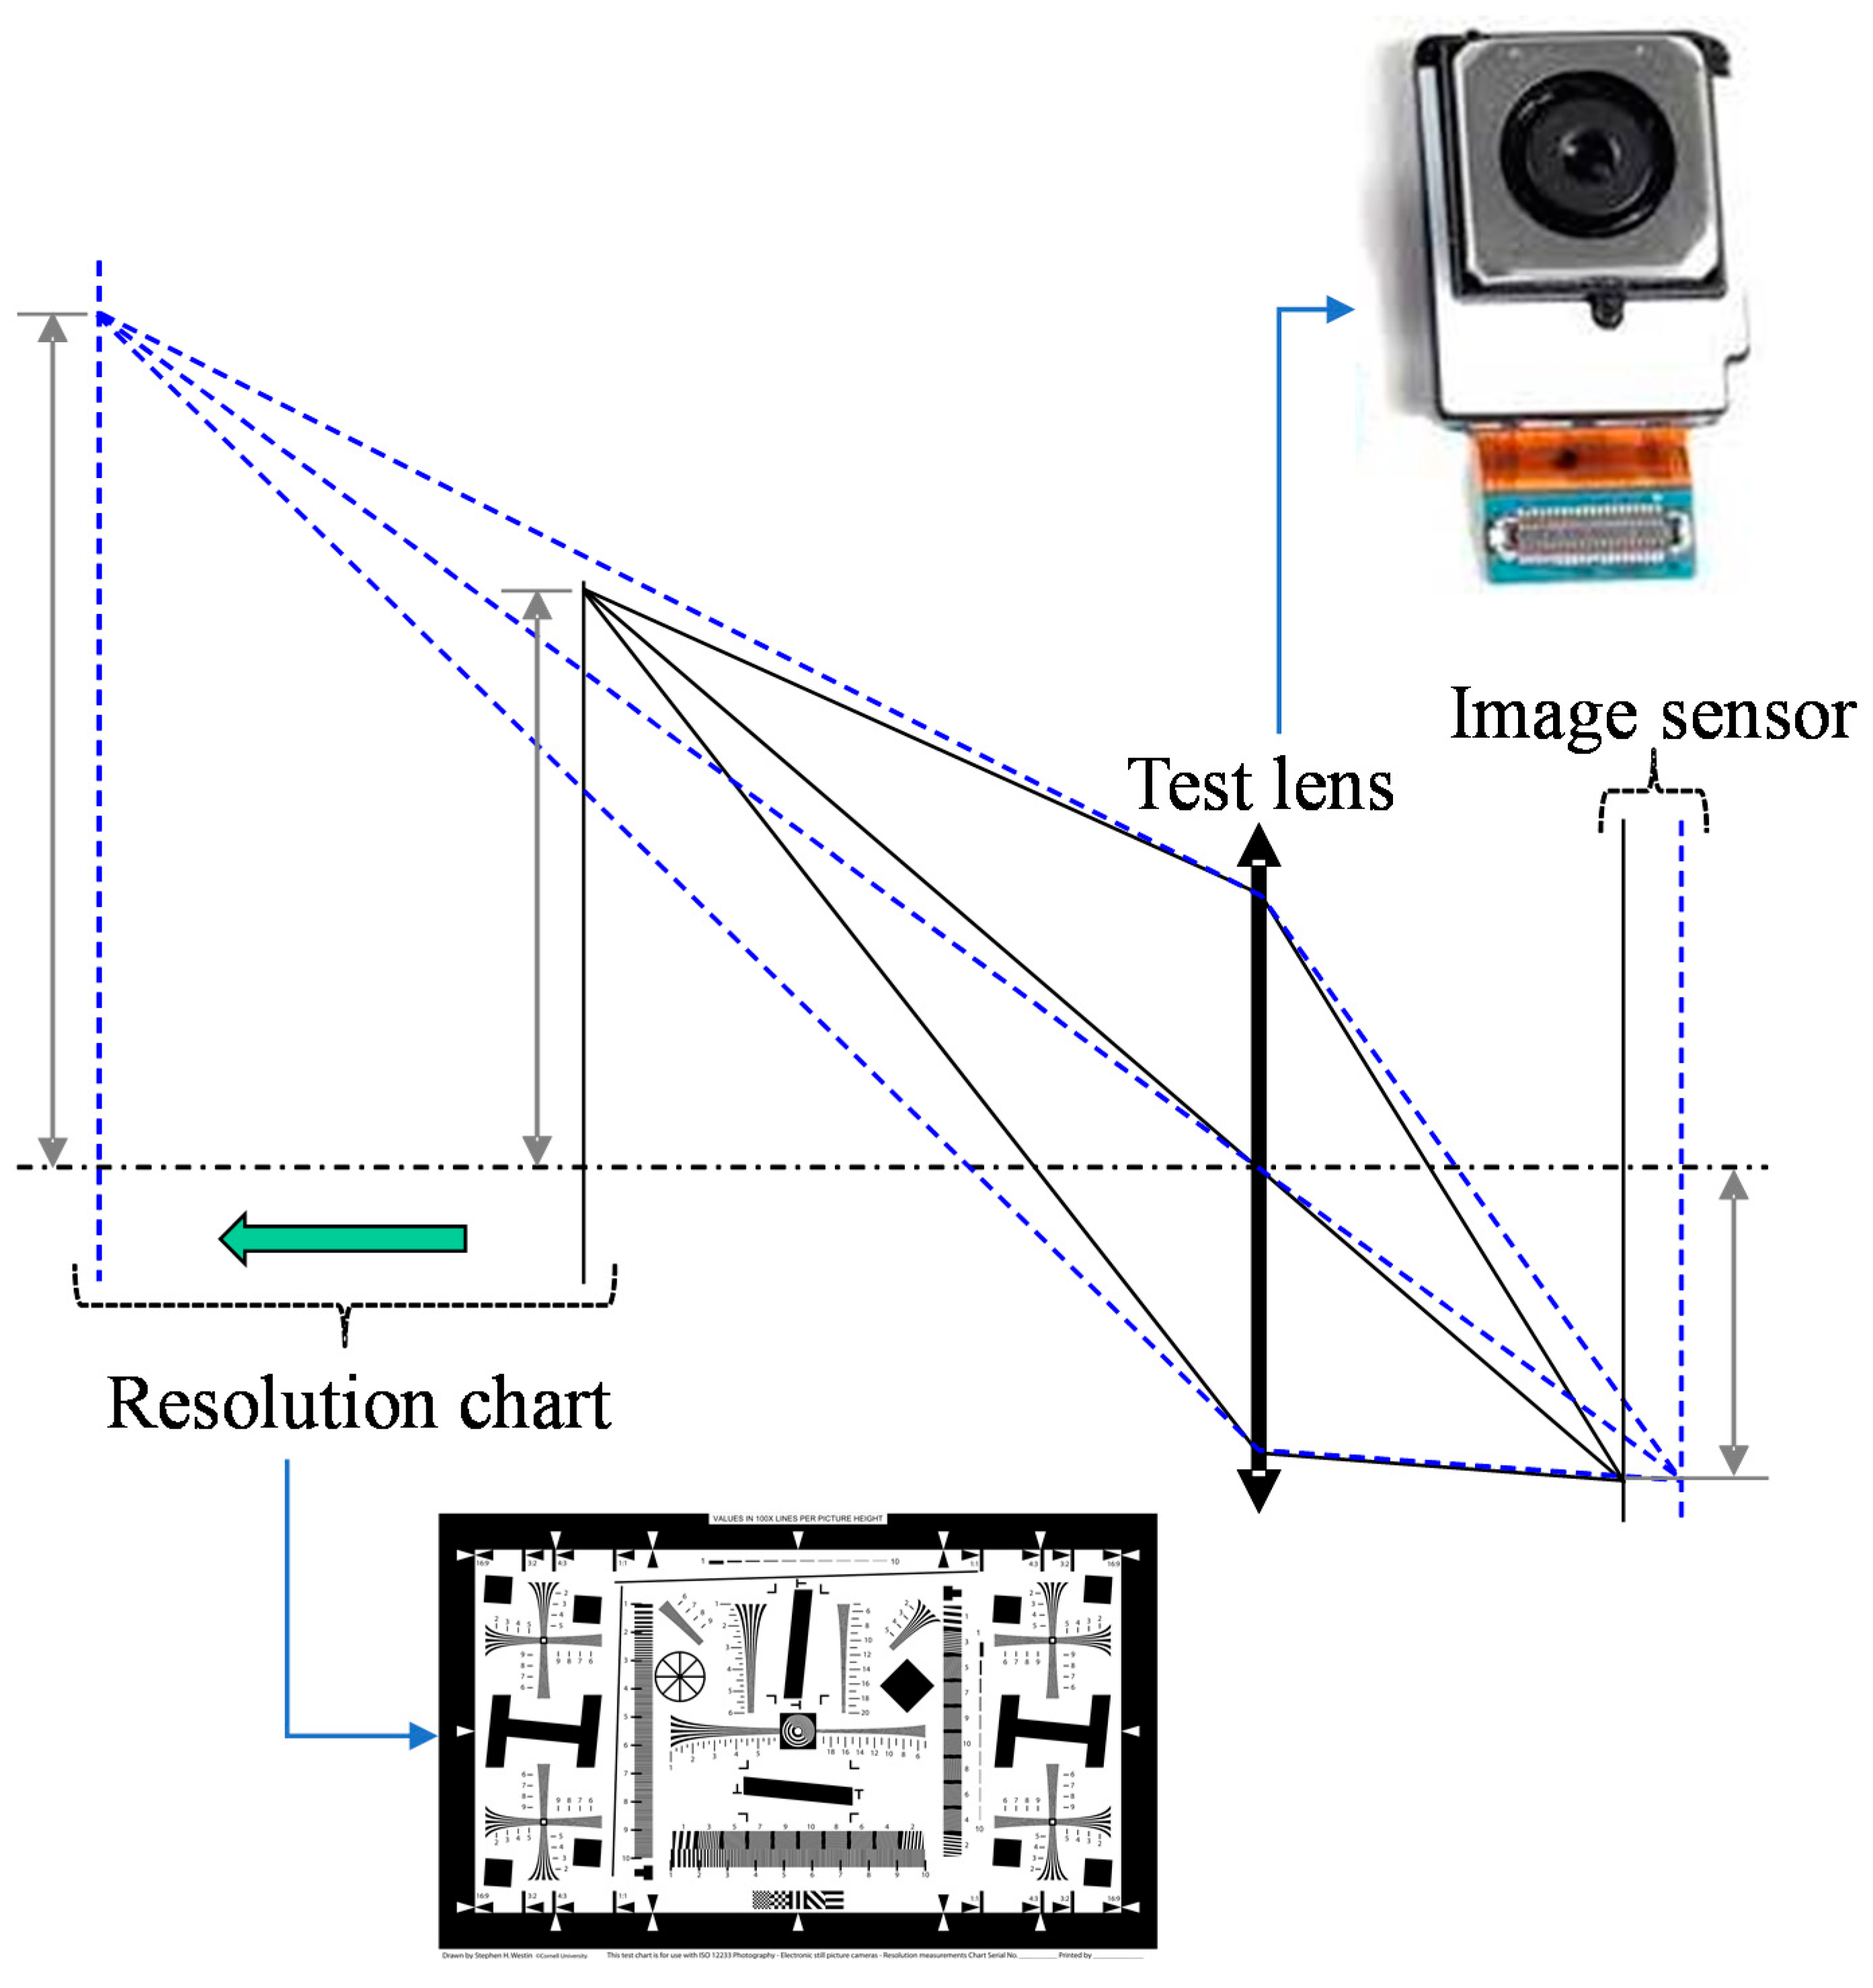
One of the common methods of checking a phone camera is to take a target, such as an ISO 12,233 resolution chart, using an optical system for the testing, and to check the various images inside the chart [
11]. At this time, the resolution can change according to the object distance of the tested optical system so that it can also be evaluated. To perform this process, the resolution chart should be placed on the actual object distance to be evaluated. Recently, phone cameras have been capable of auto-focusing. Thus, the resolution chart should be moved during the resolution measurement. In this case, the size of the resolution chart must be varied according to its location.
Figure 1 shows the inspection principle of mobile phone camera optics.
Figure 1 shows that the change in the size of the resolution chart can be easily recognized when the object distance changes. However, the size of the resolution chart printed on a specific size cannot be changed according to the object distance. In addition, the space for measuring the resolution of the test lens increases as the inspection distance and resolution chart size increase. Therefore, another method must be employed to solve this technical problem.
To reduce this inspection space for mobile phone camera optics, we also need to reduce the inspection distance. For this technical issue, the optical system must be placed between the test lens and resolution chart. This optical system should be constructed so that the resolution chart is enlarged to the desired inspection distance of the test lens. Hence, we need to use a converter or collimator. A converter is an optical system that converts the field angle of the optical system, such as the camera lens [
12,
13]. Meanwhile, a collimator is an optical system that creates a collimated beam of light to diverge from an object at a finite distance [
14,
15]. In the present study, a small resolution chart located at a finite distance must create a virtual image that is greatly enlarged over a long distance so that the features of the converter and collimator are well utilized. In this study, the optical system needed to measure the test lens is called a collimator. A collimator that reduces the inspection space of mobile phone camera optics has recently been studied [
16,
17].
The collimator is an optical system that converts the beam emitted from the original point source into a collimated beam. As the distance from the collimator to the point source gets closer, the beam passing through the collimator becomes a diverged beam. At this time, the point where the extension line of the diverged beam meets the optical axis is the virtual image. Here, if the test lens is placed in front of the collimator (opposite the point source), the test lens can see the virtual image. Therefore, from the point of view of a test lens, it becomes a virtual object. Therefore, in the present work, we propose a new design method for a collimator that can measure resolution at various distances of the resolution chart. The virtual-image position of the resolution chart must be varied so that the test lens can be inspected at various distances. To implement this function, the virtual-image position must be varied by moving a specific lens inside the collimator. Therefore, a collimator with a focus-adjustable capability must be used.
Section 2 describes the design process of our proposed focus-adjustable collimator system and illustrates the result of the paraxial power arrangement of the system.
Section 3 presents the layout of an aberration-balanced collimator system at infinite and close positions to verify the capability of the proposed system. In addition, the modulation transfer-function curve of the designed collimator system is shown to verify the desirable optical system performance in inspecting the general phone cameras because the modulation transfer function (MTF) must be evaluated to commercialize the optical system in the industry.
Section 4 presents the conclusion of this study.
2. Materials and Methods
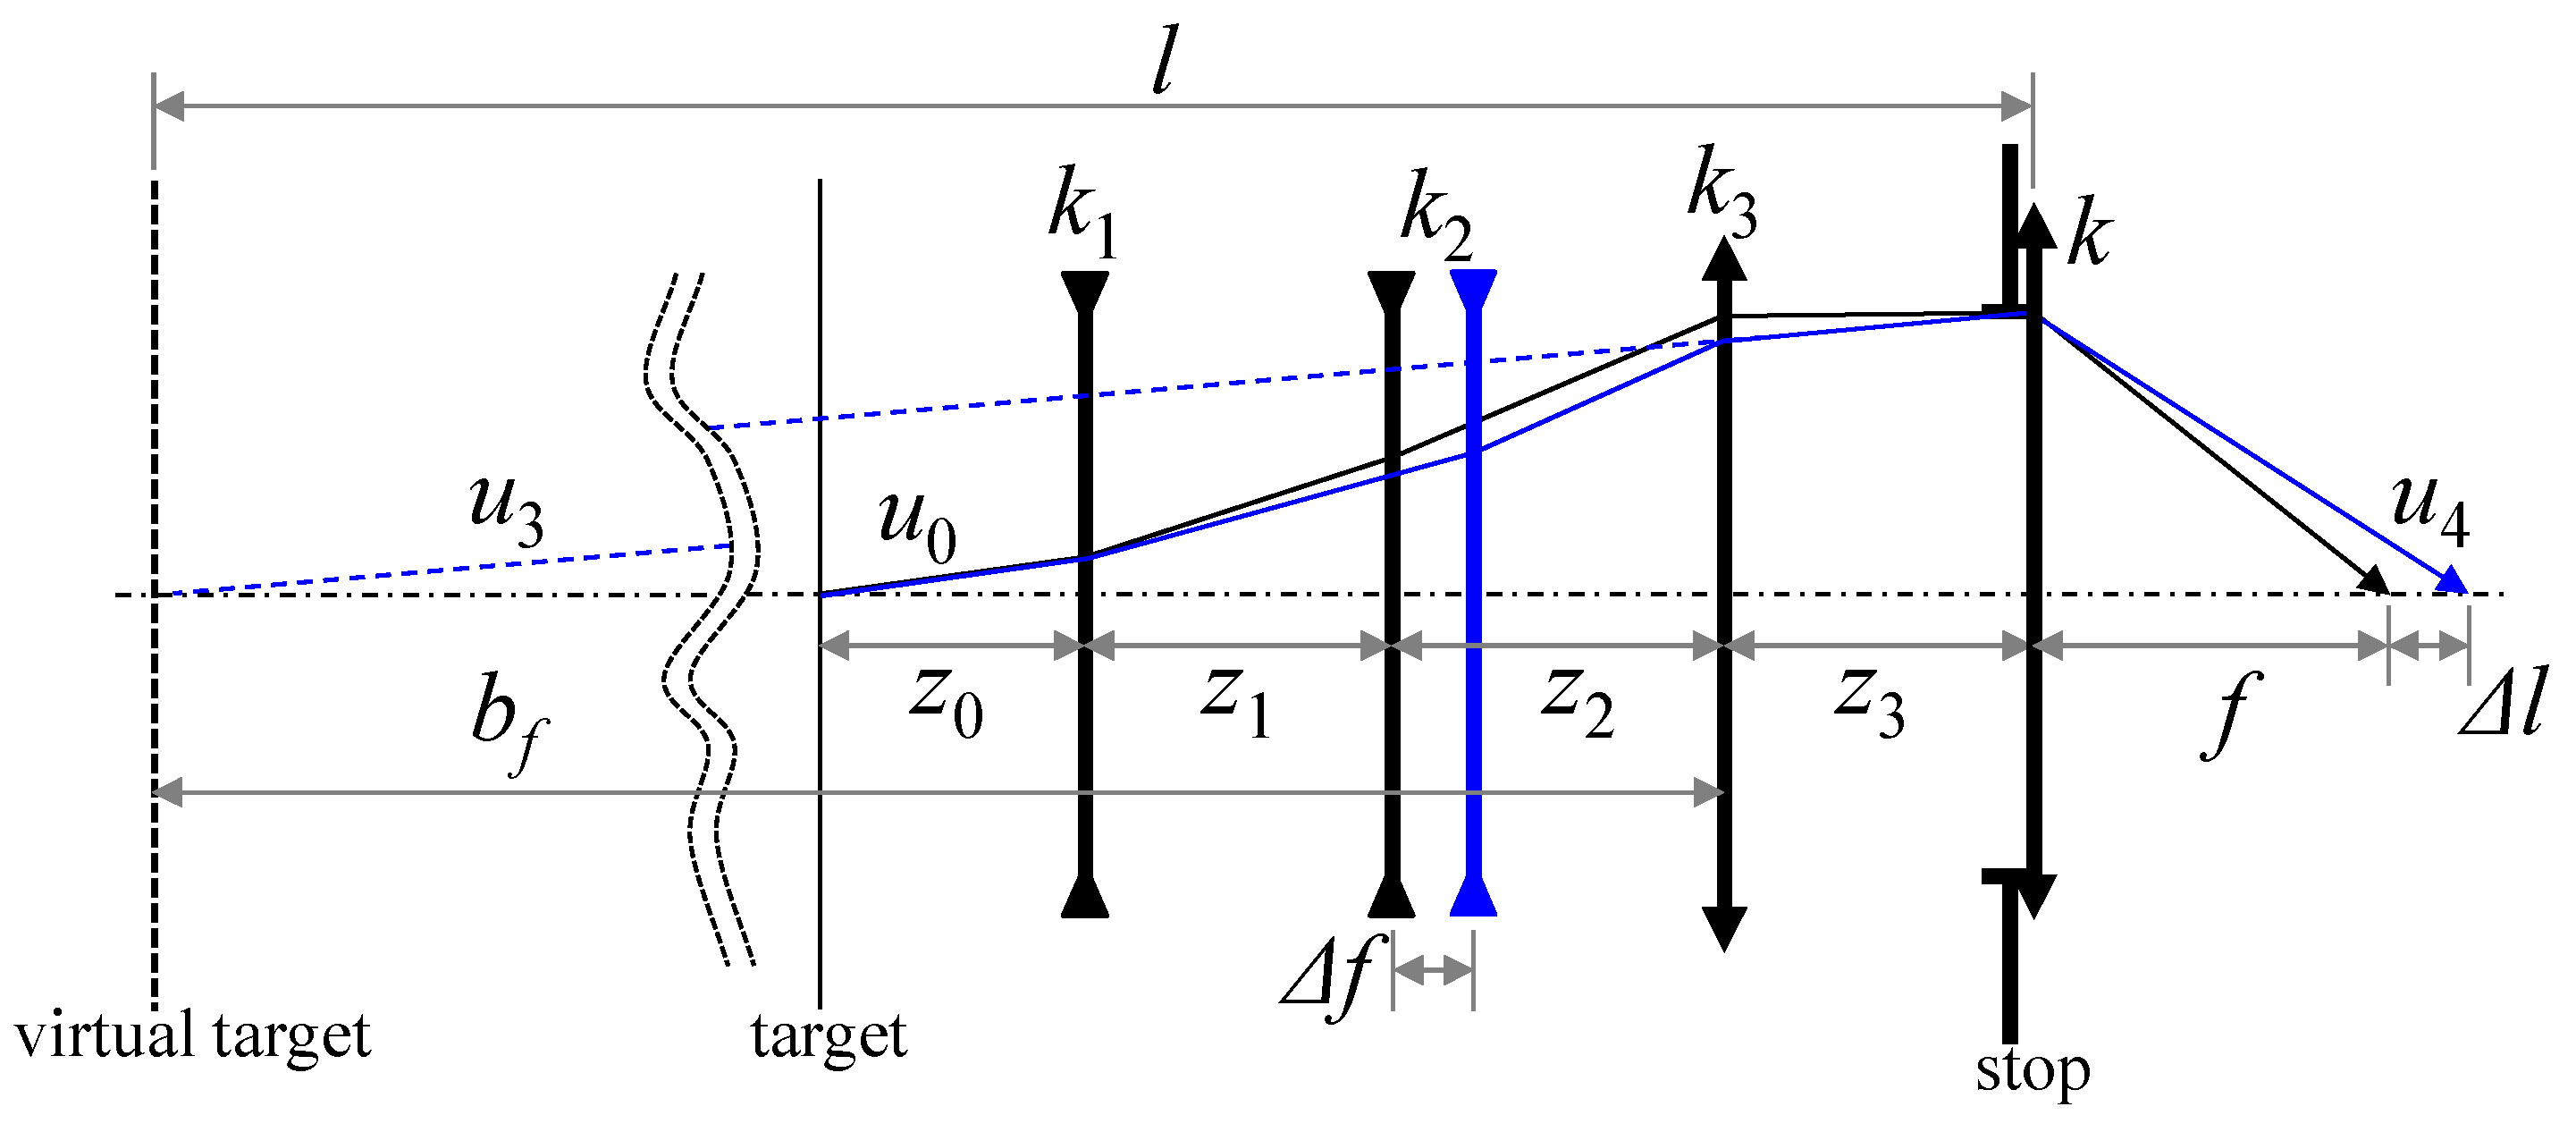
Figure 2 shows a layout of the paraxial optical path of our proposed focus-adjustable collimator. Here, k is the refracting power of each lens group, which is reciprocal to the focal length of each lens group [
18,
19]. z is the distance between the lens groups, and u is the angle of the axial ray [
20]. The subscripts of these variables indicate the number of lens group, and “0” (zero) indicates the object plane.
k1–
k3 indicate the refracting power of the lens group that constitutes the collimator system, and k is the refracting power of the optical system to be tested.
The axial ray from the target passes through the collimator and enters the test lens as a collimated beam. At this time, when some lens groups in the collimator system are moved, a diverged beam (not a collimated beam) is incident to the test lens. Therefore, the point where the axial ray incident to the test lens meets the optical axis becomes the object viewed by the test lens.
In
Figure 2,
l denotes the object distance from the virtual target to the test lens. Here, when some lens groups of the collimator system are moved, the object distance can be varied from infinity to object distance l. However, the target position is fixed, although the target size does not change. Δ
f in
Figure 2 denotes the amount of movement of the lens group that moves in the collimator system, and Δ
l denotes the amount of change in the image plane of the test lens.
In
Figure 2,
k represents the refracting power of each lens group. Thus, it is a value provided by the optical design of the collimator system. In addition,
l can be considered as the minimum inspection distance. When
k and
l are given, Δ
l represents the value that can be calculated from the imaging equation [
21].
Before the lens group moves in the collimator optical system, the collimated beam is incident to the test lens, and the magnification of the collimator optical system becomes infinite. If the magnification is calculated using the Gaussian bracket at the refracting power and interval of each lens group, the result is expressed in Equation (1) [
22,
23]. In Equation (1),
minf denotes the magnification when the collimated beam is incident to the test lens, and this value is infinite. z and k are the same as the values shown in
Figure 2.
In addition, the refractive power KCL of the collimator system can be expressed by Equation (2), using the Gaussian bracket.
Figure 2 shows that the first, second, and third lens groups are fixed. Therefore, the collimator system can be conveniently used. On the other hand, when the second lens group moves by Δ
f, the magnification is calculated in the same manner as that in Equation (1); thus, it is expressed by Equation (3).
Here,
mCL may be expressed as angle
u0 of an axial ray starting from the target and angle
u3 of an axial ray incident to the test lens when the second lens group moves. In addition, the virtual target created by the collimator system is imaged again by the test lens into an image sensor, and the magnification of the test lens is calculated from the imaging equation. The result is calculated using Equation (4).
Finally, the magnification of the optical system, including the collimator optical system and the entire test lens, is denoted as
mT, which is calculated using Equation (5).
Here, as shown in
Figure 2, because
u0 and
u4 do not significantly change according to the movement of the second lens group,
mT also hardly changes. Therefore, Equation (6) can be obtained by substituting Equations (4) and (5) into Equation (3) and rearranging them.
Therefore, the refracting power of each lens group can be obtained by solving Equations (1), (2), and (6) in series. Here, we have explained that f is the focal length of the test lens, which is determined as the reciprocal of k in
Figure 2. Δ
l is also a determined value. In addition, if the motion distance Δ
f of the second lens group and the value between each lens group are properly determined, only unknown variables
k1,
k2, and
k3 remain.
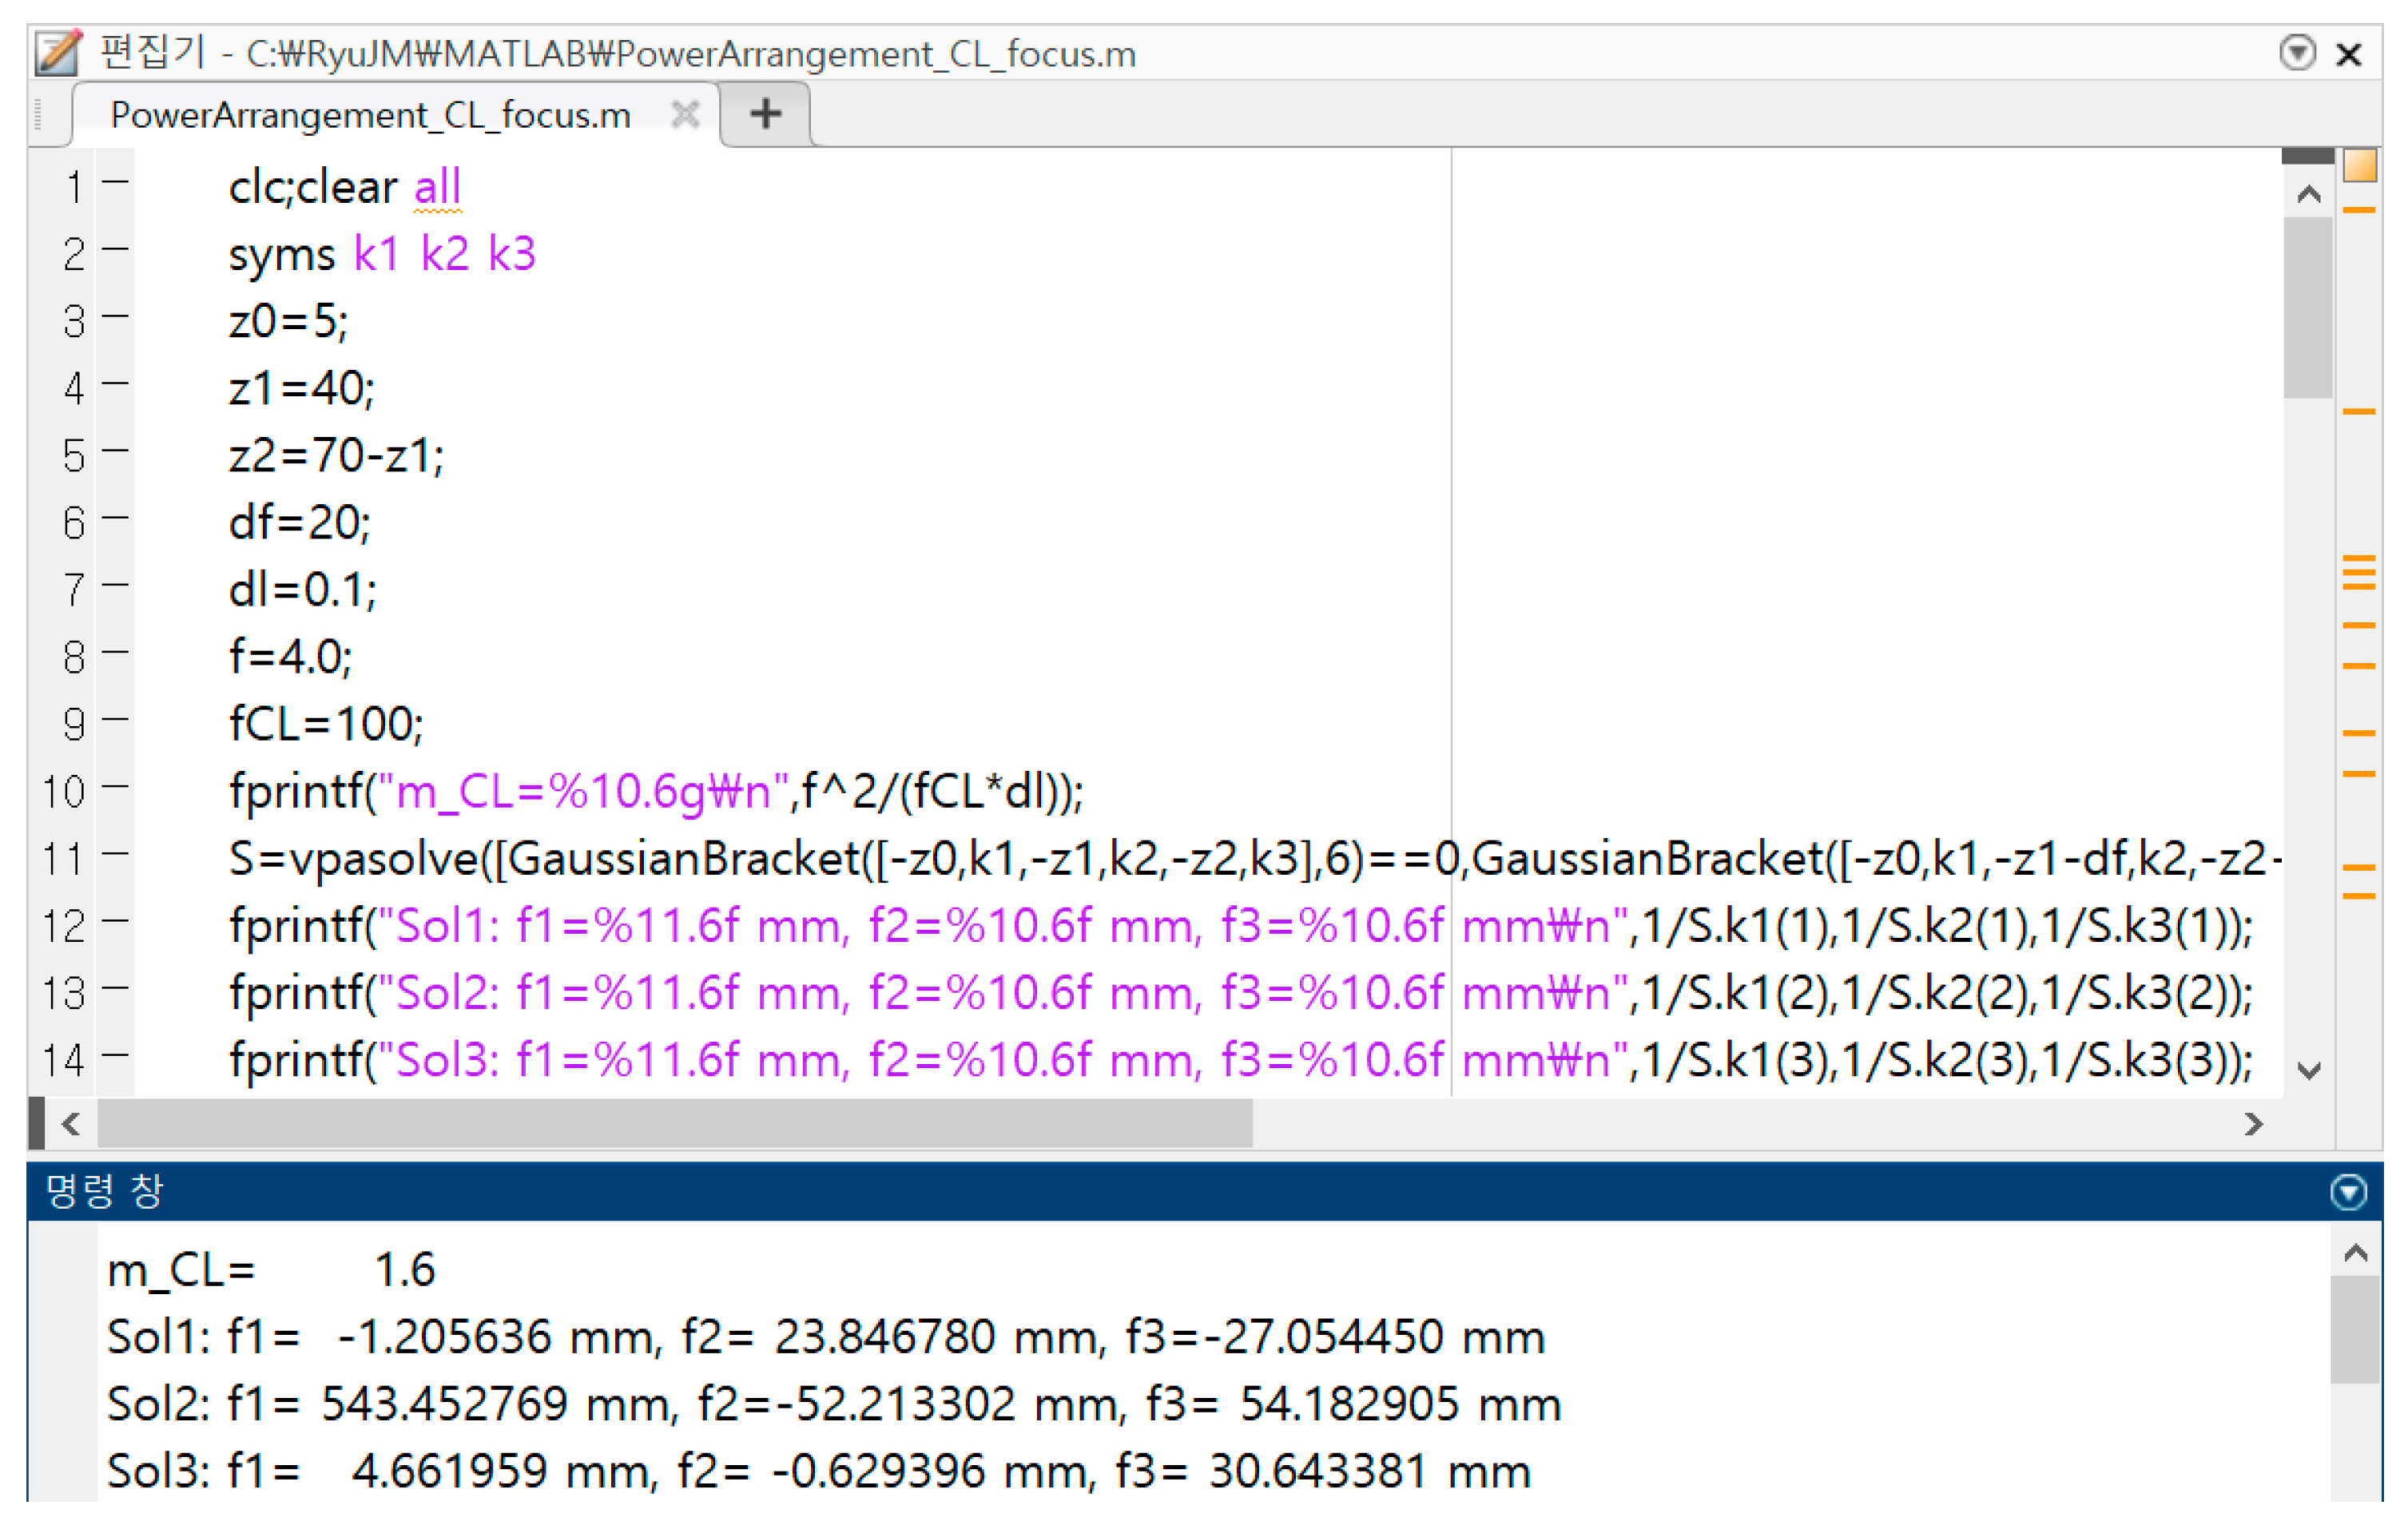
Distance z0 from the target to group 1 is 5 mm. Distance z1 from the first to the second lens group is 40 mm. Distance z2 from the second to the third lens group is 30 mm. Motion distance Δf of the second lens group is 20 mm. Focal length f of the test lens is 4 mm. If the total focal length fCL of the collimator optical system is set to 100 mm, Δl becomes 0.1 mm. We substitute this value into Equations (1), (2), and (6). Thereafter, f1(=1/k1), f2(=1/k2), and f3(=1/k3) can be obtained using the MATLAB programming codes.
In
Figure 3,
f1,
f2, and
f3 represent the focal lengths and the reciprocal of the refracting power of each lens group.
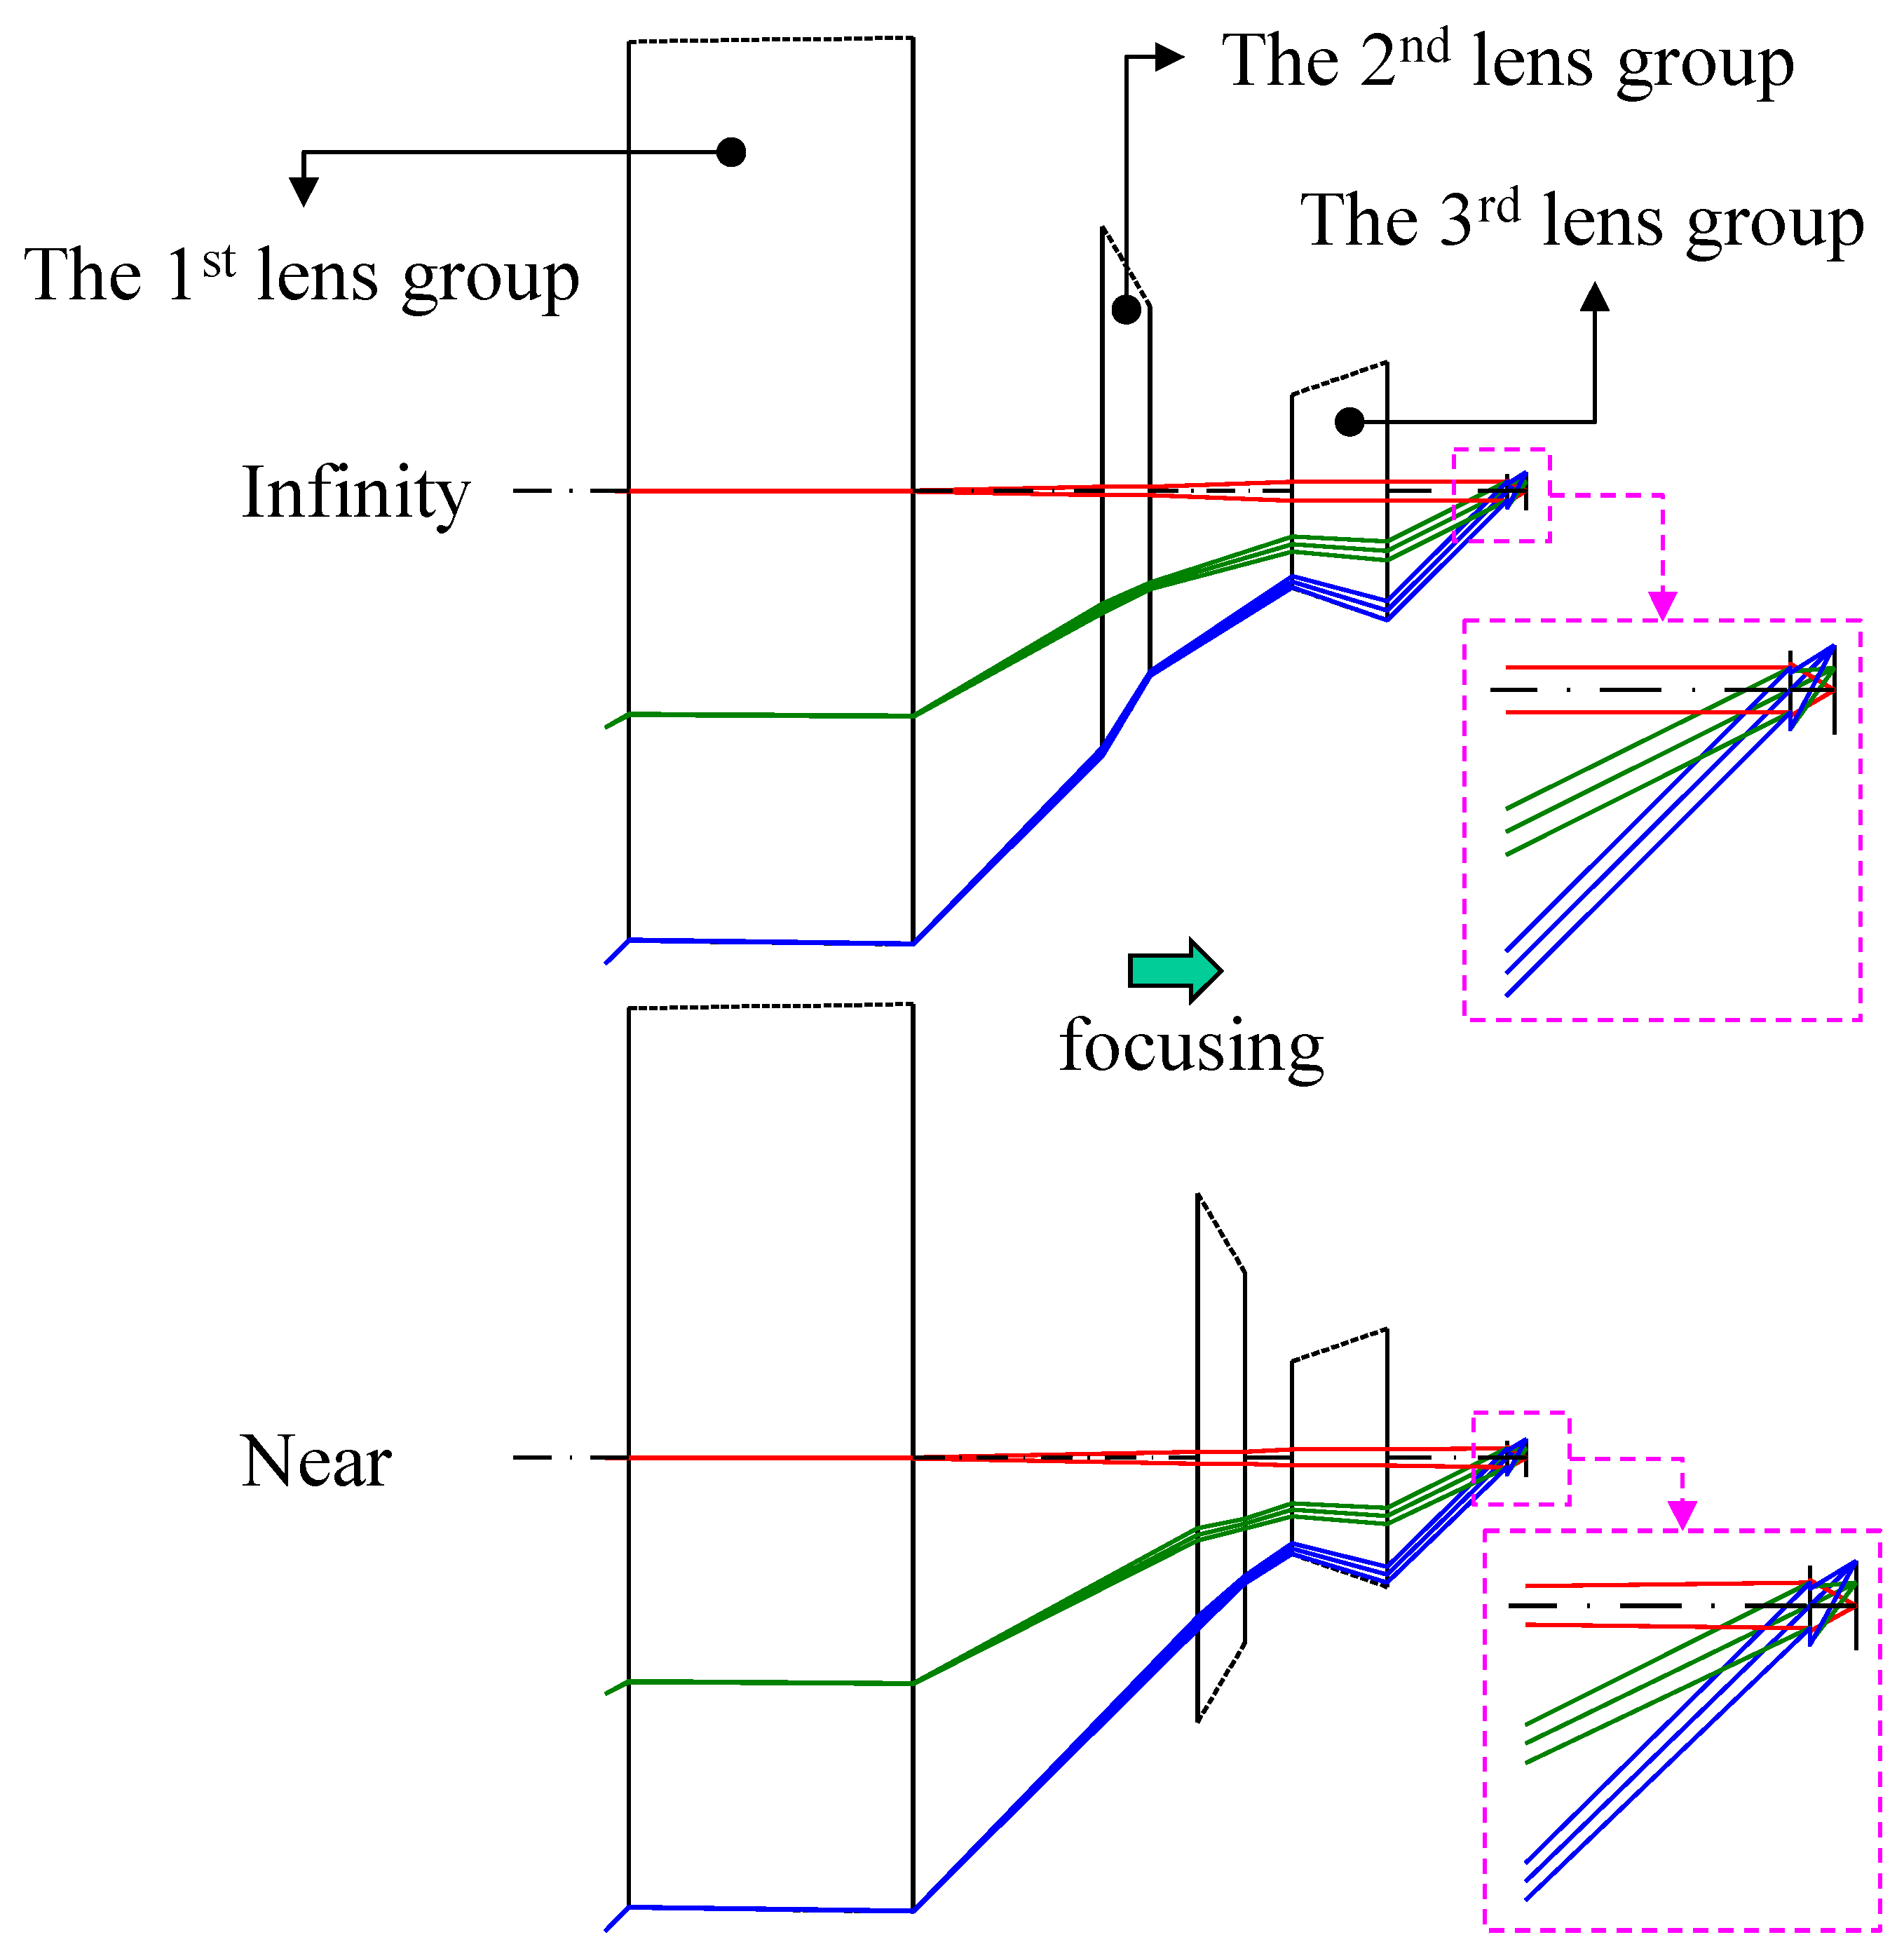
Figure 3 shows that three solutions can be obtained. In the first solution, the focal length of the first lens group is very short, and in the third solution, the focal length of the second lens group is very short. Thus, the optically meaningful solution becomes the second solution. The focal length of each lens group can be determined from the obtained solution. Assuming that these lens groups have no aberration, the paraxial layout is shown in
Figure 4.
3. Results and Discussion
When the refractive power arrangement is completed, as shown in
Figure 4, the actual lens must be installed to the employed optical system. In this case, the module lens method is utilized [
24], which is the method used to determine the curvature and thickness of a lens that minimizes the third-order aberration of each group, using approximately two to three lenses in each group. In this manner, for an optical system where the actual lens is applied, an optimization process must be performed using the optical design software to maximize the overall resolution performance. In addition, an equivalent-lens conversion method is used when a lens is added to further correct the aberrations [
25,
26].
The result of the optical system designed in our proposed method is shown in
Figure 5.
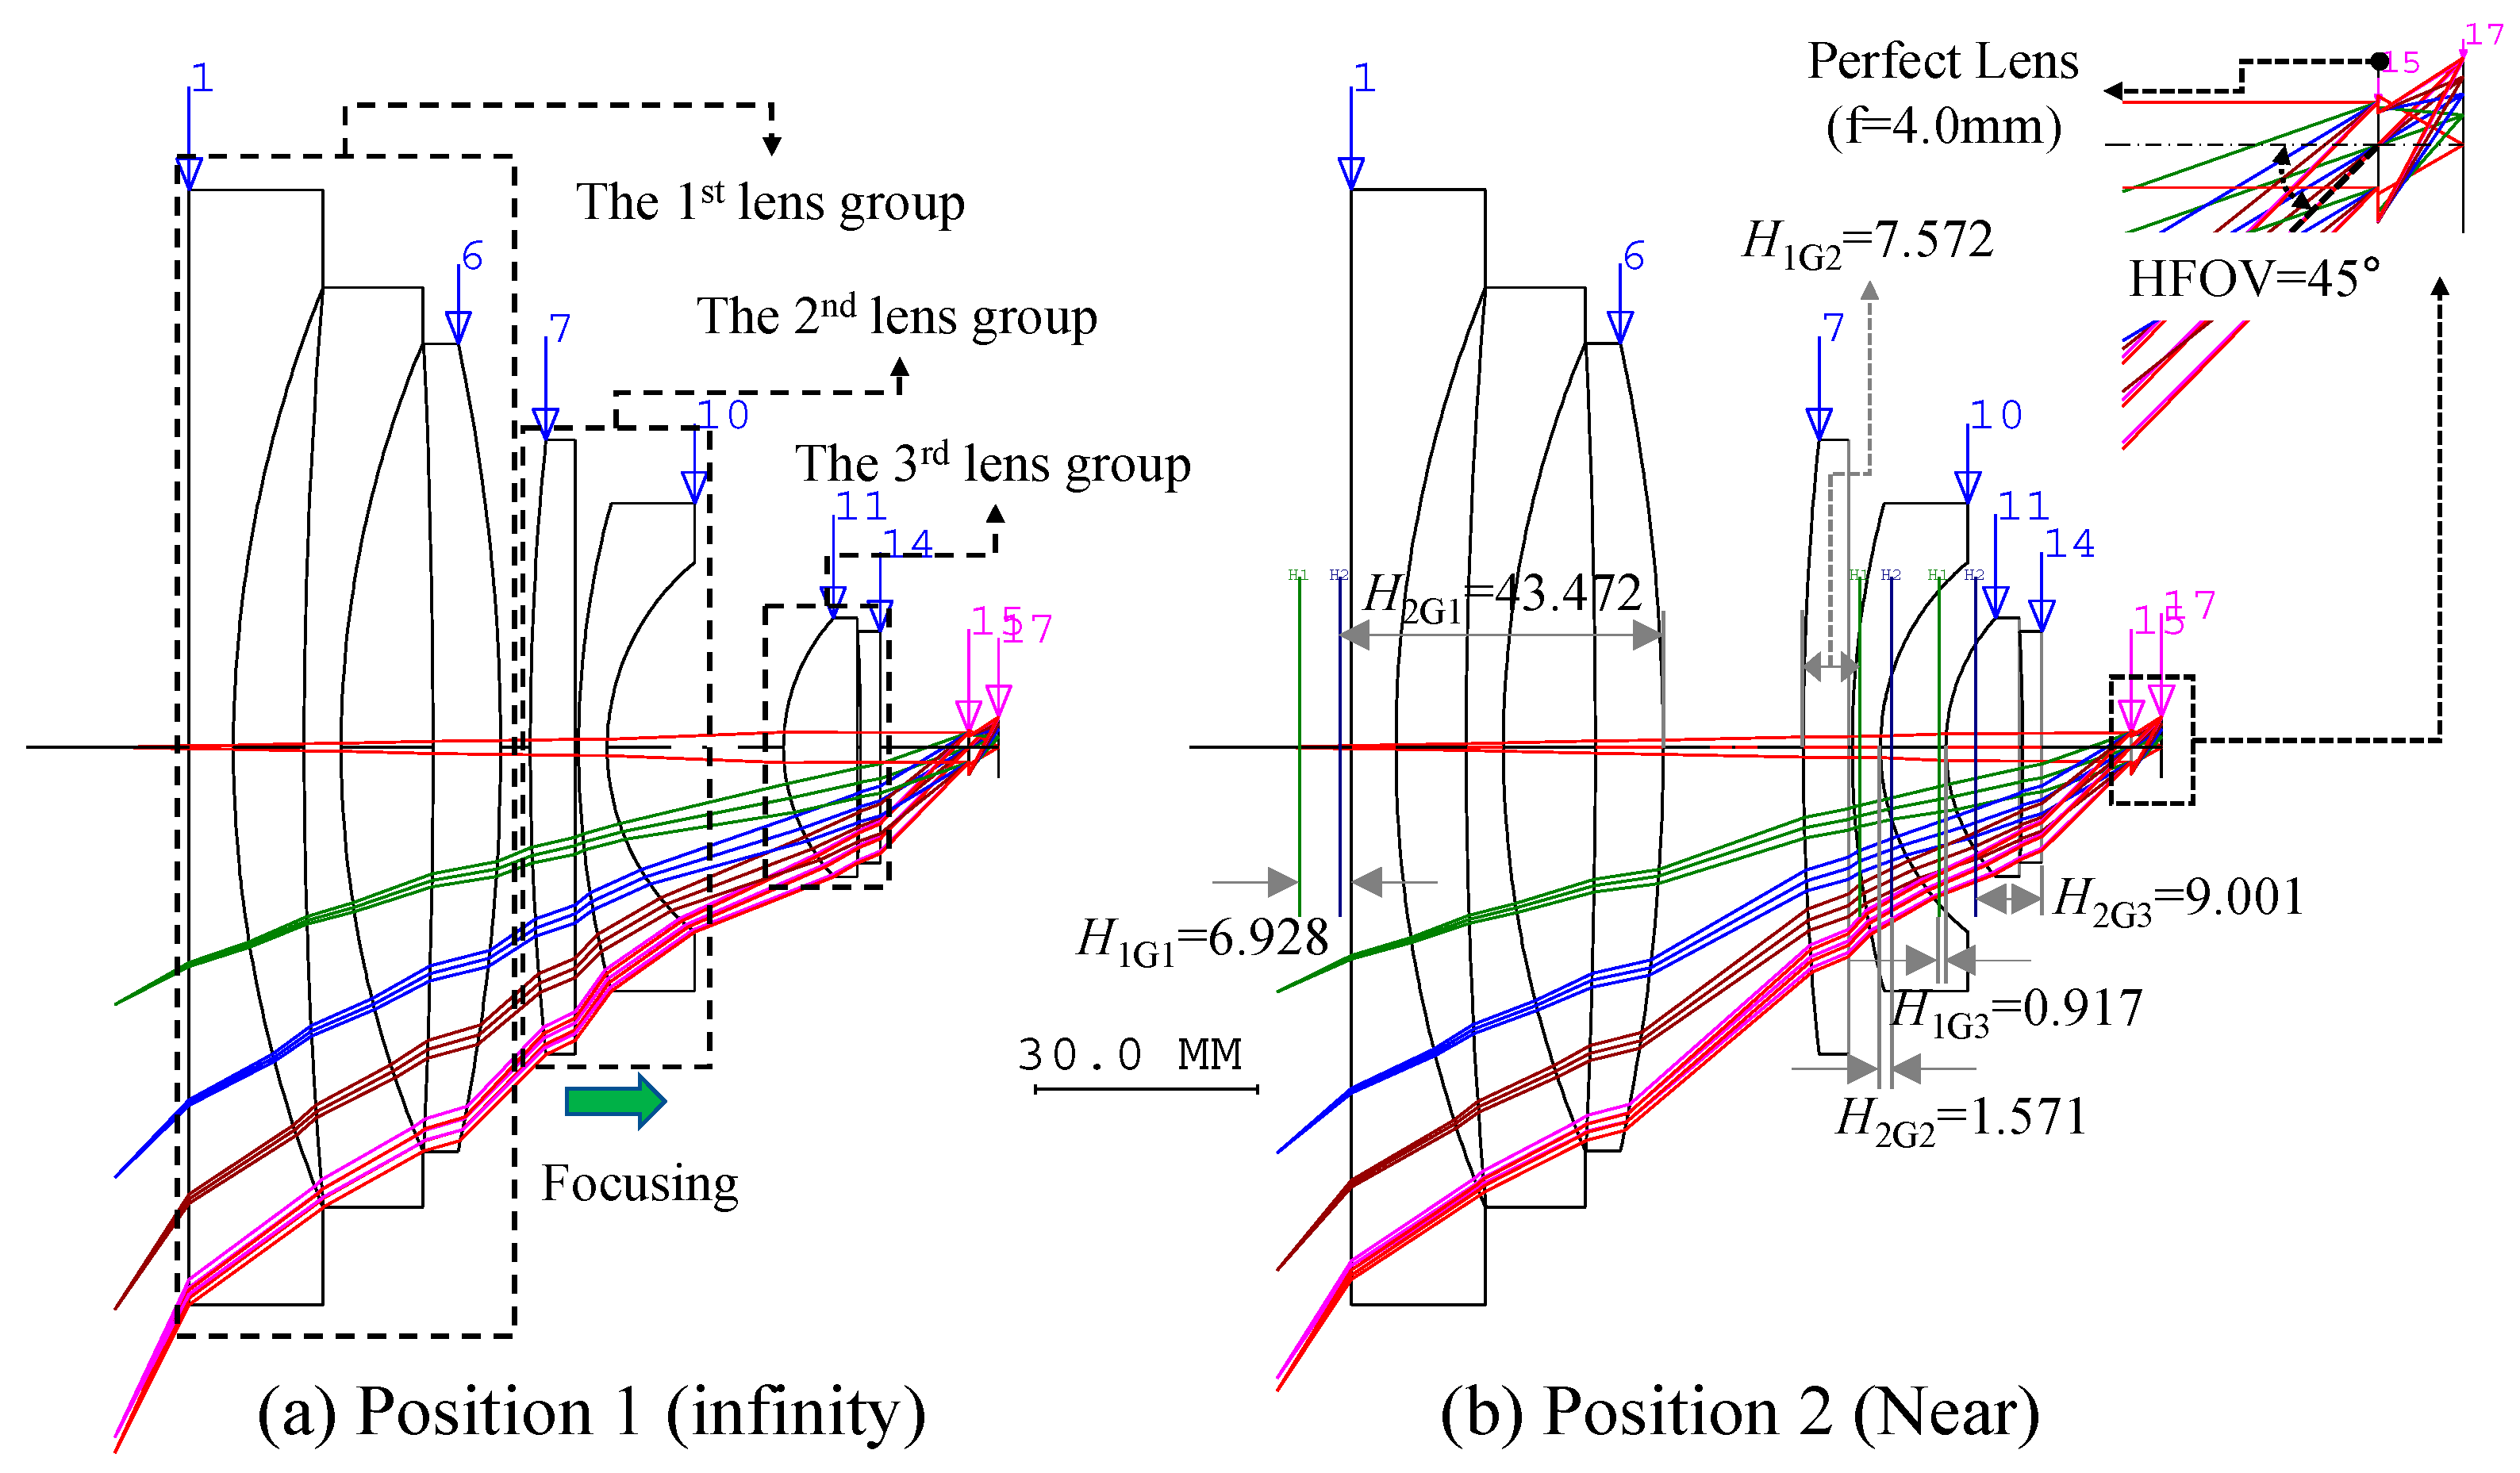
Figure 5a shows the optical layout of our designed collimator system for testing the resolution performance of a test lens at infinity.
Figure 5b shows the optical layout for testing the test lens at an object distance of approximately 160 mm.
Figure 5 shows that the first lens group consists of three lenses. In addition, two lenses are used in the second and third lens group. In the optical system, shown in
Figure 5, the focal length of the first lens group is approximately −289.435 mm, that of the second lens group is approximately −61.931 mm, and that of the third lens group is 51.260 mm. In addition, the amount of movement of the second lens group is approximately 17.617 mm. In
Figure 5b,
H1G1 represents the distance from the first surface of the first lens group to the first principal plane of the first lens group, and
H2G1 represents the distance from the second principal plane of the first lens group to the last surface of the first lens group. Similarly,
H1G2 and
H2G2 denote the distances from the first surface of the second lens group to the first principal plane of the first lens group and that from the second principal plane of the second lens group to the last surface of the first lens group, respectively. Similarly,
H1G3 and
H2G3 denote the distances from the first surface of the third lens group to the first principal plane of the first lens group and that from the second principal plane of the second lens group to the last surface of the first lens group, respectively. The principal plane of each lens group is shown in
Figure 5b.
To commercialize our designed collimator system for mobile camera phone optics, we need to obtain a relational expression for the displacement of the second lens group and the defocus of the test lens. When the test lens is installed behind the designed collimator, the equation for the height of the axial ray is expressed in Gaussian brackets, as in Equation (7) [
27,
28].
In Equation (7), Δf represents the motion amount of the second lens group, and Δl denotes the defocus of the test lens. In addition, when the crane design is completed, the refracting power and spacing of each lens group are determined. z3, which has not been previously mentioned, denotes the distance between the last group of the collimator and the test lens.
The magnification,
mT, calculated using Equation (5), can be expressed as Equation (8) using the Gaussian bracket [
29].
Except for
z3 in Equation (8), the values of the other variables are already known. Therefore,
z3 can be obtained from Equation (8). Hence, the unknown variables in Equation (7) are Δ
f and Δ
l. In fact, in the optical system designed and shown in
Figure 5,
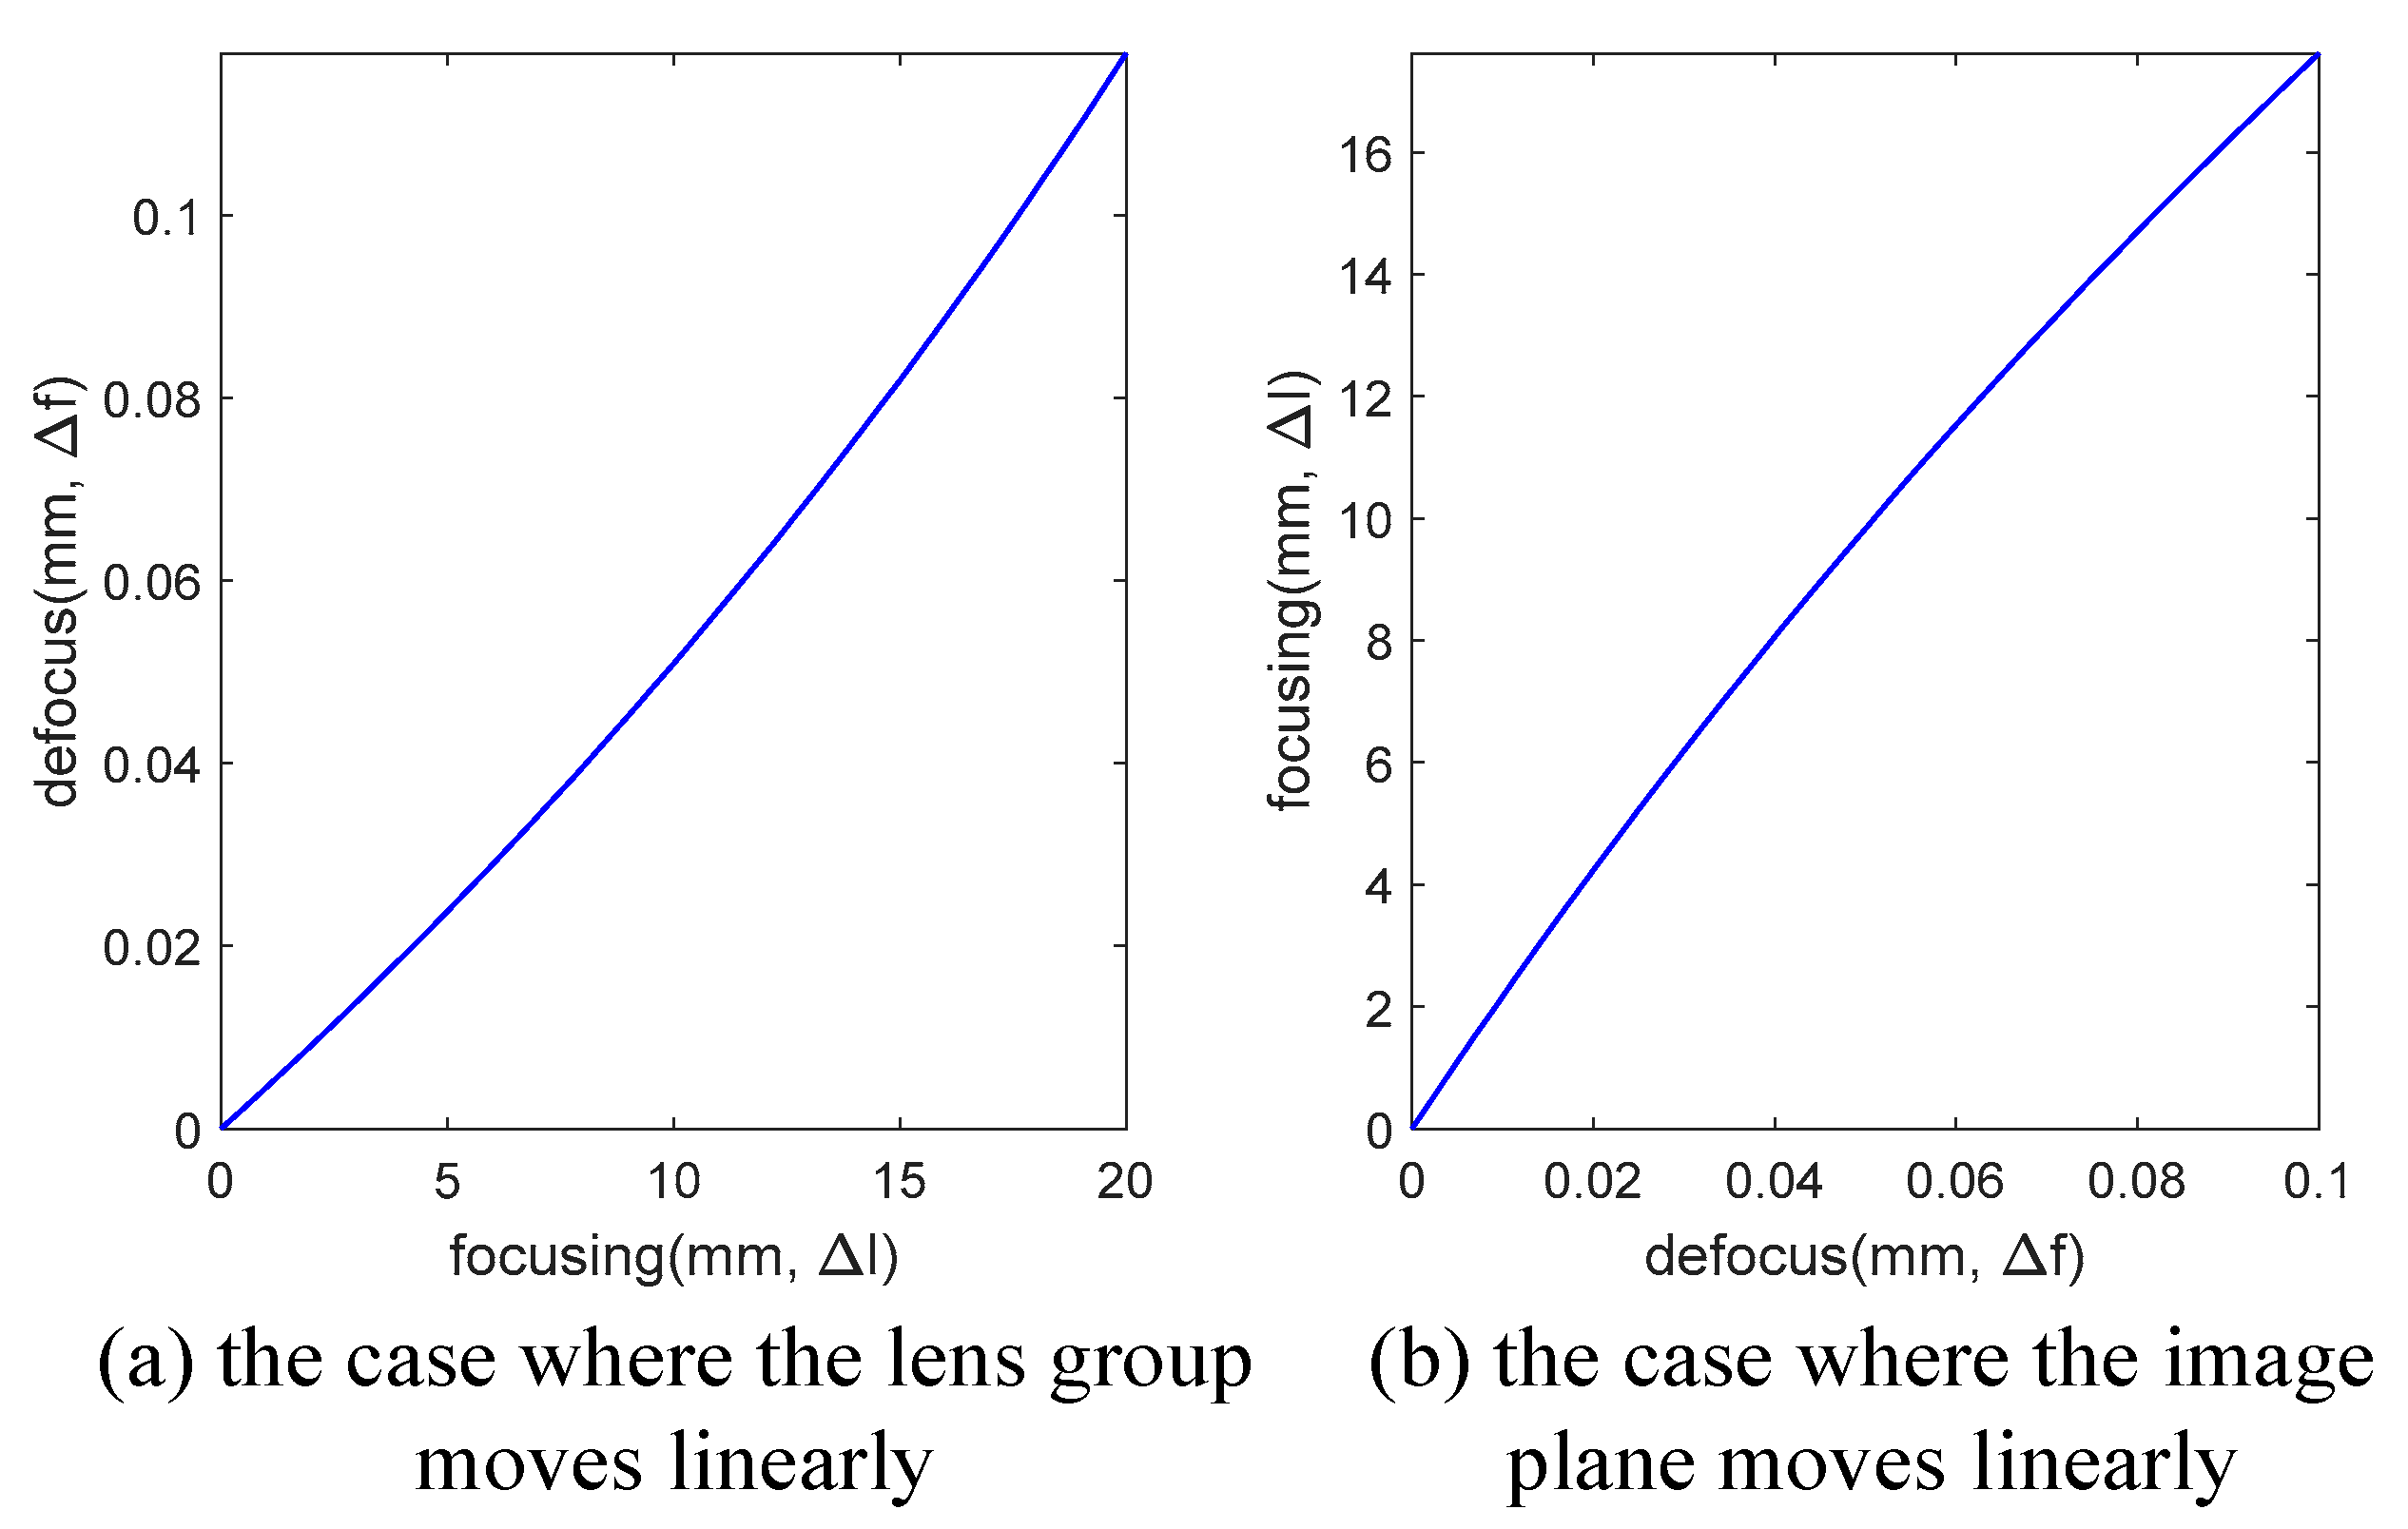
z3 is approximately 21.001 mm. The equations for both variables can be found using MATLAB codes. The values in the graph are shown in
Figure 6. In addition, the values of the locus of the final design using Equation (7) are listed in
Table 1.
Figure 6a shows the graph of the first and second columns of
Table 1.
Figure 6b shows the graph of the third and fourth columns of
Table 1.
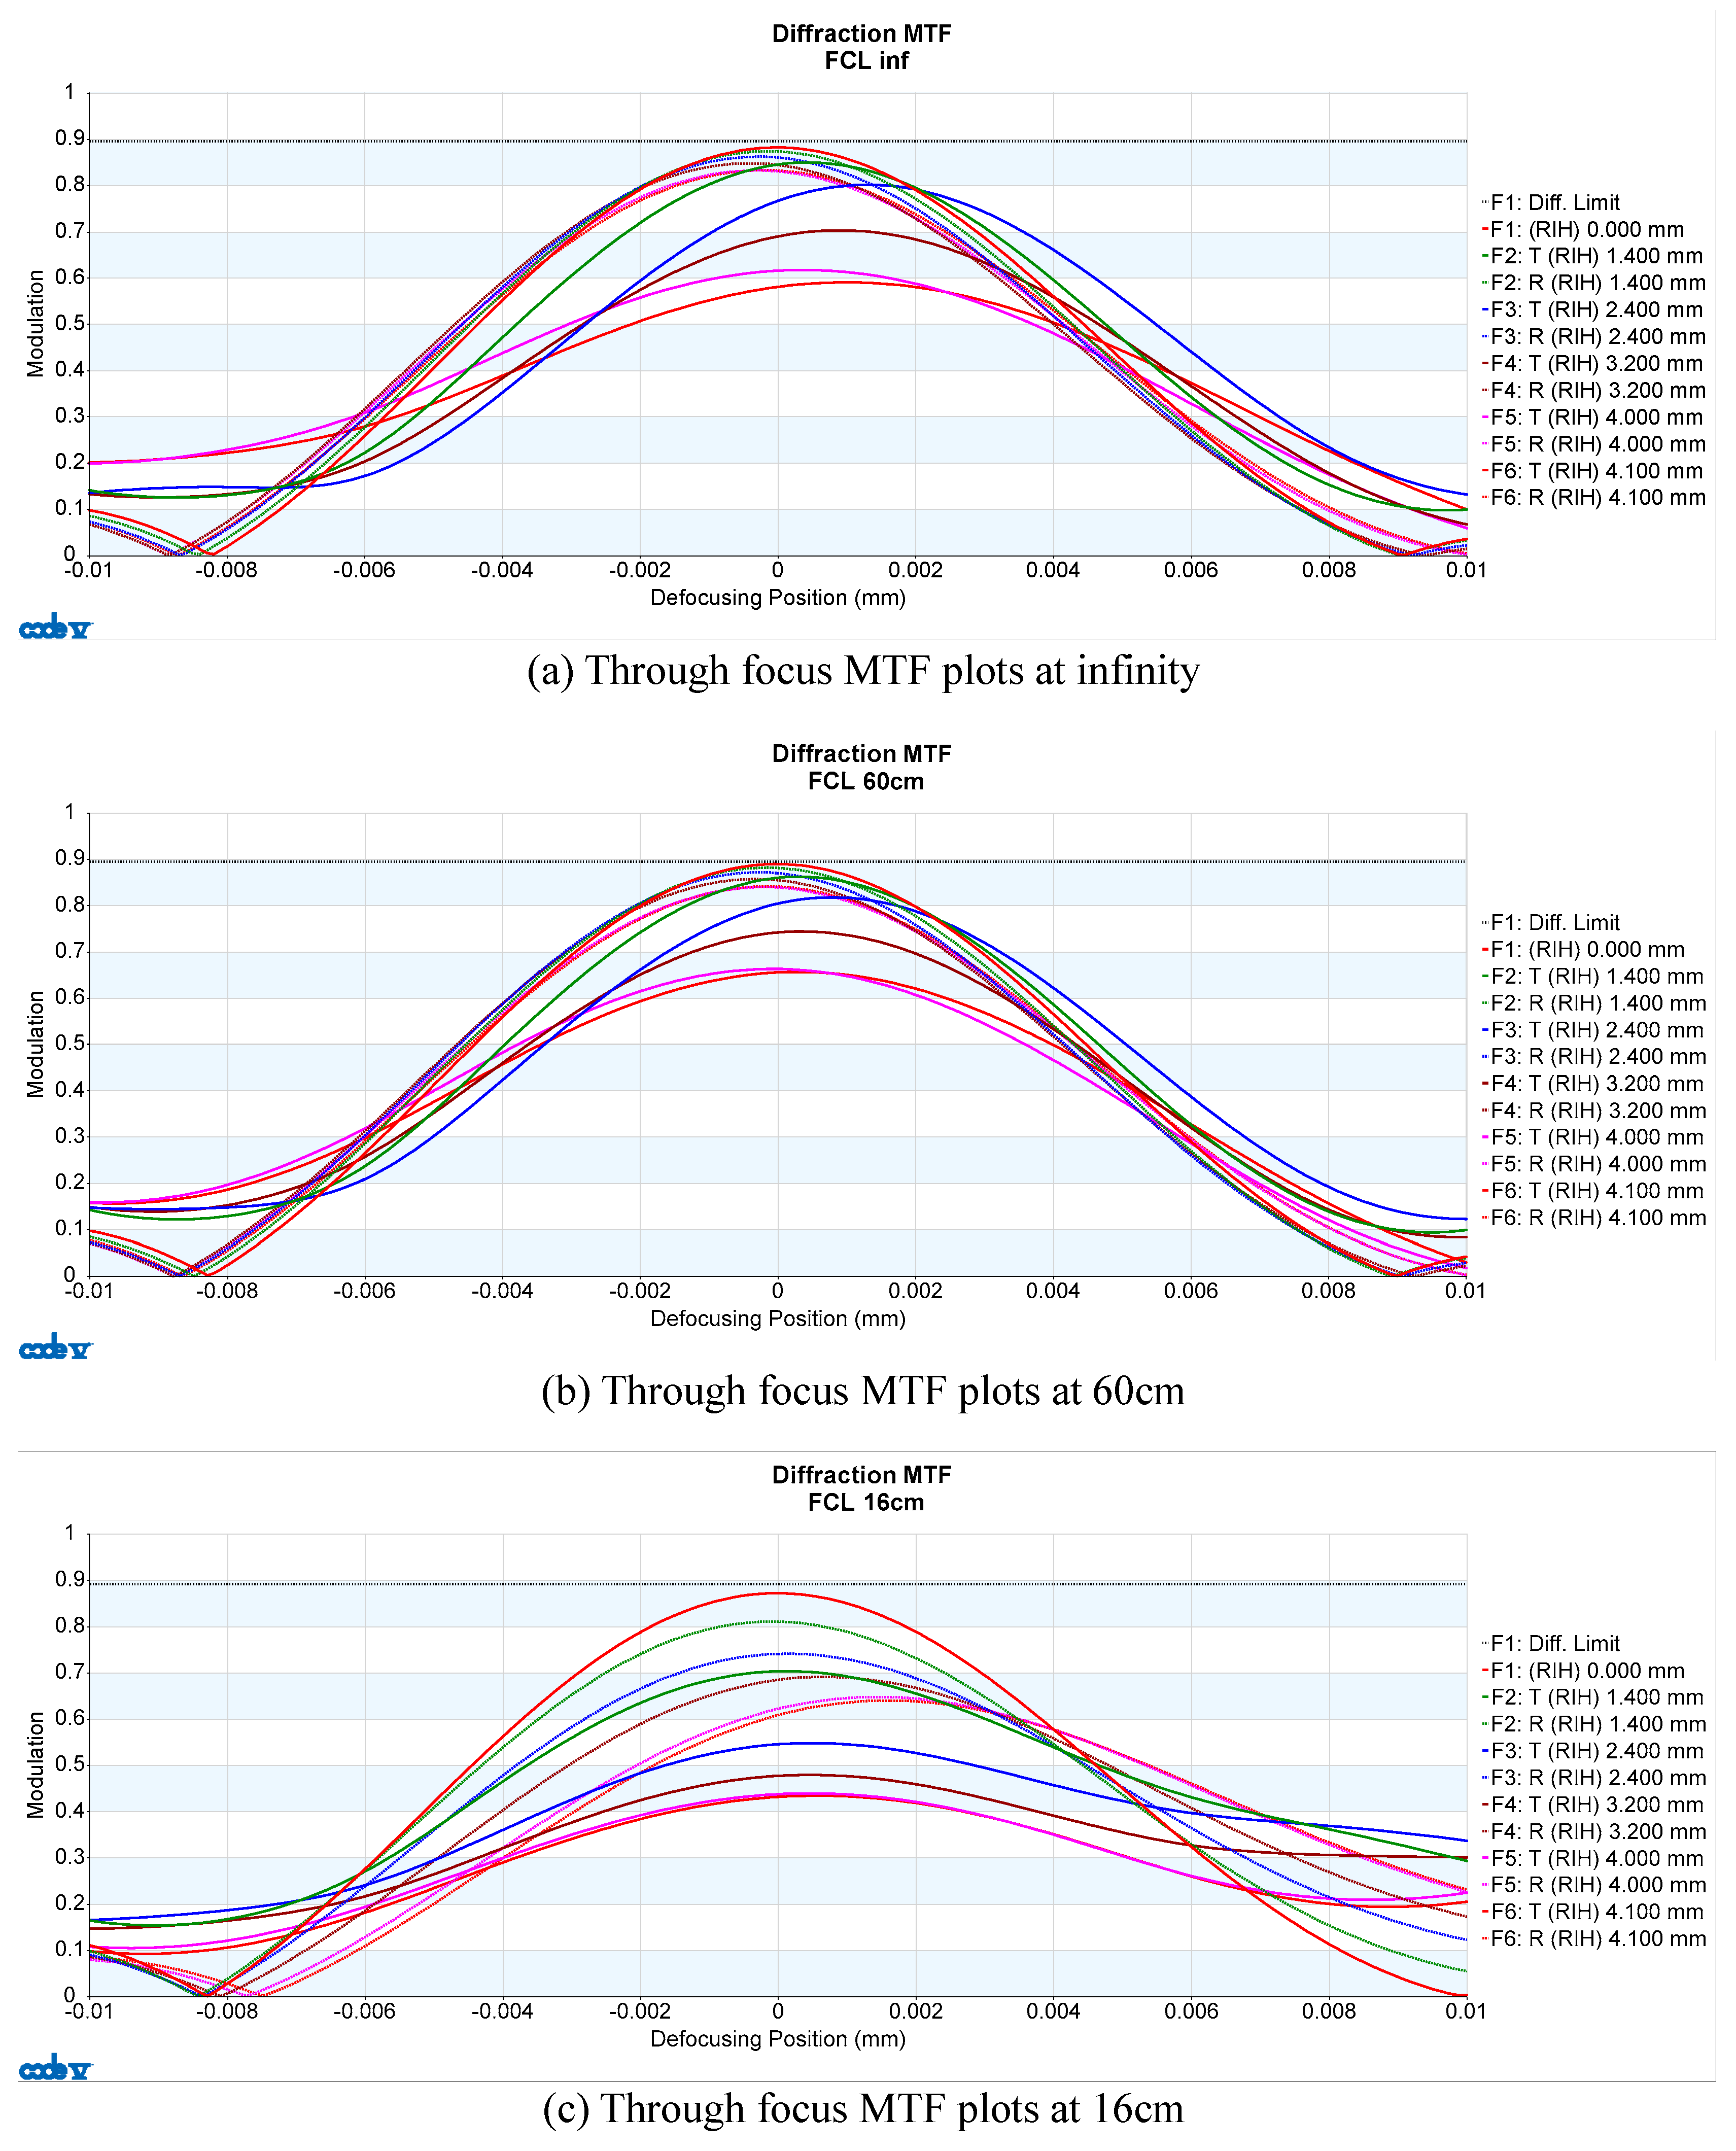
Figure 7 shows the MTF curve of the collimator designed and shown in
Figure 5. The MTF graph must be utilized to verify the optical system performance because the MTF represents the optical aberrations and resolutions of the optical systems [
30,
31,
32,
33].
Figure 7 shows that the
x-axis of each graph represents the movement of the image sensor assembled on the test lens, and this represents the defocus. The
y-axis represents the MTF values of the designed optical system. MTF is defined as the value obtained by dividing the visibility of the image plane by that of the object plane [
34,
35]. If this value is high, the resolution is sufficiently high to commercialize the optical system product in the factory [
36,
37]. In addition, the solid line represents the MTF in the tangential direction, and the dotted line represents that in the sagittal direction. If the image sensor was properly assembled, the image quality would appear very clear for commercialization. However, at an object distance of 16 cm, the resolution at the periphery is expected to be low. In fact, when the object distance from the mobile phone camera is 16 cm, the resolution is supposed to be low because of the out-of-focus condition at the periphery. Thus, a level that can be sufficiently used in a general mobile phone camera should be found.
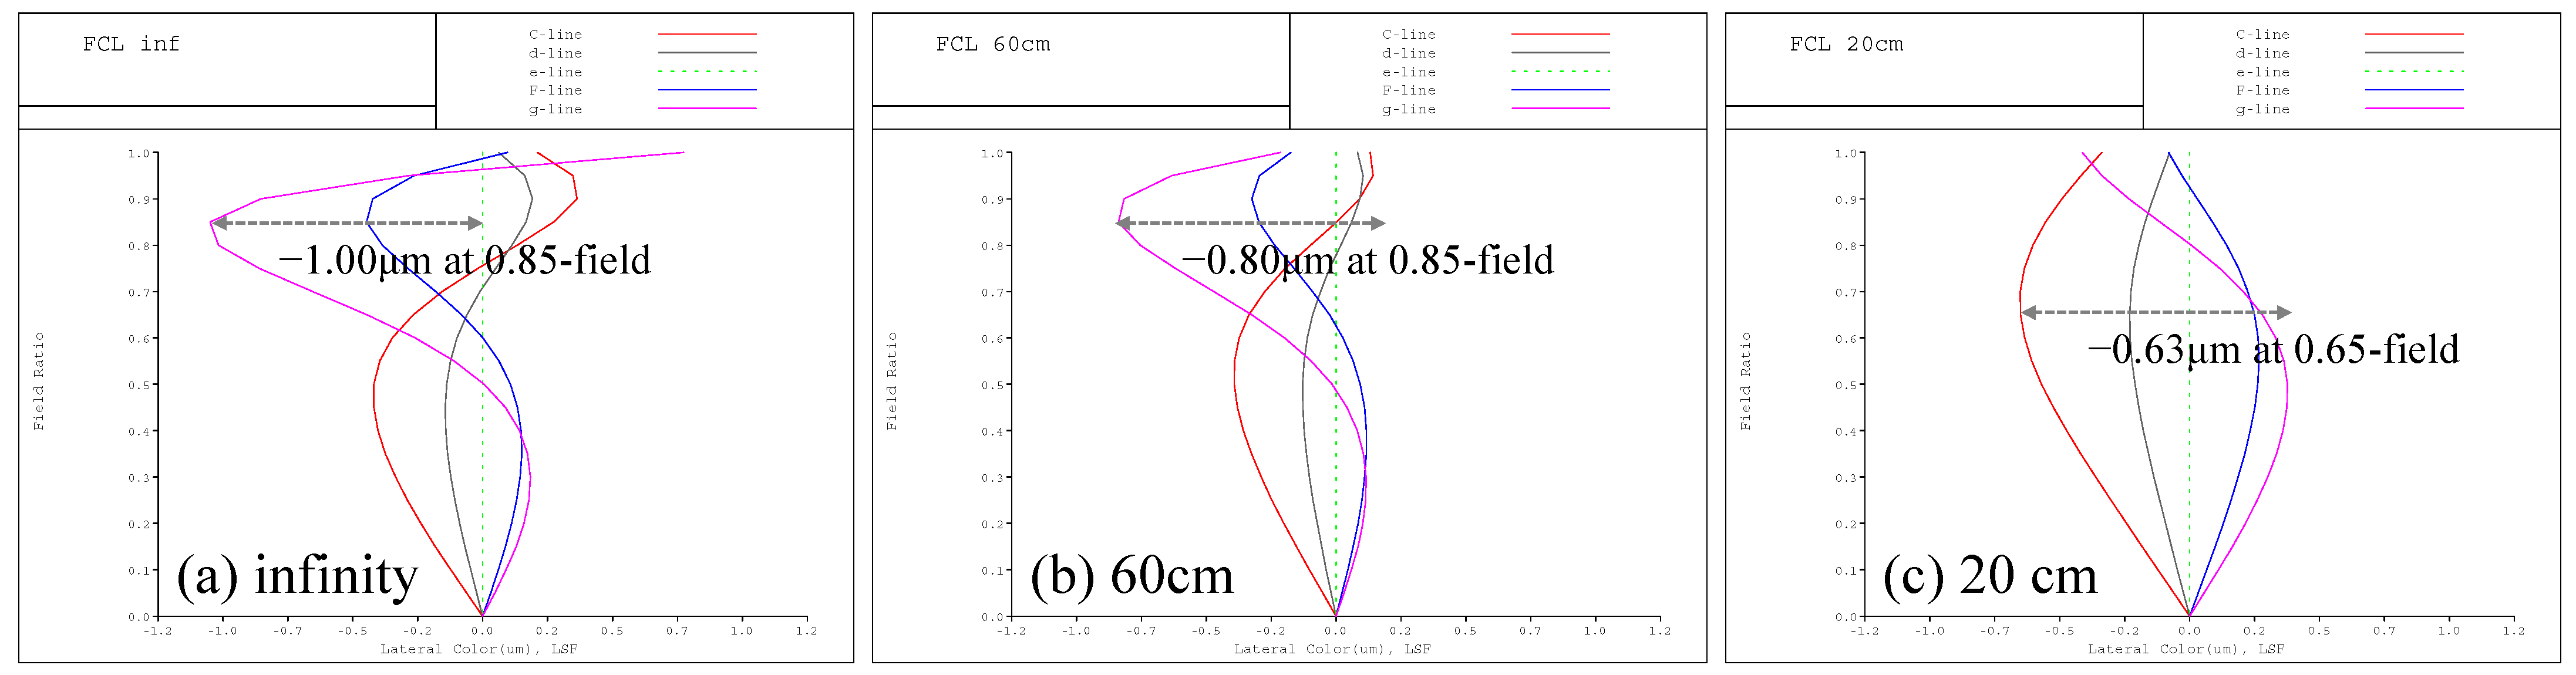
Figure 8 shows the lateral color of the optical system as shown in
Figure 5. As shown in
Figure 8, the maximum value of the lateral color is from −1.0 to −0.63 µm. These values correspond to the size of one pixel of the image sensor. Therefore, chromatic aberration due to the movement of the focusing lens is not a problem. For this reason, we can conclude that it has a stable resolution performance, as shown in the MTF curve in
Figure 7.
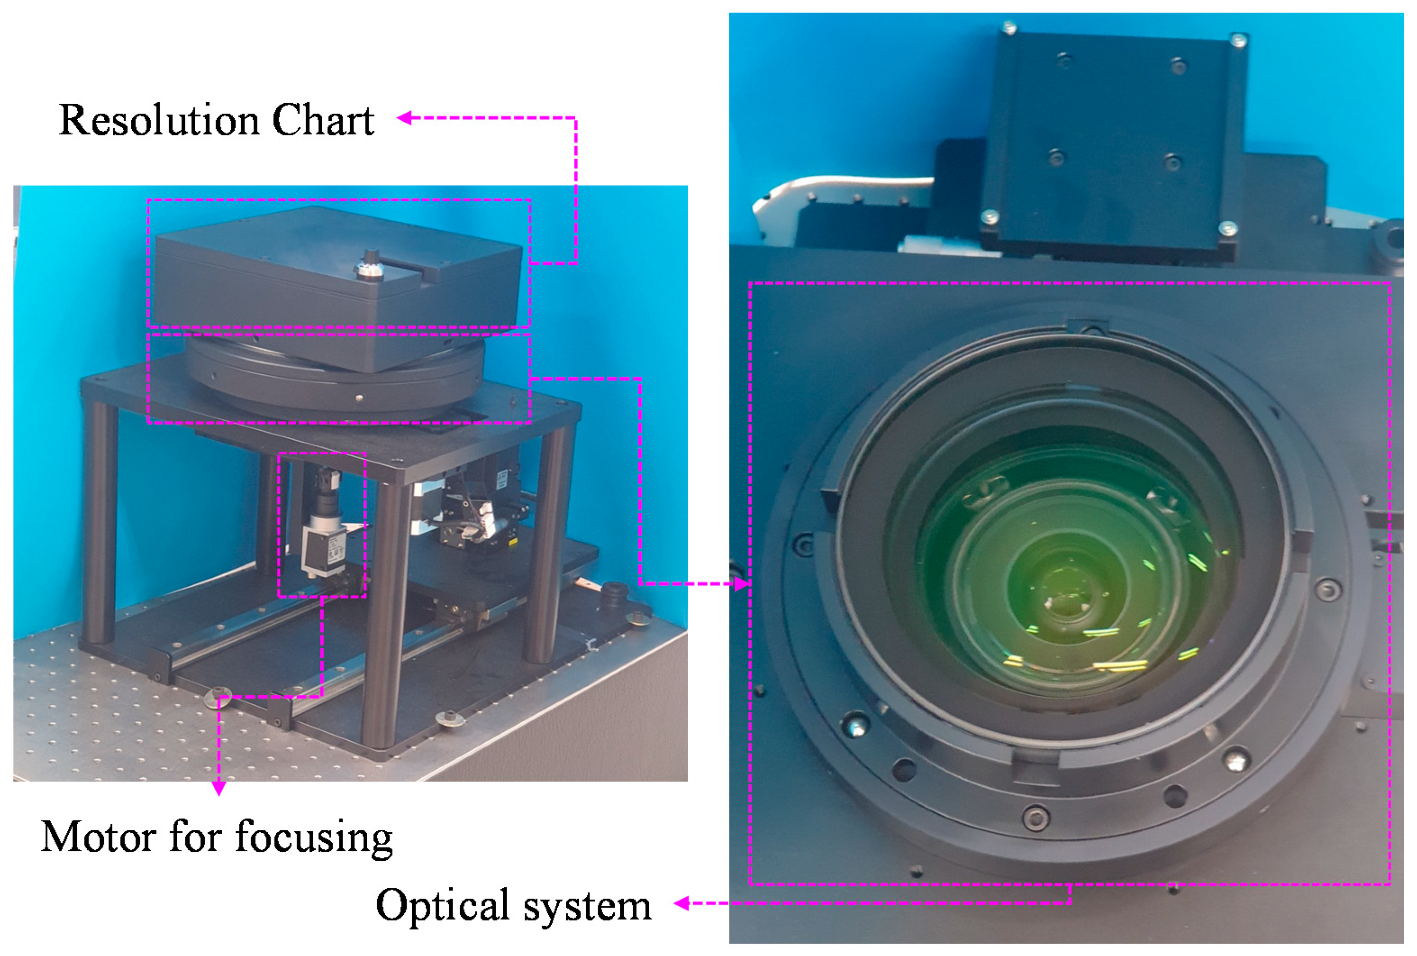
The fabrication result of the designed optical system is shown in
Figure 9.
Figure 5 shows that the resolution chart and optical system are located at a short distance. Therefore, when an optical system is assembled, it must be assembled using a resolution chart. Because the position of the virtual image must be changed, the motor is also assembled.


