Review

Biogas Plants in Renewable Energy Systems—A Systematic Review of Modeling Approaches of Biogas Production

1
Faculty of Engineering and Computer Science, Osnabrück University of Applied Sciences, Albrechtstraße 30, 49076 Osnabrück, Germany
2
Faculty III—Process Sciences, Institute of Chemical and Process Engineering, Technische Universität Berlin, Straße des 17. Juni 135, 10623 Berlin, Germany
3
Faculty of Management, Culture and Technology (Lingen Campus), Osnabrück University of Applied Sciences, Kaiserstraße 10C, 49809 Lingen, Germany
*
Author to whom correspondence should be addressed.
Submission received: 28 February 2021 / Revised: 26 March 2021 / Accepted: 6 April 2021 / Published: 8 April 2021

Abstract

:
Biogas production is a relevant component in renewable energy systems. The paper addresses modeling approaches from an energy system, as well as from a process optimization, point of view. Model approaches of biogas production show different levels of detail. They can be classified as white, gray, and black box, or bottom-up and top-down approaches. On the one hand, biogas modeling can supply dynamic information on the anaerobic digestion process, e.g., to predict biogas yields or to optimize the anaerobic digestion process. These models are characterized by a bottom-up approach with different levels of detail: the comprehensive ADM1 (white box), simplifications and abstractions of AD models (gray box), or highly simplified process descriptions (black box). On the other hand, biogas production is included in energy system models. These models usually supply aggregated information on regional biogas potentials and greenhouse gas emissions. They are characterized by a top-down approach with a low level of detail. Most energy system models reported in literature are based on black box approaches. Considering the strengths and weaknesses of the integration of detailed and deeply investigated process models in energy system models reveals the opportunity to develop dynamic and fluctuating business models of biogas usage.

1. Introduction

Biogas is a relevant component of an increasingly renewable energy system in many countries. Biogas plants feature some specific properties compared to other renewable energy plants such as flexible provision of electricity and heat by gas storage, or possible contribution of energy to the transport sector.
With anaerobic digestion (AD), the main transformation process from organic matter to biogas is a biological one. The complex processes of hydrolysis, acidogenesis, acetogenesis, and methanogenesis are well known and described [1]. AD works with various types of organic feedstock, such as municipal sludge from wastewater treatment plants, municipal solid waste, animal waste, algae, or energy crops. Some of those are constantly available, while others are subject to regional and seasonal restrictions. Main product of the anaerobic digestion is biogas, primarily methane and carbon dioxide (CO2). The side product is a nutrient-rich digestate. Biogas can be converted to different energy products, such as heat (by combustion), electricity and heat (combined heat and power plant: CHP), electricity (by turbines), natural gas (by the separation of CO2), or fuels (e.g., by increasing the methane fraction or CO2-assisted catalytic reforming) [2]. A common pathway for the energetic use of biogas is electricity and heat production in a CHP. The focus in many countries lies on the production of electricity. In Germany, for instance, the privileged feed-in of renewable electricity from biogas CHPs is regulated by the Renewable Energy Act [3]. In comparison to other renewable energy sources, electricity production from biogas is not weather-dependent. Biogas plants can produce electricity flexibly according to demand, by utilizing the possibility of storing feedstock and biogas [4]. This provides a distinguished role for biogas plants in the energy sector. Furthermore, biogas can also participate in the supply of heat and fuel where the share of renewable energies, for example, in Germany, it is much lower than for electricity. The shares of renewable energies for electricity, heat, and transport in Germany in 2019 were 37.8, 13.9, and 5.6%, respectively [5].
Biogas plant operation needs continuous monitoring and process control because the AD process is based on microbiological activities that require a complex biocenosis of different microorganisms. This is where process modeling comes into focus.
Biogas process modeling was originally developed for the prediction of possible biogas yields and optimization of the AD process (e.g., [6,7,8]), as well as for process control and staff training (e.g., [9,10]). Those models—often assigned to the water sector—focus on a very detailed description of microbiological transformation. Early papers on AD modeling, for instance, go back to the 1970s [11,12,13]. Since 2002, the anaerobic digestion model (ADM1) has been a commonly used tool to model physical and biological processes within biogas fermenters.
Biogas plants in energy systems are mostly investigated from an agricultural or energy economical point of view. Energy system modeling often regards biogas plants as black box models. They basically tend to be included as gas storage combined with a CHP unit (e.g., [14]). The modeling of biogas plants within future energy systems with high shares of renewable energies needs to look further into the biological process, though, in order to answer new questions due to the dynamic nature of energy supply and demand, such as:
-
How can electricity production be adjusted to electricity demand profiles?
-
How can biogas plants contribute to energy sector coupling?
-
Which pathway of biogas exploitation is most beneficial for the energy system?
-
Which pathway of biogas exploitation offers a business model for the operator?
Goal of the transition from fossil to renewable energies is the decarbonization of the energy sector, which aims to address the question of the environmental impact of biogas plants, i.e., their carbon footprint (e.g., [15]). Renewable energy production is often much more decentralized than fossil energy production. Biogas production is widely applied in rural areas. This also poses new questions, such as:
-
What is the carbon footprint of biogas-based energy products?
-
What feedstock mixture is most sustainable and are there regional limitations?
-
How can biogas plants be included in regional energy systems?
Such regional aspects of substrate availability and energy-related infrastructure are commonly modeled with geoinformation systems (GIS; e.g., [16]).
The integration of biogas plants in energy systems thus links water or agricultural economies with the energy economy. This requires information transfer between the different sectors. Figure 1 shows possible system boundaries for different views on biogas plants from energy systems to microbiological processes in the AD process.
This paper aims to bridge the gap between different academic fields and their respective research approaches for a beneficial integration of biogas plants in future renewable energy systems by comparing model approaches and their level of detail in anaerobic digestion literature with energy system literature.
Earlier reviews on biogas modeling mainly provide an overview of research within their discipline. For example, a review from 1991 summarizes temperature and inhibitor depending microbial kinetic modeling approaches of the anaerobic treatment processes of complex organic materials [17]. Reference [18] shows modeling approaches of the AD process in the literature with respect to different kinetic approaches and generates an overview of software tools which calculate a biogas production rate based on substrate properties (2014). Reference [19] gives an overview of simplified AD process models (artificial neural networks, Fuzzy-logic, linear and non-linear regression models), as well as computational fluid dynamics modeling approaches of a digester (2012). The review in [20] summarizes existing AD process models and their modeling and kinetic parameters (2011). From an energy system point of view, reviews either regard energy system modeling in general (e.g., [21]) or greenhouse gas emissions based on biogas production [22,23,24,25,26,27].
In comparison, this publication aims at a cross-disciplinary view of modeling methods with respect to biogas production. It thus presents a systematic review and classification of existing modeling approaches of biogas production within the different academic fields of energy systems, regional potentials, greenhouse gas emissions, and biogas processes. It focuses on an analysis of methodical concepts and modeling depths of physical and biological processes within literature with different views on the biogas production process. A systematic overview of different modeling approaches can be the basis for future cross-disciplinary views on biogas plants in energy systems by including the dynamic time-dependent behavior of the biogas process.
The focus lies on biogas plant modeling within energy system studies and models of biogas production. Although computational fluid dynamics modeling is described in literature, e.g., to verify hydraulic retention times of anaerobic digesters [28] or to study hydraulic dynamics of the peripheral piping system [29], fluid flow modeling is not regarded within this paper. Furthermore, this paper does not claim to be a complete overview of every published modeling paper.

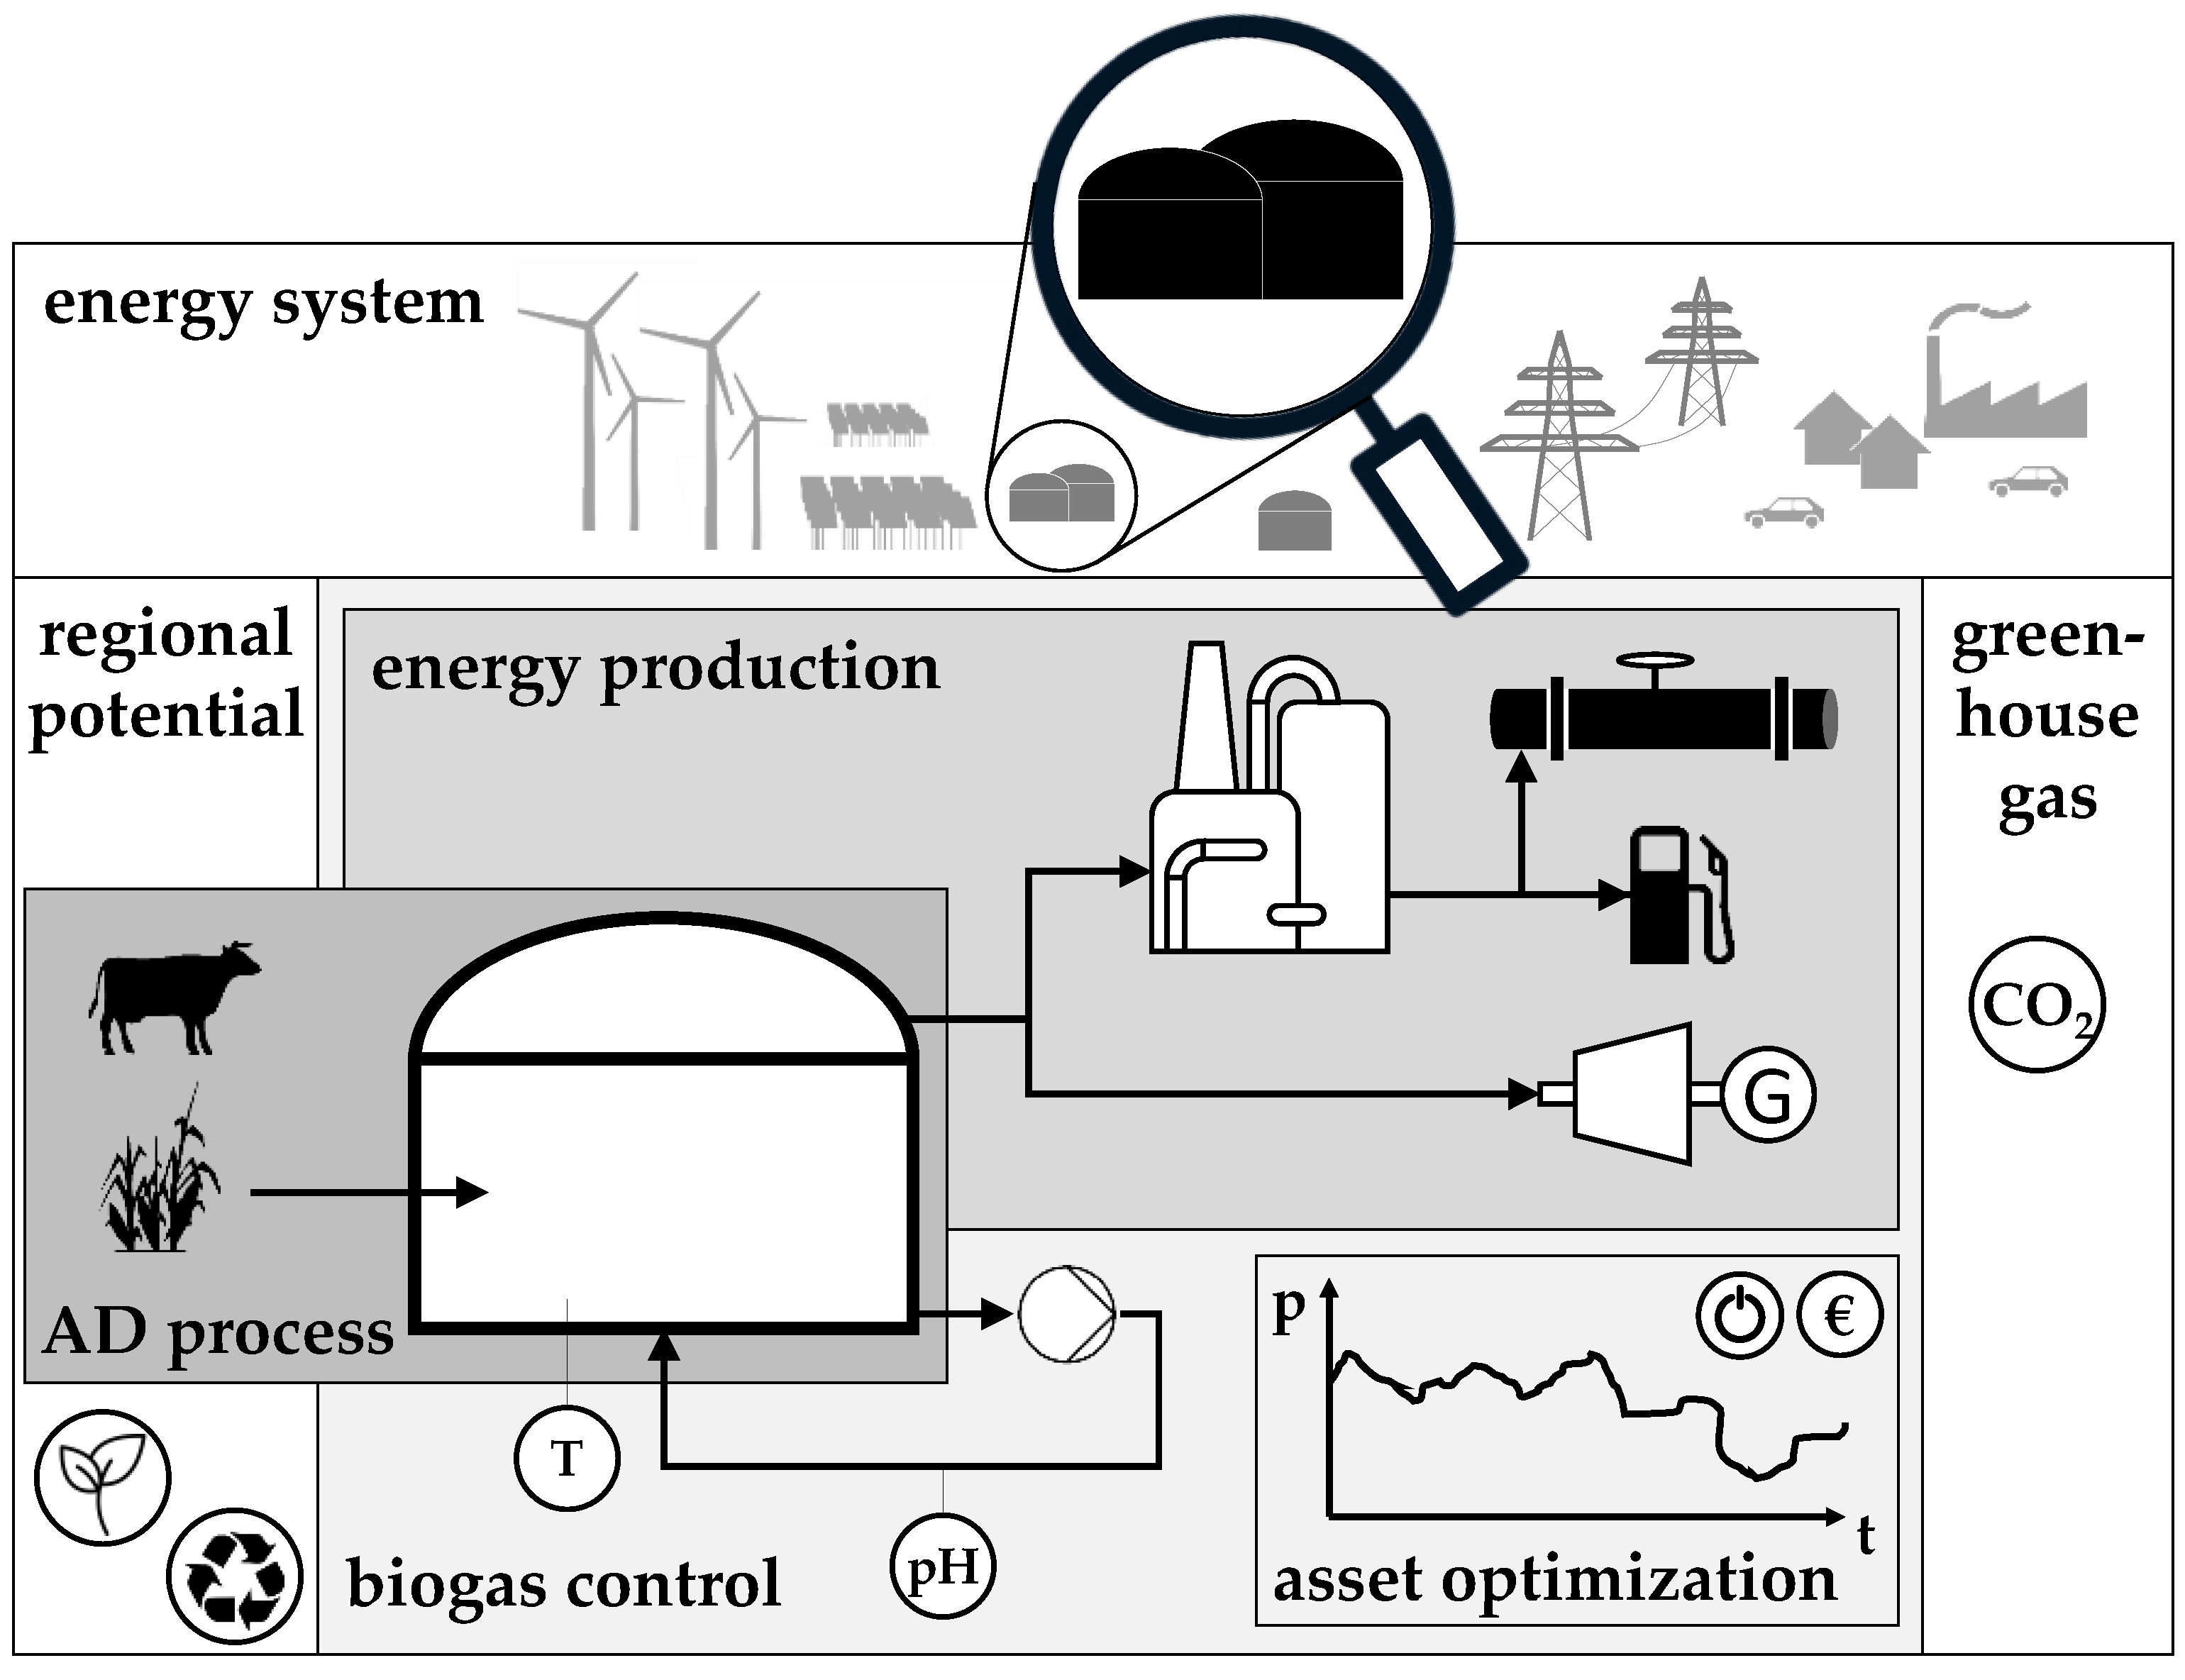
2. Materials and Methods

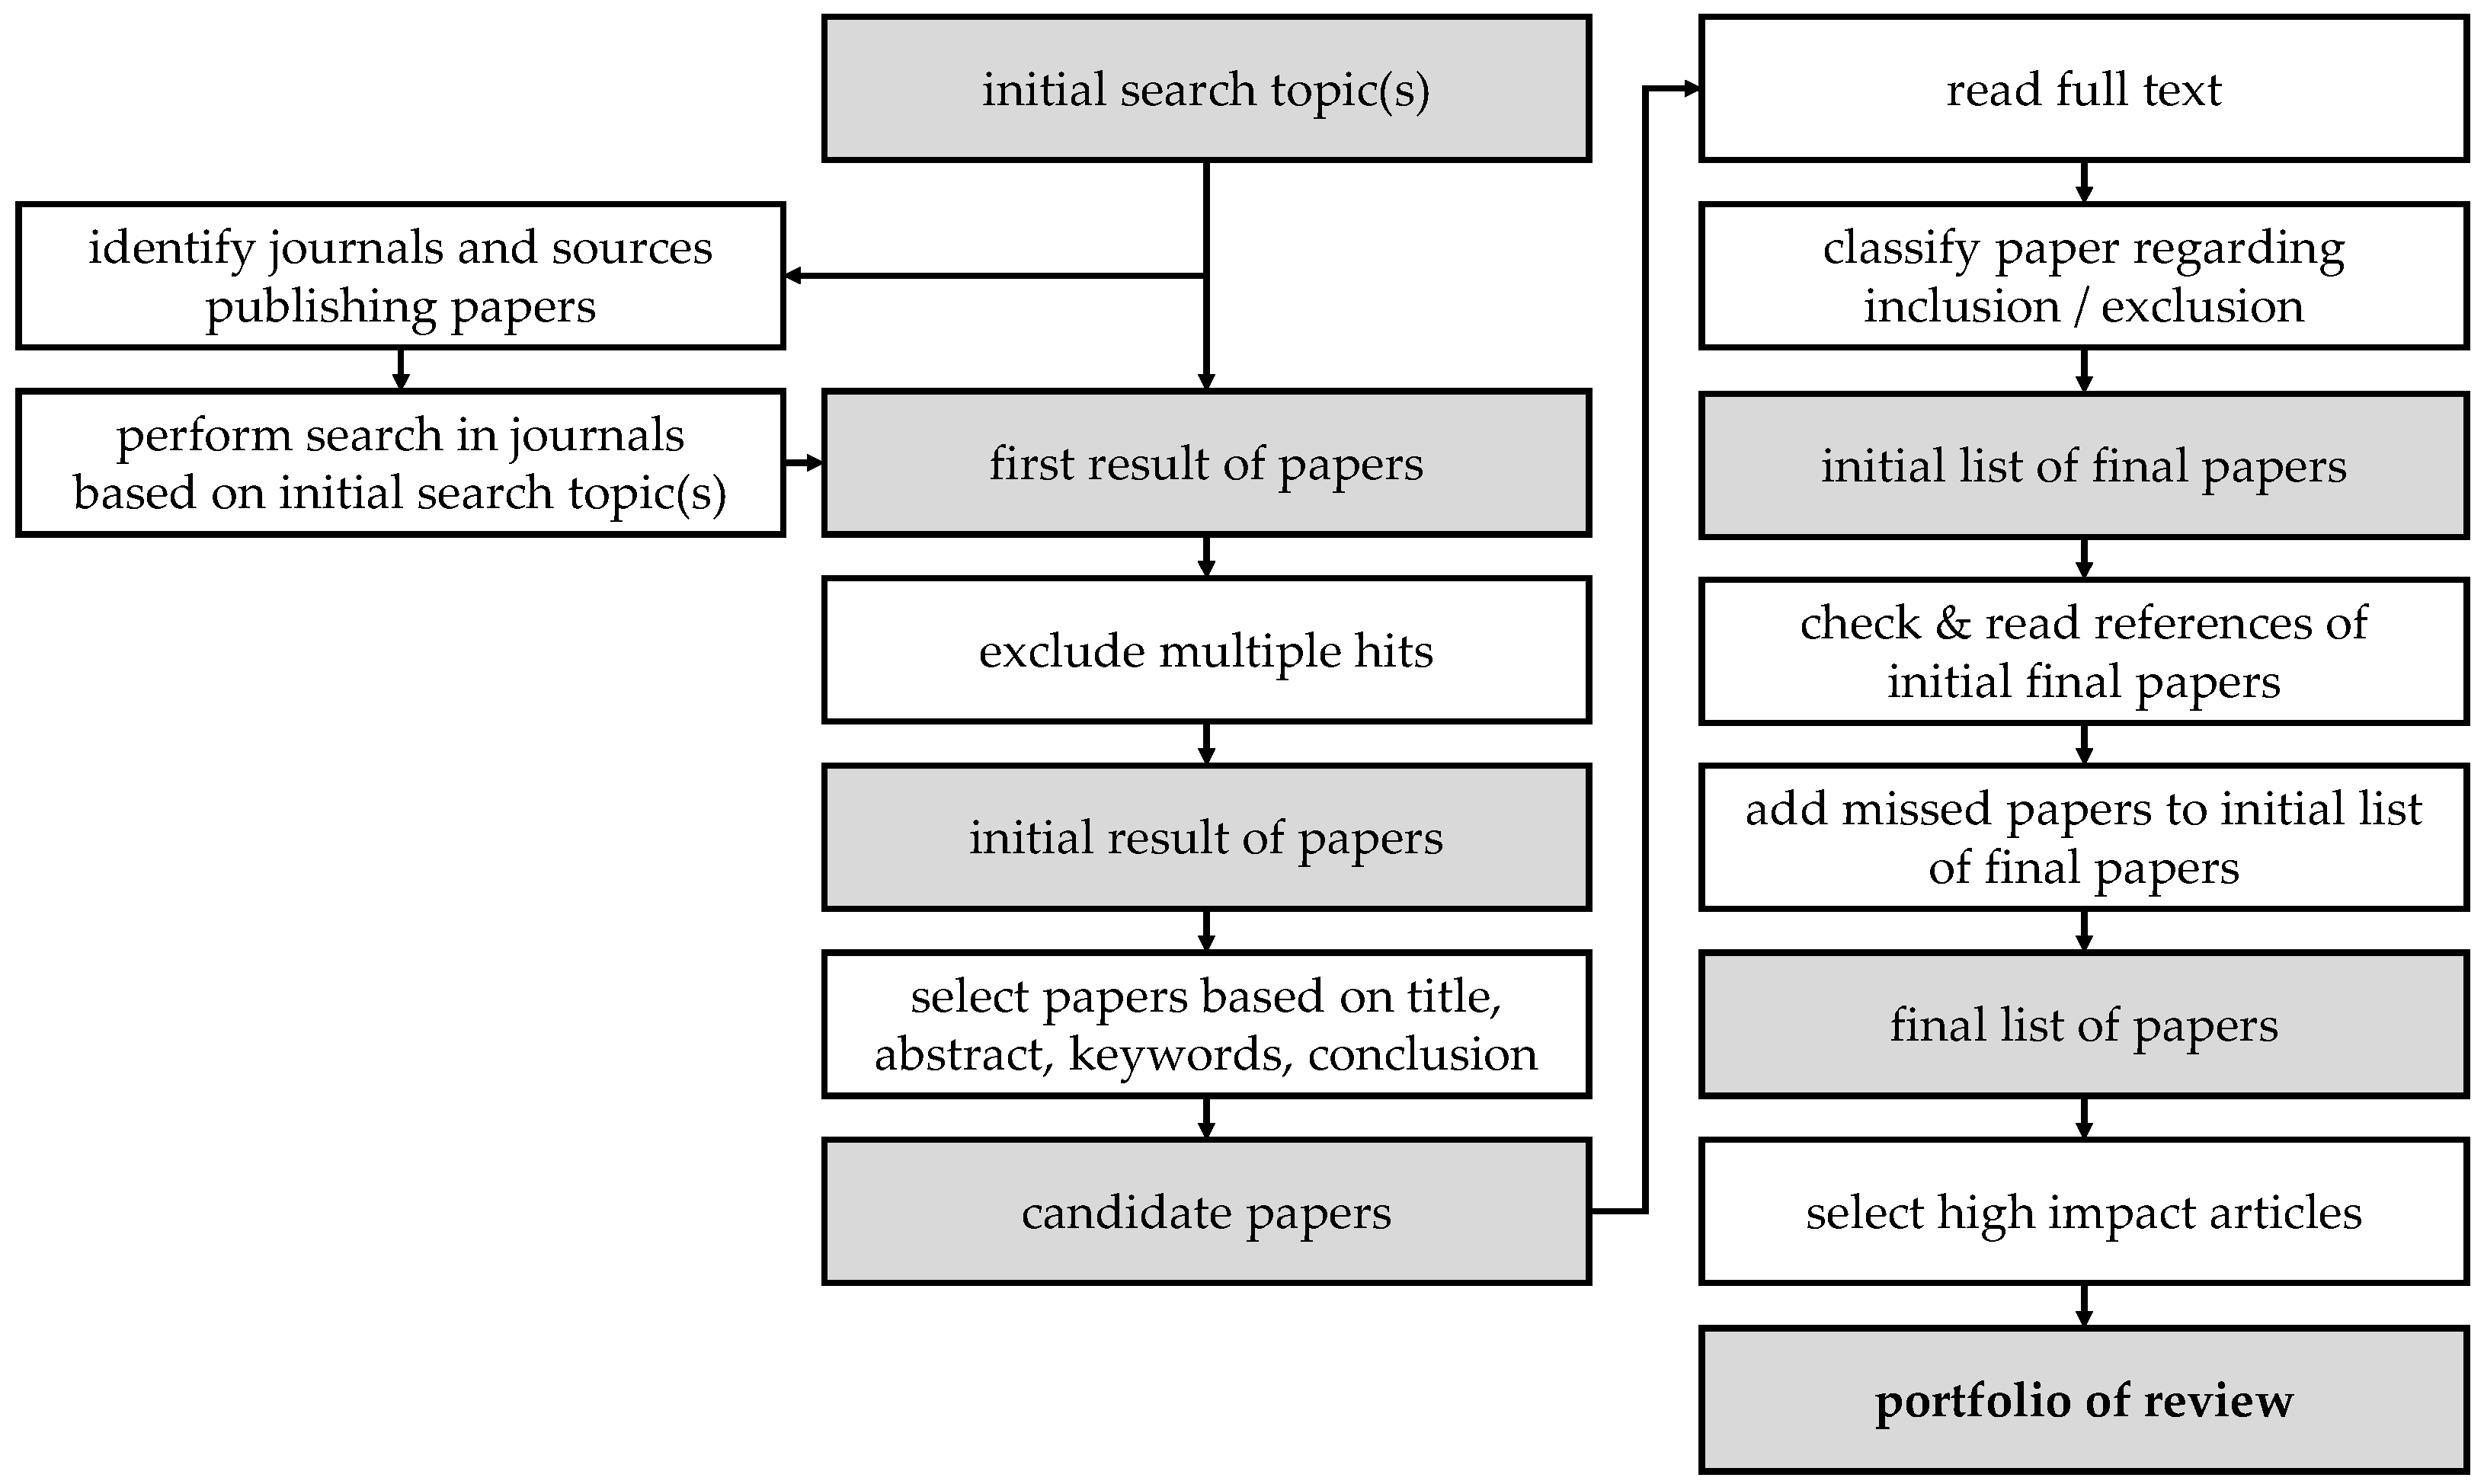
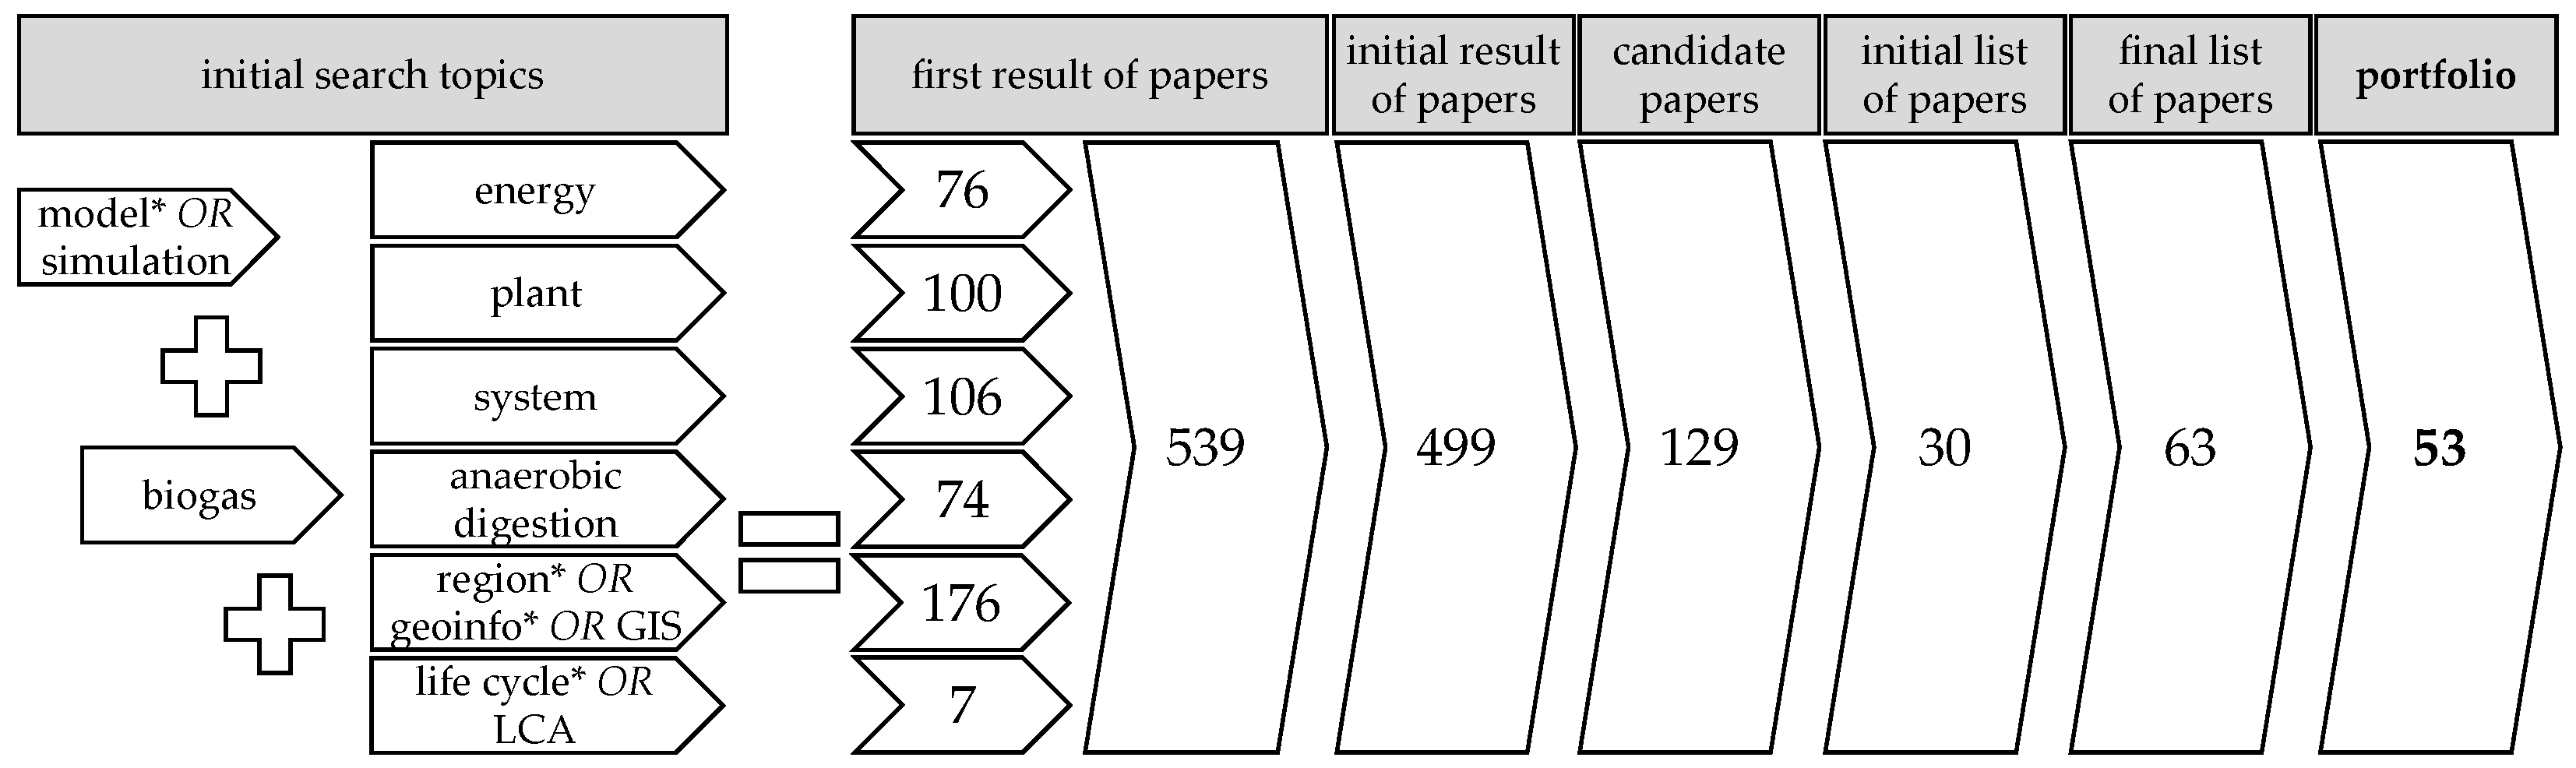
2.1. Literature Search

Process modeling of the anaerobic process started in the late 1960s. Early AD models were, e.g., published by Andrews and Graef in 1971 [12] and by Hill and Barth in 1977 [11]. In the following years, different types of AD models were developed in parallel [30]. In 2002, the International Water Association (IWA) Task Group for Mathematical Modeling of Anaerobic Digestion Processes published the generic AD process model “Anaerobic Digestion Model No 1” (ADM1) [31].
This review focuses on biogas production modeling since this period, i.e., the literature published between 2002 and 2020. It considers publications of different scientific disciplines, such as microbiology, biological process engineering, and energy systems.
A systematic literature review was performed to obtain the most relevant literature on modeling approaches for biogas production and its environmental impact, as shown in Figure 1. The method was adapted from [22,32,33] and is shown in Figure 2.
A keyword search was rejected due to its unspecified results with almost over 239,000 search hits achieved by only applying the keyword combination of “model,” “biogas” and “system.” Consequently, a title search was performed.
The performed Google Scholar search reached a significantly higher number of matches (499 hits without duplicates) than the same combination of a title search at Web of Science (176 hits).
As initial search topics, a combination of “simulation” or “model*” (*: placeholder to get results for different configurations, such as “modeling” or “modelling”) with “biogas” and the different research fields, such as “system” or “life cycle,” was applied. Common journals publishing these papers were used for an additional search in sciencedirect, researchgate, semantic scholar, MDPI, scitldr and IEEE with the results added to the first result of papers mentioned above.
This initial search led to 539 search hits (Figure 3) with only 40 papers (7%) excluded as duplicates (Figure 2). The different search topics generated only a small intersection but a broad impact on this specific search.
Reading the title, abstract, keywords and conclusion (in this sequence according to [33]) resulted in 129 candidate papers (26% of initial results) with potentially high relevance due to the existence of a mathematical model of biogas production mentioned in the paper. These papers were further classified in terms of relevance, i.e., a published biogas energy production model or biogas model used to calculate the impact on the environment (e.g., life cycle assessment: LCA).
The remaining final list was comprised of 30 relevant papers (6% of initial result).
This list was used to examine the impact of these papers on further research topics (forward search) and to inspect their references (backward search). An additional 33 papers were found and added to the final list, resulting in 63 papers (12%) with an impact on this review paper.
As a partial number of the final list of papers, this review presents a portfolio of 53 papers as a subset of the 63 final papers with the highest impact on the research topic of modeling dynamic biogas systems considering different levels of detail. Moreover, these papers show slightly different modeling approaches and thus differ from each other.

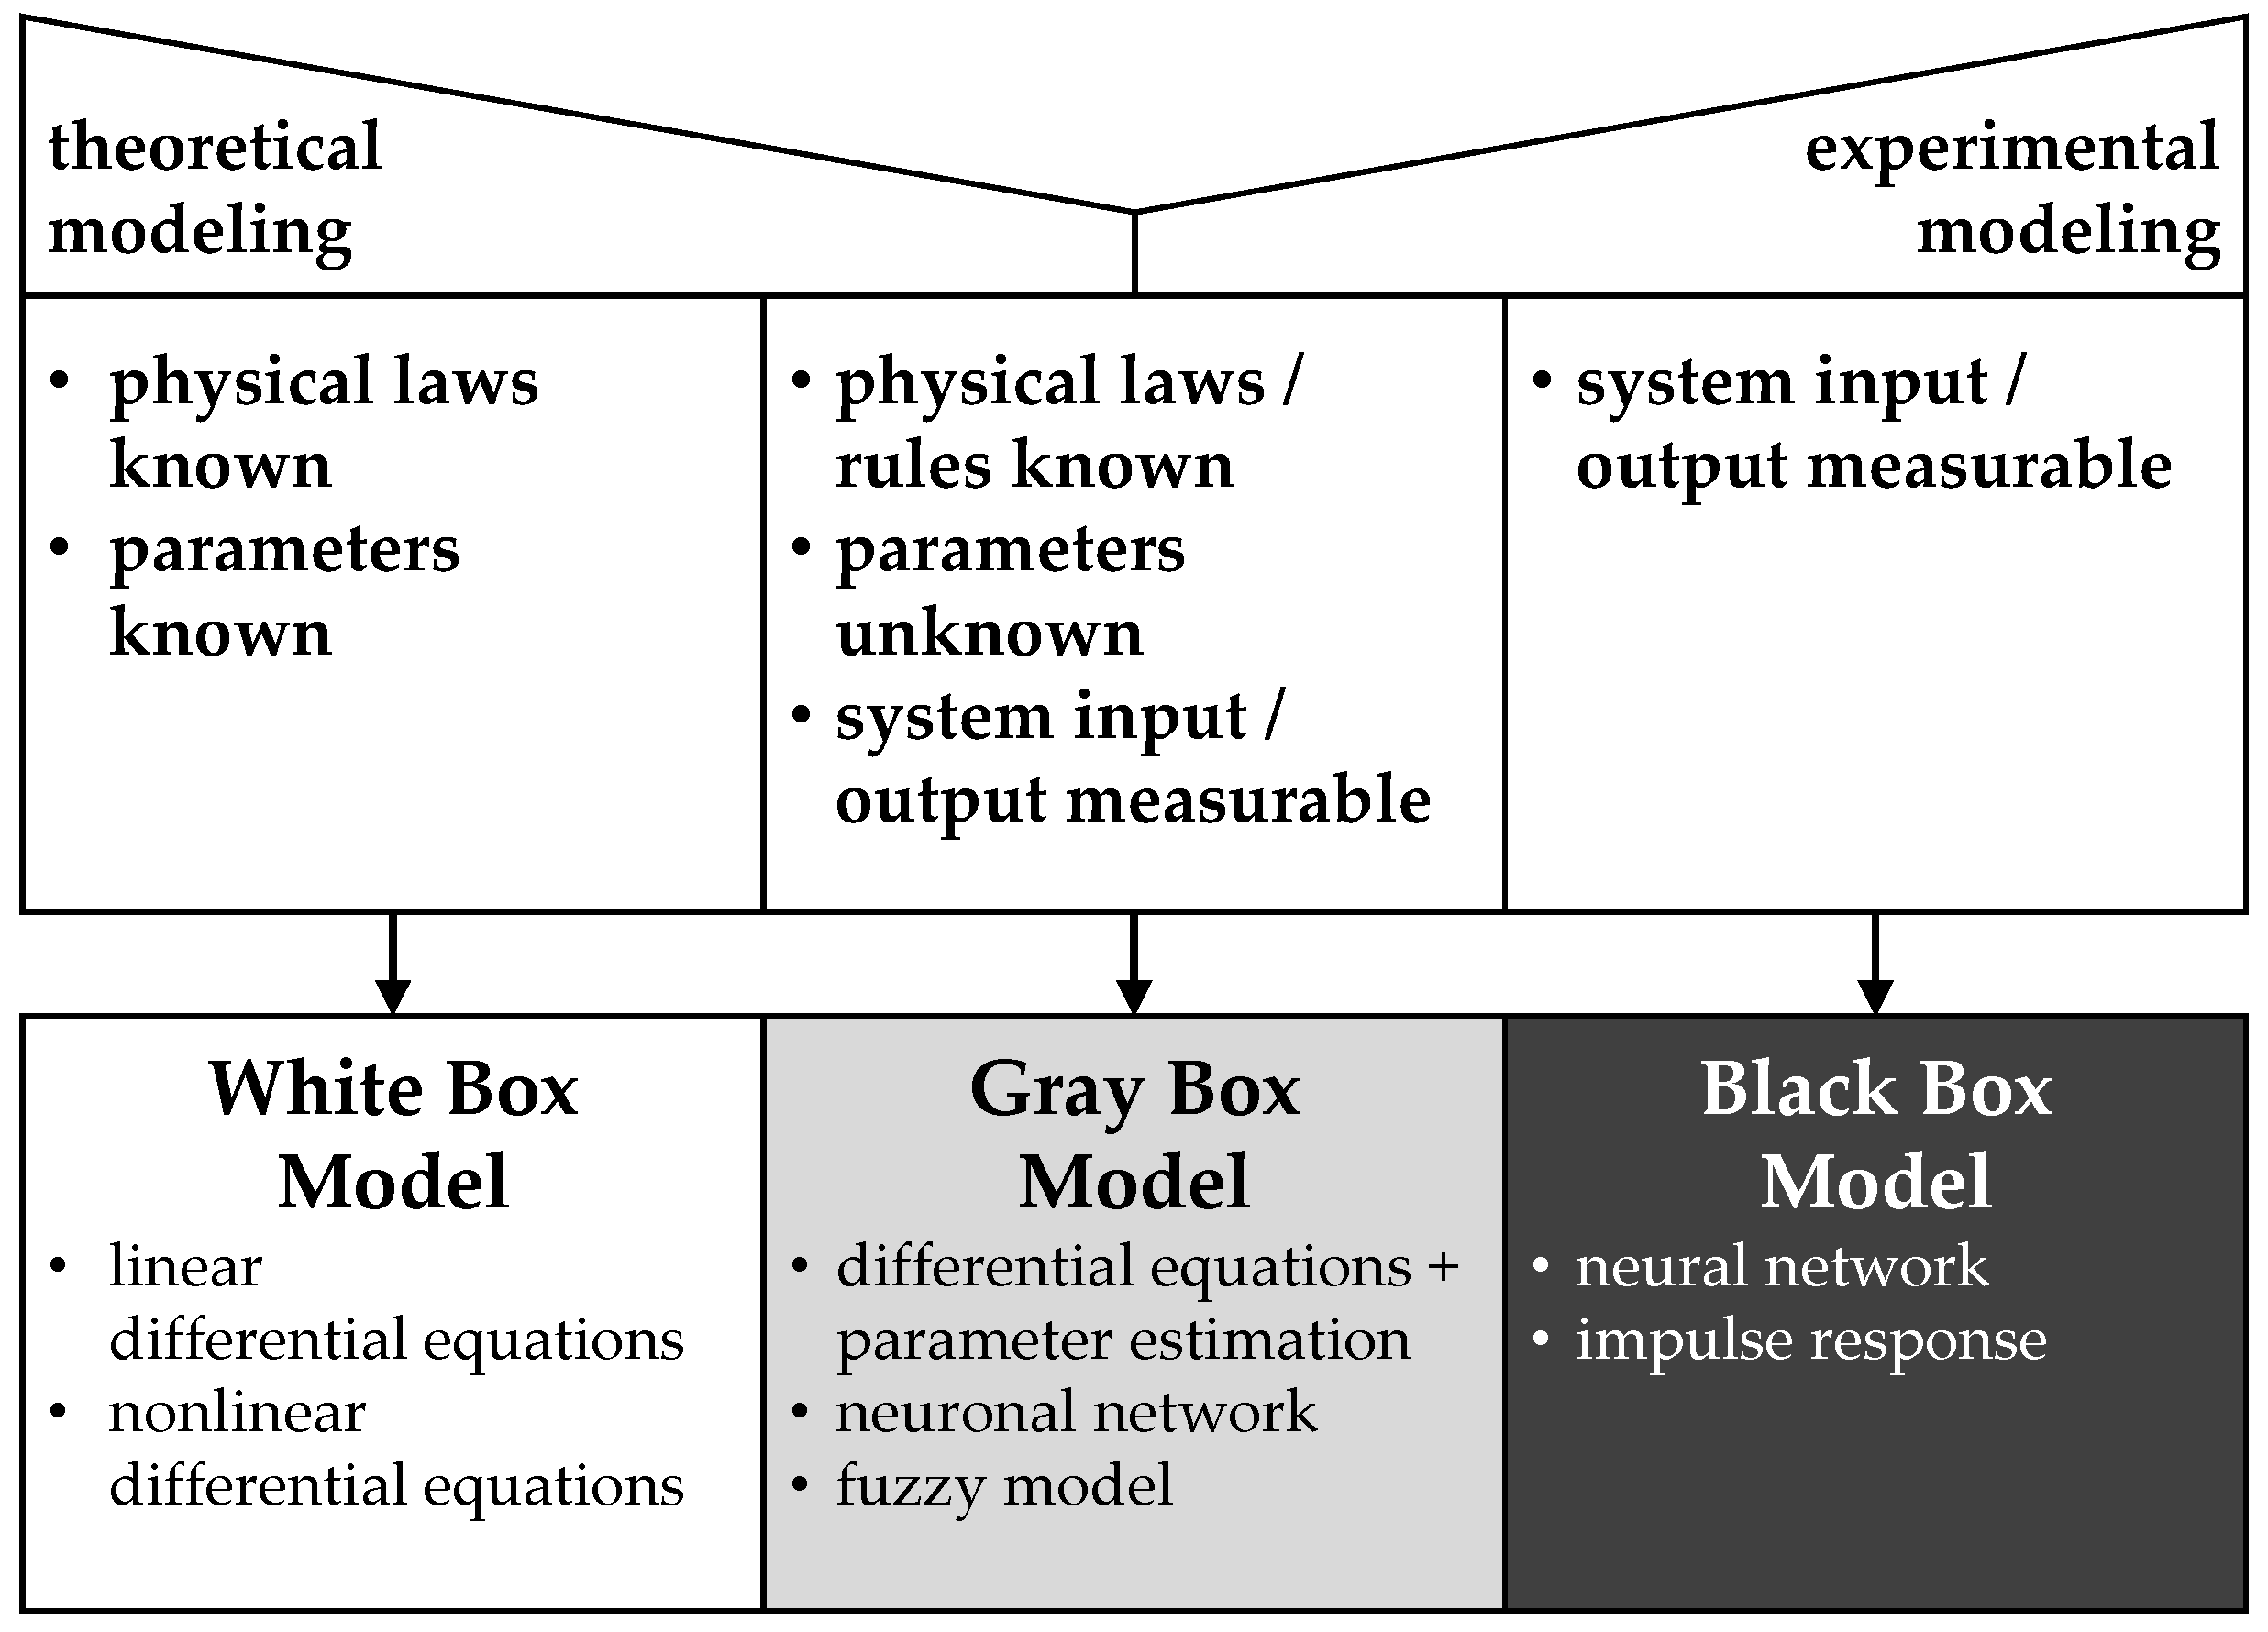
2.2. Model Categorization

Mathematical process models can generally be classified by regarding their level of theoretical depth. While experimental models describe a process by experimental input-output analyses, all physical dependencies are described by differential equations in theoretical models. This requires very detailed process understanding and knowledge of all influencing parameters. The different model approaches can be categorized in black box, gray box and white box modeling, with increasing model complexity from white to black box approaches (Figure 4).
White box models consist of linear or nonlinear differential equations and know their physics, structures, and parameters well without any restrictions made by the physical system they describe [34]. They are the most detailed models and close to a full description of a real system, providing results near to the actual behavior of the real system. However, as they do not contain approximations, a complex design and implementation of all influencing parameters is necessary [35].
Black box models on the other hand create a system response without knowing any physical dependencies of the input variable and without considering the complexity of the system. Experimental data or results of a physical system train these models, such as artificial neural networks (ANN) or statistical models. They describe the functional relationship between model inputs and outputs and are efficient at representing the behavior of a process as a trend [36]. By using only a set of rules and equations, these models are fast in terms of computing and processing, but show a lack of flexibility as they cannot adept to slightly different physics [35].
As a mixture of white and black box models, gray box models, such as fuzzy models or differential equations, know physical dependencies of input and output data, but not any generally valid parameters that describe the physical system. They use physical representations and approximations with model parameters, which have to be gained for each physical system they describe, i.e., by experiments. Accordingly, their application is restricted to one well-defined physical system and its estimated parameters [34].
Within this paper, literature on biogas modeling is classified according to its view on the biogas plant and the modeling approach. Regarded views on the biogas plant are according to Figure 1: energy system, regional potential, greenhouse gas (GHG) emissions, and biogas production.
Depending on the complexity of the AD model within each publication, it is further assigned to the categories of white box, gray box, or black box models. Biogas modeling approaches which include a detailed mathematical description of all physical and biological process steps of the anaerobic digestion are thus classified as white box models (e.g., the ADM1 model), simple systems of equations or linear relationships are classified as black box models (e.g., the calculation of methane potential based on the organic solids of a feedstock), and simplified dynamic relationships of biogas production with respect to the feedstock are classified as gray box models (e.g., simplifications of the ADM1 model).
Moreover, the classification into top-down and bottom-up models presented in [37] is transferable to modeling approaches of biogas production. Providing an aggregate view of the energy sector and economy when simulating economic trends and energy demand supply, these models are classified as top-down model accordingly. In comparison, modeling detailed information about processes, technical systems and time-dependent conditions is the result of bottom-up modeling approaches of biogas production.

3. Results

This review deals with different modeling approaches of biogas production within renewable energy systems. As the review considers varying research disciplines and their respective views on biogas production with different system boundaries, the literature regarded is categorized using holistic energy system modeling, modeling of regional substrate potential, modeling of greenhouse gas (GHG) emission, and detailed dynamic process models.

3.1. Energy System Modeling

Energy system models describe current and future energy systems considering scenarios to predict the possibilities of expanding renewable energy production. Therefore, the calculation of scenarios is based on time-dependent information, such as the energy potential of photovoltaic or wind, fluctuating energy demand as a result of day-ahead usage or changes of technologies, or varying energy prices on world markets [37]. A number of different mathematical environments and tools are described in literature for the modeling of energy systems, summarized in the review of [21].
The Open Energy Modelling Framework (Oemof) is one of the tools used for energy modeling [38]. It is based on Python and was developed as an open source tool to construct comprehensive energy system models. As an application, it was used in [39] to investigate the energy storage requirement for different degrees of self-sufficiency while regarding the electrical energy potential of photovoltaic, wind and biogas in a northwestern region of Germany (districts of Muenster, Osnabrueck and the city of Osnabrueck). Biogas, therefore, was considered as a fixed electrical energy potential of this region and included in the simulation either without energy storage or with the possibility of buffering its energy production for eight hours. Further studies [40] also used this approach of biogas integration in energy system modeling and showed that the region could reach a degree of self-sufficiency of 80% without installing any energy storage systems as a result of already installed renewable energies.
A comprehensive fictional energy system, including wind turbines, photovoltaic, thermal solar and biogas for electricity and heat, was studied in [41]. Mathematical equations were solved by utilizing the Engineering Equation Solver [42]. Different scenarios were simulated with the use of thermal energy storage to obtain the possibility of heat buffering in times without solar radiation. In the case of biogas production, the energy input into the system simulation is based on a fixed mass-specific energy content of a fixed feedstock mixture consisting of chicken manure and maize silage; the CO2 emission reductions were calculated in comparison to fossil fuel sources. The simulation showed the possibility of producing electricity, hydrogen, cooling effects, hot air and hot water with renewable energies with an overall energetic efficiency of 64.9 to 71.1%.
Modeling the potential of degradable wastes using Balmorel as a linear optimization and energy system model [43], Reference [44] developed an energy system model to simulate the waste to energy potential. Accordingly, annual energy potentials of agricultural wastes, forest residues, energy crops and municipal waste were taken from literature for Denmark, Germany, Finland, Norway, and Sweden, as well as their electricity and heat demands. In addition to biomass, the annual electrical energy potential of wind turbines was also included. Considering different technologies of waste conversion (waste incineration, co-combustion with coal, AD, gasification) and their costs (investment, operation, maintenance) led to the incineration of waste as the most economic feasible solution.
Reference [14] included biomass as an annual energy potential of Denmark to evaluate the potential of biogas-derived fuels as raw biogas (used without purification), methane from biogas purification and methane from methanation with electrolytic hydrogen. Different sectors were modeled (power, heat, transport) using [45] under varying biomass costs. An hourly simulation achieved the use of raw biogas for electricity and district heat production as a result with the highest efficiency and lowest energy system cost.
The energy system model in [46] included solar heating, geothermal and biomass heat generation, waste and gas CHPs, wind turbines and AD to obtain heat, electrical energy, gas and methanol for the Danish municipality of Sønderborg using Sifre (an energy system modeling tool of the Danish electricity and gas transmission system operator Energinet.dk). Regarding AD, a fixed mixture of manure and straw produced biogas with 65% methane and 35% CO2. The results show a reduction of total system costs and CO2 emissions for a manure and straw potential for 2014 and 2029 using advanced conversion technologies (i.e., electrolysis, fuel cells and methanol production) in electrified energy systems.
Reference [47] used an Irish annual bioenergy potential of different degradable feedstock as an oil equivalent considering annual changes of this potential. The scenarios were built within TIMES (The Integrated MARKAL-EFOM System; MARKAL-EFOM: Market Allocation-Energy Flow Optimization Model) software environment. The target of 80% CO2 reduction by 2050 was confirmed by the simulation, mostly by CO2 reductions in the transport sector and a biomass potential for two-thirds of the renewable energies in 2050.
An integration of the energy potential of biomass as a black box model was common for the studies presented in energy system models. The models consider fixed yield factors for the conversion of organic substrate to biogas, biomethane or to electricity and heat. The amount of biogas-based energy is then integrated into simulation environments and combined with the energy of other renewable sources in order to build load profiles. These load profiles in energy system modeling are consequently optimized to match current and future energy demand profiles. Additionally, there are different studies of energy system modeling available handling the general availability of bioenergy as a renewable energy source in scenario development for energy systems in the future. Different reviews regarding the latter have been published, for example, modeling decentralized energy autonomy [48], urban regions [49,50], or on a smaller scale for municipalities [51,52]. These studies state the general availability of bioenergy for renewable energy systems.

3.2. Regional Potential Modeling

GIS modeling maps data items in terms of geographic coordinates (latitude, longitude) to calculate the regional potential of biogas (degradable substrates in their original condition) [53]. These data are known or can be calculated. The results are used mainly to calculate regional biomass or biogas potential, but they can also be the basis for sustainability studies or regional energy systems according to regional infrastructure. This technique is, for example, used for the planning of wind parks [54,55].
Investigating the biogas potential as a result of the AD of manure, Reference [16] used GIS-dependent information about the capacity and locations of dairy farms located in a northwestern region of Portugal (Entre-Douro-e-Minho Province). This region consists of 10 counties with 294 parishes and 1705 dairy farms with more than 100,000 animals. The electrical energy potential was calculated as the linear relationship between one cubic meter of biogas and the number of animals needed to produce the relevant amount of manure. Including biogas plant costs for investment, maintenance and costs for transportation of manure, a multi-objective mixed integer linear programming was performed to identify locations of biogas plants with minimal investment, operation and maintenance or transportation costs.
In a similar way, the sectoral biogas potential from livestock manure (cattle, pigs, sheep/goats, poultry) was evaluated in [56] with a GIS approach for a region in Greece. Accordingly, the year-dependent manure production per animal (since 1970) and biogas potential of the manure led to a sectoral energy potential.
A time dependent biogas potential made of agricultural residues and municipal biowaste with a seasonal variation approach was examined in [57]. Taking account of residue-to-product ratios, sustainable removal rates, and specific methane yields of agricultural wastes while including a seasonal residue generation, this approach led to a linear relationship between feedstock and its methane yield and was calculated for a land cover of Croatia. Up to 40% less storage capacity is required for the seasonal approach compared to a conventional annual approach.
A more detailed regional model of biogas potential to obtain an optimization of GHG emissions for the Finnish province of North-Savo was presented in [58]. GHG emissions were calculated as a sum of emissions of the CHP plant and feedstock transportation. The calculation of CHP emissions is based on specific methane yields of the feedstock and the associated CO2 emissions of methane combustion. Consequently, data for regionally available feedstock (manure, grass silage and municipal waste) was collected to calculate a regional methane potential based on feedstock production (per animal or mass of waste). Taking the total solid ratio and the methane yield into account, the regional feedstock production led to a regional methane potential. An optimization algorithm calculated and minimized the GHG emission due to different sizes and efficiencies of CHP units and hydraulic retention times. A regional gas grid was contemplated in order to examine the biogas availability in the area near the gas pipeline.
Based on feedstock-specific (municipal waste, sludge, manure, silage, and crop residues) biomass, a rural methane yield was calculated due to its volatile solid ratios and methane yields to optimize biogas plant placing in a rural area of southern Finland (Turku, Salo and Kymenlaakso) [59]. Forty-nine biogas plants were identified with a total energy potential of 2.8 TWh. The production capacity of the biogas plants could be raised from an average of 3.7 to 13.4 MW by increasing the transportation distance of feedstock from 10 to 40 km, while over 50% of feedstock potential lies inside a 10 km radius around the biogas plant locations.
In summary, regional modeling in the field of biogas production focuses on GIS-based studies of substrate availabilities. These are observed mostly as mean annual values, but time-dependent studies are also reported. The modeling of the biogas process as a black box with known yield values for biogas production from different substrates is common for studies with a regional focus.

3.3. GHG Emission Modeling

The environmental impact of biogas production is often described by the amount of GHG emissions produced, with methane leakage during AD and storage being the major emission source. The LCA according to DIN EN ISO 14040 [60] and 14044 [61] considers the complete product chain, from raw material to waste removal [62]. This includes, for example, N2O emissions from the agricultural production of energy crops. Emissions of different GHGs are commonly summarized as CO2 equivalent or global warming potential. Calculating the impact of energy production and its resulting impact on the environment, LCA based on biogas energy systems as research topics were deeply discussed in several studies including different aspects, and were reviewed by several authors, for example [22,23,24,25,26,27].
Using the LCA database GaBi [63], Reference [15] evaluated a LCA for maize to generate electrical energy considering its regional impact, such as soil, weather and crop management conditions, for the districts of Hildesheim, Göttingen and Celle, Germany. Biomass in this study was calculated according to the regional biomass yield. The electrical and thermal energy production was calculated considering constant efficiencies based on dry and organic matter and methane yield. Net GHG emissions varied from 0.05 kg CO2 eq/MJel in Celle to 0.016 kg CO2 eq/MJel in Göttingen due to different maize cultivation systems and heat utilization from CHPs. The results of acidification and eutrophication show similar results for these regions.
The LCA software GaBi was also used in [64] to investigate the influences of liquid manure and energy crops (maize silage and grass silage) as feedstock in four different types of biogas plants. The methane yield was calculated for different mixing ratios of input materials. The energy conversion included different sizes (50, 150, 500 and 2000 kWel) and efficiencies (electrical: 36, 38, 40 and 41%, thermal: 46, 46, 43 and 44%) of CHPs. Liquid manure showed a reduction of GHG emissions for small biogas plants (0.2 kg CO2 eq/MJel) but a low effect for bigger plants (0.08 kg CO2 eq/MJel) when comparing a co-digestion of 35% of manure and 65% energy crops with a mono-digestion of energy crops.
An LCA for a demand-driven biogas system using maize, grass, rye silage, sunflowers, biogenic wastes and manure as feedstock was performed in [65]. Two superior scenarios were compared: A flexible demand-oriented and a traditional baseload operation. A substitution of maize with sunflowers, manure and biogenic wastes was obtained in the flexible feedstock operation. The methane yield of the feedstock input was calculated by using dry and organic content ratios with its mass-specific methane yield. The LCA data of the tractor, CHP unit, energy, fuel and fertilizer were taken from the Ecoinvent [66] database and SimaPro [67] as the LCA software environment. Calculating the fermenter volume with an HRT taken from literature led to a mass flow of feedstock into the digester.
A flexible feedstock input led to a 16% higher energy consumption of plant operation compared to the baseload energy production. A higher energy consumption of feedstock transport and storage caused this additional demand. However, a global warming potential reduction of up to 45% was achieved with a flexible feedstock load against baseload production due to a substitution of maize with biogenic wastes.
Based on an overall mass-specific energy content, Reference [68] used different types of pretreated grass as feedstock and their energy potential to model a process chain of biogas production, including cultivation, harvesting, storage of feedstock, digestion and digestate use. Three different case studies were performed: fresh grass, dried grass (hay) with storage, and ensilaged grass with storage. The studies were done without a specific software solution to obtain LCA results and included all process parameters, such as methane yield, gas leakage and CO2 emissions. The results showed the highest GHG emissions in the case of the dried grass digestion (4.55 kg CO2 eq/kg biomass) due to the high concentration of total solids and, therefore, the high gas leakage emissions during the drying process in the field. About 1.8 kg CO2 eg/kg biomass was emitted by fresh grass and ensilaged grass.
Reference [69] investigated an LCA of biogas production with subsequent biomethane injection into a natural gas grid based on mono-fermentation of cultivated crops such as maize, triticale, rye and hemp. The authors used Umberto® [70] as material flow management and LCA software. The study includes emissions of farming, digestion, purification and upgrading of biogas to biomethane as well as emissions of transportation processes. For calculating an annual biogas potential, a cultivated area of 1 ha was considered, producing 80 tons of fresh matter per year with 24% dry matter content. This cultivation lead to an annual biogas production based on a specific biogas yield of 467 m3/t with 60% methane and 40% carbon dioxide.
It could be shown that the global warming potential (100 years) of biomethane were 10–20% lower than the GWP of natural gas.
In summary, GHG calculations in biogas plants model mainly the biomass process chain in order to identify potentials for emission decrease or to compare different feedstock or biogas plant setups. Literature studies on emissions of biogas production are mainly based on black box models. An exception is the preprint of a study in [24] that deals with LCA modeling with the software SimaPro [67] and the Ecoinvent [66] database combined with an extended model of the Advanced Monitoring and Control system for anaerobic processes (AMOCO) [71], including pH inhibition and an additional hydrolysis step, modeled within MATLAB®. The AMOCO (or AM2) was developed by a European Economic Community project, published in 2001 [72], and is based on a two-step reaction system with acidogenesis and methanogenesis reaction steps, including 13 different equations of biomass, substrate and products, with an overall energy and mass balance of the digester. Additionally, the model contains equations of the inhibition of biological processes and physiochemistry states, such as pH value, fraction of inorganic carbon and partial pressures. The AD model AMOCO was applied to a biogas plant to perform in the flexible energy market of Germany within baseload and flexible feeding control. The LCA data were examined using SimaPro and were integrated into the programming environment of MATLAB® to deal with LCA data, on the one hand, and dynamic digester behavior, on the other hand. A flexible feeding management of maize, grass silage and cow manure led to a 35% lower global warming potential in comparison to a baseload biogas production and an average GHG emission of 0.0026 kg CO2 eq/MJel.

3.4. Dynamic Biogas Process Modeling

The performance of biogas plants as a result of AD, the possibility of controlling a full-scale biogas plant, the impact of fluctuating energy markets, and the behavior of energy production are modeled within different research fields, mostly on a scientific or technological level. Published models show a great variety both in methodical approach and in addressed research questions. Within this section, the reviewed papers are classified by their level of detail and complexity of the described AD model and categorized as white, gray, or black box model.

3.4.1. White Box Biogas Process Models

The very popular IWA Anaerobic Digestion No 1 (ADM1) was published in 2002 [31] to model and simulate sewage sludge processes. As an AD process model, it includes both biochemical and physicochemical reactions in a detailed manner. Regarding biochemical reactions, the model consists of an enzymatic disintegration step as an elemental dissociation step of complex organic substrates into their basic components: Carbohydrates, proteins, fats and inert components. The further bacterial degradation of these basic components is modeled as a four-stage system of anaerobic degradation: hydrolysis, acidogenesis, acetogenesis and methanogenesis. Regarding physicochemical reactions, liquid–liquid reactions and gas–liquid exchanges are included.
The ADM1 includes 19 reactions with 24 species and more than 100 parameters. By knowing the characteristics of the input waste or feedstock input, the ADM1 can be applied to calculate representative results for biogas production for different types of feedstock and under different conditions by varying its parameters [72,73].
The ADM1 was widely discussed in several studies with different types of aspects and was reviewed briefly, for example, in [20,74]. Based on its high impact as a white box model to calculate the precise system state of AD and under the influence of rising model predictions for different kinds of research fields, the ADM1 was configured as a software code on different software environments to model and examine the behavior of different input feedstock on the AD process. An ADM1 code included in a graphical programming software environment is presented with SIMBA#®. SIMBA#® is based on MATLAB® Simulink in its initial design. Further development led to an independent commercial software environment based on C# code [75]. SIMBA#® was used in [76] to model a four-chamber biogas digester fed with pig manure and achieved high pH stability of the fermentation substrate inside the digester as a simulation result. AQUASIM, an open source software published in 2013 and using C++ compiler, was created for mathematical modeling and parameter identification of aquatic systems [77]. The implementation of an ADM1 code was successfully used for different research topics, including the performance simulation of a full-scale sludge digester and the validation of its experimental data of about 200 days operated at mesophilic conditions [78]. Using AQUASIM for an ADM1 parameter estimation to predict experimental data (20 days) of a lab-scale digester for the aquatic plants species Hydrilla verticillata (water thyme) [79] led to a well predictable biogas production rate, provided that a parameter optimization of reaction rates was performed. The possibility of integrating an ADM1 program code inside the modeling environment of MATLAB® Simulink led [80] to publish a C code-based ADM1 program code as a possibility of using this code as an S-function (as a graphical coding function block) in Simulink.
Reference [81] built a graphical user interface (GUI) inside the programming environment Python as an easy-to-use possibility for changing model input parameters of the ADM1. The ADM1 itself was implemented as MATLAB® code. Both the GUI modeled in Python and the ADM1 implemented as MATLAB® code resulted in a software tool called the “Anaerobic Digestion Model Simulator v1.0” (ADMS 1.0) that was validated with AQUASIM by a variation of the ADM1 input parameters. A MATLAB® code of the ADM1 was published by the authors of [82] to evaluate the stability of AD and an optimum mixture of different input feedstock. The MATLAB® code incorporates the ADM1 model implementation description in [83]. A GUI was built to run the model without extensive programming skills for the purpose of usability.
The different studies show that the ADM1 is applicable to model and simulate the AD process with different types of feedstock under the use of different types of programming environments. Accordingly, studies use ADM1 to model and simulate complete biogas plants, including energy production.
A model of a micro gas turbine with the dynamic behavior of an electricity conversion system inside MATLAB® Simulink, including the ADM1 modeling description presented in [83], was developed by the authors of [84]. An implementation of a transformation matrix, presented in [85], led to a less difficult description of the ADM1 input parameters to be able to revert to only eleven parameters as more common characteristics of the input substrate (such as ratios of volatile fatty acids, total organic carbon or organic phosphorus). Regarding AD production modeling, species-based mass balance equations describe an anaerobic reactor, including input and output mass flow rates as well as the ADM1 model as mass generation rate. A turbine, generator, inverter and electrical filter were modeled with the Toolbox “Simscape” implemented in the development environment of MATLAB® Simulink. Utilizing a biogas flow rate of 0.03 kg/s and a methane concentration of 48%, the model presents an electrical power production of 24 kW with manure as the feedstock input and demonstrates the functionality of micro gas turbines under biogas production conditions. The biogas system with an integration of the ADM1 simulated both the effect of different types of feedstock on the AD process and the AD process on the resulting gas conditions.
Reference [86] presented the modeling approach DARIES (Dynamic Anaerobic Reactor and Integrated Energy System) in MATLAB® Simulink based on the ADM1 with an additional integration of temperature-dependent kinetics (Arrhenius equation). The biogas model includes a dynamic CHP to produce electrical energy and heat. Heat equations for heat transfer modeling inside the digester were implemented from literature. The simulation results were verified by the use of different real data sets of the database NYSERDA (New York State Energy Research and Development Authority) with hourly monitored performance data including fuel and power information. DARIES was able to verify experimental data with underprediction of the methane production rate by about 12%.
In order to expand the effect of AD on a whole biogas plant and its peripheral technical aggregates, Reference [10] evaluated multiple dynamic component models of the common plant aggregates: Anaerobic digester with ADM1, CHP unit, digestate storage, feedstock input, pumps, heating systems, thermal and electrical energy sinks, and sources. The model was developed inside MATLAB® Simulink as a toolbox under the name “BioOptim”. This method of modeling dynamic component models leads to an adaptable and scalable biogas plant system model, for example, by the multiple use of the anaerobic digester with the integrated ADM1 or CHPs with different sizes and efficiencies. The model approach created further investigations to optimize the control of biogas plants by using a nonlinear model predictive controller [87,88,89] in a validated simulation of a full-scale biogas plant model. The aim of this work was to produce an online control mechanism of the substrate input of a real biogas plant based only on the measurement of the pH value and total biogas production rate with its methane and CO2 concentrations. The nonlinear model predictive controller allowed the definition of optimality criteria leading to an optimized operating mode of the plant in terms of cost/benefits, pH value or VOS/TAC value. The “BioOptim” toolbox is not integrated as an official MATLAB® Simulink toolbox. The model approach leads to the possibility of understanding the effect of AD processes under varying feedstock inputs on a whole biogas plant and, therefore, results in a state space model of the plant. The biogas model mentioned above [10] was successfully used in India to model the biogas potential of biowaste at an educational institute in order to verify experimental data [90]. The simulation resulted in a reduction of 30 to 35% of liquefied petroleum gas substituted by biogas production made of biowaste at the campus site.
The “Dynamic Biogas plant Model” (DyBiM) was introduced as a MATLAB® Simulink simulation in [91] to connect the model of a biogas plant with an electrical energy grid. The AD process was included as an ADM1 with its parameters from literature to describe different types of substrates. Cattle manure and sugar beet were used as reference substrates in this work. Regarding the plant aggregate, a dynamic mass balance of a perfect mixed gas storage was modeled to obtain a homogenous gas mixture depending on different types of feedstock. Compared to the dynamic behavior of the AD, the CHP unit was modeled as a balance equation without any dynamics but is affected by the gas storage levels, which leads to an increasing CHP energy production at higher gas storage levels and vice versa. Operation under Swedish conditions showed that adaptive feeding management due to flexible energy demands and, thereby, flexible CHP production rates led to a reduced gas storage capacity under varying gas ratios, calculated by the broad AMD1.
In order to control this kind of flexible biogas energy production, Reference [92] introduced a MATLAB® biogas model with a proportional and integral gain error (PI) controller which regulates the substrate feed input comparing the methane production rate. The ADM1 was modified to a version called ADM1xp, which allows the use of a Weende analysis of the feedstock to enable the utilization of well-known analytical substrate characteristics. The PI controller could regulate the substrate flow into the digester to cover the energy demand by connecting to a virtual energy demand as a load profile of the region of Emden (Germany). Some differences remained as controller error, however, the methane production covered the demand 79.4% of the time. The PI controller was originally designed for fast systems and could not react to the slow digester behavior to cover a higher methane demand due to instabilities in the simulation.

3.4.2. Gray Box Biogas Process Models

The ADM1 is seldom used to optimize and control full-scale plants due to its high complexity. It needs an extensive dataset regarding the feedstock, which leads to a complex feedstock analysis as a result of missing data available in the literature [93]. Several studies modify the ADM1 or generate simplified AD models. These so-called gray box models reduce the complexity by omitting non-limiting reaction steps and bridge a gap between simplicity and accuracy. This type of model creates the possibility of using practical data of the digester input substrate without knowing all parameters necessary for complex AD models [94], but it requires a parameterization of the mathematical functions obtained and modeled for a specific physical problem.
Based on the idea of flexibly generating energy and, thus, flexible biogas production, Reference [95] modeled an AD process as two differential equations, four parameters of two reaction steps (a fast one for the digestion of carbohydrates and a slow one for the digestion of lipids and proteins). The biogas volume flow rate was calculated as the sum of the flow rates resulting from the two reaction mechanisms. This overall volume flow rate was modeled as transfer function in the Laplace domain with the feedstock as input variable. This model was used to observe the AD behavior under fluctuating input feedstock, leading to a variation of biogas production rates. Using experimental data of a 1.5 m3 digester (1 m3 digestion volume, 0.5 m3 gas storage volume), the simulation results were also compared with the ADM1 and showed a sufficient compliance of both AD process models.
Using a systematical simplification of the ADM1 presented in [96], Reference [97] opened the possibility of relying on four reduced (“R”) AD models, ADM1-R1 to ADM1-R4. The authors implemented these simplifications in a dynamic biogas plant model programmed with dynamic gas storage and CHP models. The simulation was subjected to the German electricity and its European power exchange (EPEX) spot market. Flexible feeding of a biogas plant was investigated to obtain a maximum total revenue on the EPEX spot market under an additional variation of gas storage capacity. The feeding control inside the model was realized by a model predictive controller [98]. This work is still under investigation; a verification of this model with a research biogas plant of the Deutsches Biomasse Forschungszentrum was started at the time of writing this review.
Reference [99] used a time-dependent biogas production flow rate, modeled as exponential function. The biogas volume flow rate depended on feedstock properties, e.g., the organic fraction, its biogas production potential and maximum biogas production rate. The biogas production was modeled and simulated under flexible feedstock input using MATLAB® Simulink. A CHP unit as a balance equation with electrical load dependent efficiencies was included, as was a dynamic gas storage system. The model was verified by real data (daily biogas and electrical energy production and overall thermal energy production of December 2018) of a biogas plant located in Bornholm, Denmark, and could predict its electrical and thermal output well considering the real production data of the biogas plant. The deviation between the real data and the simulation showed averages of 7.7, 0.78 and 1.99% for biogas, electrical and thermal energy production, respectively.
The possibility of utilizing biomass to produce electrical energy, on the one hand, and fuel, on the other hand, is shown in [100], with a model of a combined electrical energy and fuel supply system with compressed natural gas (CNG) as vehicle fuel. A combined MATLAB® and Microsoft Excel® simulation was modeled to emulate the impact of the EPEX spot market regarding the electrical energy production in addition to the impact of filling cycles of CNG for different types of vehicle fleets regarding the CNG production. A dynamic biogas production as AD was modeled as a simple first-order reaction mechanism inside the MATLAB® environment. The input feedstock was presented as a mass flow of degradable substrates (total solids, volatile solids and degradable volatile solids). The AD kinetics calculated a biogas mass flow based on a mass balance equation of the fermenter. In addition to the feedstock input mass flow, an output mass flow, and an accumulation term, a first-order reaction mechanism was implemented into the balance equation generating a biogas mass flow, which was split into methane and CO2 with fixed coefficients. Microsoft Excel® integrated the time-related EPEX spot market benefits and, thus, calculated a methane demand as an overall balance equation of a CHP. Additionally, the vehicle fleet CNG demand was also integrated with Microsoft Excel®. The gas storage model necessary was calculated by adding the methane volume stream produced and subtracting the methane volume stream consumed and optimized in MATLAB® with “fmincon” for fuel consumption profiles of different vehicle fleets (logistics, taxi, waste disposal and agriculture).
The simulation led to the lowest additional costs as a result of additional gas storage capacity not being required for prior fuel production with an electricity production within the remaining hours of biogas production. The slow dynamics of the AD process cannot compensate for a strong biogas demand for the electricity-regulated operation mode of the biogas plant generated from the EPEX spot market.
Simulating the electrical application of a biogas plant, a micro gas turbine with an electrical synchronous generator under the influence of different types of feedstock (here: animal manure) and its resulting methane production rate was designed in MATLAB® Simulink by the authors of [101]. They used a modified Hill [11] model of AD, which responds to the digestate temperature and the input feedstock. The AD steps include hydrolysis, acidogenesis, acetogenesis and methanogenesis and were modeled as differential species balance equations producing methane in the reaction mechanism of the methanogenesis step. The reaction steps were published as Simulink screenshots. In addition to the AD steps, dynamic models of the micro gas turbine with its synchronous electrical generator and a gas storage system are also published in the same way. In order to control the electrical load of the generator, a PID controller (error gain with a proportional, integral differential equation) in Laplace space regulates the biogas flow into the micro gas turbine, while the gas storage is modeled as a buffer to predict the over- or underload of the micro gas turbine. Regarding the AD process simulation, the model was validated using simulation results applied from literature. The model was used for scenario analysis by varying the feedstock input (swine, beef, poultry and dairy manure) and its effect on the methane production rate, as well as the torque and speed of the micro gas turbine.
An integration of biogas energy in off-grid rural areas in India was investigated by [102]. The energy system model contains a biogas digester, a CHP, a water tank (heat buffer), a photovoltaic system with energy storage and load profile of a village in West Bengal; it was built within the software environment HOMER® (by HOMER Energy) as microgrid simulation software. HOMER® was developed as graphical modeling software, which allows the use of complete and adjustable modules of physical systems to integrate their physical behavior into a simulation approach. In the case of the AD process and due to the annual energy demand of the rural village calculated inside HOMER®, the feedstock input necessary was calculated outside HOMER® with a linear equation considering feedstock specific biogas production and volatile solids content. The biogas CHP could fit the electrical load demands and produced 61% of the overall energy demand. The photovoltaic system was basically used to load a battery system to allow base load at night.
Thermal behavior and thermal energy consumption of the AD constitute another research focus and lead to different types of awareness. Using a kinetic model of AD, a methane production rate with one kinetic parameter based on Hill [73], Reference [103] investigated the behavior of a 45 m3 swine manure digester, placed below ground, to simulate the effect of heating the digestate in order to observe higher methane production rates. Thus, the methane production rate depends on an ultimate methane yield as a function of the digestate temperature in addition to hydraulic retention time and an experimentally evaluated kinetic parameter. The heater is modeled as a solar collector on the roof of the digester. A comprehensive dynamic energy equation as thermal model of the digester and biogas is presented, supplemental to the AD kinetic model, including heat flow from the solar collector, heat transfer between the boundary layer of gas and digestate surface, heat losses to the ground and convective heat flows of the input manure mass flow. The authors could show by using the coupled biochemical and thermal model that heating leads to higher methane production and verified the simulation with 240 h of experimental data of days in September.
A hybrid energy system model was developed by [104] to optimize the biogas production of a biogas digester. The MATLAB® Simulink model contained a solar-assisted biogas reactor with a dynamic model of a water tank, electrical gas compressor, gas storage system and a simplified AD model. The methane production rate as an AD model was based on a production rate as a function of hydraulic retention time, a volatile solid concentration of the feedstock with its maximum methane yield and the temperature inside the digester. Energy balance equations considered heat losses to the environment, energy transfer by solar collectors as a function of daytime solar radiation and energy consumption of a gas compressor. The gas storage system contained an overall dynamic mass balance equation. An optimized methane production rate as balance equation containing hydraulic retention time, methane yield of feedstock, and a temperature pending kinetic parameter was predicted for cloudy days using a solar-based heating system with a water tank as a heat buffer. Additional investment costs due to solar collectors, pumps, heat exchanger, valves, pipes and several other components would need 5.5 years to return the investment as result of higher biogas production rates.
The study in [105] covered a similar research field. The authors presented a thermal model of the digester, calculating Nusselt numbers for heat transfer coefficients to simulate heat losses and transfer of a heating system integrated into a digester. A simplified ADM1 was integrated into the model due to the coupling of the model developed with more complex components, such as thermal storage tanks, thermal solar collectors or biogas upgrading units. The model was examined from the plausibility of the AD process: Increasing the input flow rate of the feedstock increased the biogas production rate proportionally and reduced the digester temperature without using a heating system. Increasing the feedstock input flow by 21% (626 to 756 kg/h) led to a proportionally increased biogas flow (96 to 115 kg/h) and a temperature reduction of 1 Kelvin, while increasing the temperature by about 1 Kelvin increased the biogas production by about 0.2% (95.54 to 95.75 kg/h).
Gray box models are also designed for modeling the influence of process parameters on biogas plant operation. As a detailed process simulation model, References [9,106,107] designed an operator training simulator of full-scale biogas plants as a tool for bioprocess engineering education. The AD process inside the simulation was modeled using AMOCO [72]. The simulation approach contained equations for valves, pumps and tanks to generate the possibility of controlling processes inside the model. Designed as an operator training simulator, the model includes a GUI with the possibility of process manipulation using closed control loops or an automatized mode for an interactive simulation. The model was verified with experimental data of a lab-scale biogas reactor (10 L) fed with 42.8 g sucrose, 1.1 g gelatin and 24.1 g rapeseed oil comparing methane and CO2 concentrations and biogas production rates.
Reflecting upon AD process modeling, a simplified ADM1 model of [108] in MATLAB® Simulink was integrated in [8] to simulate the co-digestion of pig manure and glycerin to simulate a methane production rate. Simulation results within this study were verified with experimental data (30 days) using a lab-scale reactor (250 mL volume) due to the standard procedure VDI 4630, while the simulation could predict the methane production rate well. A mixture of 80% pig manure with 20% glycerin led to a methane yield of 215 mL CH4/g COD, while a mono-digestion of pig manure resulted in a methane yield reduction (20%).

3.4.3. Black Box Biogas Process Models

Some fields of research deal with the implementation of artificial neural networks (ANNs) as black box models to predict the behavior of AD without the need for AD mechanisms or the physical laws influencing the model due to the high complexity of AD (white box ADM1 and simplified gray box AD models). Reference [109] used ANNs to predict and optimize the biogas production from one specific digester located in Jordan fed with wastes from slaughterhouses, restaurants and the dairy industry as well as fruit and vegetables. Data measured (total solid, volatile solid, pH value, temperature) were collected over a period of 177 days to train the ANN using the back-propagation method implemented in the ANN toolbox embedded in MATLAB®. The ANN was able to predict the CH4 ratio of biogas of this plant with an accuracy of R2 = 0.87.
Another ANN, published in [110], was developed with experimental data of 25 digesters in lab-scale with a volume of 15 L. A total of 10 L of their volume was fed with hydrothermal pretreated waste, consisting of cow dung, rice bran, banana stem and sawdust in random ratios between 5 and 30%. Measurements of the biogas production rates, pH values and input ratios trained the ANN to predict the biogas production rate of a digester regarding different input substances. In order to realize an ANN that can predict the behavior of the AD of different substrates, it was trained in [111] with randomized datasets as results of the original ADM1, which was modeled in MATLAB® based on [112]. The model produced 12,000 datasets with variations of its protein, carbohydrate and lipid ratios and dilution rates as input parameters. This ANN was built and trained within the Python packages “scikit-lern,” “NumPy,” “PyTorch” and “BFGS.” It could predict equilibrium states of a methane production rate with an accuracy of 99% and dynamic states with an accuracy of 96.7% regarding different input substrates.
Reference [113] used different sizes of the electrical power units on biogas plant sites combined with different biogas storage sizes for a black box model of a biogas plant with renewable energy dispatch simulation. The variation or flexibilization of the feedstock was not investigated; a constant biogas production with constant characteristics was accepted inside the model. The gas storage system model was composed of an overall mass balance equation. A cost minimization by selling electrical power on the German energy spot market with a flexible premium (Renewable Energy Act 2012) was calculated with time-dependent earnings. Increasing the CHP capacity installed from 600 kWel by a factor 3.3 to 2 MWel with simultaneously increased biogas storage capacity (factor 1.4) led to the highest profit on the spot market, but additional benefits cannot be expected without a flexible premium.
Investigating not only additional gas storage systems but also additional heat storage capacity of an existing flexible biogas power plant (1360 kWel flexible) without feedstock effects is done in [114,115] inside the simulation program IPSEpro® as flowchart-based modeling software. The model includes tanks (hygienization, mixing, fermentation and digestate storage), a gas storage and upgrade system, and a CHP. The biogas production was integrated as a timeline with real one-year data as output information of the fermentation tank. The CHP model consisted of energy balance equations. Gas and heat storage systems were modeled by mass and energy balance equations. The implementation of a gas upgrade system was done as a black box model. Additional heat storage (water) led to additional income. The existing gas storage capacity (4800 m3) could provide control energy reserves and biomethane production simultaneously.

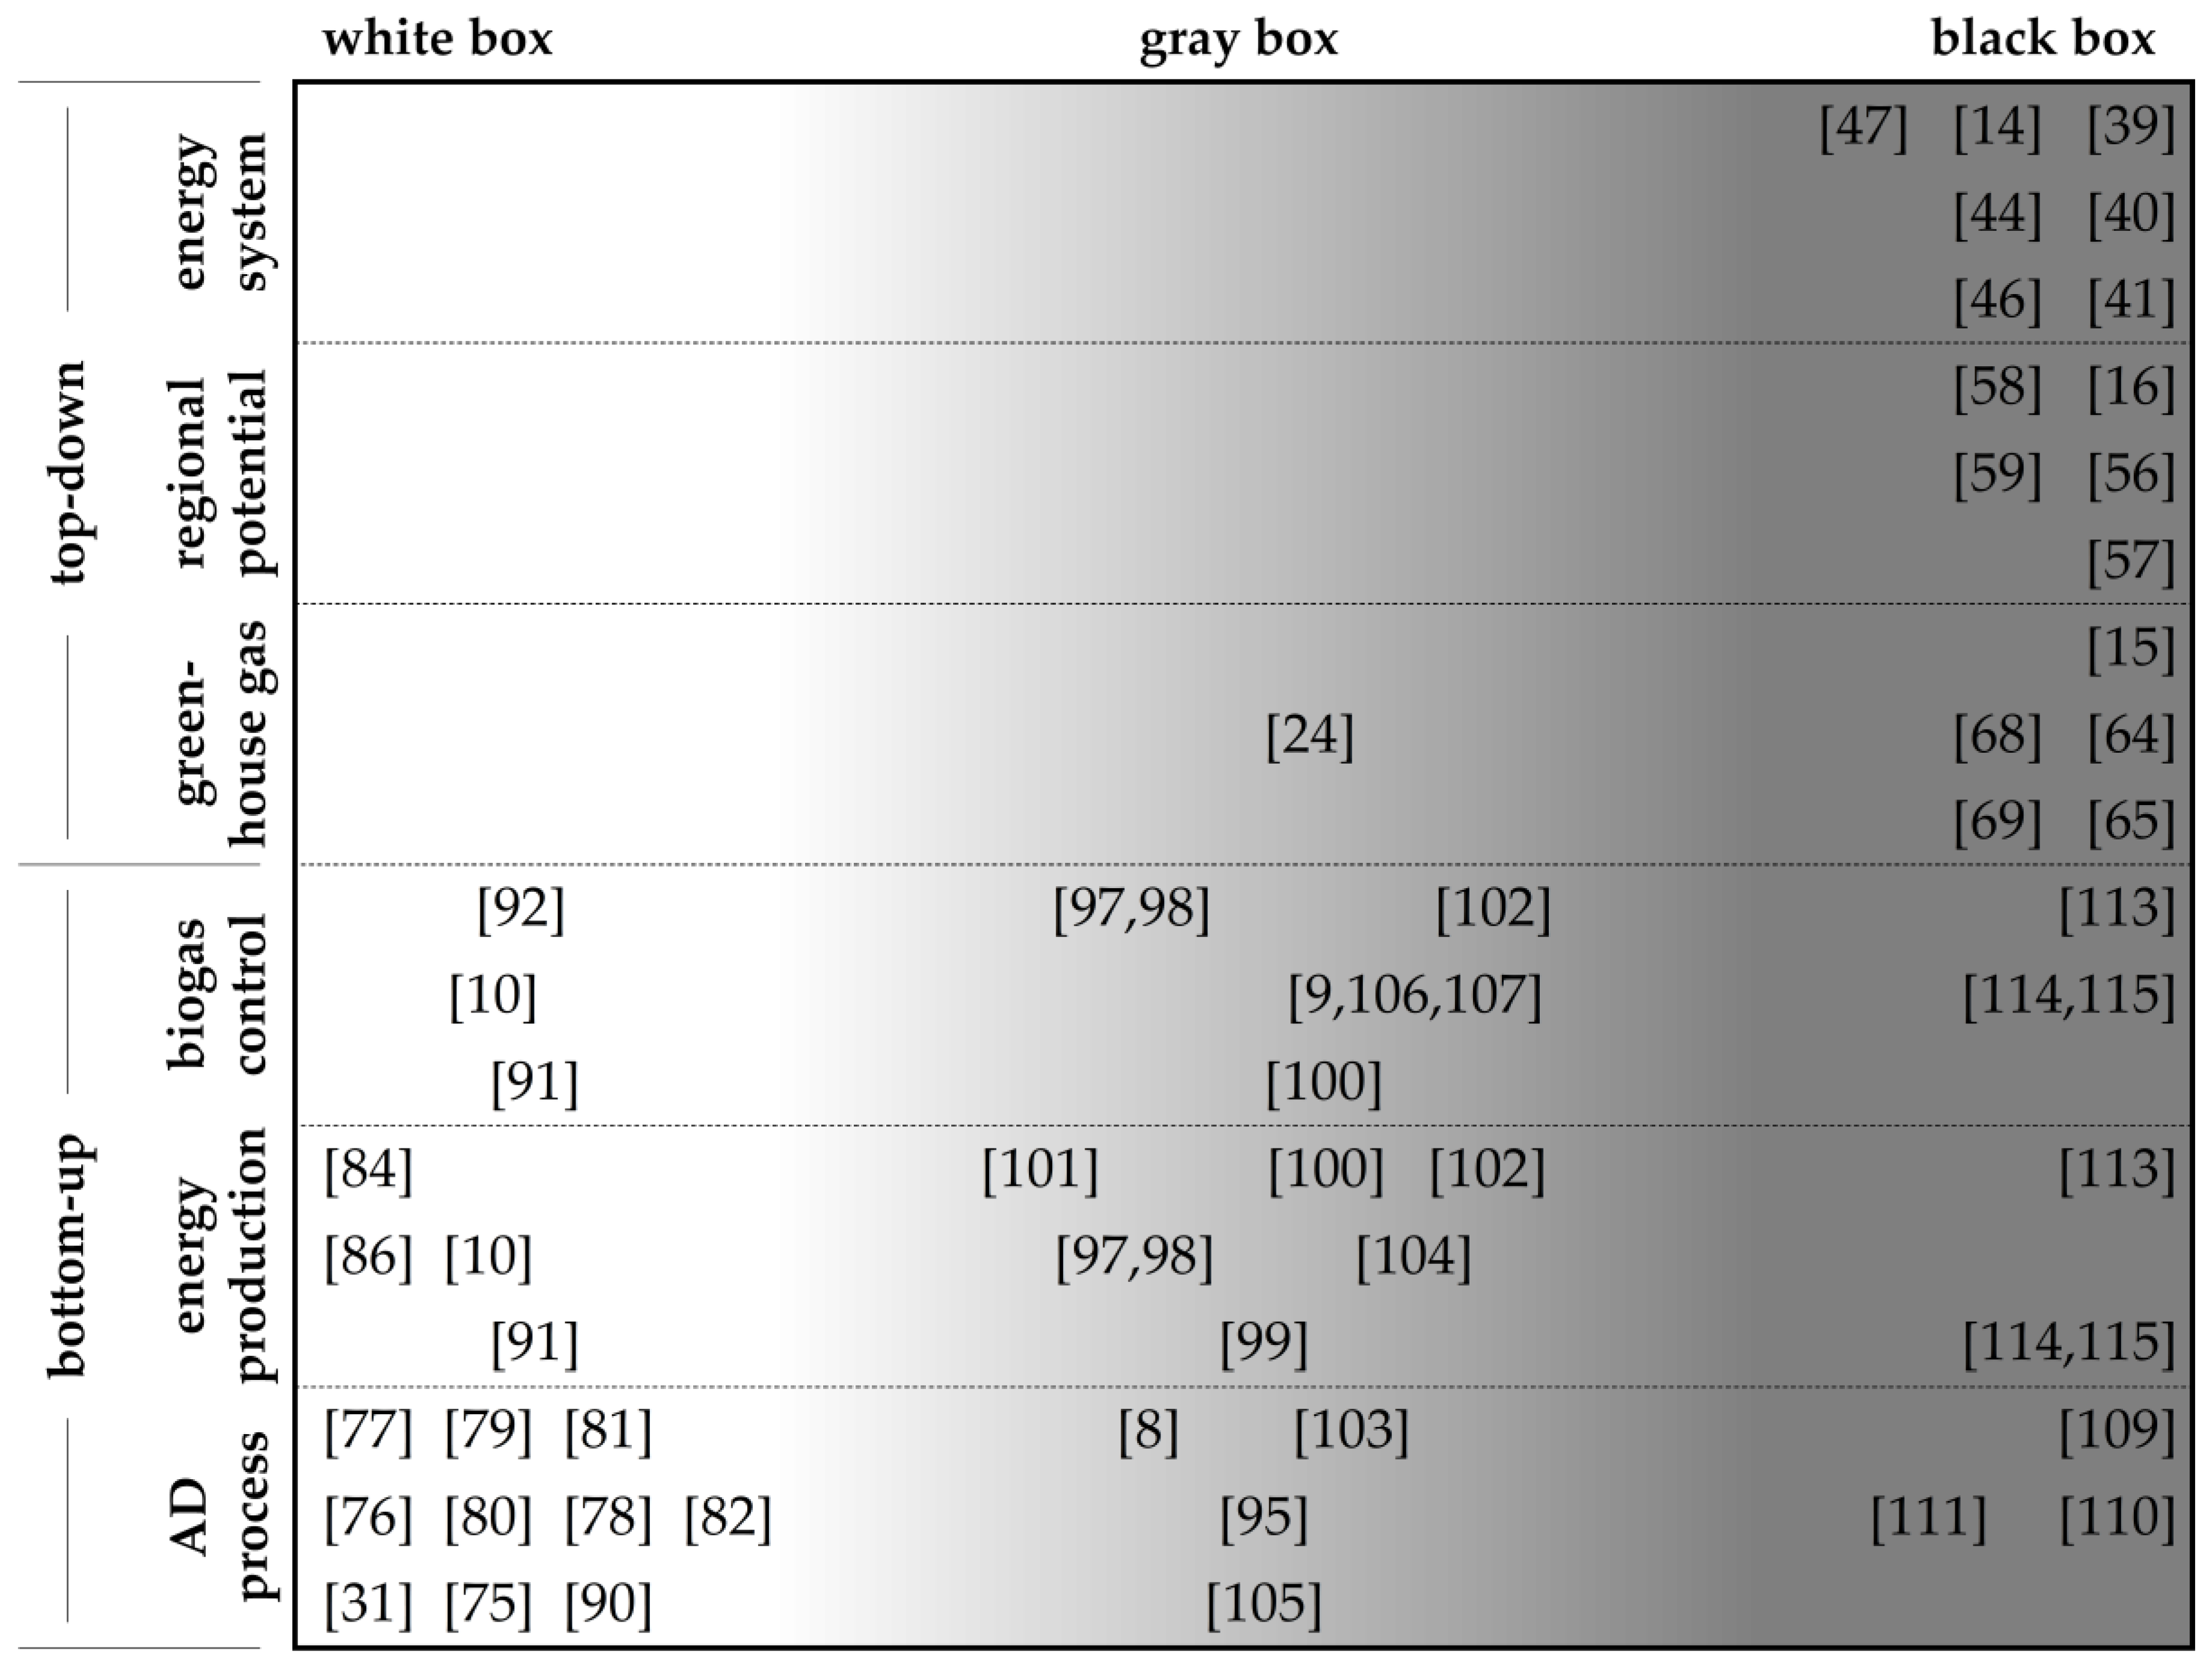
3.5. Overview of Classified Models

The considered and classified models are summarized in Table 1 and Table 2, separated by top-down and bottom-up modelling approaches [37].
Table 1 shows all publications that reflect an aggregated view on biogas production as top-down-approach. Table 2, on the other hand, shows those publications that look at biogas production in more detail as top-down approach.

4. Discussion

The literature review shows that substantial research and development of models for biogas production was carried out in the last 18 years. Regarding biogas modeling on a process level (anaerobic digestion), these models differ substantially from modeling biogas for potential analysis, GHG emissions and in an energy system. This is reflected in Table 1 and Table 2: Table 2 (top-down) contains biogas model on process level that are not reflected in Table 1 (bottom-up) with models of potential analysis, GHG emissions and energy systems. This different modeling approach of the energy system and the AD perspective can broadly be regarded as top-down and bottom-up approaches, respectively.
Dynamic biogas models contain detailed information about AD processes, technical systems and time-dependent conditions and, thus, generate a complexity that is not to be disregarded. This bottom-up modeling approach differs from the top-down modeling approach used in energy systems, LCA and GIS models. In these models, holistic effects are modeled on a national or regional level [37].
Figure 5 shows the complexity of the mathematical mapping of biogas production within the discipline or view on the biogas system that the different studies represent.
Many studies are available in the field of dynamic AD process modeling which deal with ADM1 at a high level of detail. These studies also published programs and source code, allowing great transparency of their results. In addition to complex AD process modeling, simplified AD models have been developed and applied many times. These are based partly on the well-known ADM1, but studies also developed simplified models without relying on ADM1 findings. They led to an easier use of AD models with less parameter input compared to ADM1. On a low-detail level (black box), ANNs were used for different types of problem description: Modeling the behavior of a specific plant, different feedstock conditions, or generating a black box model of the deeply detailed ADM1. Both detailed ADM1 and simplified AD models and black box models are applied for energy conversion and biogas control of full-scale biogas plants. Research in the area of dynamic process modeling is well penetrated in terms of both highly detailed and highly abstracted models, including the thermal behavior of digesters. Energy production models with a detailed and simplified AD process description were focused on studies including additional components, such as micro gas turbines with power electronics or CHP units.
The field of top-down models that regard the biogas plant as part of a greater energy system, on the other hand, contains a very high proportion of black box assumptions regarding anaerobic biogas production. No publications that model the behavior of biogas production dynamically have been found within this literature study at the regional level or in energy system modeling. The top-down approaches are used to determine, capture and further process biogas potentials via simple linear equations. The picture is similar in the area of GHG emissions. The prediction of GHG emissions was modeled mostly by including simple dependencies of biogas production. Only one publication was found that used a dynamic AD model (AMOCO) and is backed by LCA data to be able to reduce GHG emissions within a dynamic model.

5. Conclusions

Biogas plants in energy systems can either be modeled as bottom-up approach which focusses on the detailed mathematical description of the anaerobic process, or as top-down approach which focusses on questions of the overall energy system, such as demand coverage, GHG, or spatial potential studies. The model approaches depend on the research discipline, as well as on the required level of detail.
Dynamic model approaches of the anaerobic digestion have been intensely investigated and are widely published in literature. Integration of dynamic biogas plant models (bottom-up approach) into the modeling disciplines of top-down models (energy systems, regional or emission studies) was not field of research in the reviewed literature between 2002 and 2020. This is possibly explainable by the different academic fields that published the respective studies. Energy system modeling falls mainly into energy science, AD modeling into waste and water science or microbiology, and regional modeling into geographical science.
To date, biogas production has been implemented as black box models in energy system modeling. By calculating the annual biogas potential, the dynamic influence of biogas production in energy system models was considered through storage systems (e.g., biogas storage tanks). This was sufficient for the mapping of a fluctuating electrical and thermal energy production from renewable energies. Herein, the biogas storage as buffer mapped the dynamics of the biogas production.
However, new questions around biogas plants in renewable energy systems might require more detailed process models. For example, fluctuating input feedstock (both in terms of quantity and substrate composition), e.g., caused by seasonal input shifts or specific substrate control in biogas plants, generates a system response within the anaerobic fermentation, which cannot be represented in black box models. It leads to a dynamic in the gas production and thus requires dynamic white or gray box models.
The strength of the implementation of a dynamic AD model in the modeling of energy systems lies in the application of well-established process models, which were comprehensively optimized over a long period of time. Moreover, these dynamic process models have emerged from different research disciplines with different perspectives that can be applied in energy system models at differentiable levels of detail.
However, a weakness of the integration of very extensive models (such as the ADM1) is their high level of complexity, which can entail very computational capacity-binding processes in energy system models. In addition, the availability of all model parameters for the description of the input feedstock (e.g., organic residues and waste materials or straw-like materials) is questionable. This entails the risk that model parameters must be assumed or estimated for unknown substrates. Uncertainties and thus model errors would be the consequence and would lead to inaccurate and unrealistic results. In addition, there is an increased risk that highly detailed AD process modeling will make the complexity of an energy system model unmanageable.
Nevertheless, the integration of a dynamic AD model into energy systems results in the development of previously unknown dynamic and fluctuating business models as an opportunity. In this context, detailed illustrations of the AD process can reveal limiting factors that could not previously be represented by black-box models.
Publications in literature offer a wide variation of different model approaches of the biogas process—white, gray, and black box models—which are not yet considered in energy system modeling.
A cross-disciplinary linkage of different approaches, i.e., the implementation of dynamic modeling into energy system studies, offers the possibility of controlling regional and temporally varying aspects in the energy system with the influence of dynamic boundary conditions, which can be generated from the process modeling. Slow reactions within the AD process, maximum hydraulic retention times, critical states of the digestion process or dynamic gas compositions can influence, e.g., the usability of regionally available substrates, the demand-orientated biogas production or the temporally and locally CO2 emission minimization.
This review paper provides a comprehensive overview on available modeling options. For future implementation of dynamic biogas models in energy systems, the necessary level of detail should be thoroughly evaluated, considering the strengths and weaknesses of high complex models on the one hand and the knowledge gain on the other hand.

Author Contributions

Conceptualization: M.H., S.R. and T.W.; methodology: M.H.; investigation: M.H.; writing—original draft preparation: M.H.; writing—review and editing: M.K., A.M. and S.R.; supervision: M.K. and S.R.; project administration: S.R. and T.W.; funding acquisition: S.R. and T.W. All authors have read and agreed to the published version of the manuscript.

Funding

This research was funded by the German Federal Environmental Foundation, grant number AZ 34663.

Conflicts of Interest

The authors declare no conflict of interest.

References

  1. Chmiel, H. Bioprozesstechnik; G. Fischer: Stuttgart, Germany, 2011. [Google Scholar]
  2. Kapoor, R.; Ghosh, P.; Kumar, M.; Vijay, V.K. Evaluation of biogas upgrading technologies and future perspectives: A review. Environ. Sci. Pollut. Res. Int. 2019, 26, 11631–11661. [Google Scholar] [CrossRef]
  3. Thrän, D.; Schaubach, K.; Majer, S.; Horschig, T. Governance of sustainability in the German biogas sector—Adaptive management of the Renewable Energy Act between agriculture and the energy sector. Energy Sustain. Soc. 2020, 10. [Google Scholar] [CrossRef]
  4. Trommler, M.; Dotzauer, M.; Hennig, C. Flexibilisierung von Biogasanlagen in Deutschland: Ein Überblick zu technischen Ansätzen, Rechtlichen Rahmen und Bedeutung für das Energiesystem; DBFZ Deutsches Biomasseforschungszentrum gemeinnützige GmbH: Leizpig, Germany, 2016. [Google Scholar]
  5. Fachagentur Nachwachsende Rohstoffe e.V. (FNR) Agency for Renewable Resources. In Bioenergy in Germany Facts and Figures 2020: Solid Fuels, Biofuels, Biogas; Fachagentur Nachwachsende Rohstoffe e.V.: Gülzow, Germany, 2020. [Google Scholar]
  6. Biernacki, P.; Steinigeweg, S.; Borchert, A.; Uhlenhut, F.; Brehm, A. Application of Anaerobic Digestion Model No. 1 for describing an existing biogas power plant. Biomass Bioenergy 2013, 59, 441–447. [Google Scholar] [CrossRef]
  7. Page, D.I.; Hickey, K.L.; Narula, R.; Main, A.L.; Grimberg, S.J. Modeling anaerobic digestion of dairy manure using the IWA Anaerobic Digestion Model no. 1 (ADM1). Water Sci. Technol. 2008, 58, 689–695. [Google Scholar] [CrossRef] [PubMed]
  8. Astals, S.; Ariso, M.; Galí, A.; Mata-Alvarez, J. Co-digestion of pig manure and glycerine: Experimental and modelling study. J. Environ. Manag. 2011, 92, 1091–1096. [Google Scholar] [CrossRef] [PubMed]
  9. Blesgen, A.; Hass, V.C. Operator training simulator for anaerobic digestion processes. IFAC Proc. Vol. 2010, 43, 353–358. [Google Scholar] [CrossRef]
  10. Gaida, D.; Wolf, C.; Bongards, M. MATLAB Toolbox for biogas plant modelling and optimization. In Proceedings of the Progress in Biogas II, Stuttgart-Hohenheim, Germany, 30 March–1 April 2011. [Google Scholar]
  11. Hill, D.T.; Barth, C.L. A dynamic model for simulation of animal waste digestion. Water Pollut. Control Fed. 1977, 49, 2129–2143. [Google Scholar]
  12. Andrews, J.F.; Graef, S.P. Dynamic modeling and simulation of the anaerobic digestion process. Anaerob. Biol. Treat. Process. 1971, 105, 126–162. [Google Scholar] [CrossRef]
  13. Andrews, J.F. Dynamic model of the anaerobic digestion process. J. Sanit. Eng. Div. 1969, 95, 95–116. [Google Scholar] [CrossRef]
  14. Korberg, A.D.; Skov, I.R.; Mathiesen, B.V. The role of biogas and biogas-derived fuels in a 100% renewable energy system in Denmark. Energy 2020, 199, 117426. [Google Scholar] [CrossRef]
  15. Dressler, D.; Loewen, A.; Nelles, M. Life cycle assessment of the supply and use of bioenergy: Impact of regional factors on biogas production. Int. J. Life Cycle Assess. 2012, 17, 1104–1115. [Google Scholar] [CrossRef]
  16. Silva, S.; Alçada-Almeida, L.; Dias, L.C. Multiobjective programming for sizing and locating biogas plants: A model and an application in a region of Portugal. Comput. Oper. Res. 2017, 83, 189–198. [Google Scholar] [CrossRef]
  17. Pavlostathis, S.G.; Giraldo-Gomez, E. Kinetics of anaerobic treatment: A critical review. Crit. Rev. Environ. Control 1991, 21, 411–490. [Google Scholar] [CrossRef]
  18. Kythreotou, N.; Florides, G.; Tassou, S.A. A review of simple to scientific models for anaerobic digestion. Renew. Energy 2014, 71, 701–714. [Google Scholar] [CrossRef]
  19. Thorin, E.; Nordlander, E.; Lindmark, J.; Dahlquist, E.; Yan, J.; Bel Fdhila, R. Modeling of the biogas production process—A review. In Proceedings of the International Conference on Applied Energy ICAE, Suzhou, China, 5–8 July 2012. [Google Scholar]
  20. Donoso-Bravo, A.; Mailier, J.; Martin, C.; Rodríguez, J.; Aceves-Lara, C.A.; Vande Wouwer, A. Model selection, identification and validation in anaerobic digestion: A review. Water Res. 2011, 45, 5347–5364. [Google Scholar] [CrossRef]
  21. Ringkjøb, H.-K.; Haugan, P.M.; Solbrekke, I.M. A review of modelling tools for energy and electricity systems with large shares of variable renewables. Renew. Sustain. Energy Rev. 2018, 96, 440–459. [Google Scholar] [CrossRef]
  22. Salvador, R.; Barros, M.V.; Rosário, J.G.D.P.D.; Piekarski, C.M.; Luz, L.M.; Francisco, A.C. Life cycle assessment of electricity from biogas: A systematic literature review. Environ. Prog. Sustain. Energy 2019, 38, 13133. [Google Scholar] [CrossRef]
  23. Ingrao, C.; Bacenetti, J.; Adamczyk, J.; Ferrante, V.; Messineo, A.; Huisingh, D. Investigating energy and environmental issues of agro-biogas derived energy systems: A comprehensive review of Life Cycle Assessments. Renew. Energy 2019, 136, 296–307. [Google Scholar] [CrossRef]
  24. Ertem-Kappler, F.C. Life Cycle Assessment and Modelling Approaches as a Combined Evaluation Tool for Sustainable Control Strategies at Biogas Plants. Ph.D. Thesis, Technische Universität Berlin, Berlin, Germany, 2019. [Google Scholar]
  25. Hijazi, O.; Munro, S.; Zerhusen, B.; Effenberger, M. Review of life cycle assessment for biogas production in Europe. Renew. Sustain. Energy Rev. 2016, 54, 1291–1300. [Google Scholar] [CrossRef]
  26. Esteves, E.M.M.; Herrera, A.M.N.; Esteves, V.P.P.; Morgado, C.d.R.V. Life cycle assessment of manure biogas production: A review. J. Clean. Prod. 2019, 219, 411–423. [Google Scholar] [CrossRef]
  27. Bacenetti, J.; Sala, C.; Fusi, A.; Fiala, M. Agricultural anaerobic digestion plants: What LCA studies pointed out and what can be done to make them more environmentally sustainable. Appl. Energy 2016, 179, 669–686. [Google Scholar] [CrossRef] [Green Version]
  28. Meroney, R.N.; Colorado, P.E. CFD simulation of mechanical draft tube mixing in anaerobic digester tanks. Water Res. 2009, 43, 1040–1050. [Google Scholar] [CrossRef]
  29. Barnert, T.; Piesik, E.; Śliwiński, M. Real-time simulator of agricultural biogas plant. Comput. Electron. Agric. 2014, 108, 1–11. [Google Scholar] [CrossRef]
  30. Arzate Salgado, J.A. Modeling and Simulation of Biogas Production Based on Anaerobic Digestion of Energy Crops and Manure. Ph.D. Thesis, Technische Universität Berlin, Berlin, Germany, 2018. [Google Scholar]
  31. IWA Task Group for Mathematical Modelling of Anaerobic Digestion. Anaerobic Digestion Model No. 1 (ADM1); IWA Publishing: London, UK, 2002; ISBN 9781780403052. [Google Scholar]
  32. Stanescu, L.A.; Robescu, L.D.; Futselaar, H. Biogas production modeling and simulation in low end conditions. In Proceedings of the 2017 International Conference on Energy and Environment (CIEM), Bucharest, Romania, 19–20 October 2017. [Google Scholar]
  33. Carr, P. How to Read a Paper Efficiently (By Prof. Pete Carr). Available online: https://www.youtube.com/watch?v=IeaD0ZaUJ3Y (accessed on 10 February 2021).
  34. Isermann, R.; Münchhof, M. Identification of Dynamic Systems: An Introduction with Applications, 2011th ed.; Springer: Berlin, Germany, 2014; ISBN 978-3-642-42267-6. [Google Scholar]
  35. Tarr, M. Modelling—Choosing a Model. Available online: http://www.idc-online.com/technical_references/pdfs/electronic_engineering/Modelling_Choosing_a_Model.pdf (accessed on 15 February 2021).
  36. Zhang, P. Industrial control system simulation routines. In Advanced Industrial Control Technology; Elsevier: Amsterdam, The Netherlands, 2010; pp. 781–810. ISBN 9781437778076. [Google Scholar]
  37. Herbst, A.; Toro, F.; Reitze, F.; Jochem, E. Introduction to energy systems modelling. Swiss J. Econ. Stat. 2012, 148, 111–135. [Google Scholar] [CrossRef] [Green Version]
  38. Hilpert, S.; Kaldemeyer, C.; Krien, U.; Günther, S.; Wingenbach, C.; Plessmann, G. The Open Energy Modelling Framework (oemof)—A new approach to facilitate open science in energy system modelling. Energy Strategy Rev. 2018, 22, 16–25. [Google Scholar] [CrossRef] [Green Version]
  39. Möller, C.; Rosenberger, S.; Faulstich, M. Speicherbedarf in energieregionen unter berücksichtigung verschiedener autarkiegrade. In Proceedings of the 9 Internationale Energiewirtschaftstagung an der TU Wien, Vienna, Austria, 19 October 2015. [Google Scholar]
  40. Möller, C.; Faulstich, M.; Rosenberger, S. Urban-rural relations in renewable electric energy supply—The case of a German energy region. Int. J. Sustai. Energy Plan. Manag. 2019, 21. [Google Scholar] [CrossRef]
  41. Bamisile, O.; Huang, Q.; Li, J.; Dagbasi, M.; Desire Kemena, A.; Abid, M.; Hu, W. Modelling and performance analysis of an innovative CPVT, wind and biogas integrated comprehensive energy system: An energy and exergy approach. Energy Convers. Manag. 2020, 209, 112611. [Google Scholar] [CrossRef]
  42. F-Chart Software. EES: Engineering Equation Solver. Available online: http://fchartsoftware.com/ees/index.php/ (accessed on 10 February 2021).
  43. The Balmorel Open Source Project. Balmorel Energy System Model. Available online: http://www.balmorel.com/ (accessed on 15 February 2021).
  44. Münster, M.; Meibom, P. Optimization of use of waste in the future energy system. Energy 2011, 36, 1612–1622. [Google Scholar] [CrossRef] [Green Version]
  45. Department of Development and Planning, Aalborg University. EnergyPLAN—Advanced Energy System Analysis Computer Model. Available online: https://www.energyplan.eu (accessed on 15 February 2021).
  46. Sveinbjörnsson, D.; Ben Amer-Allam, S.; Hansen, A.B.; Algren, L.; Pedersen, A.S. Energy supply modelling of a low-CO2 emitting energy system: Case study of a Danish municipality. Appl. Energy 2017, 195, 922–941. [Google Scholar] [CrossRef] [Green Version]
  47. Chiodi, A.; Gargiulo, M.; Rogan, F.; Deane, J.P.; Lavigne, D.; Rout, U.K.; Ó Gallachóir, B.P. Modelling the impacts of challenging 2050 European climate mitigation targets on Ireland’s energy system. Energy Policy 2013, 53, 169–189. [Google Scholar] [CrossRef]
  48. Weinand, J.M.; Scheller, F.; McKenna, R. Reviewing energy system modelling of decentralized energy autonomy. Energy 2020, 203, 117817. [Google Scholar] [CrossRef]
  49. Keirstead, J.; Jennings, M.; Sivakumar, A. A review of urban energy system models: Approaches, challenges and opportunities. Renew. Sustain. Energy Rev. 2012, 16, 3847–3866. [Google Scholar] [CrossRef] [Green Version]
  50. Mirakyan, A.; De Guio, R. Integrated energy planning in cities and territories: A review of methods and tools. Renew. Sustain. Energy Rev. 2013, 22, 289–297. [Google Scholar] [CrossRef]
  51. Gamarra, C.; Guerrero, J.M. Computational optimization techniques applied to microgrids planning: A review. Renew. Sustain. Energy Rev. 2015, 48, 413–424. [Google Scholar] [CrossRef] [Green Version]
  52. Scheller, F.; Bruckner, T. Energy system optimization at the municipal level: An analysis of modeling approaches and challenges. Renew. Sustain. Energy Rev. 2019, 105, 444–461. [Google Scholar] [CrossRef]
  53. Bonham-Carter, G. Geographic Information Systems for Geoscientists: Modelling with GIS, 1st ed.; Pergamon: Oxford, UK, 2010; ISBN 0080418678. [Google Scholar]
  54. van Haaren, R.; Fthenakis, V. GIS-based wind farm site selection using spatial multi-criteria analysis (SMCA): Evaluating the case for New York State. Renew. Sustain. Energy Rev. 2011, 15, 3332–3340. [Google Scholar] [CrossRef]
  55. Latinopoulos, D.; Kechagia, K. A GIS-based multi-criteria evaluation for wind farm site selection. A regional scale application in Greece. Renew. Energy 2015, 78, 550–560. [Google Scholar] [CrossRef]
  56. Batzias, F.A.; Sidiras, D.K.; Spyrou, E.K. Evaluating livestock manures for biogas production: A GIS based method. Renew. Energy 2005, 30, 1161–1176. [Google Scholar] [CrossRef]
  57. Lovrak, A.; Puksec, T.; Duic, N. A Geographical Information System based approach for assessing the spatial distribution and seasonal variation of biogas production potential from agricultural residues and municipal biowaste. Appl. Energy 2020, 267, 115010. [Google Scholar] [CrossRef]
  58. Huopana, T.; Song, H.; Kolehmainen, M.; Niska, H. A regional model for sustainable biogas electricity production: A case study from a Finnish province. Appl. Energy 2013, 102, 676–686. [Google Scholar] [CrossRef]
  59. Höhn, J.; Lehtonen, E.; Rasi, S.; Rintala, J. A Geographical Information System (GIS) based methodology for determination of potential biomasses and sites for biogas plants in southern Finland. Appl. Energy 2014, 113, 1–10. [Google Scholar] [CrossRef]
  60. Deutsches Institut für Normung. DIN EN ISO 14040, Deutsche Fassung EN ISO 14040:2006 + A1:2020; Beuth Verlag GmbH: Berlin, Germany, 2021. [Google Scholar]
  61. Deutsches Institut für Normung. DIN EN ISO 14044, Deutsche Fassung EN ISO 14044:2006 + A1:2018 + A2:2020; Beuth Verlag GmbH: Berlin, Germany, 2021. [Google Scholar]
  62. Klöpffer, W. Background and Future Prospects in Life Cycle Assessment; Springer: Dordrecht, Germany, 2014; ISBN 9789402407815. [Google Scholar]
  63. Sphera Solutions, Inc. GaBi Solutions. Available online: http://www.gabi-software.com/deutsch/index (accessed on 10 February 2021).
  64. Lansche, J.; Müller, J. Life cycle assessment of energy generation of biogas fed combined heat and power plants: Environmental impact of different agricultural substrates. Eng. Life Sci. 2012, 12, 313–320. [Google Scholar] [CrossRef]
  65. Ertem, F.C.; Martínez-Blanco, J.; Finkbeiner, M.; Neubauer, P.; Junne, S. Life cycle assessment of flexibly fed biogas processes for an improved demand-oriented biogas supply. Bioresour. Technol. 2016, 219, 536–544. [Google Scholar] [CrossRef] [PubMed]
  66. Ecoinvent. Available online: https://www.ecoinvent.org/ (accessed on 15 February 2021).
  67. PRé Sustainability B.V. SimaPro. Available online: https://simapro.com/ (accessed on 15 February 2021).
  68. Navickas, K.; Venslauskas, K.; Zuperka, V.; Nekrosius, A.; Kulikauskas, T. Influence of different biomass treatment technologies on efficiency of biogas production. In Proceedings of the 11 International Scientific Conference Engineering for Rural Development, Jelgava, Latvia, 24–25 May 2012. [Google Scholar]
  69. Jury, C.; Benetto, E.; Koster, D.; Schmitt, B.; Welfring, J. Life Cycle Assessment of biogas production by monofermentation of energy crops and injection into the natural gas grid. Biomass Bioenergy 2010, 34, 54–66. [Google Scholar] [CrossRef]
  70. ifu Hamburg. Stoffstrommanagement & Ökobilanzen mit der Software Umberto. Available online: https://www.ifu.com/umberto (accessed on 25 March 2021).
  71. Arzate, J.A.; Kirstein, M.; Ertem, F.C.; Kielhorn, E.; Ramirez Malule, H.; Neubauer, P.; Cruz-Bournazou, M.N.; Junne, S. Anaerobic Digestion Model (AM2) for the Description of Biogas Processes at Dynamic Feedstock Loading Rates. Chem. Ing. Tech. 2017, 89, 686–695. [Google Scholar] [CrossRef]
  72. Bernard, O.; Hadj-Sadok, Z.; Dochain, D.; Genovesi, A.; Steyer, J.P. Dynamical model development and parameter identification for an anaerobic wastewater treatment process. Biotechnol. Bioeng. 2001, 75, 424–438. [Google Scholar] [CrossRef]
  73. Hill, D.T. Design of Digestion Systems for Maximum Methane Production. Trans. ASAE 1982, 25, 226–230. [Google Scholar] [CrossRef]
  74. Batstone, D.J.; Keller, J.; Steyer, J.P. A review of ADM1 extensions, applications, and analysis: 2002–2005. Water Sci. Technol. 2006, 54, 1–10. [Google Scholar] [CrossRef]
  75. ifak—Institut für Automation und Kommunikation. SIMBA#Biogas. Available online: https://www.ifak.eu/de/produkte/simba-biogas (accessed on 10 February 2021).
  76. Wett, B.; Schoen, M.; Phothilangka, P.; Wackerle, F.; Insam, H. Model-based design of an agricultural biogas plant: Application of anaerobic digestion model no. 1 for an improved four chamber scheme. Water Sci. Technol. 2007, 55, 21–28. [Google Scholar] [CrossRef] [PubMed]
  77. Eawag Aquatic Research. Software. Available online: https://www.eawag.ch/de/abteilung/siam/software/ (accessed on 10 February 2021).
  78. Ersahin, M.E. Modeling the dynamic performance of full-scale anaerobic primary sludge digester using Anaerobic Digestion Model No. 1 (ADM1). Bioprocess Biosyst. Eng. 2018, 41, 1539–1545. [Google Scholar] [CrossRef] [PubMed]
  79. Chen, X.; Chen, Z.; Wang, X.; Huo, C.; Hu, Z.; Xiao, B.; Hu, M. Application of ADM1 for modeling of biogas production from anaerobic digestion of Hydrilla verticillata. Bioresour. Technol. 2016, 211, 101–107. [Google Scholar] [CrossRef]
  80. Jeppsson, U. Investigation of Anaerobic Digestion Alternatives for Henriksdal’s WWTP; Department of Industrial Electrical Engineering and Automation, Lund University: Lund, Sweden, 2007. [Google Scholar]
  81. Carlini, M.; Castellucci, S.; Mennuni, A.; Selli, S. Simulation of anaerobic digestion processes: Validation of a novel software tool ADM1-based with AQUASIM. Energy Rep. 2020, 6, 102–115. [Google Scholar] [CrossRef]
  82. Danielsson, O. Modeling and Simulation of Anaerobic Manure Digestion into Biogas. Master’s Thesis, Chalmers University of Technology, Gothenburg, Sweden, 2014. [Google Scholar]
  83. Rosen, C.; Jeppsson, U. Aspects on ADM1 Implementation within the BSM2 Framework; Department of Industrial Electrical Engineering and Automation, Lund University: Lund, Sweden, 2008. [Google Scholar]
  84. Morales Garcia, L.A.; Rodriguez Vargas, A.D.; Rojas Cubides, H.E. Computational Model of an Electric Power Generation System based on Biogas obtained from Cattle Manuerodelo. Pist. Educ. 2020, 42, 1091–1110. [Google Scholar]
  85. Zaher, U.; Buffiere, P.; Steyer, J.P.; Chen, S. A procedure to estimate proximate analysis of mixed organic wastes. Water Environ. Res. 2009, 81, 407–415. [Google Scholar] [CrossRef] [PubMed]
  86. Brouwer, A.F.; Grimberg, S.J.; Powers, S.E. The Dynamic Anaerobic Reactor & Integrated Energy System (DARIES) model: Model development, validation, and sensitivity analysis. Water Environ. Res. 2012, 84, 2090–2098. [Google Scholar] [CrossRef] [PubMed]
  87. Gaida, D.; Brito, A.L.S.; Wolf, C.; Bäck, T.; Bongards, M.; McLoone, S. Optimal control of biogas plants using nonlinear model predictive control. In Proceedings of the International Signals and Systems Conference (ISSC 2011), Dublin, Ireland, 23–24 June 2011. [Google Scholar]
  88. Gaida, D.; Wolf, C.; Meyer, C.; Stuhlsatz, A.; Lippel, J.; Bäck, T.; Bongards, M.; McLoone, S. State estimation for anaerobic digesters using the ADM1. Water Sci. Technol. 2012, 66, 1088–1095. [Google Scholar] [CrossRef]
  89. Gaida, D.; Wolf, C.; Back, T.; Bongards, M. Nonlinear model predictive substrate feed control of biogas plants. In Proceedings of the 20th Mediterranean Conference on Control & Automation (MED), Barcelona, Spain, 3–6 July 2012. [Google Scholar]
  90. Glivin, G.; Sekhar, S. Experimental and Analytical Studies on the Utilization of Biowastes Available in an Educational Institution in India. Sustainability 2016, 8, 1128. [Google Scholar] [CrossRef] [Green Version]
  91. Grim, J.; Nilsson, D.; Hansson, P.-A.; Nordberg, Å. Demand-Orientated Power Production from Biogas: Modeling and Simulations under Swedish Conditions. Energy Fuels 2015, 29, 4066–4075. [Google Scholar] [CrossRef] [Green Version]
  92. Peters, L.; Biernacki, P.; Quaghebeur, W.; Uhlenhut, F.; Steinigeweg, S. Model-based control for a demand-driven biogas production to cover residual load rises. Bioprocess Biosyst. Eng. 2019, 42, 1829–1841. [Google Scholar] [CrossRef]
  93. Ficara, E.; Hassam, S.; Allegrini, A.; Leva, A.; Malpei, F.; Ferretti, G. Anaerobic Digestion Models: A Comparative Study. IFAC Proc. Vol. 2012, 45, 1052–1057. [Google Scholar] [CrossRef]
  94. Ericsson, N.; Nordberg, Å.; Berglund, M. Biogas plant management decision support—A temperature and time-dependent dynamic methane emission model for digestate storages. Bioresour. Technol. Rep. 2020, 11, 100454. [Google Scholar] [CrossRef]
  95. Rieke, C.; Stollenwerk, D.; Dahmen, M.; Pieper, M. Modeling and optimization of a biogas plant for a demand-driven energy supply. Energy 2018, 145, 657–664. [Google Scholar] [CrossRef]
  96. Weinrich, S. Praxisnahe Modellierung von Biogasanlagen. Ph.D. Thesis, Universität Rostock, Rostock, Germany, 2017. [Google Scholar]
  97. Winkler, M.; Mauky, E.; Weinrich, S. Model-based process optimization of biogas plant operation. In Proceedings of the IV CMP International Conference on Monitoring & Process Control of Anaerobic Digestion Plants, Leipzig, Germany, 26–27 March 2019. [Google Scholar]
  98. Mauky, E.; Weinrich, S.; Nägele, H.-J.; Jacobi, H.F.; Liebetrau, J.; Nelles, M. Model Predictive Control for Demand-Driven Biogas Production in Full Scale. Chem. Eng. Technol. 2016, 39, 652–664. [Google Scholar] [CrossRef]
  99. Zepter, J.M.; Gabderakhmanova, T.; Andreasen, K.M.; Boesgaard, K.; Marinelli, M. Biogas Plant Modelling for Flexibility Provision in the Power System of Bornholm Island. In Proceedings of the 2020 55th International Universities Power Engineering Conference (UPEC), Torino, Italy, 1–4 September 2020; IEEE: Piscataway, NJ, USA, 2020; pp. 1–6, ISBN 978-1-7281-1078-3. [Google Scholar]
  100. Gökgöz, F.; Winkler, M.; Barchmann, T.; Weinrich, S.; Liebetrau, J.; Nelles, M. Combining Electricity and Fuel Supply: Operational Strategies for Biogas Plants. Chem. Eng. Technol. 2021, 44, 183–193. [Google Scholar] [CrossRef]
  101. Saeed, M.; Fawzy, S.; El-Saadawi, M. Modeling and simulation of biogas-fueled power system. Int. J. Green Energy 2019, 16, 125–151. [Google Scholar] [CrossRef]
  102. Castellanos, J.G.; Walker, M.; Poggio, D.; Pourkashanian, M.; Nimmo, W. Modelling an off-grid integrated renewable energy system for rural electrification in India using photovoltaics and anaerobic digestion. Renew. Energy 2015, 74, 390–398. [Google Scholar] [CrossRef] [Green Version]
  103. Axaopoulos, P.; Panagakis, P.; Tsavdaris, A.; Georgakakis, D. Simulation and experimental performance of a solar-heated anaerobic digester. Sol. Energy 2001, 70, 155–164. [Google Scholar] [CrossRef]
  104. Wang, D.; Duan, Q.; Li, Y.; Tian, X.; Rahman, S. Simulation of a solar-biogas hybrid energy system for heating, fuel supply, and power generation. Int. J. Energy Res. 2017, 41, 1914–1931. [Google Scholar] [CrossRef]
  105. Calise, F.; Cappiello, F.L.; Dentice d’Accadia, M.; Infante, A.; Vicidomini, M. Modeling of the Anaerobic Digestion of Organic Wastes: Integration of Heat Transfer and Biochemical Aspects. Energies 2020, 13, 2702. [Google Scholar] [CrossRef]
  106. Blesgen, A. Entwicklung und Einsatz eines Interaktiven Biogas-Echtzeit-Simulators. Ph.D. Thesis, Universität Bremen, Bremen, Germany, 2009. [Google Scholar]
  107. Hass, V.C. Verbesserung der bioverfahrenstechnischen Ausbildung durch einen “Virtuellen Bioreaktor”. Chem. Ing. Tech. 2005, 77, 161–167. [Google Scholar] [CrossRef]
  108. de Gracia, M.; Sancho, L.; García-Heras, J.L.; Vanrolleghem, P.; Ayesa, E. Mass and charge conservation check in dynamic models: Application to the new ADM1 model. Water Sci. Technol. 2006, 53, 225–240. [Google Scholar] [CrossRef]
  109. Abu Qdais, H.; Bani Hani, K.; Shatnawi, N. Modeling and optimization of biogas production from a waste digester using artificial neural network and genetic algorithm. Resour. Conserv. Recycl. 2010, 54, 359–363. [Google Scholar] [CrossRef]
  110. Gueguim Kana, E.B.; Oloke, J.K.; Lateef, A.; Adesiyan, M.O. Modeling and optimization of biogas production on saw dust and other co-substrates using Artificial Neural network and Genetic Algorithm. Renew. Energy 2012, 46, 276–281. [Google Scholar] [CrossRef]
  111. Wagner, D.; Schlüter, W. Vorhersage und Regelung der Methanproduktion durch maschinelles Lernen. In Proceedings of the ASIM SST 2020, 25. ASIM Symposium Simulationstechnik, 14–15 October 2020; Deatcu, C., Lückerath, D., Ullrich, O., Durak, U., Eds.; ARGESIM Publisher: Vienna, Austria, 2020; pp. 159–166, ISBN 9783901608933. [Google Scholar]
  112. Rosen, C.; Vrecko, D.; Gernaey, K.V.; Pons, M.N.; Jeppsson, U. Implementing ADM1 for plant-wide benchmark simulations in Matlab/Simulink. Water Sci. Technol. 2006, 54, 11–19. [Google Scholar] [CrossRef] [Green Version]
  113. Hochloff, P.; Braun, M. Optimizing biogas plants with excess power unit and storage capacity in electricity and control reserve markets. Biomass Bioenergy 2014, 65, 125–135. [Google Scholar] [CrossRef]
  114. Saracevic, E.; Woess, D.; Friedl, A.; Miltner, A. Dynamic Simulation of a Biogas Plant Providing Control Energy Reserves. Chem. Eng. Trans. 2017, 61, 931–936. [Google Scholar] [CrossRef]
  115. Saracevic, E.; Woess, D.; Theuretzbacher, F.; Friedl, A.; Miltner, A. Techno-economic assessment of providing control energy reserves with a biogas plant. Front. Chem. Sci. Eng. 2018, 12, 763–771. [Google Scholar] [CrossRef] [Green Version]
Figure 1. System boundaries for different views on biogas plants.
Applsci 11 03361 g001
Figure 2. Method of systematic literature search applied, modified according to [22,32,33].
Applsci 11 03361 g002
Figure 3. Result of the systematic literature search performed.
Applsci 11 03361 g003
Figure 4. Detail level of mathematical models categorized in white box, gray box and black box models, modified according to [34].
Applsci 11 03361 g004
Figure 5. Classification of the references regarding their respective level of detail and field of application.
Applsci 11 03361 g005
Table 1. Biogas top-down modeling (energy systems, regional impact, greenhouse gas (GHG) emission).
Ref.View on Biogas PlantsCoding/SoftwareBiomass ModelingRegionAdditional Modeling
[39]energy systemoemof [38]annual chemical biogas potentialnorthwestern Germanytime-dependent electricity production (wind and photovoltaic) and demand
[40]energy systemoemof [38]annual chemical biogas potentialnorthwestern Germanytime-dependent electricity production (wind and photovoltaic) and demand
[41]energy systemEngineering Equation Solver [42]daily chemical biogas potential based on chicken manure and maize silage-electrical energy production (wind, photovoltaic), thermal energy production (photovoltaic), chemical energy production (hydrogen), electrical and thermal energy storage
[44]energy systemBalmorel [43]
linear optimization
(CPLEX-solver)
annual energy potential (stable and increasing 1.3% per year)Denmark, Germany, Finland, Norway, Swedendifferent waste to energy technologies (e.g., gasification, co-combustion) and other technologies (e.g., heater, steam turbine), all with fixed efficiencies
[14]energy systemEnergyPLAN [45]annual chemical biomass potentialDenmarkelectrical energy production (wind, photovoltaic, wave, CHP, power plants), biogas purification
[46]energy systemSifreannual energy potential of manure and strawDanish municipality-
[47]energy systemTIMESannual energy potential of degradable feedstockIreland-
[16]regional potential-electrical energy potential of manureNorthwestern Portugal-
[56]regional potential-sectoral biogas potential of manure (cattle, pigs, sheep, poultry)Greecechronological sequence since 1970; contemplation of regional gas grid
[57]regional potential-time-dependent (seasons) biogas potential of agricultural residues and municipal wasteCroatiaresidue-to-product ratios, sustainable removal rates
[58]regional potential-methane potential of manure, grass silage, municipal wasteFinlandMaximum feasible use of regional feedstock due to 30-day HRT; optimizing GHG emissions
[59]regional potential-municipal waste, sludge, manure, silage and crop residuesFinlandoptimizing biogas plant placing
[15]GHG emissionGaBi [63]methane yield of maizeGermanyregional methane yield
[64]GHG emissionGaBi [63]methane yield of manure, maize silage and grass silage with different mixture ratios-CHP size and efficiency
[65]GHG emissionSimaPro [67]methane yield of maize, grass, rye silage, chicken manure-demand-oriented energy production by
HRT for mass flow calculation in digester
[68]GHG emission-mass-specific energy of grass-influence of grass treatment
[69]GHG emissionUmbertobiogas yield of cultivated crops (maize, triticale, rye, hemp)-emissions of farming, digestion, purification and upgrading to biomethane, transportation
[24]GHG emissionSimaPro [67]
MATLAB®
dynamic AD model (AMOCO)Germanydemand-oriented energy production with dynamic AD modeling
Table 2. Biogas bottom-up modeling (process dynamics).
Ref.View on Biogas PlantsAD ModelCoding/SoftwareFeedstockEnergy ProductionRegionAdditional Models
[31]AD processADM1:
24 species,
19 reactions
----physiochemical
digester model
[75]AD processADM1SIMBA#:
C#-based
----
[76]AD processADM1SIMBA#pig manure---
[77]AD processADM1AQUASIM:
C++-based
----
[78]AD processADM1AQUASIMsludge---
[79]AD processADM1AQUASIMwater thyme---
[80]AD processADM1MATLAB®
Simulink-code:
C-based S-Function
----
[81]AD processADM1ADMS 1.0:
Python GUI and
MATLAB® ADM1
----
[82]AD processADM1MATLAB®-code----
[90]AD processADM1BioOptim [9]bio waste---
[8]AD processmodified ADM1MATLAB®
Simulink
pig manure & glycerin---
[95]AD process2 species,
2 reactions
MATLAB®
Simulink
maize silage---
[103]AD process1 reactionnot knownmanure--heat flow,
thermodynamics of digester
[105]AD process13 species,
10 reactions
MATLAB®fictive waste
composition
--heat flow,
thermodynamics of digester
[109]AD processANN:
one specific digester
MATLAB®agricultural waste (landfill)---
[110]AD processANN:
25 digesters
NeuroSolutions®manure, banana stem, sawdust---
[111]AD processANN of ADM1MATLAB®: ADM1 and
Python: ANN
fictive
(result of ADM1)
---
[84]energy
production
ADM1MATLAB®
Simulink
manureelectricity
(micro gas turbine)
-power electronics of micro gas turbine
[86]energy
production
ADM1MATLAB®
Simulink
Multipleelectricity (CHP) thermodynamics of digester
[101]energy
production
4 species,
4 reactions
MATLAB® Simulinkmanureelectricity
(micro gas turbine)
-synchronous electrical generator of micro gas turbine, gas storage, thermodynamics of digester
[104]energy
production
1 reactionMATLAB®
Simulink
household garbageelectricity (CHP),
heat
domestic use profile (China)heat storage (water tank),
electrical gas compressor,
gas storage, battery (buffer)
[99]energy
production
1 time-dependent functionMATLAB®
Simulink
manureelectricity (CHP)-gas storage
[10]biogas controlADM1BioOptim:
MATLAB®
Simulink
-electricity (CHP)-digestate storage,
pumps, heating system,
energy sinks and sources
[91]biogas controlADM1DyBiM:
MATLAB®
Simulink
grass silage,
cattle manure,
agricultural substrates
electricity (CHP)Swedengas storage
[92]biogas controlADM1MATLAB®maize silage, rye,
triticale, sugar beets, potato pieces, potato peel
-GermanyPI controller
[9,106,107]biogas control13 equations,
2 reactions
FORTRAN and
WinErs for GUI and
automation
---tanks,
valves, pumps
[97,98]biogas controlADM1 simplification [96]not knownnot knownelectricity (CHP)Germany (EPEX)gas storage
[102]biogas controllinear equationHOMER®undifferentiatedelectricity
(CHP, photovoltaic,
fuel cell)
India (off-grid)heat storage,
energy storage (battery)
[100]biogas control1 species,
1 reaction
MATLAB® and
Microsoft Excel®
maize silage,
grass silage,
manure
electricity (CHP),
fuel (CNG)
Germany (EPEX)biogas to CNG upgrade plant (black box),
vehicle fleet
[113]biogas controlnoneRedSimfixed gas
characteristics
electricity (CHP)Germany
(spot market)
gas storage (mass balance)
[114,115]biogas controlnoneIPSEpro®real data gas
characteristics
electricity (CHP),
fuel (methane)
-gas storage, heat storage, tanks, gas upgrade (black box)
Publisher’s Note: MDPI stays neutral with regard to jurisdictional claims in published maps and institutional affiliations.

