Article

Finding the Differences in Capillaries of Taste Buds between Smokers and Non-Smokers Using the Convolutional Neural Networks

by
Hang Nguyen Thi Phuong
1,
Choon-Sung Shin
2,* and
Hie-Yong Jeong
1,*
1
Department of Artificial Intelligence Convergence, Chonnam National University, 77 Yongbongro, Bukgu, Gwangju 61186, Korea
2
Graduate School of Culture, Chonnam National University, 77 Yongbongro, Bukgu, Gwangju 61186, Korea
*
Authors to whom correspondence should be addressed.
Submission received: 14 March 2021 / Revised: 5 April 2021 / Accepted: 9 April 2021 / Published: 12 April 2021
(This article belongs to the Special Issue Artificial Intelligence for Computer Vision)

Abstract

:

Featured Application

The aim of this work is to strengthen patient awareness and willingness to quit smoking by presenting them with the diagnostic results obtained using the capillaroscopy-based deep-learning artificial intelligence methods.

Abstract

Taste function and condition may be a tool that exhibits a rapid deficit to impress the subject with an objectively measured effect of smoking on his/her own body, because smokers exhibit significantly lower taste sensitivity than non-smokers. This study proposed a visual method to measure capillaries of taste buds with capillaroscopy and classified the difference between smokers and non-smokers through convolutional neural networks (CNNs). The dataset was collected from 26 human subjects through the capillaroscopy with the low and high magnification directly; of which 13 were smokers, and the other 13 were non-smokers. The acquired dataset consisted of 2600 images. The results of gradient-weighted class activation mapping (grad-cam) enabled us to understand the difference in capillaries of taste buds between smokers and non-smokers. Through the results, it was found that CNNs gave us a good performance with 79% accuracy. It was discussed that there was a shortage of extracted features when the conventional methods such as structural similarity index (SSIM) and scale-invariant feature transform (SIFT) were used to classify.

1. Introduction

A lot of studies have confirmed that smokers exhibit significantly lower taste sensitivity than non-smokers [1]. The taste sensitivity level can be measured by electrogustometric (EGM) thresholds from various parts of the tongue (locus) [2]. After smoking cessation, thresholds of EGM decrease progressively and reach the taste sensitivity range of non-smokers depending on locus and time. It is known that the recovery in the posterior loci is complete after 9 weeks, and the recovery in the dorsal loci is observed only after 2 months or more. Smoking cessation results in a rapid recovery of taste sensitivity among smokers, with different recovery times [1,3]. Thus, it is considered that the use of taste sensitivity could be explored as a motivation tool for smoking cessation.
The function of capillaries of taste buds is the exchange of material between the blood and tissue cells for gustatory sensitivity [4]. Tobacco users are generally unaware of the effects of tobacco on general health, oral health, etc. [3]. The effect on sensory perception and the demonstration of its deficit to the subject might reveal an actual threat the smoker may wish to avoid. The taste function and the taste condition may be a tool that exhibits a rapid deficit to impress the subject with an objectively measured effect of smoking on his/her own body because smokers exhibit significantly lower taste sensitivity than non-smokers [1,5,6]. From this point, the authors have an interest in whether there is a difference in capillaries of taste buds between smokers and non-smokers or not.
There have been two measuring methods of the taste sensitivity; for the whole mouth and for some mouth regions [2]. The evaluation for the whole mouth can be done with the use of colorless solutions of sweet, bitter, sour, and salt [7]. Then, the simplest regional test is EGM which was introduced in the clinical assessment of taste sensitivity during the 1950s [8]. In addition, contact endoscopy (CE) allows for both in vivo and in situ observations of pathology in the superficial layer of the tongue, nasal mucosa, vocal cords in the larynx-microsurgery and nasopharynx [9,10]. However, these methods are not easy for non-medical practitioners to use in daily life. Furthermore, images from CE are difficult for normal users to understand features related to diseases.
On the other hand, nailfold capillaroscopy is a non-invasive, inexpensive, and reproducible imaging technique to evaluate micro-circulations [11,12]. The capillaries are so abnormally altered that they can be seen with the naked eye, although magnification is usually required. And this method is used for the diagnosis of vascular dysfunction. That is the reason we used the nailfold capillaroscopy as the first testing. In nailfold videocapillaroscopy (NVC) qualitative assessment, scleroderma patterns can distinguish between primary and secondary Raynaud’s phenomenon (RP) and represent an essential and reliable parameter for the early, as well as very early, diagnosis of systemic sclerosis (SSc) [13,14]. Thus, the recent introduction of capillaroscopic assessment into the new 2013 American College of Rheumatology (ACR)/European League Against Rheumatism (EULAR) classification criteria for SSc reflects its pivotal role in the diagnosis of the disease [15]. However, most studies using capillaroscopy focused on images of nailfold capillaries.
For the nailfold capillary analysis, there have been three approaches: manual, semi-automated, and automated segmentation [16]. The manual method depends on human-recognizable features and requires experts to perform certain tasks, rendering it impractical for mass and widespread use [17]. The semi-automated method requires initial human intervention to mark the outer and inner parts of each capillary and requires data analysis, which may cause bias and mistakes [12]. The automated method combine a local threshold and the Simultaneous Truth and Performance Level Estimation (STAPLE) algorithm to distinguish nailfold capillaries [18]. However, these methods are contaminated by noise and require post-processing such as morphological operations. Recently, convolutional neural networks (CNNs) have been proposed for semantic segmentation [19,20,21,22]. Although these methods have been effectively applied on medical image segmentation tasks, such as liver, pancreas, MRI, and multiorgan, no CNN has been proposed for capillaries of taste buds.
Therefore, this study proposed a visual real-time method to measure capillaries of taste buds with capillaroscopy and classify the difference between smokers and non-smokers through CNNs. After that, this study confirmed which extracted featured points should be used to classify two classes.
This paper is organized as follows: In Section 2, related works about details of capillaries microscope and the data choosing for the testing; And we considered the algorithms with handcrafted feature extraction, such as SSIM, SIFT and algorithms without handcrafted feature extraction, such as convolutional neural networks (CNNs). After that, we chose the best method for classifying capillaries images which is our proposed method; Section 3 provides the results of the experiment settings and results; Section 4 provides the discussion; lastly, Section 5 gives the summary and conclusions of this work.

2. Methods

This section describes the capillaries microscope which is the small and simple device system to capture the capillaries images. Subsequently, we considered when choosing the nailfold capillaries or the blood vessels on tongue and give the reason of our choice. Our proposed method was implemented after testing two methods: the algorithms with handcrafted feature extraction, such as SSIM, SIFT and algorithms without handcrafted feature extraction, such as convolutional neural networks (CNNs) on the applied data and chose the best.

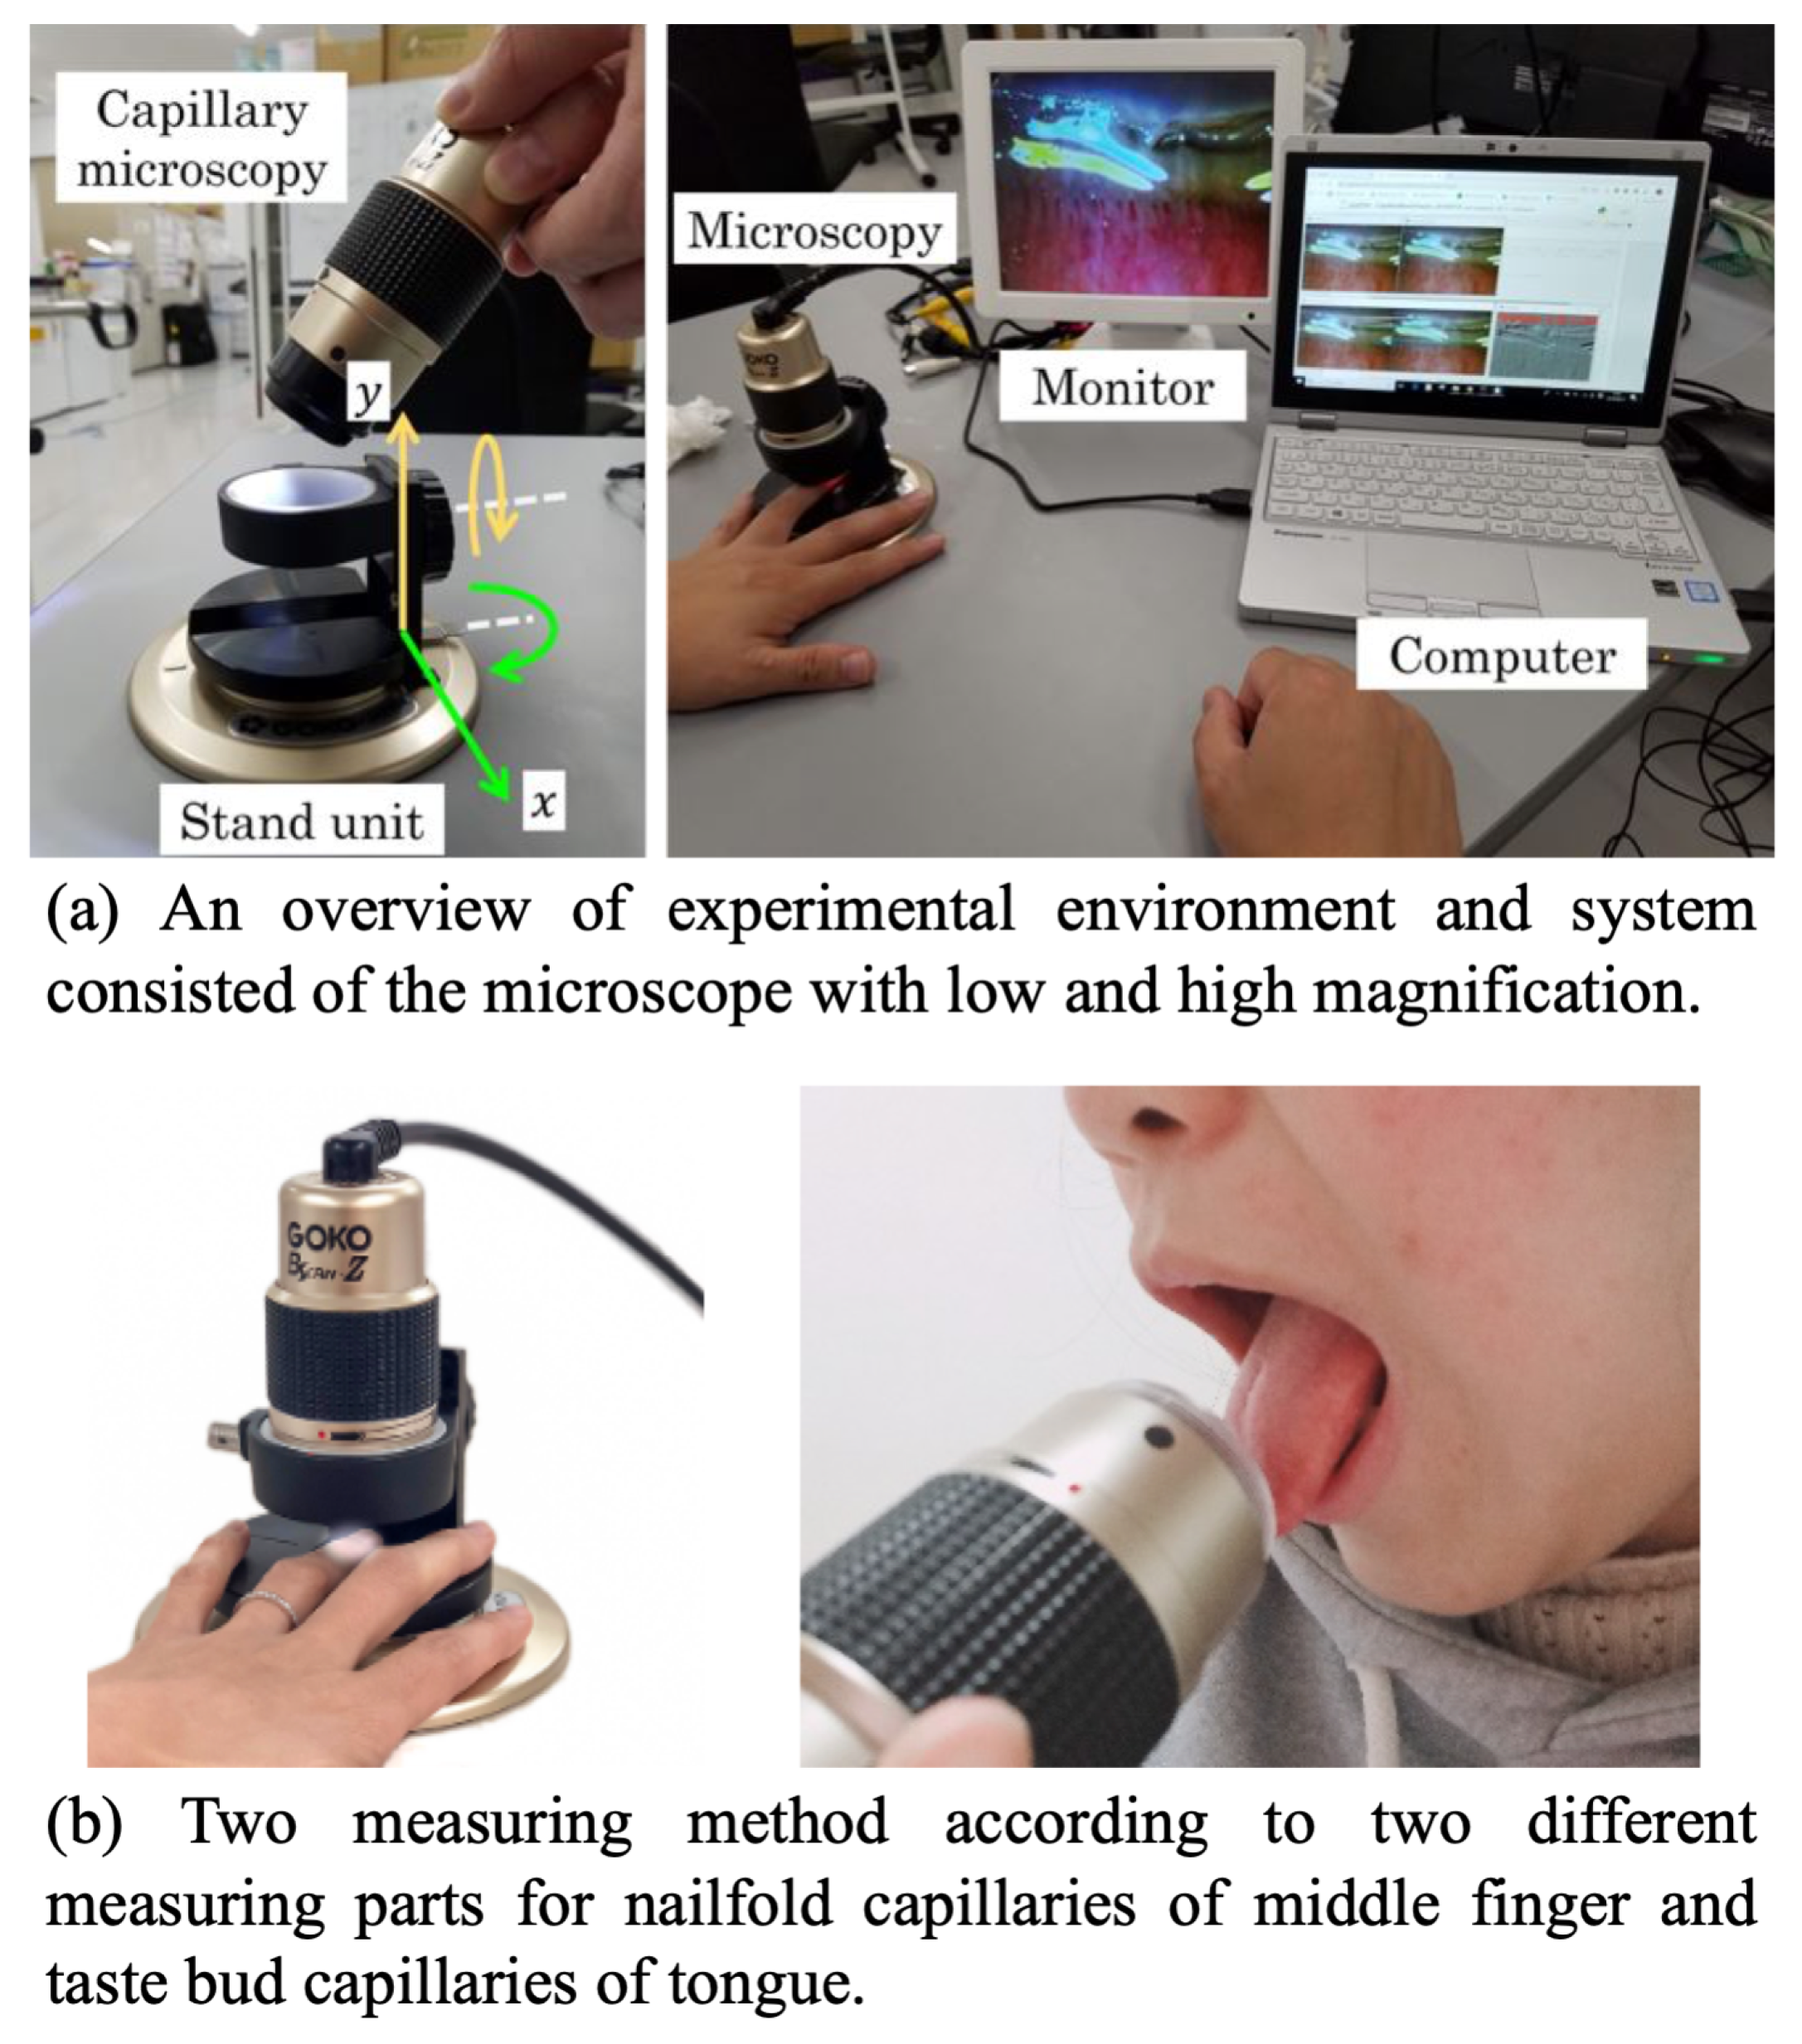
2.1. Experimental Environment and System

Table 1 shows pros and cons of different capillaroscopic devices [15]. Different devices can be used to perform capillaroscopy, as it is an in vivo imaging investigation that consists of a magnified view of the structural aspects of the microcirculation. The commercially available tools range from the wide-field microscope and videocapillaroscope to smartphone devices and are characterized by different portability, magnification, and costs. the USB-connected-typed microscopy is chosen because the necessary magnification for capillaries of taste buds in this study might be larger than 300× and the device is simple enough for non-medical practitioners to use.
Figure 1a shows an overview of experimental environment and system consisted of the microscope with the low and high magnification. Table 2 [23] describes the specification of the experimental system of the microscopy with the low (100×) and high (410×) magnification.
They are connected by cables and converter set to convert NTSC analogue images to uncompressed digital images for the real-time displaying on a monitor and saves them as video and still image. The microscope is a GOKO Bscan-Z (GOKO Imaging Devices, Kanagawa, Japan) with a vertical, cylindrical body and compact size. The body weight of the microscope is 150 g when the focus cap is attached; the size of the focus cap is diameter × length = ϕ 45 × 10 mm, and the body weight is 10 g. The diameter of the stand unit is ϕ = 120, the camera holder is ϕ = 58, and the height of the stand unit is 72.5 mm. The weight of the stand unit is 250 g. Because of the light body weight, it is easy to carry.
The range of the x-axis movement for the stand unit is 10 mm from the left to the right side, and that of the y-axis is 10 mm from the upper to the lower positions, as shown in Figure 1a. Although there is no range of the z-axis, a human subject can regulate his or her finger position. The real-time image of capillaries is projected onto a 14-inch monitor under a range of magnification from low to high magnification [11]. The user can spin the black middle part around to zoom out, zoom in and focus without any change of lens.

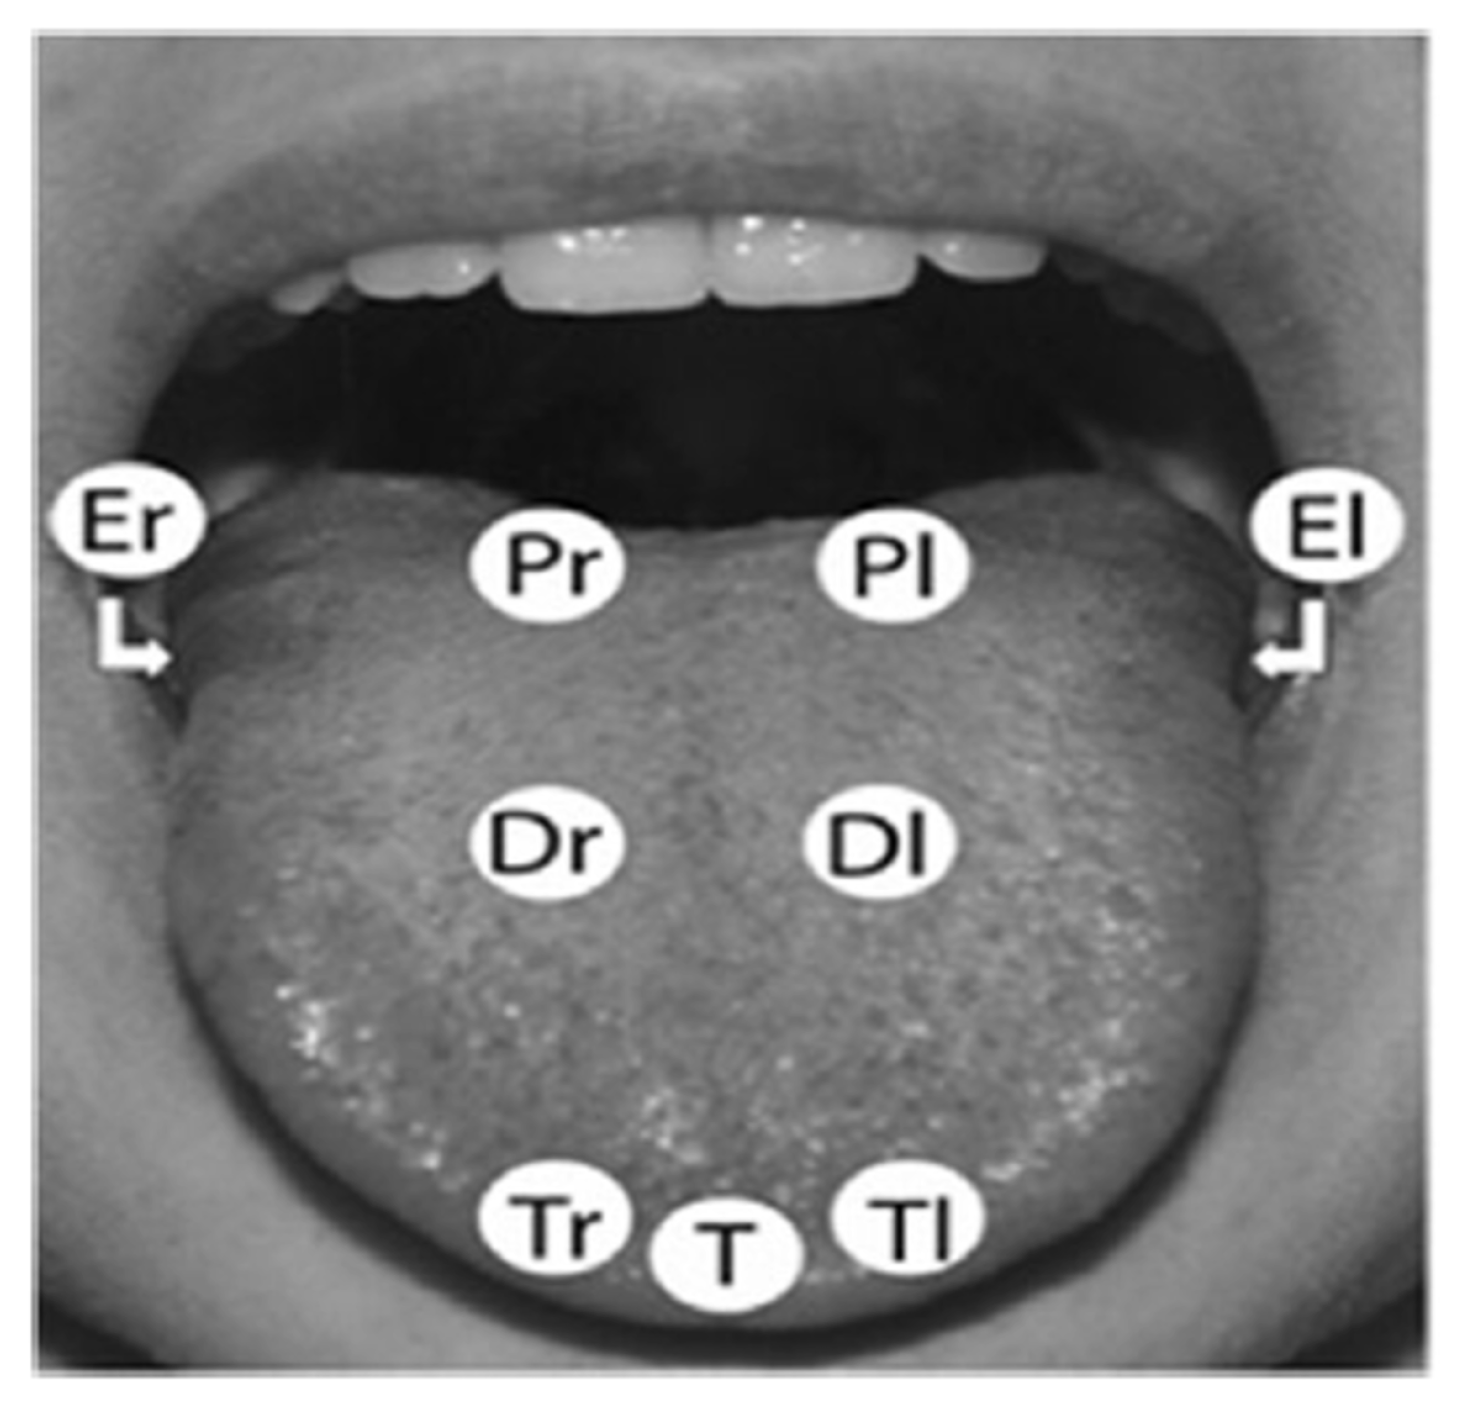
2.2. Data Acquisition

There is no opened data set to classify the difference of capillary distribution on nailfold and tongue between smokers and non-smokers in the world as we surveyed. Thus, it is necessary to measure the capillaries of the nailfold and tongue surface and make the data set directly. There are two measuring parts which had the contact between the tobacco and the human body while smoking. Figure 1b shows a description to measure capillaries of nailfold and taste bud by using the microscope. According to the measuring part, it is possible to attach or detach the microscope and stand unit.
Twenty-six human subjects (height: 172.2 ± 6.3 cm, weight: 68.3 ± 6.2 kg, Age: 24 ± 9 years old) were employed: 13 smokers in the university with the smoking careers of 5–10 years (class 1), and thirteen non-smokers who were university students without smoking careers (class 2). No subject from either class reported any health problem or a history of neurological disease, drug abuse, alcoholism, and medical constrains that might influence the experimental result. No major difference in body mass index (BMI) was observed between the two classes.
Figure 2 shows the location of the 9 recording loci on the surface of the tongue. The nine tongue loci were defined: Tip of the tongue middle (T), right (Tr) and left (Tl) where the density of fungiform papillae is highest, Dorsal right and left (Dr and Dl) where the density of fungiform papillae is lowest, Edge right and left (Er and El) on the foliate papillae, and Posterior right and left (Pr and Pl) just anterior to the circumvallate papillae.
After the authors explained the objectives and procedures of this study, the informed consent was obtained from all subjects. The experimental procedures were performed under the Declaration of Helsinki.

2.3. Data Training with Compound Model Scaling

Four different CNNs, with different different architectures (VGG [24], DenseNet [25], ResNet [26], and EfficientNet [27]) were trained on measured dataset. All training is performed using the Python programming language (version 3.8) on a workstation running on Jupyter Notebook with one Nvidia GeForce RTX 2080ti graphic cards (11 GB of RAM).

2.3.1. Model Scaling

All CNN [28] architectures follow the same general design principles of successively applying convolutional layers to the input, periodically downsampling the spatial dimensions while increasing the number of feature maps. While the classic network architectures (LeNet [29], AlexNet [30], and VGG) are comprised simply of stacked convolutional layers, modern architectures (Inception [31], ResNet, ResNeXt [32], DenseNet, and EfficientNet) explore new and innovative ways for constructing convolutional layers in a way which allows for more efficient learning. All these architectures are based on a repeatable unit which is used throughout the network.
For improving the performance, there are a lot of methods to scale up a CNN for different resource constraints. ResNet can be scaled up by regulating network depth which indicates layers, while WideResNet and MobileNet can be scaled by network width which indicates channels. It is also well-recognized that bigger input image size means bigger resolution that helps increasing accuracy with the overhead of more FLOPS (float point operations per second) that is a measure of computer performance. However, there is still the limitation to scale only one of the three dimensions (depth, width, and image resolution). That means that we should use only one scaling factor [27].

2.3.2. Compound Model Scaling

This study tries to use the CNN with compound model scaling, which means to use three scaling factors at the same time, and then evaluate the effect of compound model scaling on classification. The CNN layer i can be expressed as a function: Y i = F i ( X i ) , where F i is the operator, Y i is output tensor, X i is input tensor, with tensor shape H i , W i , C i 1 , where H i and W i are spatial dimensions and C i is the channel dimension [27,28]. A CNN N can be represented by a list of composed layers: N = F k · · · F 2 F 1 ( X 1 ) = j = 1 · cot · k F j X 1 , where ⊙ means the connection between consecutive layers. CNN layers are often partitioned into multiple stages and all layers in each stage share the same architecture. Thus, the CNN can be defined as [27]:
N = i = 1 · · · s F i L i ( X ( H i , W i , C i ) ) ,
where F i L i denotes F i of layer i is repeated L i times in stage i, H i , W i , C i denotes the shape of input tensor X of layer i.
When it is possible that all layers should be scaled with constant ratio, the problem for model scaling can be an optimization problem, which is to maximize the model accuracy for any given resource constraints. This is achieved by the following algorithm:
maximize d , w , r A c c u r a c y ( N ( d , w , r ) ) subject to N ( d , w , r ) = i = 1 · · · s F ^ i d · L ^ i ( X r · H ^ i , r · W ^ i , w · C ^ i ) M e m o r y ( N ) t a r g e t m e m o r y F L O P S ( N ) t a r g e t f l o p s
where w, d, r are coefficients for scaling network width, depth, and resolution, and F i ^ , L i ^ , H i ^ , W i ^ , C i ^ are predefined parameters in baseline network.
The compound scaling method uses a compound coefficient ϕ to scale network width, depth, and resolution:
depth : d = α ϕ width : w = β ϕ resolution : r = γ ϕ subject to α · β 2 · γ 2 2 α 1 , β 1 , γ 1
where α , β , γ are constants that can be determined by a small grid search.
From the start with the baseline EfficientNet-B0, the compound scaling method is applied to scale it up with two steps. At first, it performs the search for α , β , γ through Equations (2) and (3) after fix ϕ = 1 . The values for EfficientNet-B0 are α = 1.2 , β = 1.1 , and γ = 1.15 under the condition of α · β 2 · γ 2 2 . Then, scale up baseline network with different ϕ through Equation (3) after fix α , β , γ , to gain EfficientNet-B1 to B7.

3. Results

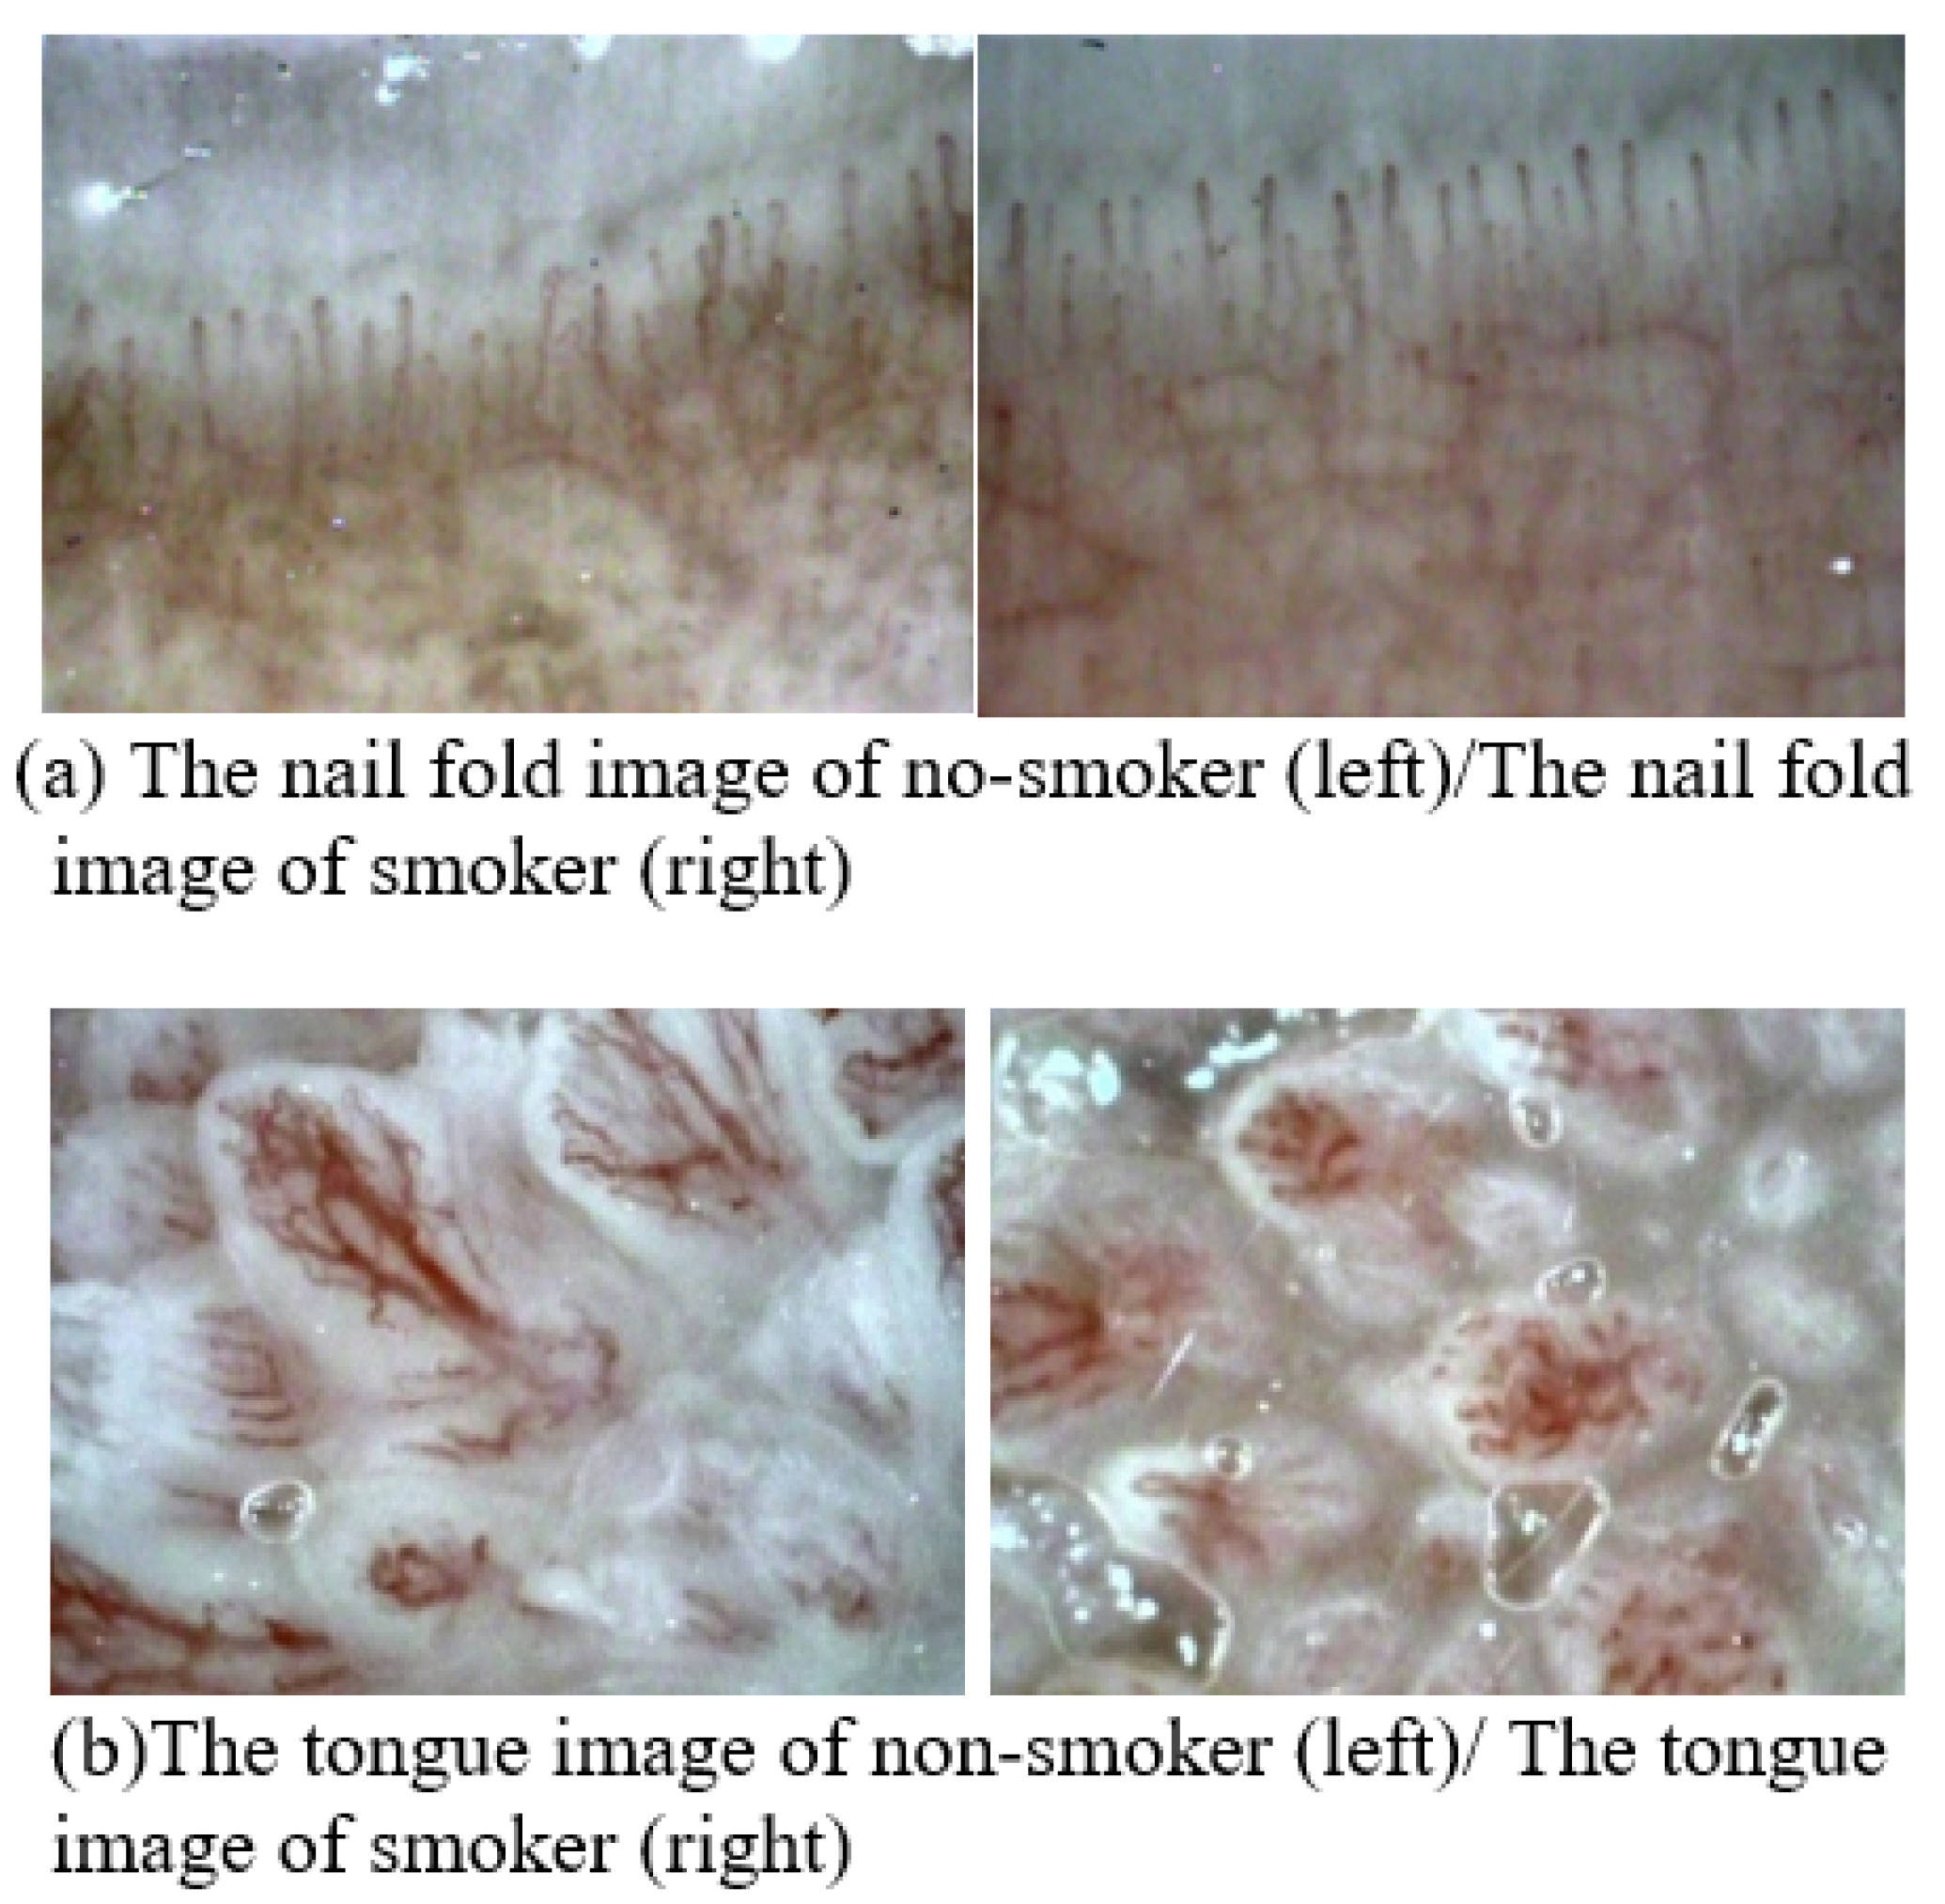
3.1. Example of Dataset

Figure 3 showed an example of the capillary image of nailfold (a) and taste bud (b) between smokers and non-smokers. The capillary image of the nailfold cannot give us the big difference between smokers and non-smokers. During daily activities such as washing, and doing something with hands, etc., the attached chemicals on the skin surface are eliminated.
On the other hand, the size of taste buds on the tongue for smokers seems to be smaller than that for non-smokers, thus, it looks like the condition of capillary distribution is different. The results of measurement as shown in Figure 3b was the dorsal for the middle of tongue (Dr and Dl) as shown in Figure 2.

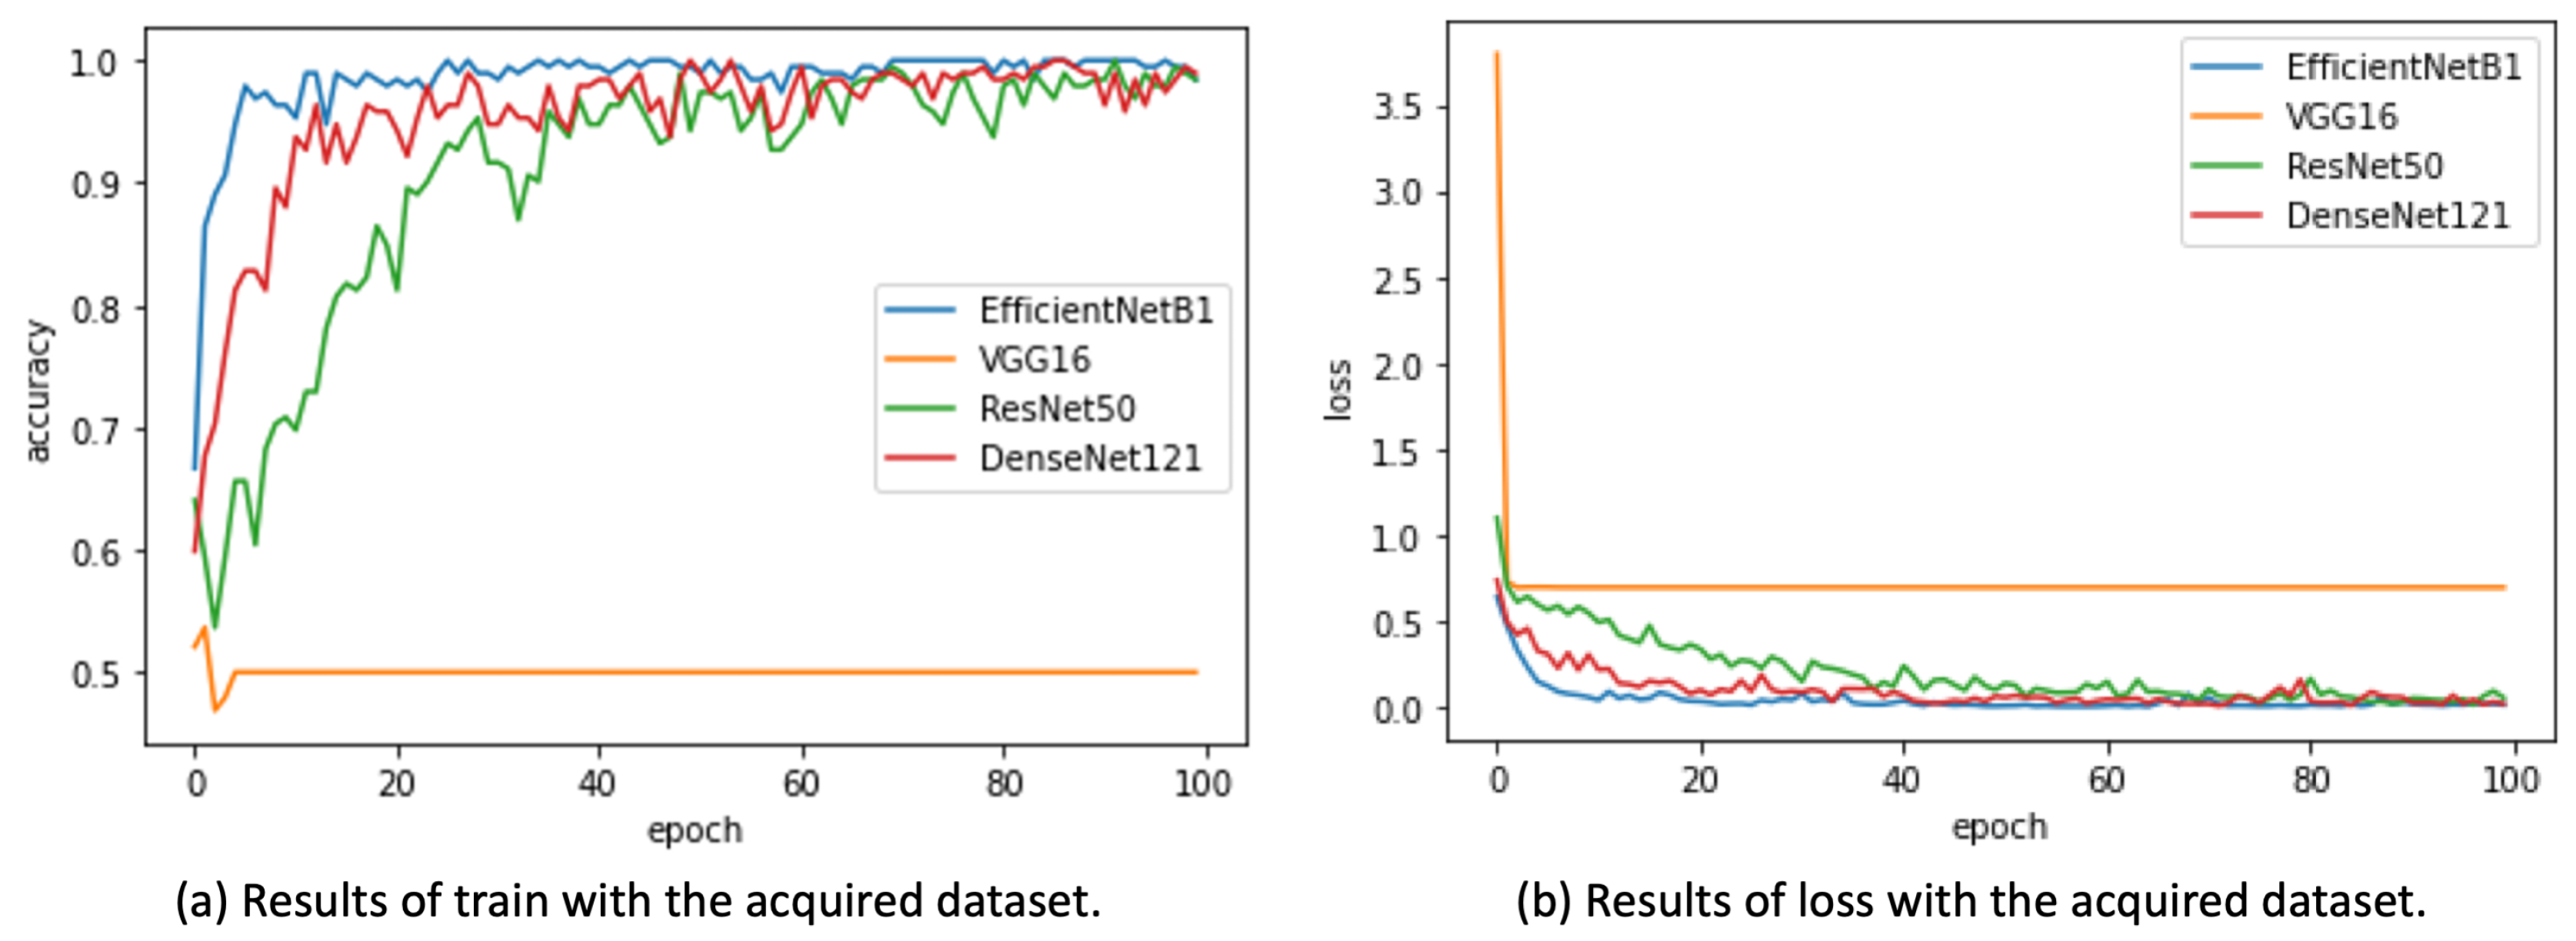
3.2. Results of the Training and Prediction

Figure 4 shows the results of the training and loss for four applied models of CNNs: EfficientNet, VGG16, ResNet50, and DenseNet121. Although the results through VGG16 were not trained well, others showed good performance with nearly 80% accuracy. Our dataset includes 2 classed: smoker and non-smoker with 220 images per one class. We used rate (60/20/20) to split our dataset: 132 images in train set, 44 images in test set and validation set. Because the number of human subjects was small, the function of ImageDataGenerator Class in Keras was applied for increasing the number of images. It is well-known that CNN is only relevant when they are trained with a huge amount of data. In order to make the most of our few training examples, we can augment them via several random transformations. This helps to prevent overfitting and improves the generalization of the model. In Keras, this can be done by the class keras.preprocessing.image. ImageDataGenerator. The total number of images was 2600: 80% was used for the training and validation, and the left 20% was for the testing. We implemented experiment on four CNNs models: VGG, ResNet, DenseNet and EfficientNet with our dataset. And the result was showed on Table 3 and Table 4.
Table 3 represents the trainable and non-trainable parameters of four CNN models: EfficientNet-B1, VGG16, Resnet50 and DenseNet121. These results show that the total number of parameters of EfficientNet-B1 is the least of the four models, and is equal to the one fourth of the number of parameters of ResNet and half of VGG16 ’s. However, EfficientNet-B1 is the most effective, thus EfficientNet-B1 is considered to be the good choice in our data.
Table 4 represents the results of prediction for four different algorithms of CNNs: EfficientNet, VGG16, ResNet50 and DenseNet121. It is shown that the results of prediction for EfficientNet indicates the best performance among four different CNNs.
Compared to the result of algorithms with handcrafted feature extraction such as SSIM and SIFT, it was found that most of CNN algorithms without handcrafted feature extraction worked better for the image processing of capillaries, although VGG16 showed the failure.

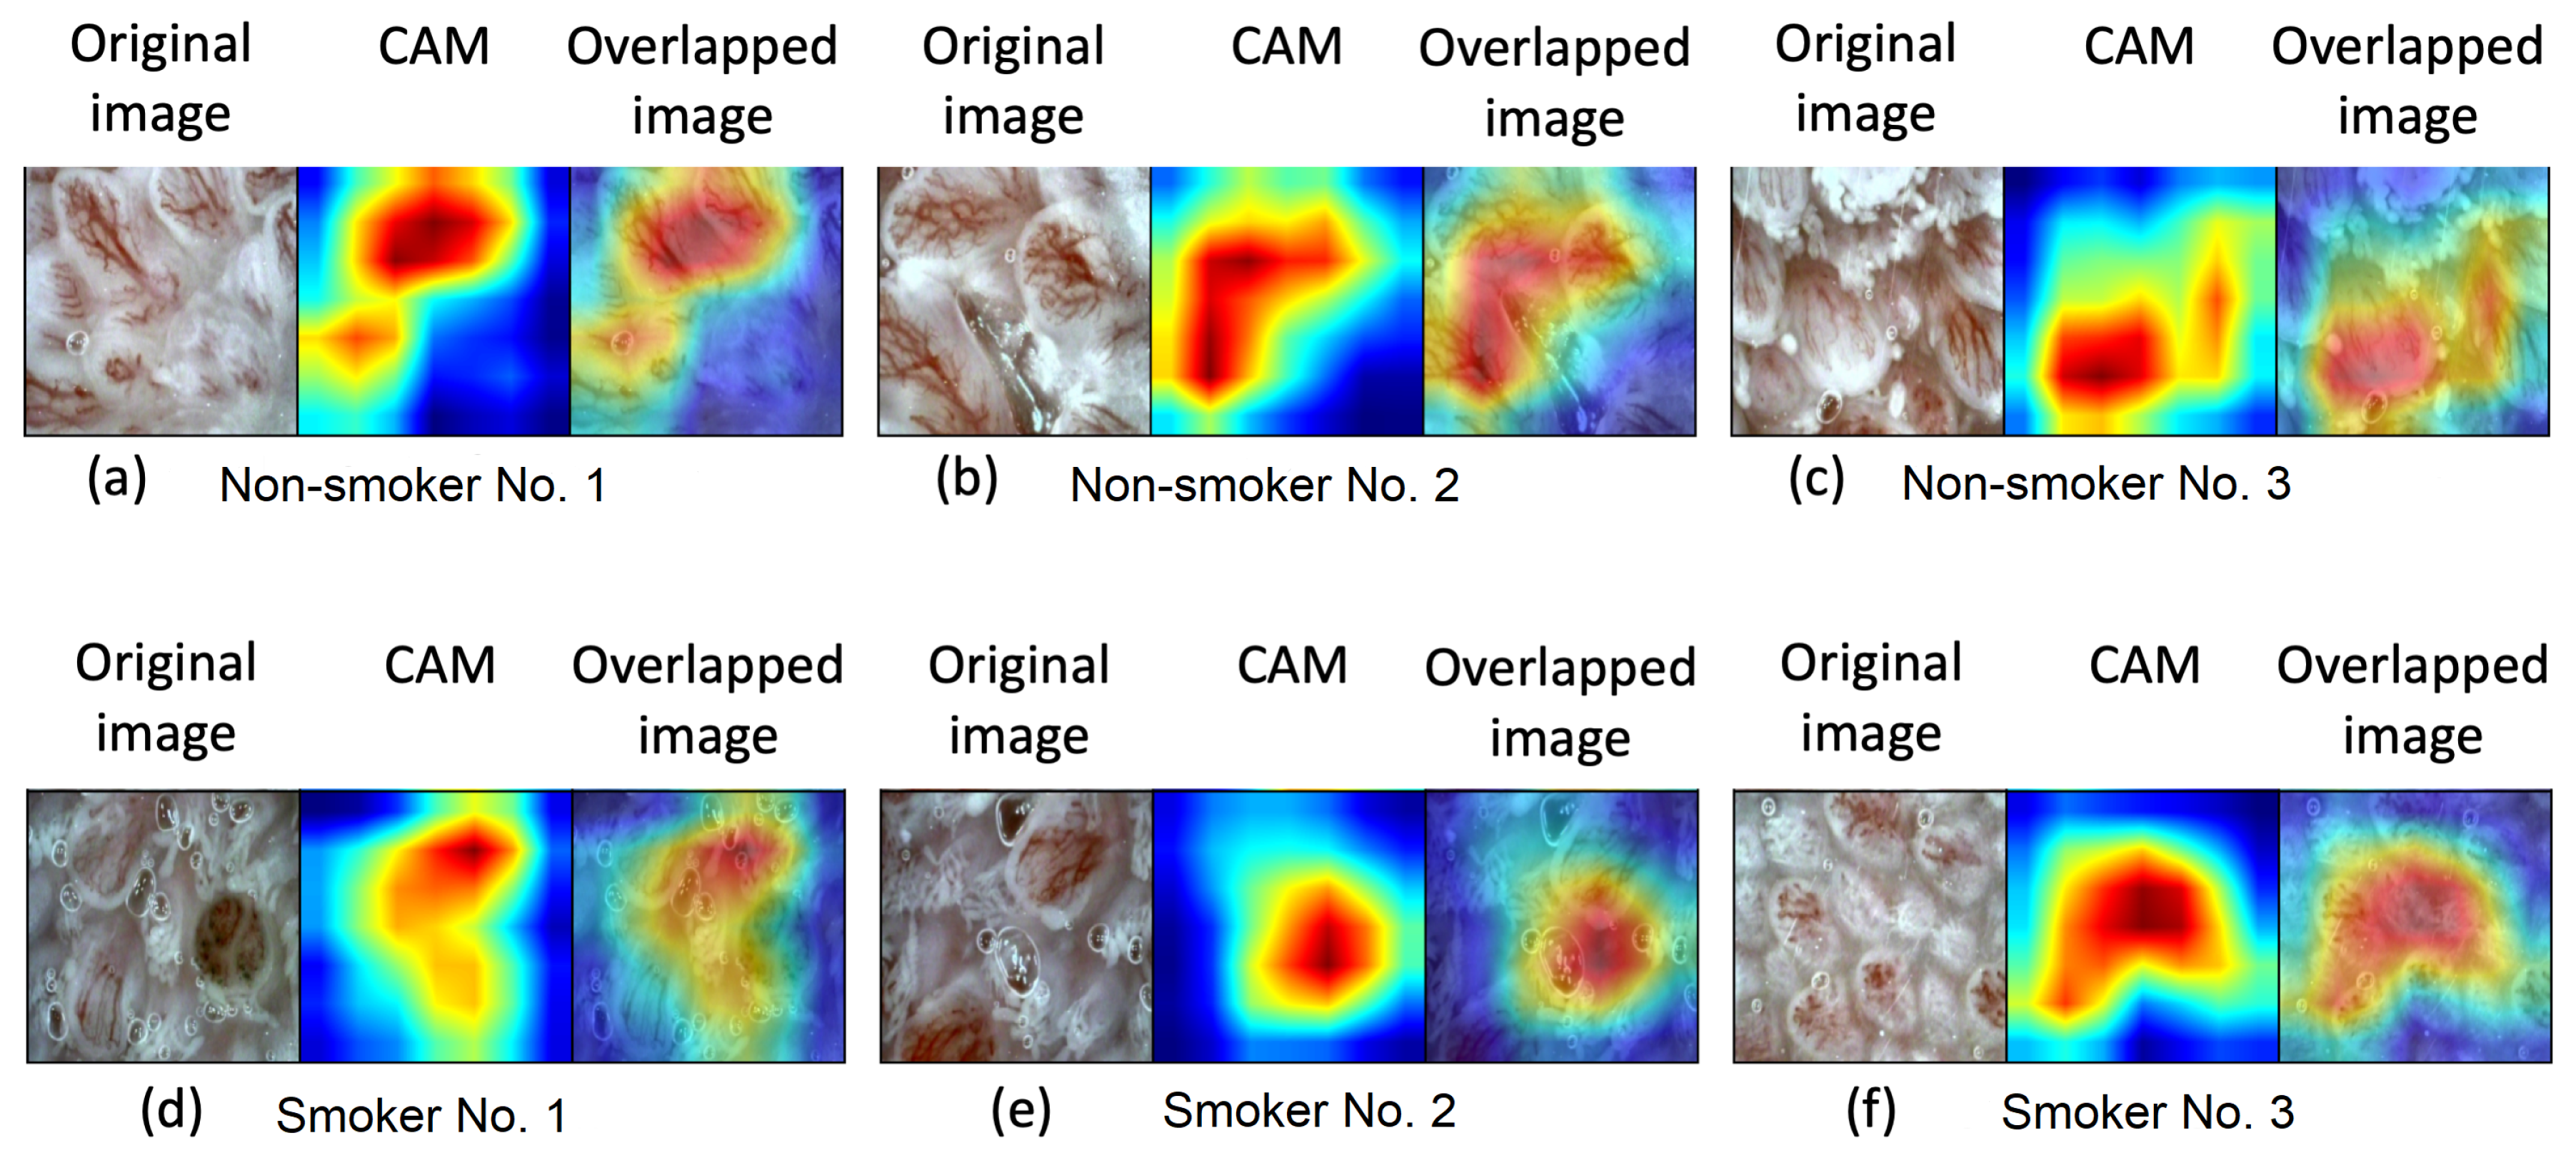
3.3. Results of the Class Activation Map

The Class Activation Map (CAM) helps in the analysis of understanding as to what region of an input image influence the CNN’s output prediction. The technique relies on the heat map representation which highlights pixels of the image that triggers the model to associate the image with a particular class.
Figure 5 compares the CAM images for three representative human subjects. Images are randomly picked from CNN validation set. The left image indicates the original image, the middle one indicates the results of CAM, and the right indicates the overlapped image with the original and CAM images. The results show that the CNNs tend to predict the non-smoker class by finding the large capillaries and white-colored taste buds. Additionally, it was also confirmed that the CNN model tended to predict the smoker class with the small capillaries and white-colored taste buds without capillaries [33].

4. Discussion

We would like to analyze the CNNs model which is the best choice for classifying image data of capillaries. In the case, the algorithms with handcrafted feature extraction get the good result for capillaries images, there is no need to use the CNNs model without handcrafted feature extraction. However, the result of algorithms with handcrafted feature extraction gave us the bad score which showed in Figure 6 and Figure 7.
Figure 6 shows the results of the structural similarity index (SSIM) score [34] between two different tongue images for two smokers (a), and between two images for the smoker and non-smoker (b). SSIM score 1.00 represents that two images are same, and the 0.0 of that represents that those are fully different. The SSIM is a perceptual metric that quantifies image quality degradation based on the change in structural information, while also incorporating important perceptual phenomena, including both luminance masking and contrast masking terms. The difference to other methods, such as mean squared error (MSE) or Peak Signal-to-noise ratio (PSNR), is that these approaches estimate absolute errors. Structural information that pixels have strong inter-dependencies especially when they are spatially close. Through the results, it was confirmed that there were some difficulties in classifying the difference of tongue bud between two images of the smoker and the non-smoker through the SSIM score.
Figure 7 shows the results of the scale-invariant feature transform (SIFT) score [35] between two different tongue images for two smokers (a), and between two images for the smoker and non-smoker (b). The 100.0% of SIFT score represents that two images are same, and the 0.0% of that represents that those are fully different. SIFT keypoints of targets are first extracted from a set of reference images and stored in a database. A target is recognized in a new image by individually comparing each feature from the new image to this database and finding candidate matching features based on Euclidean distance of their feature vectors. Through the full set of matches, subsets of keypoints that agree on the target and its location, scale, and orientation in the new image are identified to filter out good matches. Through the results, it was confirmed that there were some difficulties in classifying the difference of tongue bud between two images of the smoker and the non-smoker through the SIFT score, because there was the shortage of good match points.
As a result, it was confirmed that there were some difficulties in classifying the difference of tongue bud between two images of the smoker and the non-smoker through the SSIM and SIFT score, because there was the shortage of good match points. It is necessary to have a lot of parameters when the feature from the image of capillaries is extracted. Thus, it is considered that algorithms with handcrafted feature extraction are not good for the image processing of capillaries.

5. Conclusions

In this study, some CNN models such as EfficientNet, ResNet, and DenseNet enabled us to train the data set of capillaries of taste buds, although two conventional methods such as structural similarity index (SSIM) and scale-invariant feature transform (SIFT) did not work well because of a shortage of extracted featured points. The results of class activation map (CAM) enabled us to understand a difference between smokers and non-smokers because CAM allowed us to know what were extracted featured points through CNNs.
The CNNs model without handcrafted feature extraction, especially EfficientNet with compound model scaling, proved the good performance to detect difference between smokers and non-smokers via tongue capillaries images which captured by the microscope, compared with conventional methods with handcrafted feature extraction. Then, the CAM enabled us to classify a difference in capillaries of taste buds between smokers and non-smokers. Our system with the bigger data, we can apply in hospital to support doctor in diagnosing disease, and it can be used daily for self-checking health and detecting the abnormal point of capillaries.

Author Contributions

Conceptualization, Formal Analysis, Investigation, and Writing—Original Draft Preparation: H.N.T.P. and H.-Y.J.; Writing—Review and Editing, H.N.T.P., C.-S.S. and H.-Y.J.; Project Administration, C.-S.S. and H.-Y.J. All authors have read and agreed to the published version of the manuscript.

Funding

This work was financially supported by the Design Innovation Program (AHA Platform and Personalized Services for the Elderly Using Universal UX Design, No. 20012692) funded By the Ministry of Trade, industry & Energy (MOTIE, Korea), and the BK21 plus program through the National Research Foundation (NRF) funded by the Ministry of Education of Korea.

Institutional Review Board Statement

This study approved by the Institutional Review Board (IRB) of Applied Sciences (ISSN 2076-3417; CODEN: ASPCC7) which is an international, peer-reviewed, open access journal on all aspects of applied natural sciences published semimonthly online by MDPI.

Informed Consent Statement

After the authors explained the objectives and procedures of this study, the informed consent was obtained from all subjects. The experimental procedures were performed under the Declaration of Helsinki.

Data Availability Statement

You can refer to the source code and the data set via this: https://github.com/urgonguyen/efficientSmokingDetection (accessed on 12 April 2021). The authors are waiting for any responses and comments.

Acknowledgments

The authors would like to express my gratitude to Human-Media Laboratory members (Myoungjae Jun and Yeongju Woo) in Chonnam National University who are experiencing infinite trial and error with us.

Conflicts of Interest

The authors declare no conflict of interest.

References

  1. Chéruel, F.; Jarlier, M.; Sancho-Garnier, H. Effect of cigarette smoke on gustatory sensitivity, evalution of the deficit and of the recovery time-course after smoking cessation. Tob. Induc. Dis. 2017, 15, 1–8. [Google Scholar]
  2. Pavlos, P.; Vasilios, N.; Antonia, A.; Dimitrios, K.; Georgios, K.; Georgios, A. Evaluation of young smokers and non-smokers with Electrogustometry and Contact Endoscopy. BMC Ear Nose Throat Disord. 2009, 9, 9. [Google Scholar] [CrossRef] [PubMed] [Green Version]
  3. AI-Shammari, K.F.; Moussa, M.A.; AI-Ansari, J.M.; AI-Duwairy, Y.S.; Honkala, E.J. Dental patient awareness of smoking effects on oral health: Comparison of smokers and non-smokers. J. Dent. 2006, 34, 173–178. [Google Scholar] [CrossRef] [PubMed]
  4. Kim, K.; Lee, D.; Joo, N. Reduction of the Nailfold Capillary Blood Velocity in Cigarette Smokers. Korean J. Fam. Med. 2012, 33, 398–405. [Google Scholar] [CrossRef] [PubMed]
  5. Dallongeville, J.; Marecaux, N.; Fruchart, J.C.; Amouyel, P. Cigarette smoking is associated with unhealthy patterns of nutrient intake: A meta-analysis. J. Nutr. 1998, 128, 1450–1457. [Google Scholar] [CrossRef] [PubMed] [Green Version]
  6. Northrop-Clewes, C.A.; Thurnham, D.I. Monitoring micronutrients in cigarette smokers. Clin. Chim. Acta 2007, 377, 14–38. [Google Scholar] [CrossRef] [PubMed]
  7. Heckmann, J.; Heckmann, S.; Lang, C.; Hummel, T. Neurological Aspects of Taste Disorders. Arch. Neurol. 2003, 60, 667–671. [Google Scholar] [CrossRef] [PubMed] [Green Version]
  8. Zuniga, J.; Chen, N.; Miler, I.J. Effects of chorda lingual nerve injury and repair on human-taste. Chem. Senses 1994, 19, 657–665. [Google Scholar] [CrossRef] [PubMed]
  9. Xiaoming, H.; Haiqiang, M.; Manquam, D.; Jianyong, S.; Yong, S.; Kela, L.; Xiaoman, L.; Tengbo, H. Examination of nasopharyngeal epithelium with contact endoscopy. Acta Otolaryngol. 2001, 121, 98–102. [Google Scholar]
  10. Wardrop, P.J.C.; Sim, S.; McLaren, K. Contact endoscopy of the larynx: A quantitative study. J. Laryngol. Otol. 2000, 114, 437–440. [Google Scholar] [CrossRef]
  11. Suga, S.; Otomo, A.; Jeong, H.; Ohno, Y. Image similarity check of nailfold capillary by template matching. In Proceedings of the IEEE 8th Global Conference on Consumer Electronics (GCCE), Osaka, Japan, 15–18 October 2019; pp. 799–803. [Google Scholar]
  12. Bourquard, A.; Butterworth, I.; Sanchez-Ferro, A.; Giancardo, L.; Soenksen, L.; Cerrato, C.; Flores, R.; Castro-Gonzalez, C. Analysis of white blood cell dynamics in nailfold capillaries. In Proceedings of the Annual International Conference of the IEEE Engineering in Medicine and Biology Society (EMBC), Milano, Italy, 25–29 August 2015; pp. 7470–7473. [Google Scholar]
  13. Van den Hoogen, F.; Khanna, D.; Fransen, J.; Johnson, S.R.; Baron, M.; Tyndall, A.; Pope, J.E. 2013 classification criteria for systemic sclerosis: An American college of rheumatology/European league against rheumatism collaborative initiative. Ann. Rheum. Dis. 2013, 72, 1747–1755. [Google Scholar] [CrossRef] [Green Version]
  14. Cutolo, M. Capillaroscopy in rheumatic diseases from the XVIII to the XXI century. In Atlas of Capillaroscopy in Rheumatic Diseases; Elsevier: Amsterdam, The Netherlands, 2010. [Google Scholar]
  15. Smith, V.; Herrick, A.L.; Ingegnoli, F.; Damjanov, N.; De Angelis, R.; Denton, C.P.; Cutolo, M. Standardisation of nailfold capillaroscopy for the assessment of patients with Raynaud’s phenomenon and systemic sclerosis. Autoimmun. Rev. 2020, 19, 102458. [Google Scholar] [CrossRef]
  16. Hariyani, Y.; Eom, H.; Park, C. DA-CapNet: Dual Attention Deep Learning based on U-Net for Nailfold Capillary Segmentation. IEEE Access 2020, 8, 10543–10553. [Google Scholar] [CrossRef]
  17. Karbalaie, A.; Etehadtavakol, M.; Abtahi, F.; Fatemi, A.; Emrani, Z.; Erlandsson, B.E. Image enhancement effect on inter and intra-observer reliability of nailfold capillary assessment. Microvasc. Res. 2018, 120, 100–110. [Google Scholar] [CrossRef] [PubMed]
  18. Isgrò, F.; Pane, F.; Porzio, G.; Pennarola, R.; Pennarola, E. Segmentation of nailfold capillaries from microscopy video sequences. In Proceedings of the 26th IEEE International Symposium on Computer-Based Medical Systems (CBMS), Porto, Portugal, 20–22 June 2013; pp. 227–232. [Google Scholar]
  19. Long, J.; Shelhamer, E.; Darrell, T. Fully convolutional networks for semantic segmentation. In Proceedings of the IEEE Conference on Computer Vision and Pattern Recognition, Boston, MA, USA, 7–12 June 2015; pp. 3431–3440. [Google Scholar]
  20. Ronneberger, O.; Fischer, P.; Brox, T. U-net: Convolutional networks for biomedical image segmentation. In International Conference on Medical Image Computing and Computer-Assisted Intervention; Springer: Cham, Switzerland, 2015. [Google Scholar]
  21. Zeiler, M.D.; Fergus, R. Visualizing and understanding convolutional netwroks. In European Conference on Computer Vision; Springer: Cham, Switzerland, 2014; pp. 818–833. [Google Scholar]
  22. Badrinarayanan, V.; Kendall, A.; Cipolla, R. Segnet: A deep convolutional encoder-decoder architecture for image segmentation. IEEE Trans. Pattern Anal. Mach. Intell. 2017, 39, 2481–2495. [Google Scholar] [CrossRef] [PubMed]
  23. Goko Imaging Devices, Co., Ltd. Imaging Products. Available online: https://www.gokocamera.com/english/ev/ (accessed on 11 March 2021).
  24. Simonyan, K.; Zisserman, A. Very deep convolutional networks for large-scale image recognition. arXiv 2015, arXiv:1409.1556v6. [Google Scholar]
  25. Huang, G.; Liu, Z.; van der Maaten, L.; Weinberger, K.Q. Densely connected convolutional networks. arXiv 2018, arXiv:1608.06993. [Google Scholar]
  26. He, K.; Zhang, X.; Ren, S.; Sun, J. Deep Residual Learning for Image Recognition. arXiv 2015, arXiv:1512.03385. [Google Scholar]
  27. Tan, M.; Le, Q.V. EfficientNet: Rethinking Model Scaling for Convolutional Neural Networks. arXiv 2019, arXiv:1905.11946. [Google Scholar]
  28. Jason Brownlee: A Gentle Introduction to Channels-First and Channels-Last Image Formats. Available online: https://machinelearningmastery.com/a-gentle-introduction-to-channels-first-and-channels-last-image-formats-for-deep-learning/ (accessed on 12 September 2019).
  29. LeCun, Y.; Bottou, L.; Bengio, Y.; Haffner, P. Gradient-Based Learning Applied to Document Recognition. Proc. IEEE 1998, 11, 2278–2324. [Google Scholar] [CrossRef] [Green Version]
  30. Krizhevsky, A.; Sutskever, I.; Hinton, G. ImageNet classification with deep convolutional neural networks. Commun. ACM 2017, 60, 84–90. [Google Scholar] [CrossRef]
  31. Szegedy, C.; Liu, W.; Jia, Y.; Sermanet, P.; Reed, S.; Anguelov, D.; Erhan, D.; Vanhoucke, V.; Rabinovich, A. Going Deeper with Convolutions. arXiv 2014, arXiv:1409.4842. [Google Scholar]
  32. Xie, S.; Girshick, R.; Dollar, P.; Tu, Z.; He, K. Aggregated Residual Transformations for Deep Neural Netwroks. arXiv 2017, arXiv:1611.05431. [Google Scholar]
  33. Hwang, Y.; Lee, H.H.; Park, C.; Tama, B.A.T.; Kim, J.S.; Cheung, D.Y.; Chung, W.C.; Cho, Y.; Lee, K.; Choi, M.; et al. Improved classification and localization approach to small bowel capsule endoscopy using convolutional neural network. Dig. Endosc. 2020. [Google Scholar] [CrossRef] [PubMed]
  34. Brunet, D.; Vass, J.; Vrscay, E.R.; Wang, Z. On the mathematical properties of the structural similarity index. IEEE Trans. Image Process. 2012, 21, 2324–2328. [Google Scholar] [CrossRef] [PubMed]
  35. Matthew, T.; William, M.W. SIFT-Rank: Ordinal descriptors for invariant feature correspondence. In Proceedings of the IEEE International Conference on Computer Vision and Pattern Recognition, Miami, FL, USA, 20–25 June 2009; pp. 172–177. [Google Scholar]
Figure 1. (a) An overview of exp. environment consisting of the microscope with low and high magnification, (b) Measuring method for nailfold capillaries of finger on the left and measuring method taste bud capillaries of tongue on the right.
Applsci 11 03460 g001
Figure 2. A location of the 9 recording loci on the surface of the tongue. T, tip; Tr and Tl, tip right and tip left; Er and El, edge right and edge left; Dr and Dl, dorsal right and dorsal left; Pr and Pl, fungiform papillae just anterior to the circumvallate papillae.
Applsci 11 03460 g002
Figure 3. An example of the capillary image of nailfold (a) and tongue (b) between smokers and non-smokers.
Applsci 11 03460 g003
Figure 4. Results of training (a) and loss (b) for four models of CNNs: EfficientNet (blue color plot), VGG16 (orange color plot), ResNet50 (green color plot), and DenseNet121 (red color plot).
Applsci 11 03460 g004
Figure 5. Results of Class Activation Map (CAM) visualization for Convolutional Neural Network (CNN).
Applsci 11 03460 g005
Figure 6. (a) The structural similarity index (SSIM) score between two tongue images for two different smokers, and (b) SSIM score between two images for the smoker and non-smoker.
Applsci 11 03460 g006
Figure 7. (a) The scale-invariant feature transform (SIFT) score between two tongue images for two different smokers, and (b) SIFT score between two images for the smoker and non-smoker.
Applsci 11 03460 g007
Table 1. Pros and cons of different capillaroscopic devices [15].
DevicePortabilityMagnificationCosts
StereomicroscopyNot practicalRanging between 10 and 200×Medium to high
ophthalmoscopyVery goodUp to 15×Low
DermatoscopyVery goodUp to 10×Low to medium
Smartphone devicesVery goodUp to 20×Low
Digital USB microscopyGood (laptop connection)Up to 300×Low to medium
Digital videocapillaroscopyGood (laptop connection)Raging between 50 and 500×High
Table 2. Specification of microscope GOKO Bscan-Z.
FeatureDescriptions
2-ways-to-useDesk and handheld.
Stand unitRobust and is attached,
-Reduces the tremors.
Zoom and focusPowerful zoom,
-Easy to focus
-No need to change lenses.
Live videoCapture smooth without time lags.
Magnification100× to 410× (on 14-inch monitor).
Dimensions ϕ 45 (external diameter) × 96 (length) mm
-without attachment,
- ϕ 45 (external diameter) × 106 (length) mm
-with attachment.
Table 3. The number of parameters for four models of convolutional neural networks (CNNs): EfficientNetB1, VGG16, ResNet50, and DenseNet121.
ModelTotal ParamsTrainableNon-Trainable
EfficientNet-B16,576,5136,514,46562,048
VGG1614,715,20114,715,2010
ResNet5023,589,76123,536,64153,120
DenseNet1217,038,5296,954,88183,648
Table 4. Results of prediction for four models of convolutional neural networks (CNNs): EfficientNet-B1, VGG16, ResNet50, and DenseNet121.
ModelAccuracy [%]Loss
EfficientNet-B179.681.39
VGG1650.000.69
ResNet5060.940.89
DenseNet12148.433.67
Publisher’s Note: MDPI stays neutral with regard to jurisdictional claims in published maps and institutional affiliations.

