Definition of Discrete Choice Models of EV Owners Based on Different Socio-Demographic Aspects


Faculty of Electrical Engineering and Information Technology, University of Zilina, 010 26 Žilina, Slovakia
*
Author to whom correspondence should be addressed.
Appl. Sci. 2021, 11(8), 3679; https://0-doi-org.brum.beds.ac.uk/10.3390/app11083679
Submission received: 18 March 2021
/
Revised: 11 April 2021
/
Accepted: 16 April 2021
/
Published: 19 April 2021
(This article belongs to the Special Issue Future Distribution Network Solutions)
Abstract
:With an increasing number of electric vehicles (EVs), their owners’ involvement in the control of electric power systems and their market seems to be the only option for stable operation of future power networks. However, these people usually have little knowledge about power systems’ operation and follow just their interests. Therefore, this paper deals with the decision-making process of EV drivers at the charging station. The paper presents the stated preference survey used to collect the responses to hypothetical scenarios, where respondents chose between three alternatives, namely slow charging, fast charging, and vehicle-to-grid services. The survey also contained questions about respondents’ socio-demographic characteristics, as gender, age, etc. The decision-making prediction models for each socio-demographic characteristic were created using the acquired data. The paper presents the estimated parameters of the attributes affecting the respondents’ choices for the models that allow models’ simple implementation. Knowing these models and the customers’ composition, the operators of the charging stations or the distribution networks could better estimate EV owners’ behavior and so their expected power demand. Moreover, operators could more effectively implement incentives for their customers and affect the customers’ behavior in a way that is suitable for better operation of their power systems.
1. Introduction
The penetration of electric vehicles (EVs) is assumed to be gradually increasing in the near future. One of the main reasons why many people prefer an EV instead of a car with internal combustion engines is the assumption that they are more friendly to the environment. Moreover, countries worldwide are trying to decarbonize the transportation sector and so support the purchase and usage of EVs through different forms of incentives [1]. Therefore, authors in studies [2,3,4,5] deal with decision making for purchasing EVs. However, high penetration of the uncontrollably charging EVs can significantly disrupt the balance between generation and consumption in the electric grid, and so auxiliary services would have to be utilized more [6,7,8]. In Slovakia, these auxiliary services are provided mainly by fossil-fueled power plants or large hydropower plants. Therefore, the high penetration of EVs could lead to more carbon emissions produced by the power sector and new challenges for the operation of future distribution networks.
The solution to this problem could be utilizing EVs as an active element of the grid. That means getting drivers of EVs to charge their cars not when they decide or need to but when it is also suitable for the grid. Such a concept was already presented, and it is known as a vehicle to grid (V2G) and can have two forms: unidirectional and bidirectional. The unidirectional form is also known as Smart charging [9], and it assumes providing regulation services by control of charging rates and/or charging times. For example, it can ensure that the group of EVs providing this service will be charged only in the case of high generation and low demand. The bidirectional concept, usually known as V2G, assumes, in addition to the control of charging, also the possibility of discharging vehicles to the grid in the case of high demand [7,9].
In both concepts, EV owners/drivers are expected to be active players in the market with the electricity of future networks and to take part in power system management. Their participation in the electricity market can help the power system, but also bring many challenges for its operation, since their choices can significantly affect power system operation, especially if there is a high number of people participating in services as V2G.
Therefore, it can be said that owners and their decision making play a vital role in the utilization of the V2G concept [10]. On the other hand, most people have little or no knowledge about the operation of an electrical power system or they think the operation of the power system does not affect them and so they behave mainly in a selfish way based on their own preferences, which are different from person-to-person. Concerning EVs, some people value their comfort over the money they can get from providing V2G services, so they want their car to be charged as soon as possible. In contrast, some people can have a risk-seeking nature and are willing to compromise that their car will not be charged when they need it if they can get enough money for participation in services such as the V2G concept. Upon these assumptions, it is necessary to study and define a model for future EV drivers’ decision-making processes. Then, a mechanism that will provide incentives for the owners to change their behavior can be designed so their impact on the grid can be regulated in the required way.
Even though the number of EVs is still increasing, the ratio of EVs to all cars used on roads is still generally low. Therefore, it is hard to collect data about actually made decisions concerning the charging. This data collection is usually done in the revealed preference (RP) survey. Therefore, most of the studies use a stated preference (SP) survey that collects information about decisions in hypothetical situations [11]. An SP survey was utilized in [12], where the authors have defined a model explaining the EV drivers’ charging and route choice. However, the authors of the study have focused on the decisions about the place of the charging. In contrast, the authors in [13] have used an RP study. It was possible because their study was located in the Netherlands, the country with higher EV penetration than in the rest of the EU. The authors have acquired data from real charging transactions in the Netherlands. Based on the data, they have defined the different EV drivers’ types based on their choice of the place and time of the charging using clustering. Likewise, the authors in [14] divided EV drivers into risk-seeking and risk-averse groups based on their decision whether to charge or not at a chosen destination. However, this study has used the SP survey, but participants were actual drivers of EVs in China.
Similarly, authors in [15] have studied acceptance of Smart charging as a concept within the group of the EVs’ actual owners. They have defined relevant factors affecting the acceptance of smart charging. However, there is a lack of predictions about the preferences of future EV owners/drivers. In [16], authors have studied and defined a model representing the EV driver’s decision making. However, they have considered only the Smart charging concept and not the bidirectional V2G service.
In our previous paper [17], we defined a design of the SP survey created and carried out from July to October 2020 with a sample of 289 residents of Slovakia. The survey was designed to obtain data on the decisions of future EV owners. The respondents were able to choose between three alternatives, i.e., slow charging, fast charging, and V2G service. There was also a possibility to opt out and not choose any of the alternatives. Based on the survey data, the prediction model with its estimated parameters has been determined and validated [17].
However, in addition to the hypothetical scenarios with decision data, the survey has acquired data about the respondents’ socio-demographic characteristics. Therefore, this paper deals with the analysis of these decisions within different socio-demographic groups. In most cases, the model representing the decisions based on belonging to the specific group was more accurate than the general model created based on the whole sample. Thus, if an operator of the charging station or the distribution network with high penetration of EVs knows their customers’ composition, they could better estimate their behavior and thus the effects of these customers on the total consumption. Moreover, these operators could more effectively implement incentives for their customers and affect the behavior of these customers in a way that is suitable for the better and more secure operation of their charging station or grid. Therefore, the EV owner’s decision-making prediction model was created for each group within each socio-demographic characteristic. The estimated parameters of different groups within each characteristic were compared and explained.
Moreover, the usage of EVs differs from vehicles with internal combustion engines. For example, the EVs are primarily used for short-distance commuting currently, and so they are usually charged at home or work, where the time of charging is not so significant [18]. Therefore, the paper compares the results between the respondents with and without experience of driving an EV, where the effect of this different behavior can be present.
The rest of this paper is organized as follows. Section 2 defines the survey used to collect the data and a short introduction of discrete choice theory used to create decision-making prediction models. At the end of Section 2, the model representing data based on the whole sample is presented. Then, the created models for each characteristic and estimated parameters for the models are presented in Section 3. The models and parameters are described in depth for each characteristic, which allows simple implementation in future works. Finally, Section 4 discusses the results and their significance and outlines the possibility of their implementation and future work.
2. Materials and Methods
It is necessary to collect enough data about the EV owner’s decision-making process and choose appropriate mathematical forms to represent acquired data to create a well-defined EV owner’s decision-making prediction model. Therefore, our methodology has involved a two-step procedure. First, the SP survey was used to collect data. Then, decision-making prediction models were created using discrete choice theory. In addition to the methodology, the results from the collected sample as a whole are shortly presented at the end of this section.
2.1. The SP Survey
Since the EV market share in Slovakia is low (around 0.11% in June 2020) [19,20], there is no possibility of acquiring enough data about the EV drivers’ actual decisions. Therefore, a stated preferences survey is more appropriate for this study. Moreover, it has given us the possibility to include an alternative that has not been utilized yet, i.e., V2G service.
When designing the survey, the authors established three alternatives for participants to choose from. The first alternative was the slow charging option with the defined charging power set to 20 kW. The second alternative for participants to choose from was named fast charging with the defined charging power equal to 60 kW. For participants with no experience of EV charging, we have shown the difference between alternatives by comparing the change in driving range after 10 min of charging. The third alternative, named V2G service, represents the possibility of taking part in V2G services and selling the required amount of energy from EV. If the respondent does not want to choose any of the defined alternatives, there is also a possibility to opt out. The list of the alternatives is presented in Table 1 [17].
Within each hypothetical scenario presented to the respondents, they were reminded about the battery capacity of their hypothetical EV and its driving range with a fully charged battery. The parameters of their hypothetical EV correspond to the parameters of the Tesla 3 model with a 75 kWh capacity of the battery and a full driving range estimated to 450 km. Additionally, participants were informed about their battery’s actual state of charge and their actual driving range. These two parameters were assumed to be represented by just one attribute labeled SoC within the choice model. Moreover, there is another attribute, labeled as the measure of uncertainty p, which informed participants about the probability that they will need a longer driving range for their next journey. The authors assumed that these two parameters affect the utility of each alternative. Therefore, they are defined as generic attributes [17].
Additionally, some attributes affect just some or only one of the alternatives. These attributes are defined as alternative specific attributes.
The alternative specific attribute that affects both slow and fast charging alternatives was assumed to be the cost of charging (C€i). It was represented by the price per kWh of charging power [17].
Discharging in the V2G service alternative was assumed to be carried out with the same maximum discharging power set to 60 kW in each scenario as shown in Table 1. However, the authors have proposed that the charging station can request a different amount of energy from participants within this service based on its actual needs. Therefore, the amount of required energy (E) is one of the alternative specific attributes for the V2G service alternative. Another alternative specific attribute that was assumed to affect the utility of this alternative is the price to be paid to the participants in the V2G service per 1 kWh of delivered energy. This attribute is labeled as a reward per 1 kWh of the sold energy (R€). The list of all the assumed attributes is shown in Table 2 [17].
Each of the defined attributes was presented by three different levels, which has resulted in 729 possible combinations (full factorial design). The Fedorov optimal design [21,22,23] was applied to the combinations, assuming full factorial design as the initial optimal design with 729 runs to determine choice sets for the survey. The Fedorov algorithm’s basic idea is to exchange one of the rows in the initial design with one of the rows from the candidate runs. Then, the differences for all the possible exchange pairs from the current design and the candidate runs are determined, and the pair with the highest value is selected. At each iteration, this algorithm calculates n×N differences (where n is the number of runs in the current design matrix (729) and N is the number of runs in the candidate run matrix) and chooses the best one for exchange [21,22,23]. Application of this algorithm in R software [22] resulted in the 18 hypothetical scenarios (lowest possible number of runs in candidate matrix for our case) for the respondents that are more described in [17].
In addition to the hypothetical scenarios, the participants were also asked socio-demographic questions. The questions were focused on the following parameters [17]:
- experience with driving/charging of EVs (yes/no);
- gender (man, woman, other);
- education (elementary, high school, university degree);
- age (three groups – 18 24, 25 60, 60+);
- annual income (without annual income; below-average annual income in Slovakia, average annual income in Slovakia, higher than average annual income in Slovakia);
- residence (eight autonomous Regions in Slovakia).
2.2. Decision-Making Process
In this paper, we focus on the utility maximization rule (rational decision rule), which is used extensively in developing of human decision-making concepts and provides a good description of the choice behavior even in cases where an individual uses different decision rules [24,25,26,27,28].
In the utility maximization rule, the utility is used for the definition of value to an individual. Generally, it is a function of the attributes of alternatives and the type of individual defining his characteristics. The property of this function assumes that an alternative i is chosen if its utility is not lower than the utility of all other alternatives in the individual’s alternatives set [24,25,26]:
where Zi, Zj define vectors of attributes describing alternative i and j, St is a vector of characteristics describing individual t.
This definition of utility function assumes that the analyst knows all the attributes that the individual is considering during the decision-making process and so there is no uncertainty. However, this is usually not the case, as mentioned above. Therefore, the probabilistic utility function is used in the paper [24,26]:
where Uit is the true utility of the alternative i to the decision-maker t, Vit is the deterministic or observable portion of the utility estimated by the analyst, and εit is the error or the portion of the utility unknown to the analyst that is represented by the random variable [24,26].
The deterministic portion of the utility of an alternative Vit is a mathematical function of the attributes of the alternative i and the characteristics of the decision-maker t [21]:
V(St) is a portion of deterministic utility associated with the characteristic of individual t. This portion of the utility is the same for all alternatives. It is represented by a function of the characteristics’ vector of the decision-maker t and its corresponding parameter’s vector defining the incremental bias’s direction and magnitude due to an increase in the corresponding characteristic. Adding alternative specific constant ASCi, the average effect on the utility of alternative i of all factors that are not included in the model is captured. However, since only differences in utility matter, only the differences in the alternative specific constants are relevant, not their absolute values. To reflect this fact, the analyst needs to set the overall level of these constants. Suppose an analyst sets the alternative specific constant of one alternative equal to zero. In that case, the estimated values of this constant for remaining alternatives can represent a preference of these alternatives over the one with ASCi equal to zero. Therefore, if a decision-maker prefers a charging (e.g., slow charging alternative) over another option (e.g., opt-out alternative) based on the reasons unknown to an analyst, this would be represented by a value of the difference between alternative specific constants of these alternatives [24,26].
V(Zi) is a portion of the utility of alternative i associated with its attributes vector Zi. It is represented as a function of attributes vector Zi of the alternative i and their corresponding parameters , defining the importance of the effect of the corresponding attribute [24,26].
V(St, Zi) represents the part of the utility that results from the interaction between decision-maker t and alternative i. For example, increasing income can reduce the importance of the monetary cost of charging, which can be represented by dividing the cost of charging by annual income or some function of the annual income of the owner’s household [24,26].
The mathematical form of a choice model between discrete alternatives is determined by the assumptions made regarding the error components of the utility function U for each alternative. If the error components follow the Gumbel distribution, the multinomial logit model (MNL) can be used for discrete choice modeling. The MNL gives the probability of the choice of each alternative as a function of the deterministic portion of the utility of all the alternatives. The general expression for the probability of choosing an alternative i for a set of I alternatives by decision-maker t is [25,26]:
2.3. Model Representing a Whole Sample
After completing the survey, it was dissipated using a promoted Facebook advertisement within the Slovakian population aged above 18 years. Since the awareness and interest in EVs in Slovakia are relatively low, this resulted in a low number of responses to the survey. Therefore, the survey was also sent online to different Slovak automotive groups, especially ones oriented to EVs, universities, and their students. The different automotive groups’ data caused a slight bias in the sample, where the men and people with experience with driving an EV are overrepresented. However, it can be assumed that these people are the ones that will prevail in the near future’s EV driver population. Furthermore, the authors of the paper are basically interested in investigating the EVs and EV charging stations’ influence on the power network. From this point of view, the more extensive participation of people with the EV experience provides a better picture of future EV charging stations’ power needs.
The survey was carried out from July to October 2020. Together 289 participants took part in the survey, which resulted in 5192 different responses to presented scenarios.
The authors had proposed and tested different forms of utility functions in [17]: linear, logarithmic, quadratic with relations to the attributes, and the Box–Cox form. Furthermore, the utility functions with the alternative specific or generic parameters of the tested attributes were tested [29,30].
The proposed utility functions were compared using the software Biogeme and the likelihood ratio test or the Cox test [29,30]. Based on testing results, the following linear utility functions were chosen as the best ones to represent the obtained data [17]:
where the subscript of the utility functions corresponds to the indexing of alternatives in Table 1. To include the effect of unobserved factors affecting the utility function of alternatives, , and so the utility of the opt-out alternative, was set to 0. Then, for defines the alternative specific constants representing the mean of the difference of the error term from the . In other words, these parameters capture the preference of the ith alternative over alternative 4 not defined by the assumed attributes. The parameters represent the estimated weights of the chosen attributes. The signs in front of the parameters were defined based on the assumed rational behavior of the participants [17].
As can be seen from the system of Equations (5)–(8), parameters of the SoC and p attributes were confirmed as generic, and so they are the same across the alternatives. However, in the utility function of the V2G service alternative (V3), they are represented with opposite signs. Moreover, there is also a generic parameter related to the cost of both slow and fast charging alternatives. The null hypothesis that the parameters related to these costs are equivalent was tested with the statistical t and p tests. These tests showed that the hypothesis cannot be rejected under the 5% significance level, and therefore the generic parameter is used [17].
Using maximum likelihood estimation, the parameters of the designed utility functions () were estimated in the Biogeme software [29]. The mean values of estimated parameters from the whole sample, as well as the standard errors of these values (SEM), are shown in Table 3. The parameters estimated from the survey show the expected behavior of the EV owners, except for the weight parameter of the sold energy attributes in the V2G alternative, where the sign in front of the parameter is negative. This means that the participants were more inclined to sell a higher amount of energy, probably because of the higher monetary gain. The problem was also the weight parameter of the cost of charging attribute with high variance in the sample. The data show that the hypothesis about this parameter being irrelevant cannot be rejected under the 5% significance level. Table 3 also presents the results of the estimation when the parameter of the charging cost is assumed to be irrelevant. This parameter has also affected the validation of the model, where the distinction between slow charging and fast charging alternative was not precise [17].
3. Results
In addition to hypothetical scenarios’ responses, the survey acquired socio-demographic data about the respondents. Therefore, the authors have decided to investigate how each attribute’s parameters change between these groups, if so. The created prediction models for different groups were compared with the model in [17] to find the most appropriate model to represent the collected data.
3.1. Experience
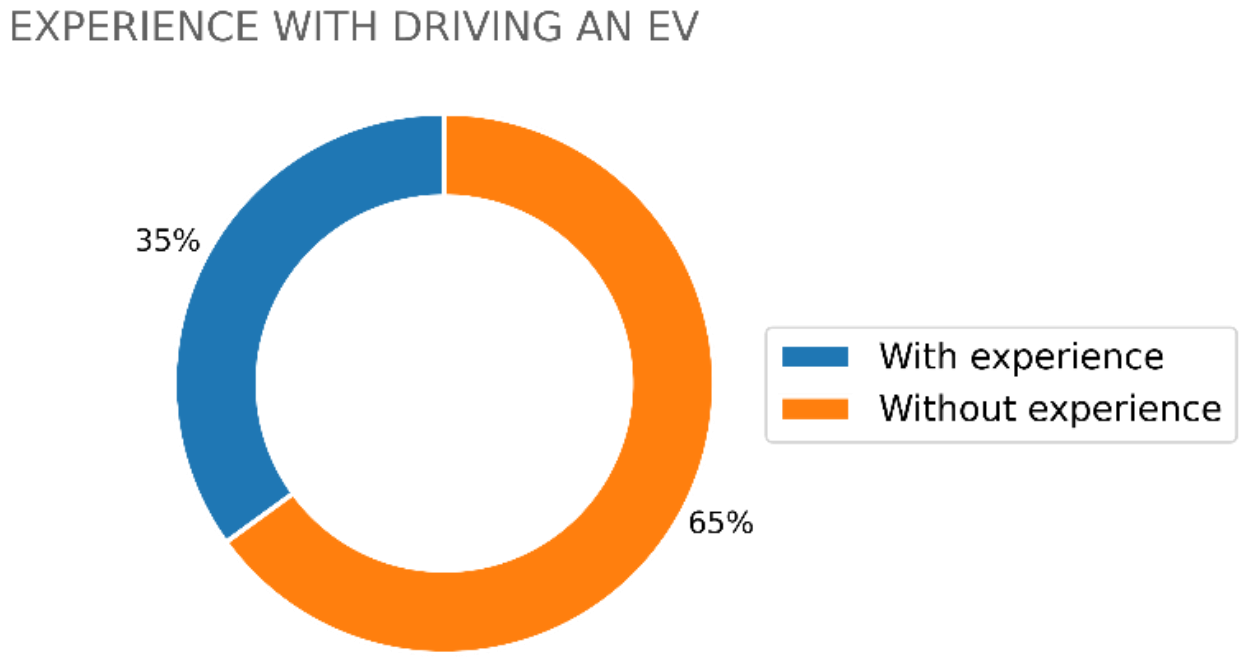
The participants in the survey were asked whether they have had any experience with driving an EV. The hypothesis was that participants with experience with driving an EV have more information about how each presented attribute can affect their utility.
The percentage ratio of respondents with experience with driving an EV is shown in Figure 1. The percentage of respondents with experience driving an EV is relatively high compared to the low penetration of EVs in the market share in Slovakia. The authors have assumed that the people interested in EVs are more likely to seek an opportunity to drive an EV, and at the same time, they are more willing to take part in the survey about EVs charging.
The model representing each group of this characteristic individually was compared with the model in (5–8) using the likelihood ratio test. The result of this test was that this model is preferred over the model in (5–8). The t-tests of these model parameters showed that the null hypothesis that these parameters do not differ cannot be rejected for most of them. However, in the case of the alternative specific constant of the slow charging alternative , this hypothesis can be rejected, meaning that there is a difference in the alternative specific constants of the slow charging alternative. The same applies to the measure of uncertainty attribute .
Therefore, the most suitable model to represent data divided based on the experience characteristic was defined using the following equations:
where parameter Exp defines if a respondent had any experience with driving an EV (Exp = 1) or not (Exp = 0). The parameters of the attributes that are different between the groups are distinguished in the subscript with the symbols ‘0’ or ‘1’ in the case of a respondent with no experience or a respondent with experience with driving an EV, respectively. Parameters that are equivalent in each group of conditional equations for alternatives have the same subscript in the set of equations, e.g., in Equation (10).
The estimated mean values of the attributes’ parameters with their SEM are shown in Table 4. However, the null hypothesis that the parameters and are equal to zero cannot be rejected for these two parameters with a significance level lower than 67% and 33%, respectively. The estimated parameters of the model in (9–12), assuming that these parameters are irrelevant (), are presented in Table 4 as well. It is necessary to note that by omitting a relevant variable, e.g., the charging cost, we can increase the specification error of the model (Type II error—meaning that we can accept a false null hypothesis based on the model). In contrast, including an irrelevant variable will make the model less efficient (Type I error—meaning that we can reject the true null hypothesis based on the model). Therefore, both sets of the estimated data are presented in Table 4 for future reference [30].
The results showed a difference in preference for the slow charging alternative over the opt-out option between these two groups of respondents ( values in Table 4). While the respondents without experience driving an EV prefer this alternative over the opt-out option, the respondents with experience do not ().
The difference in the taste of these groups of respondents is also in the uncertainty measure attribute (). This means that the respondents with experience of driving an EV assigned greater weight to the probability that they would need to leave and their battery would not be charged enough for the journey. These results can be affected by their real experience with the problem of insufficient driving range. In contrast, the respondents without the experience value this attribute less, since they had not had real experience with this problem.
All remaining parameters are the same for both groups meaning that the effects of the attributes such as cost of charging, reward per 1 kWh of the sold energy, or others on the respondents‘ utility are the same regardless of their experience with driving an EV.
3.2. Gender
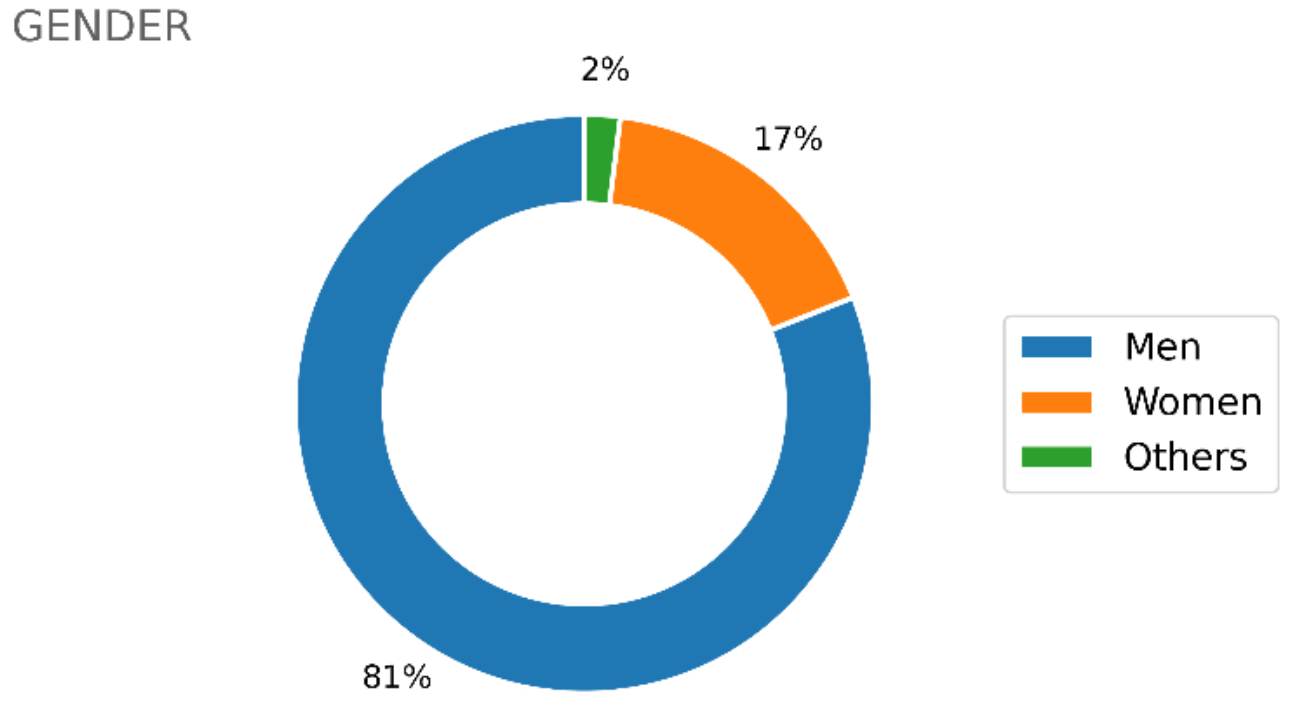
The other characteristic that the participants in the survey were asked about was their gender. The hypothesis was that participants who identify themselves with different gender could have different preferences and different valuations of attributes.
Based on the responses, the participants were divided into three main groups, i.e., women, men, and others. The percentage ratio of respondents within each group is shown in Figure 2.
The percentage of the respondents who identify themselves within the others group is very low, and so there is not enough data for the prediction model. Therefore, all estimated parameters for this group cannot be determined to have values other than zero; the general model presented in Section 2.1 or in [17] is recommended to represent this group.
The percentage of respondents identifying themselves as women is also low in comparison with the men. The dissemination process of the survey could cause this low representation. A lot of Slovak automotive groups were approached, and men usually prevail in these groups in Slovakia. However, in comparison to the group labeled as others, there is enough data to represent this group within the prediction model.
The model representing these two above-mentioned groups of this characteristic individually was compared with the model in (5–8) using the likelihood ratio test. The result was that this model is preferred over the model in (5–8). The t-test of the parameters showed that the null hypothesis that these parameters do not differ between the groups can be rejected for most of the parameters. There are only two parameters where this null hypothesis cannot be rejected, and they are the SoC and cost of charging attributes’ parameters, which means that women and men value the SoC of their EV and the cost of charging the same way.
Therefore, the most suitable model to represent data divided based on the gender characteristic was defined using the following equations:
where parameter G defines if a respondent identifies herself/himself as a woman (G = 1) or a man (G = 0). The parameters of the attributes that are different between the groups are distinguished in the subscript with symbols ‘1’ or ‘0’ in the case of a respondent that identifies herself/himself as a woman or a man, respectively. As in the previous model, the equivalent parameters in each group of conditional equations for alternatives have the same subscript in the set of equations, e.g., in Equation (13).
The estimated mean values of the attributes’ parameters with their SEM are presented in Table 5. However, the null hypothesis that the parameters , , , , and are equal to zero cannot be rejected for these parameters with a significance level equal to or lower than 5%. The estimated parameters of the model in (13–16) assuming that these parameters are irrelevant () are presented in Table 5 as well.
The results showed a difference in preference for the slow charging alternative over the opt-out option between these two groups of respondents. While women ( prefer this alternative over the opt-out option, men ( are indifferent between these two alternatives. Similar results are in the case of the alternative specific constant of the fast charging alternative (). Women highly prefer this alternative over all others alternative, the men prefer it just slightly. In contrast, in the case of the V2G service alternative (), women are indifferent between this alternative and the opt-out option, and men sense disutility with this alternative.
The only attributes that affect the utility of the V2G service alternative in the women group are the SoC ( and uncertainty measure () based on the results. All other attributes of this alternative are for this group irrelevant ().
The difference in the taste of these groups of respondents is also in the mentioned uncertainty measure attribute (). The results show that men gave greater weight to the probability that they would need to leave, and their battery would not be charged enough for the journey.
In the case of parameters of the amount of required energy , and reward per 1 kWh of the sold energy attributes , men show similar behavior as presented by the model created by the whole sample. At the same time, women are not affected by these attributes, as mentioned above.
3.3. Education
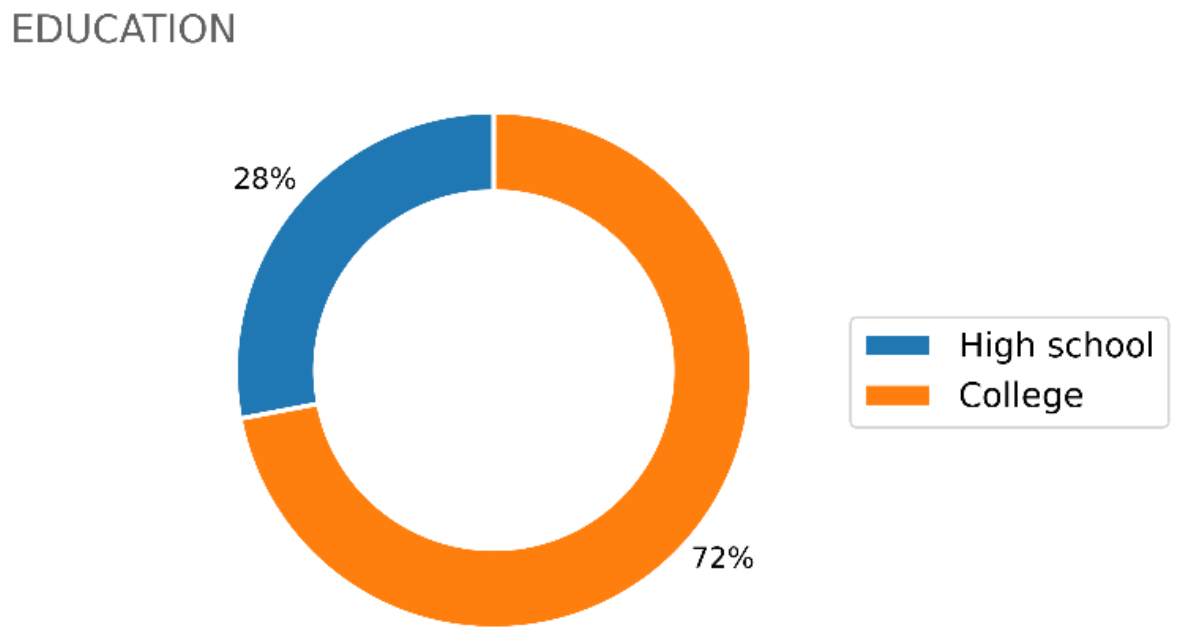
The following characteristic that the participants in the survey were asked about was their finished education status. The hypothesis was that participants with different education could have different information and perspectives on EV charging. All of this could result in different preferences and valuations of attributes.
Based on the responses, the participants were divided into three main groups, i.e., respondents with finished elementary school, finished high school, or respondents with a college degree. However, the respondents with education less than high school education were not represented in the sample. The percentage of the population with less than a high school education in Slovakia is generally low. Therefore, it was hard to collect enough data from this group. The percentage ratio of respondents from the two other groups is shown in Figure 3.
To represent the two remaining groups of this characteristic, the model representing these two groups individually was compared with the model in (5–8) using the likelihood ratio test. The result of this test, as well as of the parameters t-tests, showed that the null hypothesis that these parameters do not differ between the groups cannot be rejected.
This means that our hypothesis about the effect of different education levels on charging decisions can be rejected based on our data, at least for the groups of people with a high school or college degree.
3.4. Age
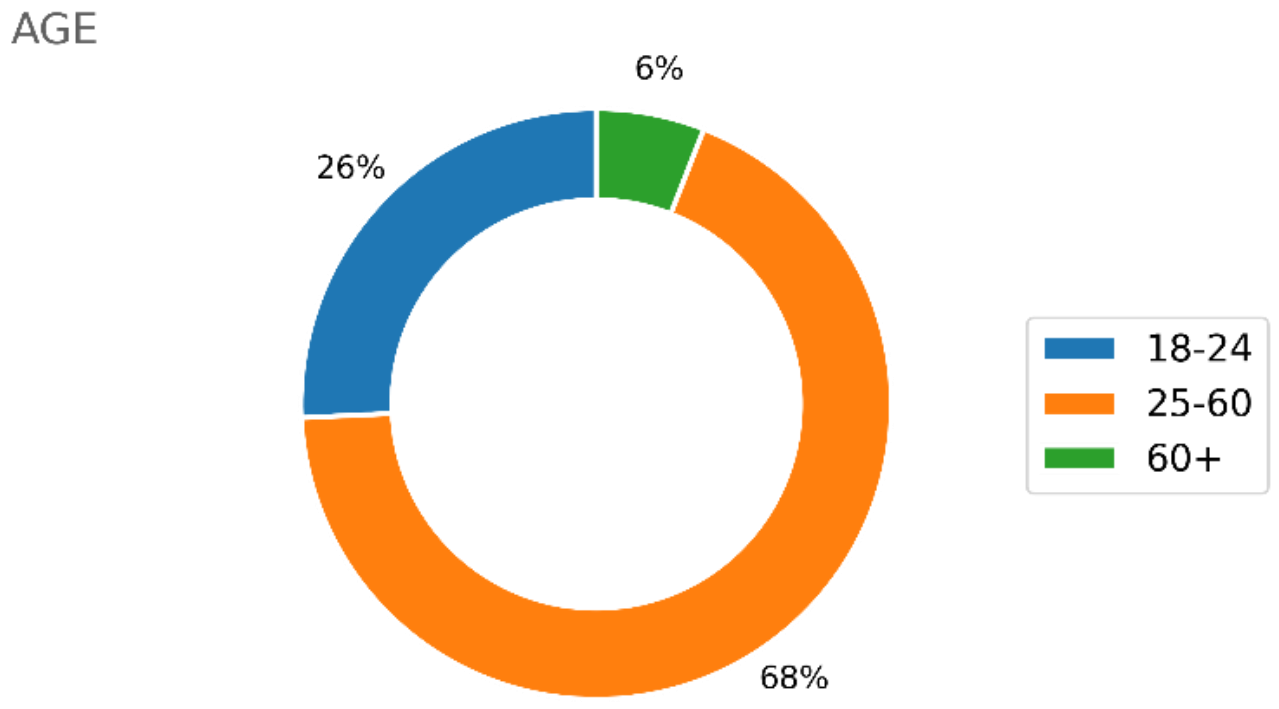
The fourth characteristic that the participants in the survey were asked about was their age. The assumed hypothesis was that participants within different age groups can value presented attributes differently, e.g., the authors expected more risk-seeking behavior by younger people represented by the smaller effect of the uncertainty measure, etc.
Based on the responses, the participants were divided into three main age groups, i.e., aged 18–24 years, 25–60 years, and above 60. The percentage ratio of respondents within each group is shown in Figure 4.
The model representing these three groups of the age characteristic individually was compared with the model in (5–8) using the likelihood ratio test. The result was that this model is preferred over the model in (5–8). The parameters’ t-test showed that the null hypothesis that these parameters do not differ between the groups can be rejected for most of the parameters. There are only two parameters that are the same across all groups, i.e., parameters of the amount of required energy and cost of charging attributes. This means that independent of their age, the respondents value the requirement for the amount of energy to sell from their EV as well as the price they would pay for charging the same.
Therefore, the resulting and most suitable model to represent data divided based on the age characteristic was defined using the following equations:
where parameter A defines if a respondent belongs to the group of respondents aged 18–24 years (A = 0), 25–60 years (A = 1), or over 60 years (A = 2). The parameters of the attributes that are different between the groups are distinguished in the subscript with symbols ‘0’, ‘1’, or ‘2′ in the case of a respondent with the age of 18–24 years, 25–60 years, or over 60 years, respectively. Some parameters are the same just in the two groups, e.g., is the same in groups of respondents with the age of 18–24 years and 25–60 years (see Equation (17)). In this case, the subscript of the concerned parameters remains the same in Equations (17)–(20).
The estimated mean values of the attributes’ parameters with their SEM are shown in Table 6. However, the null hypothesis that the parameters , , , , and are equal to zero cannot be rejected with a significance level equal to or lower than 5%. The estimated parameters of the model in (17–20), assuming that these parameters are irrelevant (), are presented in Table 6 as well.
The results in Table 6 showed that in the case of respondents aged over 60 years, the SEM of the estimated parameters is usually high. Therefore, the parameters cannot be assumed to affect their decision. This can be the result of the underrepresentation of this group in the sample (see Figure 4).
The results have also shown that respondents aged between 18–60 years are indifferent between the slow charging alternative and the opt-out option (, while respondents over 60 highly prefer this alternative (. It is similar in the case of the alternative specific constant of the fast charging alternative. The respondents aged between 18–60 years just slightly prefer this alternative over the opt-out option (). In contrast, the respondents of the remaining group prefer it even more than the slow charging option (). On the other hand, in the case of the V2G service alternative, the respondents aged over 60 are indifferent between this alternative and the opt-out option (, while respondents of the remaining groups would prefer opt-out over this alternative (.
Parameters of the generic attributes SoC () and measure of uncertainty () differ across all the groups as can be seen in Table 6. The difference between the groups of respondents with 18–24 and 25–60 years is small and roughly corresponds with the model’s results representing the whole sample. However, in the case of respondents aged over 60 years, the difference is more pronounced. Based on the results, this group of people is not affected by the state of charge of their EV when choosing between alternatives (). In the case of the probability that they would need to leave and do not have enough energy in the battery of their EV, this group is affected less by this attribute than others ().
The last parameter that has different values between these groups is the parameter of the reward per 1 kWh of the sold energy attribute (). SEM of this parameter estimated for the of respondents aged over 60 () is high. Therefore, the null hypothesis testing this attribute being irrelevant for the utility of the V2G service alternative cannot be rejected for people over 60 with a significance level lower than or equal to 5%. This means that the reward per 1 kWh of the sold energy attribute does not affect the choice of this group of people based on the acquired data. The parameter is the same in the remaining groups and has a similar value to the one in the general model with the whole sample.
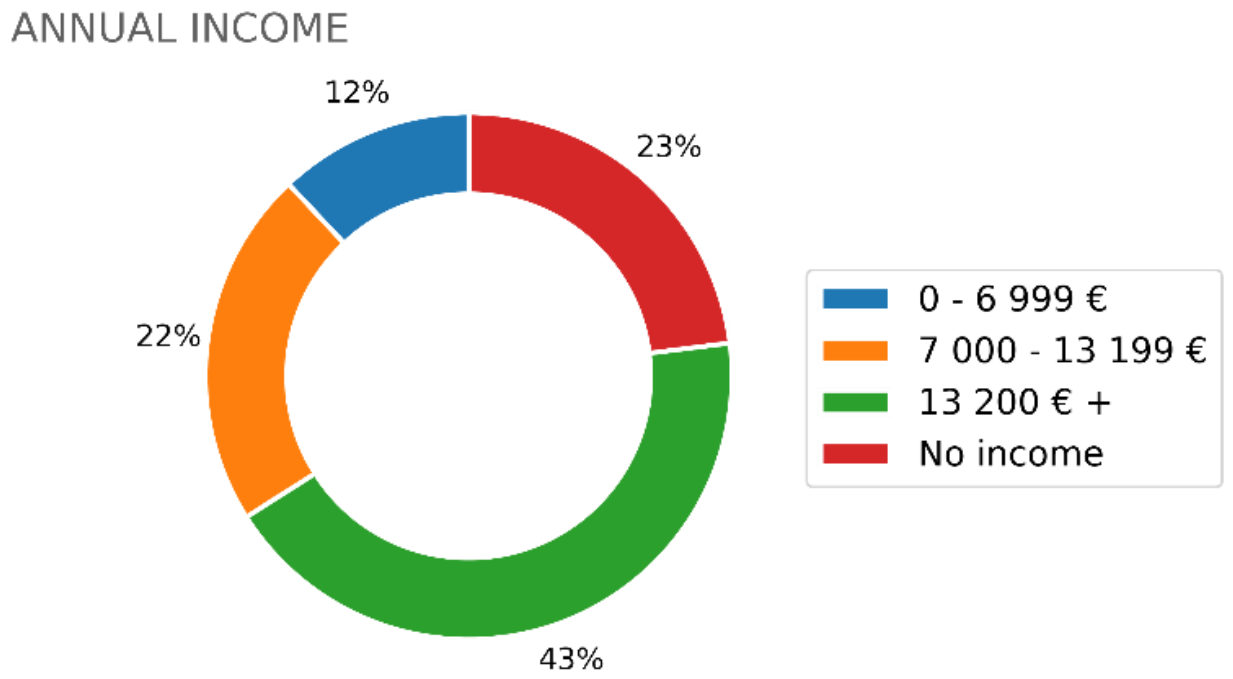
3.5. Income
The next characteristic that the participants in the survey were asked about was their annual income. The authors assumed that participants with different incomes can value presented attributes differently, mainly the cost of charging or the reward of the 1 kWh of sold energy attributes.
Based on the responses, the participants were divided into four main groups, i.e., without annual income (No income), below-average annual income in Slovakia (0–6999 €), average annual income in Slovakia (7000–13,199 €), and higher than average annual income in Slovakia (13,200 €+). The percentage ratio of respondents within each group is shown in Figure 5.
The model individually representing these groups of the income characteristic was compared with the model in (5–8) using the likelihood ratio test. The result was that this model is preferred over the model in (5–8). The results of the parameters’ t-test showed that the null hypothesis that these parameters do not differ between the groups cannot be rejected for most of the parameters. The parameters that are the same across all groups are the alternative specific constant of the fast charging alternative and the parameters of the reward for 1 kWh of sold energy, the amount of required energy, and the cost of charging attributes. This means that despite the authors’ assumptions, the data show that the respondents value the requirement for the amount of energy to sell from their EV and the price they would pay or gain for the charging/discharging the same that independent of their income.
In the case of the other attributes, there are differences in parameter value between the group of respondents with an annual income higher than average and the remaining groups. Therefore, the resulting and most suitable model to represent data divided based on the annual income characteristic was defined using the following equations:
where parameter In defines if a respondent belongs to the group of respondents with no annual income (In = 0), below-average annual income (In = 1), average annual income (In = 2), or annual income higher than the average income in Slovakia (In = 3). The parameters of the attributes that are different between the groups are distinguished in the subscript with symbols ‘0’ or ‘3’. The subscript ‘0’ represents the parameters corresponding to the groups of respondents with no annual income, below-average annual income, and average annual income, since these groups show the same behavior based on the data from the survey. The subscript ‘3’ represents the parameters showing the behavior of the respondents with an annual income higher than the average annual income in Slovakia.
The estimated mean values of the attributes’ parameters with their SEM are shown in Table 7. However, the null hypothesis that the parameters and are equal to zero cannot be rejected with a significance level equal to or lower than 5%. The estimated parameters of the model in (20–24) assuming that these parameters are irrelevant ( ) are presented in Table 7 as well.
The results showed a difference in preference for the slow charging alternative over the opt-out option between these groups of respondents. While the group of respondents with higher than average income are indifferent between these options , the respondents of the remaining groups prefer this alternative over the opt-out option .
In the case of the fast charging alternative (, the estimated parameters of the alternative specific constant for this alternative are the same for all respondents and showed that this alternative is highly preferred over the opt-out option and the slow charging alternative.
In contrast, in the case of the V2G service alternative, there is a difference in the alternative specific constant between the groups of respondents with annual income lower and higher than the average income in Slovakia. In both groups, this alternative causes disutility. However, for the respondents with annual income higher than average, this disutility is higher than in other groups . One explanation of this result could be that the group of respondents with annual income higher than average do not need to earn money by selling energy from their EV. Therefore, this alternative is for them less attractive than for the respondents with lower income.
The other two attributes showing the difference in the taste of preferences between these groups are the SoC () and measure of uncertainty (). In both cases, the respondents with annual income higher than the average value these parameters more highly than the respondents from the remaining groups (see Table 7).
As mentioned above, the parameters of the reward for 1 kWh of sold energy, amount of required energy, and cost of charging attributes are the same across the groups, and it can be assumed that they affect the utility of EV drivers the same independently of the respondent’s annual income.
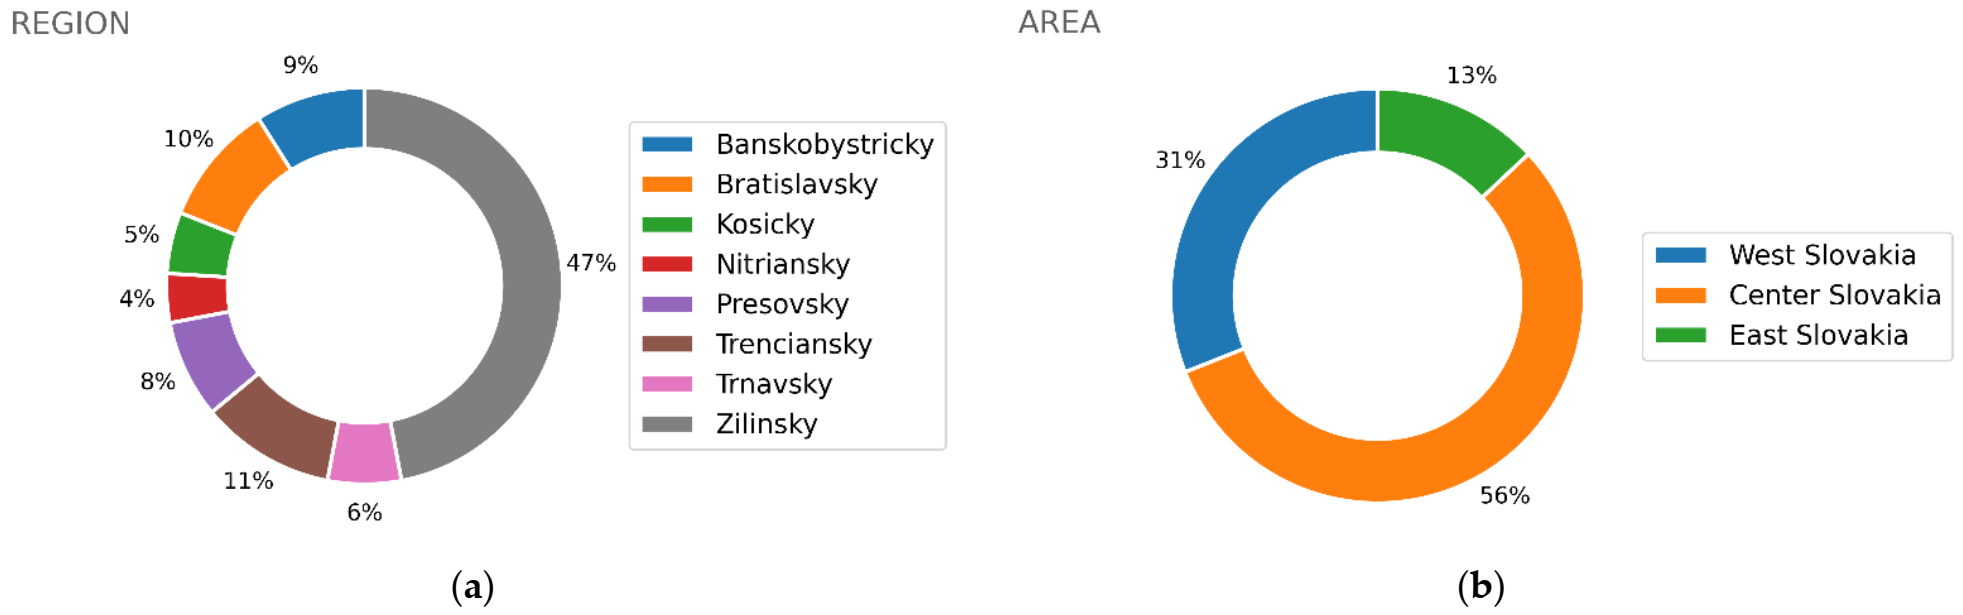
3.6. Residence
The last characteristic that the survey participants were asked about was their residence within the Regions of Slovakia. Since there is a difference between the regions in Slovakia, especially in the standard of living, authors have assumed that it can affect the EVs charging decision making.
There are eight regions in Slovakia (namely Banskobystricky, Bratislavsky, Kosicky, Nitriansky, Presovsky, Trenciansky, Trnavsky, and Zilinsky). The percentage ratio of the respondents that live in each of the regions is shown in Figure 6a. However, most of the regions are underrepresented in the sample. This underrepresentation results in a high SEM of parameters in most of the regions. Therefore, the authors have decided to divide the respondents based on the area of Slovakia, where they reside. The specific regions are situated in the specific area of Slovakia, i.e., Bratislavky, Nitriansky, Trenciansky, and Trnavsky Regions are placed in West Slovakia; Zilinsky and Banskobystricky Regions are in Center Slovakia, and Kosicky and Presovsky Regions are in East Slovakia. Based on these assumptions, the respondents were divided into these three groups. The percentage ratio of the respondents that resides in these areas is presented in Figure 6b.
The model representing these three groups of the residence characteristic individually was compared with the model in (5–8) using the likelihood ratio test. The result was that this model is preferred over the model in (5–8). The parameters’ t-tests showed that the null hypothesis that these parameters do not differ between the groups cannot be rejected for most of the parameters. The parameters that are the same across all groups are the alternative specific constant of the fast charging alternative and the parameters of the reward for 1 kWh of sold energy, the amount of required energy, and the cost of charging attributes. This means that regardless of respondents’ residence, they value the requirement for the amount of energy to sell from their EV and their price or gain for the charging/discharging the same.
Therefore, the resulting and most suitable model to represent data divided based on the age characteristic was defined using the following equations:
where parameter R defines if a respondent belongs to the group of respondents with the area of residence in West Slovakia (R = 0), Central Slovakia (R = 1), or East Slovakia (R = 2). The parameters of the attributes that are different between the groups are distinguished in the subscript with symbols ‘0’, ‘1’, or ‘2′ in case of a respondent with residence in West Slovakia, Central Slovakia, or East Slovakia, respectively. Some parameters are the same just in the two groups, e.g., , which is the same in groups of respondents with residence in West and East Slovakia. In this case, the subscript of the concerned parameters remains the same in Equations (25)–(28).
The estimated mean values of the attributes’ parameters with their SEM are shown in Table 8. However, the null hypothesis that the parameters and are equal to zero cannot be rejected with a significance level equal to or lower than 5%. The estimated parameters of the model in (25–28) assuming that these parameters are irrelevant ( ) are presented in Table 8 as well.
The results showed a difference in preference for the slow charging alternative over the opt-out option between these groups of respondents. While the group of respondents with residence in West Slovakia are indifferent between these options (), the respondents of the remaining groups prefer this alternative over the opt-out option (). The respondents from East Slovakia even prefer this alternative over the opt-out option more than the ones from Central Slovakia ().
In the case of the fast-charging alternative (, the results for the estimated parameters of the alternative specific constant for this alternative are the same for all respondents and showed that this alternative is preferred over the opt-out option and also the slow charging alternative. However, the respondents from East Slovakia prefer the slow charging alternative more than the fast-charging alternative based on the data (see Table 8). This can be the result of the difference in cost of charging between these alternatives, since the standard of living in East Slovakia is lower than in other areas of Slovakia. The cost of charging attribute parameter () has high SEM and therefore is neglected. However, the effect of such a neglected attribute can be presented within the alternative specific constant.
In contrast, in the case of the V2G service alternative, there is a difference in the alternative specific constant between the groups of respondents. In all groups, this alternative causes disutility; however, this disutility is highest in the case of the respondents’ residence in West Slovakia and lowest in the sample of respondents from Center Slovakia .
In the case of the SoC attribute, the value of the parameter is the same for the group of respondents who live in West and East Slovakia (. The value of this parameter for these groups is even twice higher than the value of the parameter for this attribute in the group of respondents from Central Slovakia (). This means that respondents from Central Slovakia are less affected by their SoC when deciding between the presented alternatives.
The measure of uncertainty affects the decision making in all presented groups as well. However, in the case of this parameter, the value is the same for the group of respondents who live in Central and East Slovakia (), and it is higher for the respondents that reside in West Slovakia .
As mentioned above, the parameters of the reward for 1 kWh of sold energy (), amount of required energy (), and cost of charging attributes () are the same across the groups, and we can assume that they are valued the same independently of the respondent’s residence.
4. Discussion
With an increasing number of electric vehicles, the involvement of the EV owners in the electric power system market and its control seems to be the only option for a stable operation of future power systems. However, these people do not know or care about the operation of the power system and follow just their interests. Therefore, defining what they prefer and how their decisions can be changed to get the EV owners’ desired behavior is necessary.
The paper presents an analysis of the decision-making process of future EV drivers based on their socio-demographic characteristics using the results from the SP survey carried out in Slovakia. The survey respondents chose between three alternatives, i.e., slow charging, fast charging, and V2G service. The considered socio-demographic characteristics of the respondents were experience with driving an EV (Exp), gender (G), education level (E), age (A), annual income (In), and residence of the respondents (R).
Section 3 contains a detailed analysis of the effect of each presented socio-demographic characteristic on the attributes of the defined alternatives. The prediction model and estimated parameters are also presented, which allows simple implementation of the model in future works. Since some of the parameters cannot be established to have values other than zero, based on the acquired data, the sets of estimated parameters with or without these parameters are presented as well. In this way, there is a possibility in future work to compromise between the efficiency and the specification of the model (Type I, Type II errors).
A brief overview of the effect of the presented characteristics on the alternative specific constants and parameters of attributes of the defined alternatives is shown in Table 9. The symbol ✓ in the table means that there is a difference in estimated parameters or the alternative specific constants established for each group within the considered characteristic. If symbol × is present, there is no difference in taste between the groups within the corresponding characteristic. The effects of individual characteristics can be compared in the columns of Table 9.
As shown in the table, the level of education (E) did not affect the respondents’ decisions about the alternatives presented in the survey. However, there were differences between the groups of all other characteristics. These differences are presented and explained in detail in subsections of Section 3. The results concerning these remaining characteristics also showed that the models representing the decisions based upon belonging to the specific group were more accurate than the general model created for the whole sample and presented briefly in Section 2.1 or in [17]. Thus, if the operators of the charging station or the future distribution network with high penetration of EVs know the structure of their customers, they could better estimate their behavior and thus the effects of these customers on the total consumption using the models presented in Section 3.
Moreover, we can assume that the operators of the charging stations or future distribution networks will want to affect these customers’ behavior in a way that is suitable for the better and more secure operation of their system. The only attributes that affect the utility of respondents and at the same time can be changed by these operators are the cost of charging (represented in Table 9 by its parameter , reward per 1 kWh of sold energy (represented in Table 9 by its parameter , and amount of required energy (represented in Table 9 by its parameter .
As shown in Table 9, the parameter of the cost of charging attribute as the only one is the same across the groups of each characteristic. Unfortunately, the null hypothesis that this parameter is equal to zero and thus that it has no effect on the utility of respondents cannot be rejected based on the acquired data. Since the cost of charging attribute was the only one with different values in slow and fast charging alternatives, the difference between the utility of these alternatives is established only by the difference in alternative specific constants. The results in Section 3 showed that the fast charging alternative is preferred over the slow charging one in all cases regardless of the socio-demographic characteristics. This means that future EV drivers always choose fast charging over slow if possible. This can significantly affect the operation of the future distribution network.
However, the results of the cost of charging attribute parameter may be caused by the low price of electrical energy. Today, most of the respondents have probably met with the gas price, which is relatively high compared to the electricity price. This is also true in the case of fast charging, even if this price is usually higher than the one with the slow charging alternative. Therefore, they could not have been so much affected by the price of charging. However, with the increasing penetration of EV drivers in the population, it can be assumed that the price for charging will become the new normal, and future EV drivers will start to perceive the changes between the price of the mentioned two alternatives more. Nevertheless, the higher investments in the construction and reinforcement of the future networks can be expected with the increasing penetration of the EVs, which can in the end lead to a higher price for EVs charging.
Unlike the cost of charging attribute, the parameters of the attributes affecting the V2G service alternative and that can be changed by operators were estimated to have values other than zero. Even though this alternative had caused the disutility of the respondents, the operators of charging stations or future networks could increase the utility of this alternative for future EV drivers by an appropriate setting of the reward as well as the required energy. Therefore, this shows the possibility of studying the appropriate setting of incentives and the different mechanisms that could help implement the V2G concept in future works. The results also showed a difference in taste between the groups of gender characteristics in both parameters. The same applies to the groups with a different age for reward per 1 kWh of the sold energy attribute. Therefore, if the operator knows his customers’ composition based on one of these characteristics, the mechanisms mentioned above and incentives can be defined with even higher accuracy using the models presented in Section 3.
Author Contributions
Conceptualization: M.K. and P.B.; methodology: M.K.; software: M.K.; validation: M.K. and P.B.; formal analysis: M.K.; investigation: M.K.; resources: M.K.; data curation: M.K.; writing—original draft preparation: M.K.; writing—review and editing: P.B.; visualization: M.K.; supervision: P.B.; project administration: M.K.; funding acquisition: M.K. All authors have read and agreed to the published version of the manuscript.
Funding
This publication was realized with the support of Operational Program Integrated Infrastructure 2014–2020 of the project: Innovative Solutions for Propulsion, Power, and Safety Components of Transport Vehicles, code ITMS 313011V334, co-financed by the European Regional Development Fund.
Institutional Review Board Statement
Not applicable.
Informed Consent Statement
Not applicable.
Data Availability Statement
The data are presented and thoroughly described in the paper.
Conflicts of Interest
The authors declare no conflict of interest.
References
- Liao, F.; Molin, E.; Van Wee, B. Consumer preferences for electric vehicles: A literature review. Transp. Rev. 2016, 37, 252–275. [Google Scholar] [CrossRef] [Green Version]
- Noel, L.; Carrone, A.P.; Jensen, A.F.; de Rubens, G.Z.; Kester, J.; Sovacool, B.K. Willingness to pay for electric vehicles and vehicle-to-grid applications: A Nordic choice experiment. Energy Econ. 2019, 78, 525–534. [Google Scholar] [CrossRef]
- Sovacool, B.K.; Kester, J.; Noel, L.; de Rubens, G.Z. Income, political affiliation, urbanism and geography in stated preferences for electric vehicles (EVs) and vehicle-to-grid (V2G) technologies in Northern Europe. J. Transp. Geogr. 2019, 78, 214–229. [Google Scholar] [CrossRef]
- Parsons, G.R. Can Vehicle-to-Grid Revenue Help Electric Vehicles on the Market? Working Paper No. 2011-21; University of Delaware: Newark, DE, USA, 2011. [Google Scholar]
- Kormos, C.; Axsen, J.; Long, Z.; Goldberg, S. Latent demand for zero-emissions vehicles in Canada (Part 2): Insights from a stated choice experiment. Transp. Res. Part D Transp. Environ. 2019, 67, 685–702. [Google Scholar] [CrossRef]
- National Plug-In Electric Vehicle Infrastructure Analysis. Available online: https://www.nrel.gov/docs/fy17osti/69031.pdf (accessed on 18 March 2021).
- Ardakanian, O.; Keshav, S.; Rosenberg, C. Real-Time Distributed Control for Smart Electric Vehicle Chargers: From a Static to a Dynamic Study. IEEE Trans. Smart Grid 2014, 5, 2295–2305. [Google Scholar] [CrossRef]
- Xydas, E.; Marmaras, C.; Cipcigan, L.M.; Jenkins, N.; Carroll, S.; Barker, M. A data-driven approach for characterising the charging demand of electric vehicles: A UK case study. Appl. Energy 2016, 162, 763–771. [Google Scholar] [CrossRef] [Green Version]
- Lopes, J.A.P.; Soares, F.; Almeida, P.R.; Moreira da Silva, M. Smart Charging Strategies for Electric Vehicles: Enhancing Grid Performance and Maximizing the Use of Variable Renewable Energy Resources. In Proceedings of the EVS 24 International Battery, Hybrid and Fuel Cell Electric Vehicle Symposium, Stavanger, Norway, 13–16 May 2009. [Google Scholar]
- Sovacool, B.K.; Axsen, J.; Kempton, W. The Future Promise of Vehicle-to-Grid (V2G) Integration: A Sociotechnical Review and Research Agenda. Annu. Rev. Environ. Resour. 2017, 42, 377–406. [Google Scholar] [CrossRef] [Green Version]
- dell’Olio, L.; Ibeas, A.; de Ona, J.; de Ona, R. Chapter 4—Designing a Survey for Public Transport Users. In Public Transportation Quality of Service; Elsevier: Amsterdam, The Netherlands, 2018; pp. 49–61. [Google Scholar]
- Yang, Y.; Yao, E.; Yang, Z.; Zhang, R. Modeling the charging and route choice behavior of BEV drivers. Transp. Res. Part C Emerg. Technol. 2016, 65, 190–204. [Google Scholar] [CrossRef]
- Helmus, J.R.; Lees, M.H.; Hoed, R.V.D. A data driven typology of electric vehicle user types and charging sessions. Transp. Res. Part C Emerg. Technol. 2020, 115, 102637. [Google Scholar] [CrossRef]
- Pan, L.; Yao, E.; MacKenzie, D. Modeling EV charging choice considering risk attitudes and attribute non-attendance. Transp. Res. Part C Emerg. Technol. 2019, 102, 60–72. [Google Scholar] [CrossRef]
- Will, C.; Schuller, A. Understanding user acceptance factors of electric vehicle smart charging. Transp. Res. Part C Emerg. Technol. 2016, 71, 198–214. [Google Scholar] [CrossRef] [Green Version]
- Daina, N.; Sivakumar, A.; Polak, J.W. Electric vehicle charging choices: Modelling and implications for smart charging services. Transp. Res. Part C Emerg. Technol. 2017, 81, 36–56. [Google Scholar] [CrossRef]
- Kajanova, M.; Bracinik, P.; Belány, P. Analysis of the discrete choice model representing the electric vehicle owners’ behavior in Slovakia. Electr. Eng. 2021, 1–11. [Google Scholar] [CrossRef]
- Niklas, U.; Von Behren, S.; Chlond, B.; Vortisch, P. Electric Factor—A Comparison of Car Usage Profiles of Electric and Conventional Vehicles by a Probabilistic Approach. World Electr. Veh. J. 2020, 11, 36. [Google Scholar] [CrossRef]
- The Total Number of Registered Vehicles in Slovakia. Available online: https://www.minv.sk/?celkovy-pocet-evidovanych-vozidiel-v-sr (accessed on 18 March 2021).
- Electromobility of Slovak Republic in Numbers. Available online: https://e-mobility.sk/wp-content/uploads/2020/08/Elektromobilita-v-%C4%8D%C3%ADslach-Q2-2020.pdf (accessed on 18 March 2021).
- Akaichi, F. Discrete Choice Experiments; SRUC: Edinburgh, Scotland. Available online: https://www.sruc.ac.uk/download/downloads/id/4344/choice_experiments.pdf (accessed on 19 April 2021).
- Aizaki, H.; Nishimura, K. Design and Analysis of Choice Experiments Using R: A Brief Introduction. Agric. Inf. Res. 2008, 17, 86–94. [Google Scholar] [CrossRef] [Green Version]
- Fedorov, V.V. Theory of Optimal Experiments (Review). Biometrika 1972, 59, 697–698. [Google Scholar]
- McFadden, D. Econometric Models of Probabilistic Choice. Available online: https://eml.berkeley.edu/~mcfadden/discrete/ch5.pdf (accessed on 18 March 2021).
- Train, K.E. Discrete Choice Methods with Simulation; Cambridge University Press: Cambridge, UK, 2009. [Google Scholar]
- Koppelman, F.; Bhat, C. A Self Instructing Course in Mode Choice Modeling: Multinomial and Nested Logit Models. Available online: http://www.caee.utexas.edu/prof/bhat/courses/lm_draft_060131final-060630.pdf (accessed on 18 March 2021).
- Greco, S.; Matarazzo, B.; Slowinski, R. Rough sets theory for multicriteria decision analysis. Eur. J. Oper. Res. 2001, 129, 1–47. [Google Scholar] [CrossRef]
- Keeney, R.L.; Raiffa, H. Decisions with Multiple Objectives: Preferences and Value Tradeoffs; J. Wiley: New York, NY, USA, 1976. [Google Scholar]
- Bierlaire, M. PythonBiogeme: A Short Introduction; Report TRANSP-OR 160706, Series on Biogeme; Transport and Mobility Laboratory, School of Architecture, Civil and Environmental Engineering, Ecole Polytechnique Fédérale de Lausanne: Lausanne, Switzerland, 2016. [Google Scholar]
- Dekking, F.M.; Kraaikamo, F.M.; Lopuhaa, C.; Meester, L.E. A Modern Introduction to Probability and Statistics: Understanding Why and How; Springer: Berlin/Heidelberg, Germany, 2005; ISBN 9781852338961. [Google Scholar]
Figure 1.
The percentage ratio of responses to a question about an experience with driving an EV.

Figure 2.
The percentage ratio of responses to a question about gender.

Figure 3.
The percentage ratio of responses to a question about their achieved education level.

Figure 4.
The percentage ratio of responses to a question about their age.

Figure 5.
The percentage ratio of responses to a question about their annual income.

Figure 6.
The percentage ratio of responses to a question about the place in which respondents live within Slovakia. (a) Distribution over the regions of Slovakia. (b) Distribution over the area of Slovakia.
Figure 6.
The percentage ratio of responses to a question about the place in which respondents live within Slovakia. (a) Distribution over the regions of Slovakia. (b) Distribution over the area of Slovakia.


Table 1.
The list of alternatives.
| Indexing | Alternative | Charging/Discharging Rate |
|---|---|---|
| 1 | Slow charging | 20 kW |
| 2 | Fast charging | 60 kW |
| 3 | V2G service | 60 kW |
| 4 | Opt out |
Table 2.
The list of attributes.
| Alternative | Attribute Name | Attribute Symbol |
|---|---|---|
| All | SoC | SoC |
| All | Measure of uncertainty | p |
| Slow charging | Cost of charging | C€1 |
| Fast charging | Cost of charging | C€2 |
| V2G service | Amount of required energy | E |
| V2G service | Reward per 1 kWh of the sold energy | R€ |
Table 3.
Estimated parameters of the model [17].
Table 3.
Estimated parameters of the model [17].
| Estimated Parameter | Mean Value | SEM | p-Value | Mean Value with Set to 0 | SEM | p-Value |
|---|---|---|---|---|---|---|
| 0.222 | 0.0942 | 0.02 | 0.167 | 0.0759 | 0.03 | |
| 0.514 | 0.139 | 0.00 | 0.397 | 0.0736 | 0.00 | |
| −1.77 | 0.224 | 0.00 | −1.76 | 0.221 | 0.00 | |
| 0.816 | 0.11 | 0.00 | 0.817 | 0.11 | 0.00 | |
| 2.29 | 0.111 | 0.00 | 2.29 | 0.111 | 0.00 | |
| 0.376 | 0.383 | 0.33 | - | - | - | |
| 2.00 | 0.429 | 0.00 | 1.97 | 0.421 | 0.00 | |
| −3.40 | 0.64 | 0.00 | −3.38 | 0.637 | 0.00 |
Table 4.
Estimated parameters of the model with the experience characteristic.
| Estimated Parameter | All Parameters | Set to 0 | ||
|---|---|---|---|---|
| Mean Value | SEM | Mean Value | SEM | |
| −0.0455 | 0.139 | 0 | - | |
| 0.355 | 0.0967 | 0.362 | 0.0591 | |
| 0.510 | 0.139 | 0.459 | 0.0467 | |
| −1.78 | 0.224 | −1.79 | 0.223 | |
| 0.817 | 0.110 | 0.900 | 0.0928 | |
| 2.63 | 0.172 | 2.58 | 0.160 | |
| 2.12 | 0.119 | 2.10 | 0.116 | |
| 0.379 | 0.384 | 0 | - | |
| 2.00 | 0.430 | 1.97 | 0.422 | |
| −3.40 | 0.640 | −3.31 | 0.624 | |
Table 5.
Estimated parameters of the model with a gender characteristic.
| Estimated Parameter | All Parameters | , and Set to 0 | ||
|---|---|---|---|---|
| Mean Value | SEM | Mean Value | SEM | |
| 0.938 | 0.156 | 0.866 | 0.138 | |
| 0.0919 | 0.100 | 0 | - | |
| 1.20 | 0.182 | 1.08 | 0.129 | |
| 0.399 | 0.143 | 0.245 | 0.0348 | |
| −0.537 | 0.398 | 0 | - | |
| −2.29 | 0.266 | −2.25 | 0.263 | |
| 0.859 | 0.112 | 0.812 | 0.0811 | |
| 1.18 | 0.167 | 1.19 | 0.186 | |
| 2.71 | 0.138 | 2.72 | 0.120 | |
| 0.389 | 0.388 | 0 | - | |
| 0.853 | 0.823 | 0 | - | |
| 2.60 | 0.503 | 2.55 | 0.493 | |
| −1.04 | 1.26 | 0 | - | |
| −4.47 | 0.745 | −4.5 | 0.724 | |
Table 6.
Estimated parameters of the model with the age characteristic.
| Estimated Parameter | All Parameters | , and Set to 0 | ||
|---|---|---|---|---|
| Mean Value | SEM | Mean Value | SEM | |
| 0.172 | 0.096 | 0 | - | |
| 1.34 | 0.384 | 1.28 | 0.245 | |
| 0.465 | 0.150 | 0.244 | 0.0625 | |
| 0.480 | 0.141 | 0.260 | 0.0388 | |
| 1.45 | 0.392 | 1.33 | 0.231 | |
| −1.83 | 0.229 | −1.78 | 0.221 | |
| −0.706 | 0.680 | 0 | - | |
| 1.02 | 0.141 | 0.896 | 0.120 | |
| 0.823 | 0.117 | 0.697 | 0.0903 | |
| −0.0375 | 0.451 | 0 | - | |
| 2.92 | 0.215 | 2.96 | 0.210 | |
| 2.18 | 0.125 | 2.22 | 0.116 | |
| 1.31 | 0.407 | 1.25 | 0.421 | |
| 0.373 | 0.384 | 0 | - | |
| 1.98 | 0.441 | 1.95 | 0.430 | |
| 2.49 | 1.60 | 0 | - | |
| −3.38 | 0.640 | −3.48 | 0.585 | |
Table 7.
Estimated parameters of the model with the annual income characteristic.
| Estimated Parameter | All Parameters | and Set to 0 | ||
|---|---|---|---|---|
| Mean Value | SEM | Mean Value | SEM | |
| 0.365 | 0.0978 | 0.310 | 0.0587 | |
| 0.0562 | 0.103 | 0 | - | |
| 0.523 | 0.139 | 0.408 | 0.0436 | |
| −1.42 | 0.230 | −1.41 | 0.228 | |
| −2.38 | 0.256 | −2.37 | 0.255 | |
| 0.594 | 0.120 | 0.592 | 0.105 | |
| 1.23 | 0.159 | 1.23 | 0.142 | |
| 1.97 | 0.123 | 1.97 | 0.118 | |
| 2.87 | 0.201 | 2.87 | 0.195 | |
| 0.361 | 0.384 | 0 | - | |
| 2.02 | 0.428 | 1.99 | 0.420 | |
| −3.40 | 0.636 | −3.38 | 0.623 | |
Table 8.
Estimated parameters of the model with the area of residence characteristic.
| Estimated Parameter | All Parameters | and Set to 0 | ||
|---|---|---|---|---|
| Mean Value | SEM | Mean Value | SEM | |
| 0.00933 | 0.108 | 0 | - | |
| 0.279 | 0.0982 | 0.251 | 0.0619 | |
| 0.519 | 0.127 | 0.492 | 0.101 | |
| 0.513 | 0.139 | 0.427 | 0.0477 | |
| −2.40 | 0.254 | −2.40 | 0.253 | |
| −1.48 | 0.230 | −1.47 | 0.229 | |
| −1.83 | 0.276 | −1.84 | 0.275 | |
| 1.27 | 0.144 | 1.31 | 0.129 | |
| 0.512 | 0.121 | 0.545 | 0.107 | |
| 3.00 | 0.203 | 2.98 | 0.196 | |
| 2.05 | 0.117 | 2.04 | 0.114 | |
| 0.370 | 0.385 | 0 | - | |
| 2.01 | 0.429 | 1.98 | 0.422 | |
| −3.40 | 0.639 | −3.36 | 0.626 | |
Table 9.
Overview of effects of investigated characteristics on attributes valuation.
| Characteristics/ Parameters | Exp | G | E | A | In | R |
|---|---|---|---|---|---|---|
| ✓ | ✓ | × | ✓ | ✓ | ✓ | |
| × | ✓ | × | ✓ | × | × | |
| × | ✓ | × | ✓ | ✓ | ✓ | |
| × | × | × | ✓ | ✓ | ✓ | |
| ✓ | ✓ | × | ✓ | ✓ | ✓ | |
| × | × | × | × | × | × | |
| × | ✓ | × | ✓ | × | × | |
| × | ✓ | × | × | × | × |
Publisher’s Note: MDPI stays neutral with regard to jurisdictional claims in published maps and institutional affiliations. |
© 2021 by the authors. Licensee MDPI, Basel, Switzerland. This article is an open access article distributed under the terms and conditions of the Creative Commons Attribution (CC BY) license (https://creativecommons.org/licenses/by/4.0/).
Share and Cite
MDPI and ACS Style
Kajanova, M.; Bracinik, P. Definition of Discrete Choice Models of EV Owners Based on Different Socio-Demographic Aspects. Appl. Sci. 2021, 11, 3679. https://0-doi-org.brum.beds.ac.uk/10.3390/app11083679
AMA Style
Kajanova M, Bracinik P. Definition of Discrete Choice Models of EV Owners Based on Different Socio-Demographic Aspects. Applied Sciences. 2021; 11(8):3679. https://0-doi-org.brum.beds.ac.uk/10.3390/app11083679
Chicago/Turabian StyleKajanova, Martina, and Peter Bracinik. 2021. "Definition of Discrete Choice Models of EV Owners Based on Different Socio-Demographic Aspects" Applied Sciences 11, no. 8: 3679. https://0-doi-org.brum.beds.ac.uk/10.3390/app11083679
Note that from the first issue of 2016, this journal uses article numbers instead of page numbers. See further details here.