Article

Cottonseed Kernel Powder as a Natural Health Supplement: An Approach to Reduce the Gossypol Content and Maximize the Nutritional Benefits

1
College of Agricultural Engineering, Jawaharlal Nehru Krishi Vishwavidyalaya (JNKVV), Jabalpur 482004, Madhya Pradesh, India
2
Ginning Training Centre, ICAR-Central Institute for Research on Cotton Technology, Nagpur 440023, Maharashtra, India
3
ICAR-National Bureau of Agriculturally Important Microorganisms, Kushmaur, Mau 275101, Uttar Pradesh, India
4
Department of Mechanical Engineering, GH Raisoni College of Engineering, Nagpur 440016, Maharashtra, India
5
Division of Crop Physiology, Biochemistry and Post-Harvest Technology, ICAR-Central Potato Research Institute, Shimla 171001, India
6
Chemical and Biochemical Processing Division, ICAR-Central Institute for Research on Cotton Technology, Mumbai 400019, India
7
Clinic for Conservative Dentistry and Periodontology, School of Dental Medicine, Christian-Albrecht’s University, 24105 Kiel, Germany
*
Authors to whom correspondence should be addressed.
Submission received: 26 March 2021 / Revised: 21 April 2021 / Accepted: 23 April 2021 / Published: 26 April 2021
(This article belongs to the Special Issue New Trends in Waste Management Models)

Abstract

:
Cottonseed is one of the important by-products of the cotton crop. Researchers claim that cottonseed with less than 0.45% of gossypol is quite good for human consumption and animal feeding because it is a rich source of protein, edible oil, and energy. Total and free gossypols are the influencing parameters that reduce the edible nature of the cottonseed. In the present work, multiple quadratic regression models have been prepared to predict the reduction in the free and total gossypol percent. This response surface method (RSM)-based approach was applied to investigate the combined effect between input parameters such as acetone level, time of extraction, liquid-to-solid ratio (LSR), and the number of extraction cycles, whereas output responses are free and total gossypol reduction percentage. Analysis of Variance (ANOVA) has been performed to determine the highly significant parameter. The optimum combination of input parameters was determined using the RSM-based desirability approach, and confirmatory experiments were performed to validate the combination. Results revealed that the number of extraction cycles and liquid-to-solid ratio significantly affects the reduction of free and total gossypol levels. The values of r-square were found above 0.9, which indicates that the developed models are suitable and reliable for predicting free and total gossypol reduction percentage.

1. Introduction

Cottonseed is the main by-product of cotton obtained after the ginning process. It constitutes a two-thirds portion of the seed cotton. Cottonseed has the potential to develop nutritional food supplements for human foodstuffs [1,2,3,4]. However, the development of these kinds of products from cottonseed has been restricted, primarily because of the presence of the toxic compound gossypol (2,2′-Bis(formyl-1,6,7-trihydroxy-5-isopropyl-3-methylnaphthalene). Many studies determined that low levels of cottonseed meal can be included as a protein source in animal feed, but higher replacement levels can lead to significantly decreased growth performance and mortality due to the presence of gossypol [5]. Gossypol is a polyphenolic compound that has a bulky hydrophobic bi naphthalene structure that can easily diffuse through the cell membrane and cause toxicity. The reactivity of phenolic hydroxyl groups and carbonyl groups makes gossypol chemically reactive. Gossypol is generally present in two forms, viz. free and bound gossypol. According to the American Oil Chemists Society (AOCS) (Ba 7-58-1986), the gossypol and its derivatives, which can be extracted using 70% aqueous acetone, are known as free gossypol [6]. Bound gossypol (BG) takes the form when cottonseed is processed, where gossypol reacts with the epsilon group of amino acids, especially lysine and arginine. Total gossypol (TG) (FG and BG) is defined as gossypol and its derivatives, which can hydrolyze and complexed with 3-amino-1-propanol in dimethyl formamide solution to form a diamino propanol complex (AOCS Ba 8-78) whereas BG is TG minus FG.
U.S. Food and Drug Administration (FDA), 1974 set the limit for free gossypol inhuman food products at 450 ppm [7]. While the United Nations Food and Agriculture Organization (FAO) and World Health Organization (WHO) has set limits for free and total gossypol at 600 ppm and 12,000 ppm, respectively [3]. Gossypol reduction (both FG and TG) up to safe limits may increase its importance and application as food and animal feed in India and other developing countries. Gossypol toxicity in cottonseed is the major concern that causes many problems in monogastric animals, such as decreased growth rate, fertility depression, internal organ abnormalities, feed conversion, and low protein digestibility. On the other hand, if gossypol is suitably extracted from cottonseed, it may be employed for various medicinal purposes such as anti-cancer, antiseptic, anti-fertility agents, and antiviral activity [8].
Several approaches have been performed for the reduction of gossypols such as pressure cooking [9], hydraulic pressing, screw pressing [10], solvent/alkali-salt extraction [3,11,12], liquid cyclone process [3,13], microbial fermentation [14,15,16], and ultrasound technique for detoxification of gossypol from cottonseed meal [17]. Among all methods, the solvent-based removal of gossypol from cottonseed meal has been found commercially viable due to the dissolution of the solute (gossypol) in the acidified solvents [18,19]. Some widely used solvents are hexane, acetone, ethanol, methanol, isopropanol, butanol, chloroform, and pentane. Dechary et al. (1952) reported that the butanone-water pair containing 10% of water can reduce free gossypol to 0.054% [18]. Saxena et al. (2012) used ethanol for the removal of gossypol from defatted cottonseed at a temperature below 323 K that could reduce 62% gossypol [20]. Cherry and Gray (1981) investigated the use of methylene chloride for the reduction of FG and TG from defatted cottonseed meal. Authors suggested that low levels of water and acetic acid in propylene glycol aided methylene chloride to reduce FG and TG up to 0.013% and 0.15%, respectively [11]. Singh et al. (2019) used a mixed solvent comprised of butanol-ethanol-water (80:15:5 v/v) acidified with 0.5 M oxalic acid. The experiment was performed at a solvent-to-seed ratio of 15, extraction time 180 min, and temperature 348 K. In their study, they could reduce 94% gossypol from defatted cottonseed meal [8].
Among the various extraction methods, extraction with acetone was found a desirable choice to reduce FG from cottonseed meal [21]. In a study, a mixture of acetone and n-hexane was used to reduce gossypol from cottonseed flakes and found that 25% acetone has reduced FG by 90% [22]. In another study, a mixture of acetone, ethanol, and water acidified with phosphoric acid was applied to reduce TG from cottonseed meal. The mixture solvents reduced TG significantly [23]. Gerasimidis et al. (2007) also observed that aqueous acetone is effective for the reduction of FG to a very low level using a two-stage solvent extraction process that provides 72% protein concentrate [2]. Pons and Eaves (1967) revealed that acetone containing 25–30% water removes a maximum of 96% of FG, most of the free fatty acids, about half the raffinose, negligible quantity of oil and protein from cottonseed flakes at temperature 25–30 °C. Other parameters such as successive extraction, liquid-to-solid ratio (LSR), temperature, time, pressure, and pH affect the gossypol reduction as well [24]. Saxena et al. (2015) studied the effects of important parameters such as temperature, solvent to solid ratio, time of extraction, and extraction efficiency. The author reported that these input factors greatly affect the extraction of gossypol from the cottonseed meal [25]. Similarly, Zhang et al. (2006) performed the experimental investigation to determine the optimal process parameters such as for the reduction in gossypol level in cottonseed meal [14].
Although numerous attempts have been made for gossypol reduction, mainly FG from cottonseed meal; however, very few studies have been reported for TG reduction from cottonseed kernel to a safe level that is fit for human and animal feed. The TG may be toxic to the monogastric animals if its hydrolysis takes place by getting favorable conditions in the stomach, such as a low pH environment. In addition, studies on the combined effects of effective parameters on gossypol reduction are not available. Moreover, no study has been performed for the preparation of prediction models that can predict the FG and TG percentage reduction in the cottonseed kernel powder (CSKP). In the present investigation, experiments were conducted to reduce both FG and TG to the minimum level. Response surface methodology (RSM) based approach was conducted to determine the combined effects of various process parameters viz. acetone level, time, LSR, and the number of extraction cycles on FG and TG reduction percentage. In continuation of this, a quadratic regression model for predicting the FG and TG reduction percentage was developed. Analysis of Variance (ANOVA) has been performed to determine the highly significant parameter. Finally, the optimal parametric combination of input variables that provide better FG and TG percentage reduction is determined by the RSM-based desirability approach.
RSM is a collection of mathematical and statistical techniques that are useful for modeling and analysis of various problems. In the RSM technique, responses are optimized by changing different variables [26]. It shows a relationship between measured responses and various input variables. RSM is helpful to optimize, design, develop, or improve any procedure where responses are affected by various factors [27]. There are six steps of the RSM method, (1) to declare the input variables and the required output responses, (2) To adopt an experimental design plan, (3) to perform regression analysis with the quadratic model of RSM, (4) to find the variables that significantly affect the output responses by carried out statistical analysis of variance (ANOVA) for the independent input variables, (5) to determine the situation of the quadratic model of RSM and decide whether the model of RSM needs screening variables or not, (6) to optimize, conduct confirmation experiment and verify the predicted performance characteristics. Many studies have been carried out in processing industries to optimize process conditions such as extraction of oil, protein, phenolic compounds, pigments, polysaccharides using RSM [28].

2. Materials and Methods

2.1. Materials

Cottonseed hybrid variety YUVA BG was obtained from Ginning Training Centre, ICAR-Central Institute for Research on Cotton Technology, Nagpur, for the experiment. All the chemicals used in the research were of analytical grade. The make of chemicals such as acetone, hexane, isopropanol, glacial acetic acid, 3-amino-1-propanol, N,N dimethyl formamide, aniline, hydrochloric acid used in the study was Fisher Scientific, India. Standard solutions of gossypol were prepared using gossypol standard (Sigma Aldrich, Germany).

2.2. Methodology

2.2.1. Sample Preparation

The cottonseeds were first delinted and dehulled in the cottonseed processing plant situated at Ginning Training Centre, ICAR-CIRCOT, Nagpur, India. The dehulled cottonseed was sun-dried, followed by cleaned using different sizes of screens to separate hulls, dust particles, leaves, stones, etc. The cleaned cottonseed kernels were milled using an electric grinder and passed through the standard mesh (No. 20) to obtain kernel powder of average particle size 0.8 mm. This CSKP was used for conducting experiments.

2.2.2. Analytical Methods

The initial value of free gossypol (Fg), total gossypol (Tg), and moisture content of the CSKP were determined. The moisture content of the CSKP was measured by drying 5 g of sample in a hot air oven (WISWO India) at 105 °C for 2 h as recommended in AOCS official method Ba 2a-38 [29]. The samples were allowed to cool in a desiccator for 5 min, and moisture content was determined by weight loss. According to the American Oil Chemists Society (AOCS), official methods Ba 7-58 the free gossypol was determined in this study [30], whereas total gossypol was determined according to AOCS official methods Ba 8-78 [31,32]. The method involves the development of a colored complex of aniline with gossypol extracted with neutralized complexing reagent 3-amino-1-propanol, glacial acetic acid, and dimethyl formamide (2:10:88 v/v). All measurements were carried out in triplicate, and average values were recorded.

2.2.3. Extraction Variables

In this study, four variables were selected to perform the experiments are acetone percentage (A), time of extraction (t), liquid-to-solid ratio (Rlsr), and numbers of extraction cycles (Nx). Acetone percentage means the percent of acetone used in water to prepare a solution for the treatment of CSKP. Time of extraction (t) refers to the time required for the maximum release of gossypol from the sample when the sample was kept under shaking conditions. LSR denotes the ratio of solution (aqueous acetone) to a sample of cottonseed kernel powder. Extraction refers to the process of shaking the sample, followed by filtration using filter paper to separate the released gossypol from the sample. The number of extraction cycles indicates the repetition of the process of shaking and filtration for maximum possible removal of gossypol from the particular sample. The variables and their different levels used have shown in Table 1.
In this study, acetone has been used for gossypol extraction from cottonseed kernel. Researchers have used acetone for the extraction of oil from different oilseeds. Kuk et al. 2005 reported the addition of 25% of acetone in hexane during extraction of oil from cottonseed meal. Pelitire et al. (2014) suggested the acetone GRAS (generally considered safe) is used in food processing and capable of dissolving gossypol [23]. During the drying of the sample, the residual solvents (acetone, if any) are evaporated completely [22]. Considering the above points, the method employed in the study could be a food-safe method of gossypol reduction.

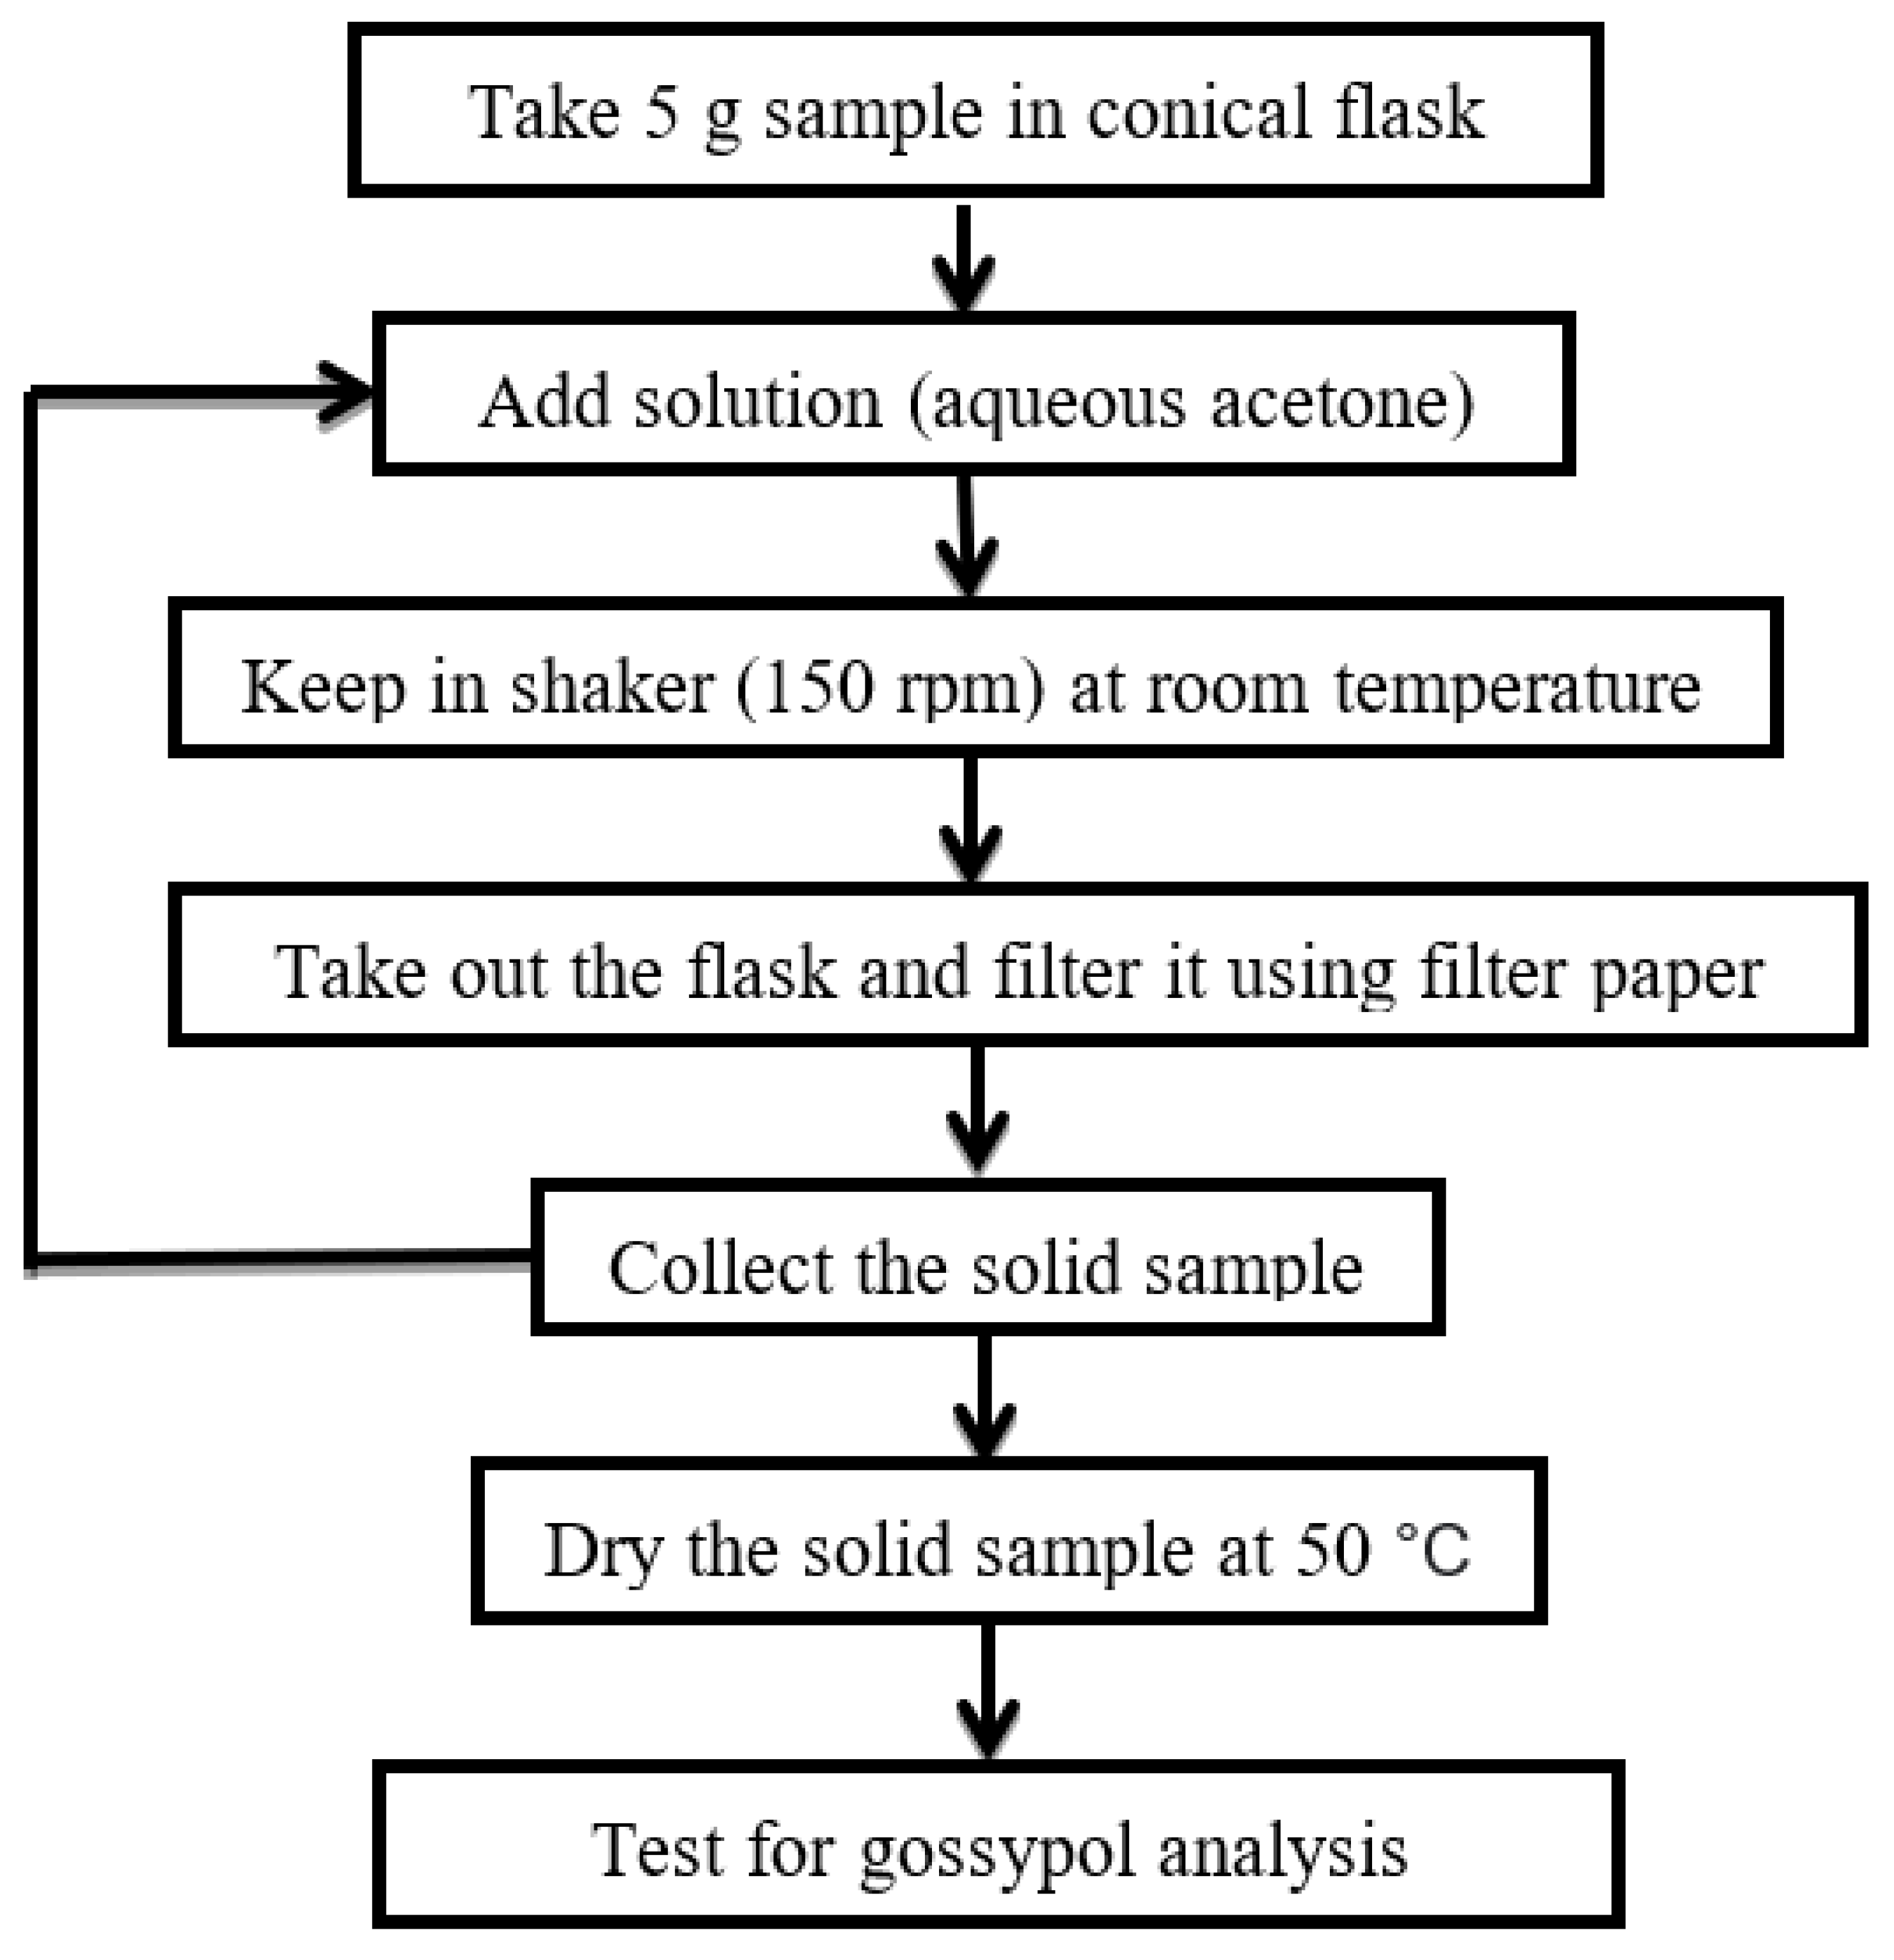
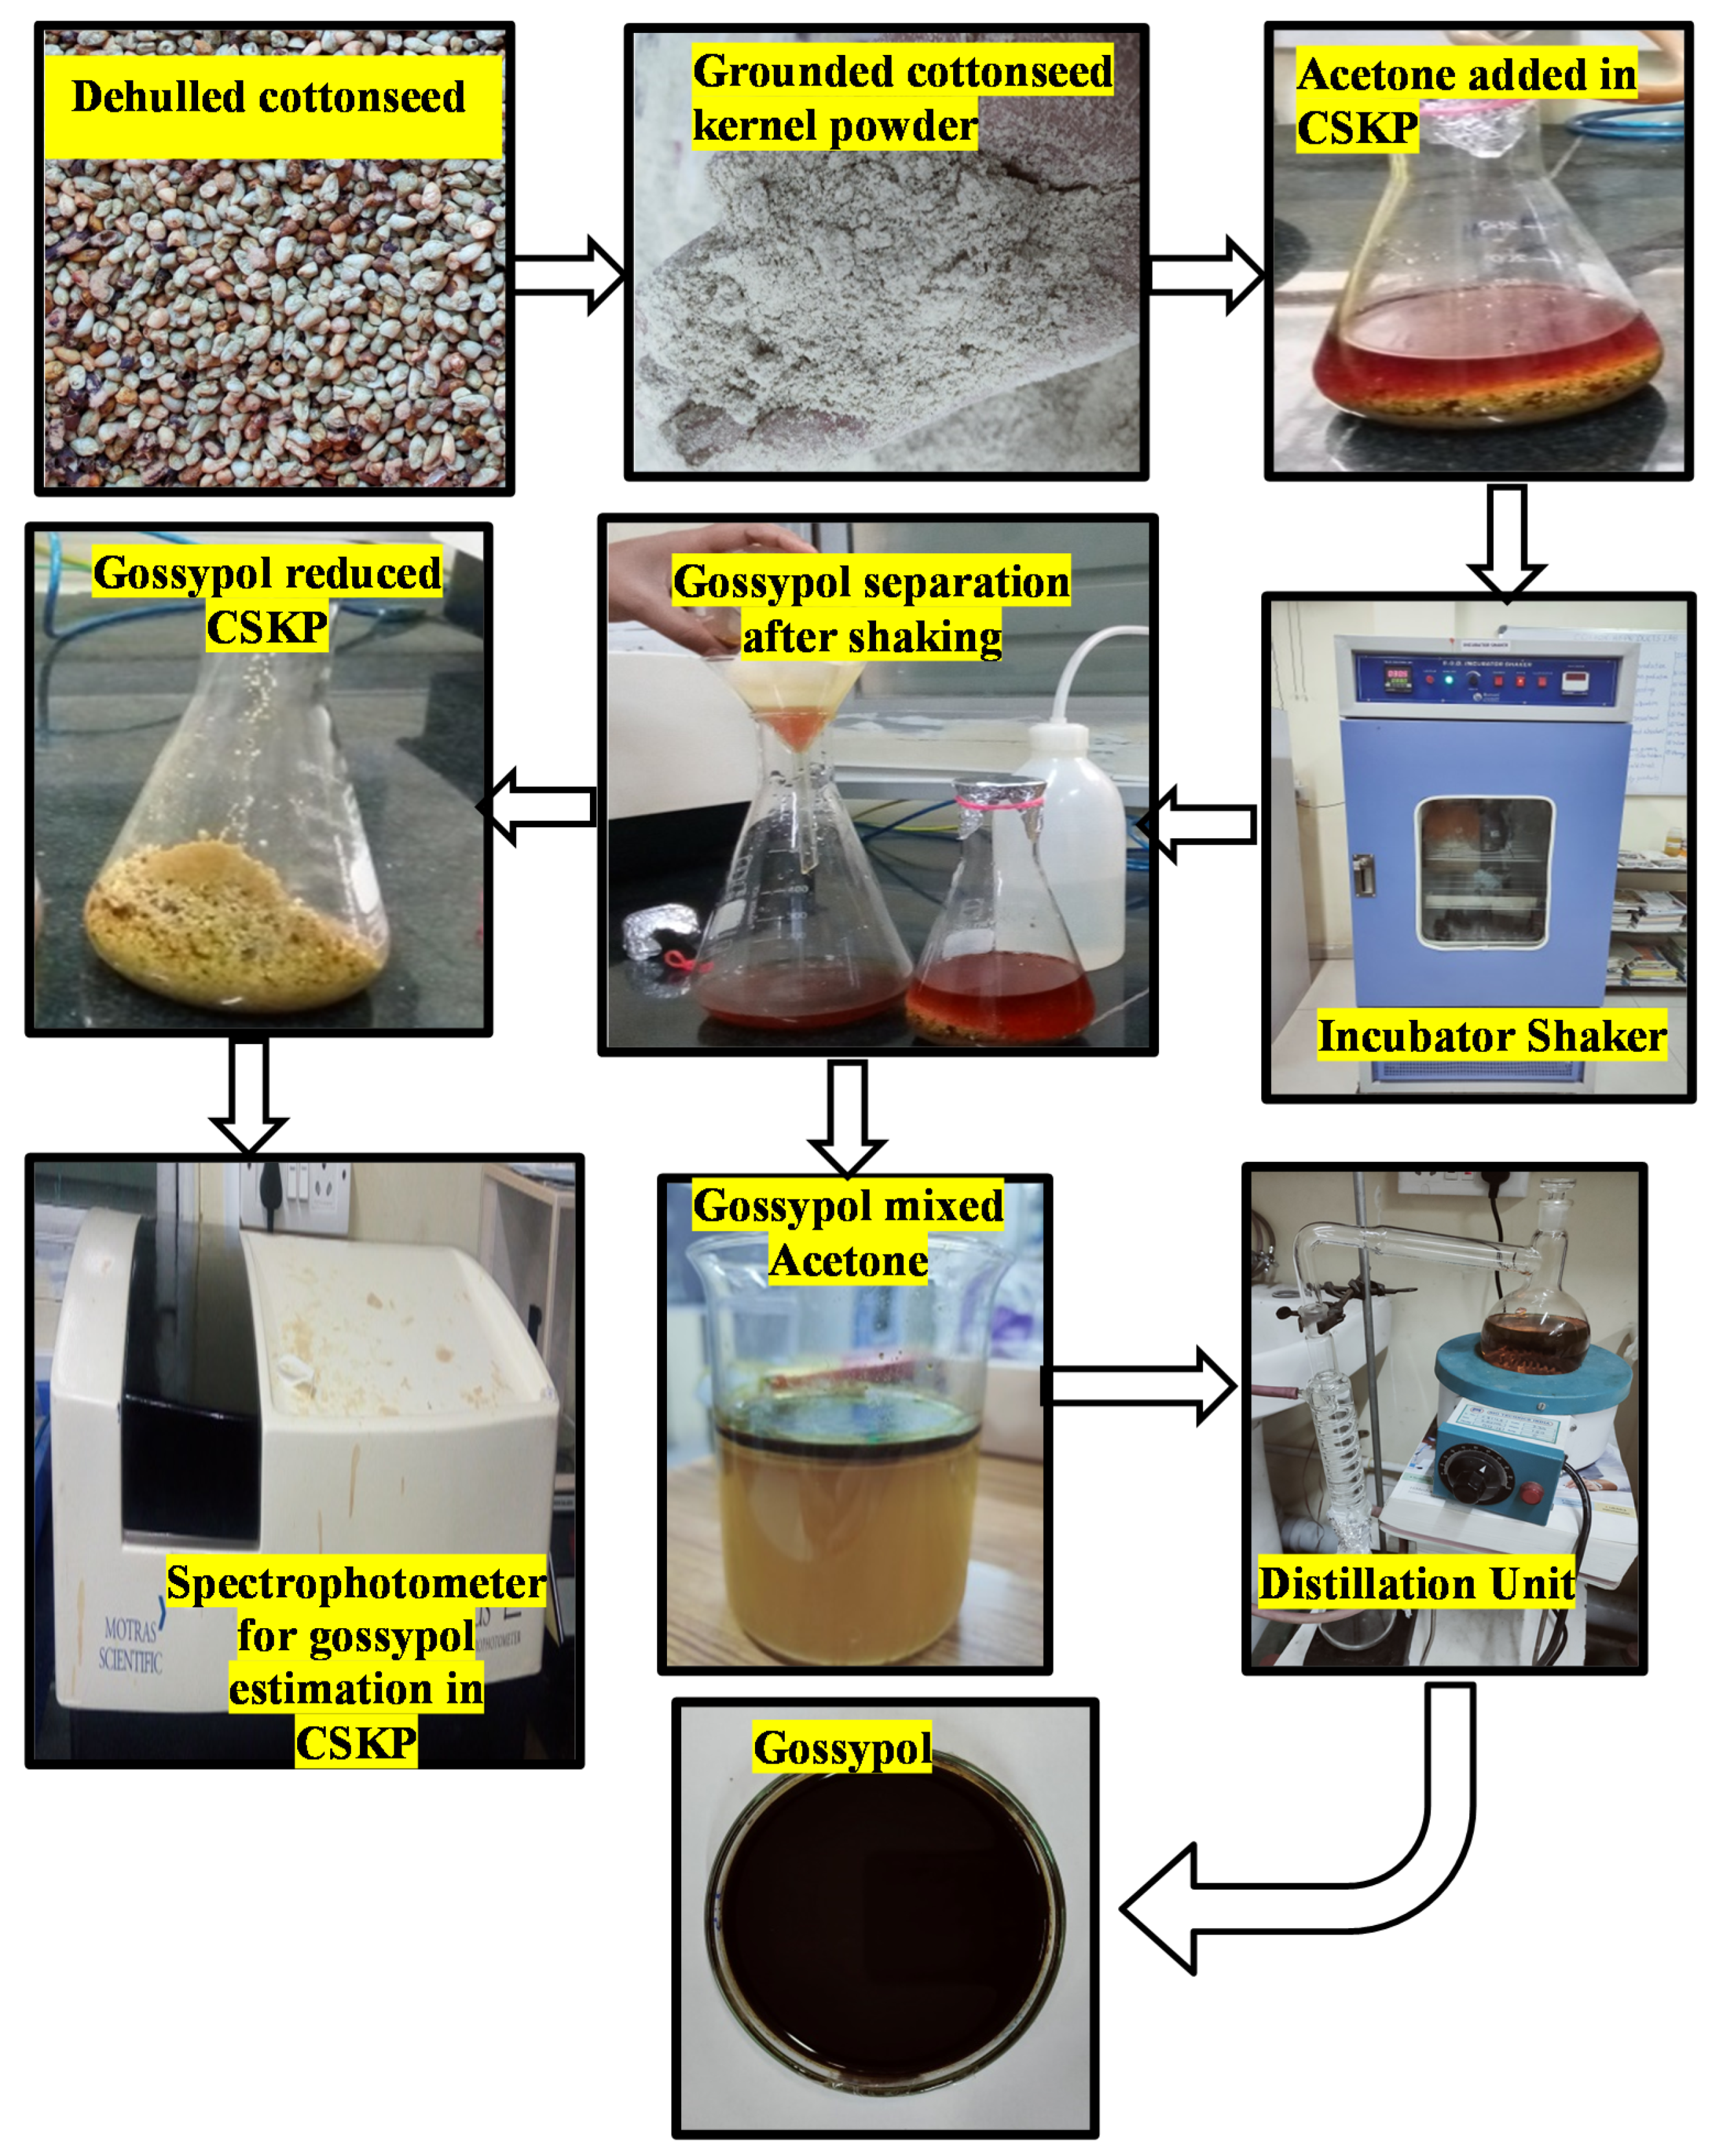
2.2.4. Gossypol Extraction Process

In the process of gossypol extraction, a 5 g sample of CSKP was taken into a 250 mL flat-bottom conical flask, and aqueous acetone was added into the flask, where the liquid-to-solid ratio (aqueous acetone: sample) was varied as 2.5:1, 5:1, 7.5:1, 10:1 and 12.5:1. To prepare aqueous acetone, various percentages of acetone were mixed with water varied from 60–100%. The sample was then kept in the shaker under shaking condition for extraction of gossypol at 150 rpm and 30 °C. The time of extraction (t) is one of the important parameters to obtain a higher rate of gossypol extraction from cottonseed [3]. The time of extraction was varied as 15, 30, 45, 60, and 75 min to study the effect of time on the rate of gossypol extraction. Then the sample was filtered using a filter paper (Whatman no. 4). During this cycle, gossypol mixed with acetone and separated out. The extraction cycle was repeated 1–5 times to analyze the percentage of gossypol reduction after every cycle. In the end, the sample was dried and analyzed for free and total gossypol estimation. The aforementioned variables and their levels have shown in Table 1. The schematic layout of the extraction process and experimental setup has depicted in Figure 1 and Figure 2, respectively.

2.2.5. Design of Experiment

In this study, to design the experiments from central composite rotatable design (CCRD) using four independent variables viz. acetone (%), time of extraction (t), liquid-solid ratio (Rlsr), and number of extraction cycles (Nx) was employed. The independent variables and their levels are shown in Table 1. The CCRD consisted 30 experimental runs on the basis of 2x + 2x + n, where x = numbers of variables and n = number of replicate center points. In this study, six center points in each face of factorial space have been considered. The experimental design matrix for 30 experimental runs is shown in Table 2. The output responses were measured as free and total gossypol reduction in percentage. The error of measured values for free and total gossypol reduction was determined using statistical analysis because measured values are complete only if it is accompanied by details of uncertainty in the measurements. The standard errors of each measured response are shown in Table 3.
RSM was used to develop the regression models between output responses and independent variables. The functional relationship between output responses and independent variables can be shown as:
Y = μ   ( X 1   , X 2 ,   X 3 , X 4 X k ) + e r
In Equation (1), Y is a single dependent response variable, and X1, X2, X3, X4 are independent variables, and µ is the response function. Residual er measures the experimental error [33]. The second-order regression equation has developed, as shown in Equation (2), which gives a response model or regression model.
Y = β o + i = 1 3 β i X i + i = 1 3 β i i X i 2 + i = 1 3 j = 1 3 β i j X i X j
where Y represents output responses viz. free gossypol and total gossypol percentage, βo is constant, βi is the linear coefficient, βii is the quadratic coefficient, βij is the cross-product coefficient, and Xi is the input variable [34]. The regression equations (Equations (3) and (4)) for the prediction of FG and TG were developed based on the experimental data.
FG = −352.19 + 11.405 A − 0.1519 t − 0.8733 Rlsr − 7.3958 Nx − 0.00025 At − 0.029 A Rlsr + 0.05375 A Nx +
0.00166667 t Rlsr − 0.045 t Nx + 0.985 Rlsr Nx − 0.071708 A2 + 0.00385185 t2 + 0.10267 Rlsr2 + 0.22917 Nx 2
TG = −474.78229 + 13.10979 A + 0.082083 t − 2.7675 Rlsr − 9.01458 Nx + 0.00395833 At + 0.02975 A Rlsr +
0.083125 A Nx − 0.019167 t Rlsr − 0.00375 t Nx + 0.6575 Rlsr Nx − 0.080323 A2 − 0.00381019 t2 +
0.090833 Rlsr2 + 0.11771 Nx 2

3. Results and Discussion

3.1. Statistical Analysis of Developed Model

An effort has been made to examine the suitability of the developed model using ANOVA. The second-order model for all output responses the ANOVA has shown in Table 4. For free gossypol, “Pred R2” of 0.8977 is in reasonable agreement with the “Adj R2” of 0.9625. For total gossypol, “Pred R2” of 0.95 is in reasonable agreement with the “Adj R2” of 0.9816. “Adeq precision” measures the signal to noise ratio greater than 4 is desirable. The developed models and approaches were found reliable and effective because the R2 value was found as 0.98 and 0.99 for the model of free gossypol and total gossypol, respectively (Table 4). The predicted values were compared with the corresponding experimental values are illustrated in Figure 3 and Figure 4.
The second-order model for summarized ANOVA has shown in Table 5 for output responses. The values of “Prob. > F” less than 0.0500 indicate that the models are significant, which is desirable and it indicates that the terms in the model have a significant effect on the output responses. In the present case, A, B, C, D, A2, B2 are significant model terms. The values greater than 0.1 indicate the model terms are not significant. These insignificant model terms (not counting those required to support hierarchy) can be removed and may result in an improved model. For both the models, the comparison of the residual error to the pure error obtained in a lack of fit test has been found insignificant. The lack of fit is insignificant that is desirable.

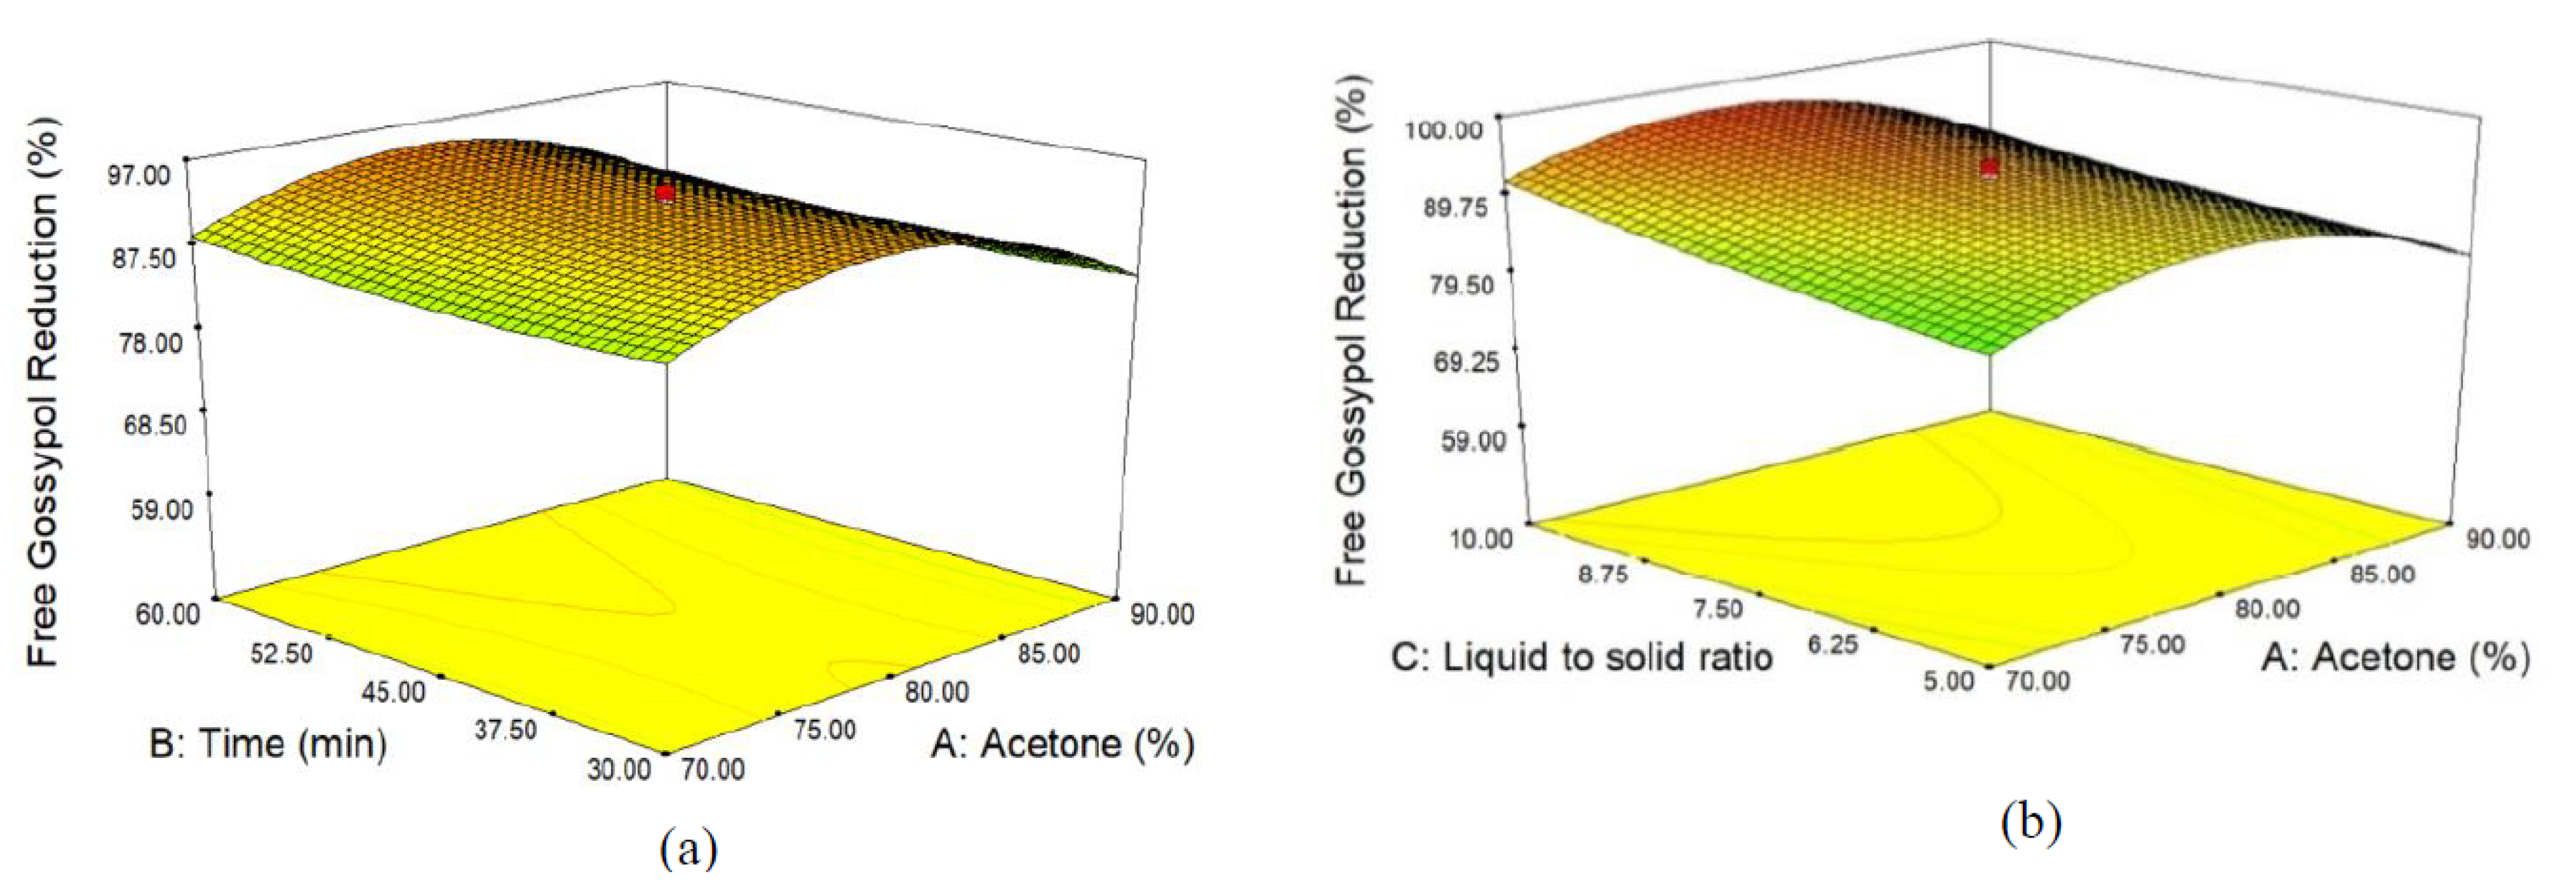
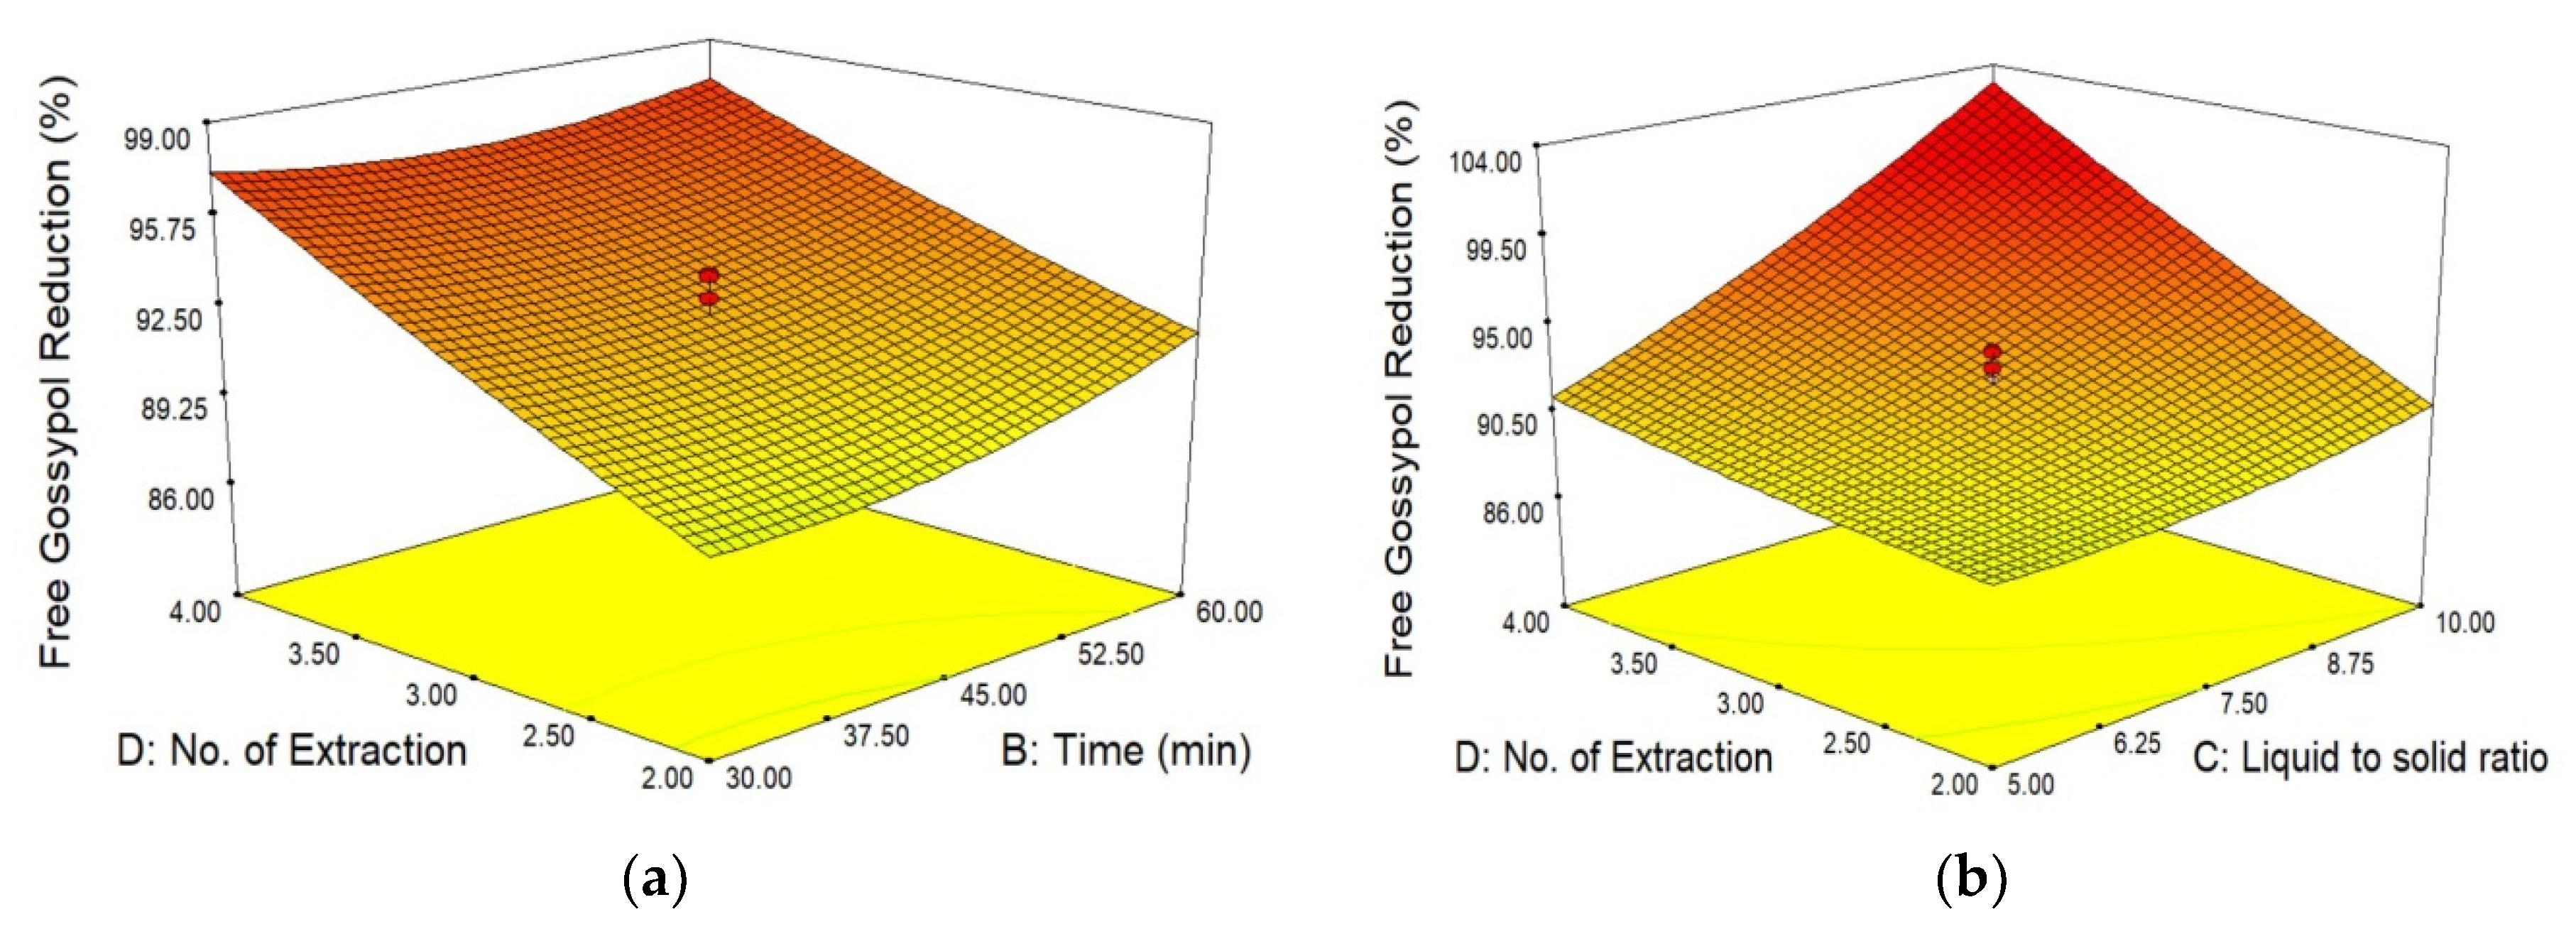
3.2. Effect of Input Parameters on Free Gossypol Reduction (FGR)

The gossypol reduction in cottonseed meal is affected by several parameters such as used solvents, temperature, time, solvent ratio, etc. [8]. In the present study, the effect of various parameters viz. acetone %, time of extraction, LSR, and the number of extraction cycles on FGR percentage were analyzed using response surface methodology. The 3D surface plot for two varying parameters, namely time and acetone %, and their combined effect on FGR have shown in Figure 5a. The graph depicts that at the lower level of time (30 min) and 70% acetone, the FGR value was found about 86%, whereas, at a higher level of time (60 min) and acetone (90%), there was only a slight improvement observed in FGR. In this 3D effect plot, the time has not shown much effect on FGR, whereas the maximum FGR percentage was observed at the middle level of acetone. The results are in agreement with a previous study of a similar kind carried out by [35]. Figure 5b presents the combined effect of LSR and acetone % on FGR, keeping the other two parameters (time and number of extraction cycles) constant. It showed that the FGR percentage increases with an increase in LSR and acetone levels. The reason behind this may be that a large amount of fresh solvent would be available for the extraction and scrubbing of the solute by the solvent [8]. A maximum FGR percentage was observed at a higher level of LSR and middle level of acetone.
Figure 6a depicts the combined effect of the number of extraction cycles and acetone (%) on FGR percentage. The results showed that there is a slight improvement in the FGR percentage by increasing the no. of extraction cycless at a constant level of acetone. The maximum reduction of free gossypol was found at the middle level of acetone percentage and a higher level of no. of extraction cycles. Figure 6b shows the combined effect of LSR and time of extraction on FGR percentage while the other two parameters (acetone % and no. of extraction cycles) were kept constant. In this case, the time has a negligible effect on FGR at a constant level of LSR, whereas the LSR has a significant influence on FGR at any time. It was observed that at a lower level of LSR and time, FGR is also less, whereas the maximum reduction in free gossypol was recorded at a higher level of LSR (10) and time (60 min). The reason being the more acetone will be available for mixing the gossypol in it.
The combined effect of the number of extraction cycles and time on FGR percentage has been shown in Figure 7a. In this case, acetone % and LSR were kept constant at the middle level. The results showed that the number of extraction cycles has a great effect on FGR at any time. In contrast, maximum FGR percentage was observed at a higher level of time (60 min) and more number of extraction cycles (4). Figure 7b illustrates the combined effect of no. of extraction cycles and LSR keeping time of extraction and acetone % at constant. The graph showed that a low FGR percentage obtained at a lower level of no. of extraction cycles and LSR. However, the combined effects of both the parameters increase the FGR percentage significantly. It can be deduced from the aforementioned Figure 7b that by increasing the number of extraction cycles to higher no. (4) and LSR to a higher level (10) resulted in a maximum reduction in free gossypol percentage.

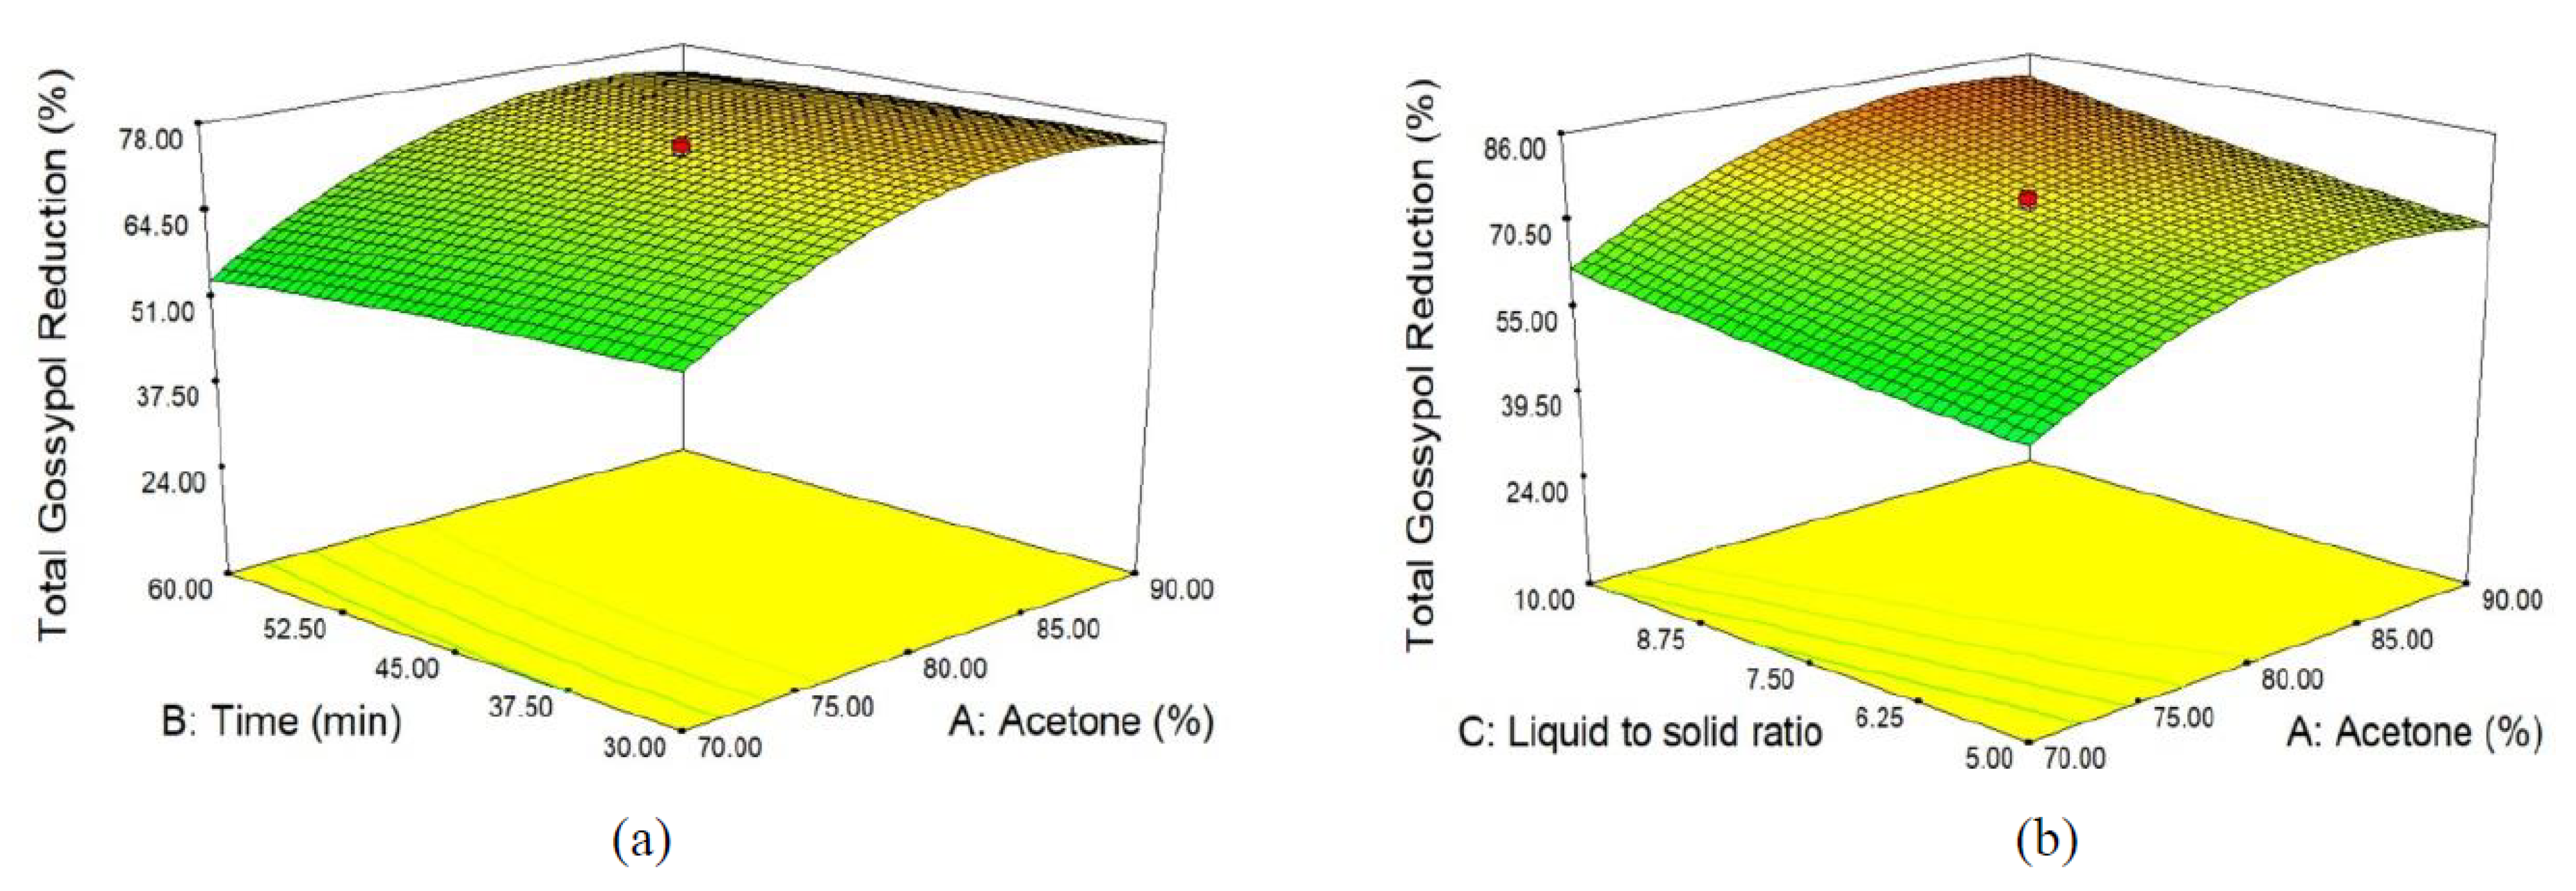
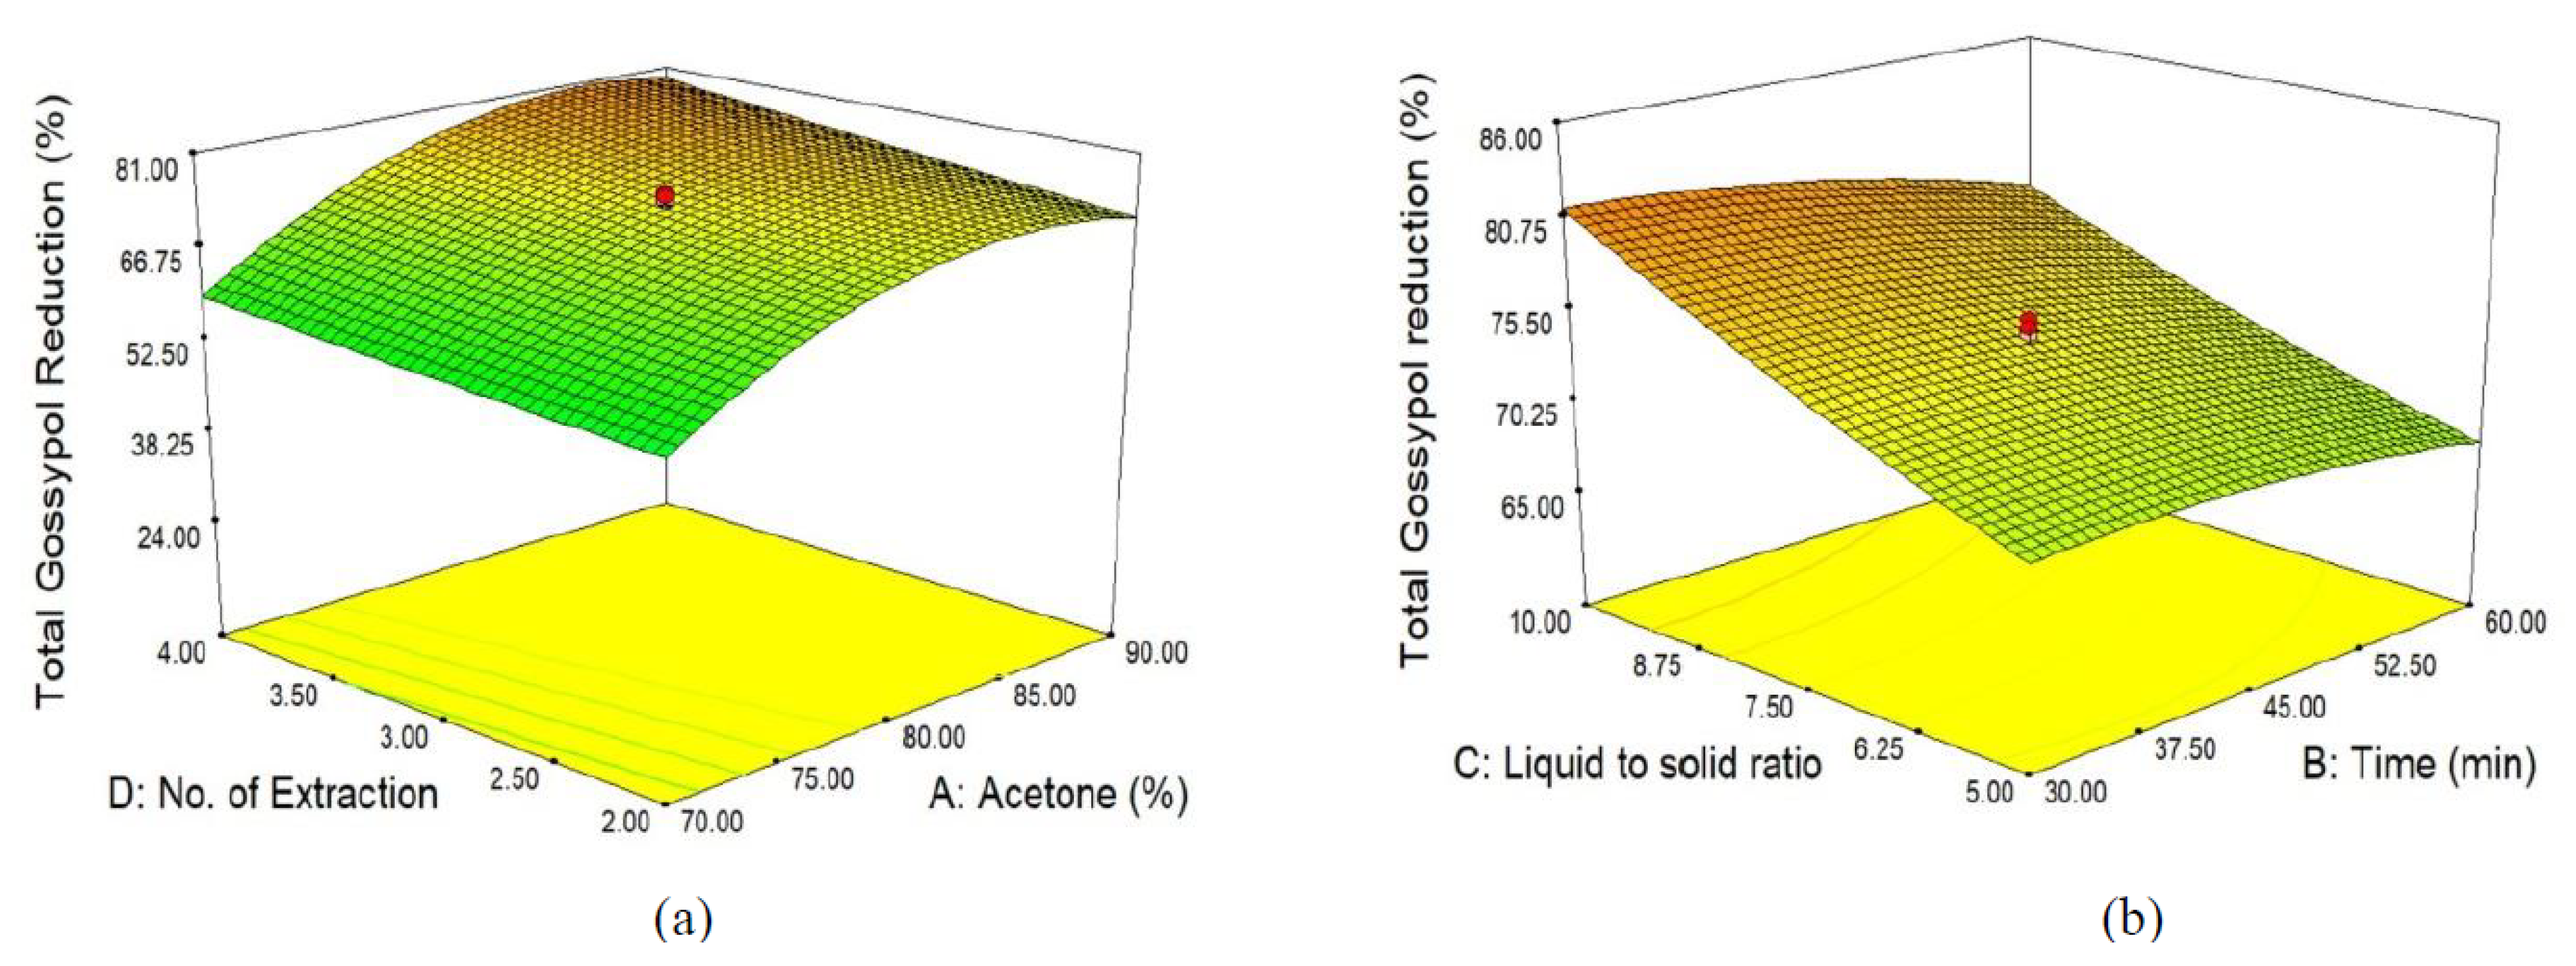
3.3. Effect of Input Parameters on Total Gossypol Reduction (TGR)

The combined effects of input parameters viz. acetone %, time of extraction, liquid-to-solid ratio (LSR), and no. of extraction cycles on TGR were analyzed using the response surface technique. Figure 8a shows the reduction in total gossypol percentage with time of extraction and acetone percentage. The combined effect of both parameters showed that TGR increased with an increase in acetone % and reduction in time. The ANOVA table indicates that the interaction of time and acetone % is not statistically significant. However, the maximum TGR percentage obtained at higher acetone percentage (90%) at the minimum time (30 min), while the minimum TGR was recorded at a lower level of acetone and a higher level of time (60 min). Figure 8b illustrated the combined effect of liquid-to-solid ratio (LSR) and acetone % on TGR percentage. The effect of interaction between LSR and acetone is also not statistically significant, and it is seen that the highest TGR percentage occurred at 85% acetone and a higher level of LSR (10), while the lower value of TGR obtained at the lower value of acetone % and lower value of LSR.
Figure 9a shows the 3D response graph for the reduction in total gossypol percentage due to the combined effect of two parameters, namely no. of extraction cycles and acetone %. The results indicated that the increase in acetone percentage and no. of extraction cycles resulted in an increased TGR percentage. The maximum gossypol reduction occurred at 85% acetone level and 4 no. of extraction cycles, whereas the lower value of TGR was obtained at 70% acetone with 2 number of extraction cycles. Similarly, the combined effect of two varying parameters viz. LSR and time of extraction on TGR percentage illustrated in Figure 9b keeping other input parameters (acetone% and no. of extraction cycles) at constant. It can be seen that TGR increases with an increase in LSR and reducing time of extraction. The maximum TGR was obtained at higher LSR (10) and lower value of time (30 min), whereas the lower value of TGR was obtained at the lower level of LSR and the higher level of time.
Figure 10a shows the 3D response graph for TGR percentage by studying the interaction between two parameters, no. of extraction cycles, and time of extraction. The results showed that by increasing the no. of extraction cycles and reducing the time, the TGR percentage increases. The highest TGR percentage obtained at a higher level of no. of extraction cycle and lower value of time. Figure 10b illustrates the effect of input parameters, namely no. of extraction cycles and LSR, on TGR percentage. It can be seen in Figure 10b that increasing the no. of extraction cycles and LSR resulted in increased TGR percentage. The higher value of TGR was obtained at a higher level of no. of extraction cycle and liquid-solid ratio.

3.4. Optimization of Input Variables and Validation of Results

In this study, the optimal combinations of input variables viz. acetone %, time, LSR, and the number of extraction cycles have been determined by using the RSM-based desirability approach. This approach has been implemented to maximize the reduction of free gossypol and total gossypol. The desirability function (di) was formed by each response variable, as shown in Table 6. Its value must lie between 0 and 1. The desirability function is said to 0 when the response variable is completely unacceptable, whereas 1 represents that the response variable is acceptable. In this technique, the best desirability solutions were preferred among different obtained solutions. In this case, the optimal parameters were determined by using State-Ease Design Expert Software version 7.0. For optimization of the best levels of parameters, the minimum and maximum limits are shown in Table 6.
As shown in Table 7, the optimized values for FGR and TGR were found at 86.38% acetone, time of extraction 30 min, LSR 10, and no. of extraction cycles 4. To validate optimized results, the experiments were performed thrice, and the average of three actual experiment responses was calculated.
The error between experimental results and prediction results were recorded and found very close to each other, as shown in Table 7. The validation results show that the developed model (RSM) for predicting free gossypol and total gossypol is accurate.

4. Conclusions

In this paper, the main objective was to build up an approach for the reduction of free and total gossypol content in cottonseed flour to safe levels that reduces the toxicity and improves its nutritional benefits for human consumption. In order to this, the effect of different independent parameters viz. acetone levels, time of extraction, liquid-solid ratio, and the number of extraction cycles on free gossypol and total gossypol reduction were analyzed. The calculated values obtained from RSM-based models and the measured values from the experimental investigations followed the same trend. This refers to a good correlation between input values and output responses. Experimental results indicate that the maximum reduction in free gossypol obtained was 99.3%, and total gossypol reduction obtained was 89.2%. The optimized parameters for a better reduction in free gossypol and total gossypol percentage were 86.3% acetone, time of extractions 30 min, liquid-solid ration 10:1, and the number of extraction cycles 4. The value of r-square was found above 0.9, which indicates that the developed models are suitable and reliable for predicting free and total gossypol reduction percentage. The study concluded that two parameters, namely the number of extraction cycles and liquid, solid ratio influenced significant free gossypol reduction and total gossypol reduction; however, time of extraction is found to be least significant. In the developed process, despite the reduction of free and total gossypol in CSKP, the gossypol is recovered, which has much industrial and medical significance. The resulting low gossypol cottonseed flour can be used as a protein-rich food supplement for human beings.

Author Contributions

Conceptualization, M.S. and V.S.; Supervision, M.S.; Resources, M.S.; Methodology, V.M. and M.K.; Investigation, V.S.; writing—original draft preparation, V.S., D.J., and V.M.; Software, M.K., S.C., and M.M.; writing—review and editing, S.C. and M.M. All authors have read and agreed to the published version of the manuscript.

Funding

This research received no external funding.

Institutional Review Board Statement

Not applicable.

Informed Consent Statement

Not applicable.

Data Availability Statement

The data presented in this study are available on request from the corresponding author.

Acknowledgments

The authors are highly thankful to S.K. Shukla (Principal Scientist, ICAR-CIRCOT, Nagpur) for providing necessary infrastructural, laboratory support, and testing facilities. The authors would like to thank the University of Kiel and Schleswig-Holstein for the support through the OA program.

Conflicts of Interest

The authors confirm that there are no conflicts of interest or personal financial interests associated with the outcome of this investigation.

References

  1. Kumar, M.; Tomar, M.; Punia, S.; Grasso, S.; Arrutia, F.; Choudhary, J.; Singh, S.; Verma, P.; Mahapatra, A.; Patil, S.; et al. Cottonseed: A sustainable contributor to global protein requirements. Trends Food Sci. Technol. 2021, 111, 100–113. [Google Scholar] [CrossRef]
  2. Gerasimidis, K.; Fillou, D.T.; Babatzimcpoulou, M.; Tassou, K.; Katsikas, H. Preparation of an edible cottonseed protein concentrate and evaluation of its functional properties. Int. J. Food Sci. Nutr. 2007, 58, 486–490. [Google Scholar] [CrossRef]
  3. Kumar, M.; Potkule, J.; Patil, S.; Saxena, S.; Patil, P.; Mageshwaran, V.; Punia, S.; Varghese, E.; Mahapatra, A.; Ashtaputre, N.; et al. Extraction of ultra-low gossypol protein from cottonseed: Characterization based on antioxidant activity, structural morphology and functional group analysis. LWT 2021, 140, 110692. [Google Scholar] [CrossRef]
  4. Kumar, M. Paruthi Paal, a nutrient-rich healthy drink from cottonseed: An Indian delicacy. J. Ethn. Foods 2019, 6, 1–6. [Google Scholar] [CrossRef] [Green Version]
  5. Richardson, C.; Siccardi, A.; Palle, S.R.; Campbell, L.M.; Puckhaber, L.S.; Stipanovic, R.D.; Wedegaertner, T.C.; Rathore, K.S.; Samocha, T.M. Evaluation of ultra-low gossypol cottonseed and regular glandless cottonseed meals as dietary protein and lipid sources forLitopenaeus vannameireared under zero-exchange conditions. Aquac. Nutr. 2015, 22, 427–434. [Google Scholar] [CrossRef]
  6. AOCS. Official and Tentative Methods, 3rd ed.; American Oil Chemists Society: Chicago, IL, USA, 1986. [Google Scholar]
  7. Food and Drug Administration (FDA). Food Drug Cosmetic Law; Food and Drug Administration: Silver Spring, MD, USA, 1974.
  8. Singh, S.; Sharma, S.K.; Kansal, S.K. Batch extraction of gossypol from cottonseed meal using mixed solvent system and its kinetic modeling. Chem. Eng. Commun. 2018, 206, 1608–1617. [Google Scholar] [CrossRef]
  9. Gribbins, G.H. The reduction of free gossypol in cottonseed by pressure cooking. J. Am. Oil Chem. Soc. 1951, 28, 41–45. [Google Scholar] [CrossRef]
  10. Batson, D.M.; Thurber, F.H.; Altschul, A.M. The effect of screw-press and hydraulic-press processing conditions on pigment glands in cottonseed. J. Am. Oil Chem. Soc. 1951, 28, 468–472. [Google Scholar] [CrossRef]
  11. Cherry, J.P.; Gray, M.S. Methylene Chloride Extraction of Gossypol from Cottonseed Products. J. Food Sci. 1981, 46, 1726–1733. [Google Scholar] [CrossRef]
  12. Rahma, E.H.; Rao, M.S.N. Gossypol Removal and Functional Properties of Protein Produced by Extraction of Glanded Cottonseed with Different Solvents. J. Food Sci. 1984, 49, 1057–1060. [Google Scholar] [CrossRef]
  13. Smith, A.K. Practical considerations in commercial utilization of oilseeds. J. Am. Oil Chem. Soc. 1971, 48, 38–42. [Google Scholar] [CrossRef]
  14. Zhang, W.-J.; Xu, Z.-R.; Zhao, S.-H.; Jiang, J.-F.; Wang, Y.-B.; Yan, X.-H. Optimization of process parameters for reduction of gossypol levels in cottonseed meal by Candida tropicalis ZD-3 during solid substrate fermentation. Toxicon 2006, 48, 221–226. [Google Scholar] [CrossRef] [PubMed]
  15. Luz, V.B.; Gadelha, I.C.N.; Cordeiro, L.A.V.; Melo, M.M.; Soto-Blanco, B. In vitro study of gossypol’s ovarian toxicity to rodents and goats. Toxicon 2018, 145, 56–60. [Google Scholar] [CrossRef] [PubMed]
  16. Manoj, K.; Mageshwaran, V.; Sujata, S.; D’Souza Charlene, A.N.; Sharmila, P.; Archana, M.; Patil, P.G.; Yamini, T. Value addition of cottonseed meal for feed industries by degossypolization employing papain and solvent. Res. J. Biotechnol. 2019, 14, 11. [Google Scholar]
  17. Dai, C.; Zhang, L.; Ma, H.; Yin, X.; He, R.; Qian, J. Ultrasound-Assisted Detoxification of Free Gossypol from Cottonseed Meal. J. Food Process. Eng. 2015, 40, 1–8. [Google Scholar] [CrossRef] [Green Version]
  18. Dechary, J.M.; Kupperman, R.P.; Thurber, F.H.; Altschul, A.M. Removal of gossypol from cottonseed by solvent extraction procedures. J. Am. Oil Chem. Soc. 1952, 29, 339–341. [Google Scholar] [CrossRef]
  19. Li, Z.; Smith, K.H.; Stevens, G.W. The use of environmentally sustainable bio-derived solvents in solvent extraction applications—A review. Chin. J. Chem. Eng. 2016, 24, 215–220. [Google Scholar] [CrossRef]
  20. Saxena, D.; Sharma, S.; Sambi, S. Kinetics and thermodynamics of gossypol extraction from defatted cottonseed meal by ethanol. Pol. J. Chem. Technol. 2012, 14, 29–34. [Google Scholar] [CrossRef] [Green Version]
  21. Wang, X.; Howell, C.P.; Chen, F.; Yin, J.; Jiang, Y. Gossypol—A polyphenolic Compound from Cotton Plant, 1st ed.; Elsevier Inc.: Amsterdam, The Netherlands, 2009; Volume 58. [Google Scholar]
  22. Kuk, M.S.; Tetlow, R.; Dowd, M.K. Cottonseed extraction with mixtures of acetone and hexane. J. Am. Oil Chem. Soc. 2005, 82, 609–612. [Google Scholar] [CrossRef]
  23. Pelitire, S.M.; Dowd, M.K.; Cheng, H. Acidic solvent extraction of gossypol from cottonseed meal. Anim. Feed. Sci. Technol. 2014, 195, 120–128. [Google Scholar] [CrossRef]
  24. Pons, W.A.; Eaves, P.H. Aqueous acetone extraction of cottonseed. J. Am. Oil Chem. Soc. 1967, 44, 460–465. [Google Scholar] [CrossRef]
  25. Saxena, D.K.; Sharma, S.K.; Sambi, S.S. Kinetics and Thermodynamics of Gossypol Extraction from Defatted Cottonseed Meal by Ethanol Acidified by Oxalic Acid. Int. J. Sci. Res. 2015, 4, 1967–1971. [Google Scholar]
  26. Montgomery, D.C. Design and Analysis of Experiments, 8th ed.; John Wiley & Sons: Hoboken, NJ, USA, 2020. [Google Scholar]
  27. Ghorbannezhad, P.; Bay, A.; Yolmeh, M.; Yadollahi, R.; Moghadam, J.Y. Optimization of coagulation–flocculation process for medium density fiberboard (MDF) wastewater through response surface methodology. Desalin. Water Treat. 2016, 57, 26916–26931. [Google Scholar] [CrossRef]
  28. Yolmeh, M.; Jafari, S.M. Applications of Response Surface Methodology in the Food Industry Processes. Food Bioprocess Technol. 2017. [Google Scholar] [CrossRef]
  29. American Oil Chemists Society (AOCS). Official method Ba 2a-38 and recommended practice Ba 8a-99. In Official Methods and Recommended Practices of the American Oil Chemists’ Society, 5th ed.; Firststone, D., Ed.; AOCS Press: Champaign, IL, USA, 1998. [Google Scholar]
  30. American Oil Chemists Society (AOCS). Official method of analysis, Ba, 7-58. Free gossypol. In Official and Tentative Methods of the American Oil Chemists’ Society, 4th ed.; AOCS Press: Champaign, IL, USA, 1989. [Google Scholar]
  31. American Oil chemists Society (AOCS). Official methods of analysis, Ba, 8-78. Total gossypol. In Official and Tentative Methods of the American Oil Chemists’ Society, 4th ed.; AOCS Press: Champaign, IL, USA, 1989. [Google Scholar]
  32. Manoj, K.; Potkule, J.; Patil, S.; Vellaichamy, M.; Satankar, V.; Kumar Berwal, M.; Mahapatra, A.; Saxena, S.; Ashtaputre, N.; Souza, C.D. Evaluation of detoxified cottonseed protein isolate for application as food supplement. Toxin Rev. 2021. [Google Scholar] [CrossRef]
  33. Noordin, M.Y.; Venkatesh, V.C.; Sharif, S.; Elting, S.; Abdullah, A. Application of response surface methodology in describing the performance of coated carbide tools when turning AISI 1045 steel. J. Mater. Process. Technol. 2004, 145, 46–58. [Google Scholar] [CrossRef] [Green Version]
  34. Aouici, H.; Yallese, M.A.; Chaoui, K.; Mabrouki, T.; Rigal, J.F. Analysis of surface roughness and cutting force components in hard turning with CBN tool: Prediction model and cutting conditions optimization. Meas. J. Int. Meas. Confed. 2012, 45, 344–353. [Google Scholar] [CrossRef]
  35. Khodwe, M.S.; Bhowmick, D.N. Separation of Gossypol From Cottonseed and Preparation of Gossypol—Free Cottonseed Cake. Int. J. Recent Sci. Res. 2013, 4, 1290–1295. [Google Scholar]
Figure 1. Schematic layout of experimental procedure for gossypol extraction.
Applsci 11 03901 g001
Figure 2. Schematic layout of process of gossypol extraction from cottonseed used in this study.
Applsci 11 03901 g002
Figure 3. Comparison between measured and predicted values for FGR.
Applsci 11 03901 g003
Figure 4. Comparison between measured and predicted values for TGR.
Applsci 11 03901 g004
Figure 5. (a) 3D surface plot between time of extraction and acetone (b) 3D surface plot between LSR and acetone.
Applsci 11 03901 g005
Figure 6. (a) 3D surface plot between no. of extraction cycles and acetone % (b) 3D surface plot between LSR and time of extraction.
Applsci 11 03901 g006
Figure 7. (a) 3D surface plot between no. of extraction cycles and time of extraction (b) 3D surface plot between no. of extraction cycles and LSR.
Applsci 11 03901 g007
Figure 8. (a) 3D surface plot between time of extraction and acetone % (b) 3D surface plot between LSR and acetone %.
Applsci 11 03901 g008
Figure 9. (a) 3D surface plot no. of extraction cycles and acetone % (b) 3D surface plot between LSR and time of extraction %.
Applsci 11 03901 g009
Figure 10. (a) 3D surface plot no. of extraction cycles and time of extraction (b) 3D surface plot between no. of extraction cycles and LSR.
Applsci 11 03901 g010
Table 1. Independent variables and their levels.
VariablesLevels
IIIIIIIVV
Acetone (A), %60708090100
Time of extraction (t), min1530456075
Liquid-solid ratio (Rlsr)2.5:15:17.5:110:112.5:1
Number of extraction cycles (Nx)12345
Table 2. Central Composite rotatable design for free gossypol and total gossypol reduction.
RunAcetone (A)%Time of Extraction (t) (min)Liquid-Solid Ratio(Rlsr)No. of Extraction Cycles (Nx)Free Gossypol Reduction, % (Fg)Total Gossypol Reduction, % (Tg)
1703010286.762.0
280457.5598.279.3
3703010499.267.6
480457.5392.874.0
5706010499.362.0
670605486.553.3
790605282.767.9
8903010497.490.0
9906010285.375.0
10100457.5359.057.6
1180457.5393.675.0
1270305282.351.7
1390305281.269.0
1470305485.055.0
1570605284.850.4
1680452.5388.065.0
17903010280.176.0
1880457.5393.774.2
1980757.5396.366.0
20906010496.487.0
2190605485.771.0
2280457.5186.067.5
2390305485.672.0
2480457.5391.074.5
25804512.5399.585.4
2660457.5366.024.0
2780457.5392.875.0
2880157.539373
2970601028955
3080457.539272.2
Table 3. Error analysis.
ResponsesError
Free Gossypol reduction percentage (Fg)±0.12
Total Gossypol reduction percentage (Tg)±0.5
Table 4. ANOVA results for free gossypol and total gossypol reduction.
ResponsesMeanSDR2Adj R2Pred R2Adeq Precisionp-Value
Free Gossypol (Fg)88.351.7740.98060.96250.897732.693<0.0001
Total Gossypol (Tg)67.541.7670.99050.98160.950051.558<0.0001
Table 5. Model summary statistics for free gossypol and total gossypol reduction.
SourceFree Gossypol (Fg)Total Gossypol (Tg)
Prob. > FProb. > F
Model<0.0001<0.0001
A-Acetone %0.002<0.0001
B-Time in Min0.04620.0009
C-Liquid-to-Solid ratio<0.0001<0.0001
D-No. of Extraction<0.0001<0.0001
AB0.93340.1987
AC0.12140.1128
AD0.24230.0793
BC0.88930.1244
BD0.14720.9003
CD<0.00010.0020
A2<0.0001<0.0001
B20.02130.0226
C20.07650.113
D20.50720.7319
Lack of Fit0.06950.0754
Table 6. Response optimization of the input parameters based on desirability.
ParametersGoalsMinimum LimitsMaximum LimitsDesirability (di)
Acetone %In range601001
Time of extraction (min)In range15751
LSRIn range2.512.51
No. of extraction cycleIn range151
Free gossypol reduction (%)Maximize5999.50.995
Total gossypol reduction (%)Maximize24 900.995
Table 7. Validation test results of optimized parameters.
Output ResponsesAcetone (%)Time of Extraction(min)LSRNo. of Extraction CyclesExperimental ResultPredicted ResultError
Free gossypol reduction (%)86.383010499.399.790.49
Total gossypol reduction (%)86.38301048989.340.34
Publisher’s Note: MDPI stays neutral with regard to jurisdictional claims in published maps and institutional affiliations.

