
Thermal Characteristics Study of the Bump Foil Thrust Gas Bearing


1
School of Mechanical Engineering and Automation, Harbin Institute of Technology, Shenzhen 518055, China
2
Shenzhen Key Laboratory of Flexible Printed Electronics Technology, Shenzhen 518055, China
*
Authors to whom correspondence should be addressed.
Appl. Sci. 2021, 11(9), 4311; https://0-doi-org.brum.beds.ac.uk/10.3390/app11094311
Submission received: 8 April 2021
/
Revised: 28 April 2021
/
Accepted: 30 April 2021
/
Published: 10 May 2021
(This article belongs to the Special Issue Gas Bearings: Modelling, Design and Applications)
Abstract
:In this paper, a thermo-hydrodynamic model of the bump foil thrust gas bearing is developed, which solves the coupled gas film three-dimensional energy equation, non-isothermal Reynolds equation, and the foil deformation equation. The effects of bearing speed, thrust load, and external cooling gas on the bearing temperature field are calculated and analyzed. The test rig of foil thrust gas bearing was built to measure the bearing temperature under different working conditions. Both simulation and experiment results show that there exist temperature gradients on the top foil both in the circumferential and radial directions. The simulation results also shows that the top foil side of the gas film has the highest temperature value in the entire lubrication field, and the position of highest temperature moves radially inward on the thrust plate side as the rotor speed increases. The gas film temperature increases with the increasing rotor speed and bearing static load, and rotor speed has greater effects on the temperature variation. Cooling air flow passing through the bump foil is also considered in the simulations, and the cooling efficiency decreases as the mass of gas flow increases.
1. Introduction
Dynamic bump foil gas bearings have been developed since 1960s, and numerous scholars have conducted the researches of related lubrication theories and experiments [1,2]. Nowadays, requirements of larger power density performance are put forward for the turbomachinery, such as blowers, air compressors, and turbochargers, which indicates that gas dynamic thrust bearings need to work under the conditions of higher speeds, larger axial loads, and harsher environments [3]. Compared with traditional gas bearings, bump foil type gas bearings have many significant advantages, such as long operating life, high reliability, large carrying capacity, high speed and high temperature resistance, and good impact resistance. As the rotational speed gradually increases, the elastic foil structure of the bearing deforms, thereby forming the corresponding air film thickness, which has strong adaptability. Therefore, more and more researchers pay attention to the dynamic bump foil gas bearing, which are widely used in a variety of high-speed rotating machinery [4]. Under operating conditions, the ultra-high speed of the rotating thrust plate drives the gas in the clearance to move fast. Due to the viscous friction and gas compression effect between the gas films, the temperature of the bearing will increase sharply. It is insufficient to maintain an ideal temperature inside the bearing only by relying on the bearing self-cooling effect. With the accumulation of high temperature, the air film gap will decrease obviously due to the effect of thermal expansion of the structure, and the wear-resistant coating of the top foil will be damaged, which will eventually cause disastrous damages to the whole rotor system.
In recent years, many impressed studies on the thermal characteristics of gas bearings have been published. Salehi et al. applied the Couette approximation method to solve the temperature field distribution of journal foil gas bearing by coupling the simplified energy equation and the Reynolds equation. However, the calculation model did not consider the heat transfer between the foil structure and rotor [5]. Lee et al. coupled solved the non-isothermal Reynolds equation, gas film thickness equation that considers foil deformation and thermal expansion, and the gas film energy transfer equation. The simulation results of temperature field distribution under the symmetric arrangement of two thrust bearing are obtained, and the influences of rotor speed, bearing load, and cooling air pressure on the bearing temperature are explored [6]. Dickman conducted the thermal-influenced loading experiments based on three corrugated foil thrust bearings with the same size. It was pointed out that the bearing load capacity increases almost linearly with the increase in rotating speed without thermal failure and decreases with the increasing rotor speed when the thermal runaway occurred [7]. GAD et al. calculated the temperature field of thrust bearing by using Couette approximation method, and pointed out that the gas leakage of bearing clearance mostly occurs in the inclined area and leads to the lower temperature. In addition, the study pointed out that more than 70% of the heat generated by gas film can be removed by controlling the cooling flow rate. Meanwhile, the simulation results were compared with Dickman’s experimental results, the bearing loading curves in comparison are more consistent when the rotate speed is lower, and there are certain errors when rotor speed is higher. The author speculates that bearing thermal runaway occurred at higher speeds, resulting in a lower load capacity with speed increased [8]. Andreas Lehn et al. present the formulas for calculating the thermal resistances between the bump foil and top foil, and between the bump foil and bearing housing. The authors also considered the thermal expansion of the thrust disc, and the temperature field distribution was solved by multi-field coupling methods. It was pointed out that the bearing load capacity decreased with the increase in rotating speed when the speed increased to a certain value. This trend was due to the bending deformation of thrust disc caused by the high gas film temperature, which leads to the decrease in gas film thickness and the final thermal runaway [9]. Li Changlin established conduction and convection heat transfer models for the bearing sleeve and rotor of the journal bump foil gas bearing, which coupled the non-isothermal Reynolds equations, gas film energy transfer equations, and foil deformation equations. The simulation results compared the THD model with the isothermal model, analyzed the static characteristics and dynamic characteristics of the gas foil bearing [10]. Luo Yixin applied the commercial software to simulate the temperature field of thrust bearing, and studied the influences of different boundary conditions, rotor speeds, inlet pressure, and temperature on bearing thermal characteristics [11]. Peng and Khonsari simplified the foil structure as a line spring model, considered the forced convection cooling outside the flat foil, calculated the multi-dimensional distribution of gas film temperature, but ignored the heat transfer from temperature to rotor and sleeve [12]. Aksoy’s research results show that the maximum temperature of the film increases with the grow of load and rotational speed, in which the influence of the rotational speed is greater. At the same time, it is found that the temperature gradient along the axial direction of the rotor can easily cause structural and thermal instability [13]. Andres and Kim found that the viscosity of the gas film increased with the temperature rises, which enhanced the effect of dynamic pressure. The influence of the temperature of the gas film on the structure stiffness of the foil is small. The closer to the shaft end, the greater the gas film temperature gradient, and the axial temperature gradient grew with the increase in the rotational speed [14]. Talmage and Carpino found that the axial temperature gradient will cause the flat foil warping in the end region of the bearing, resulting in uneven axial distribution of the film gap, which makes the flat foil easy to grind with the rotor [15]. Kim and Ki studied the complete heat transfer in a 50KW turbine. It was found that the dynamic stiffness and damping coefficient of the bearing would decrease due to the decrease in the elastic modulus of the foil structure at high temperature [16]. Keun and Andres et al. heated the rotor without cooling gas flow, and the bearing failure occurred when the rotor temperature reached 251 °C [17]. Therefore, the heat control and temperature control strategies, such as injecting cooling gas flow in high temperature environment are very necessary. In this study, a detailed 3D thermal model of bump foil thrust gas bearing is considered. The temperature field distribution of the thrust bearing is solved by coupling the three-dimensional energy equation, non-isothermal Reynolds equation and gas film thickness equation. The cooling models of foil structure and thrust plate, as well as the influence of temperature on the thermal expansion of bearing structure are considered. The thermal characteristics of the bearing under different working conditions are analyzed. Finally, the test rig of the foil thrust gas bearing is built to measure the bearing temperature distributions of bearing under different working conditions.
2. Numerical Simulation Research
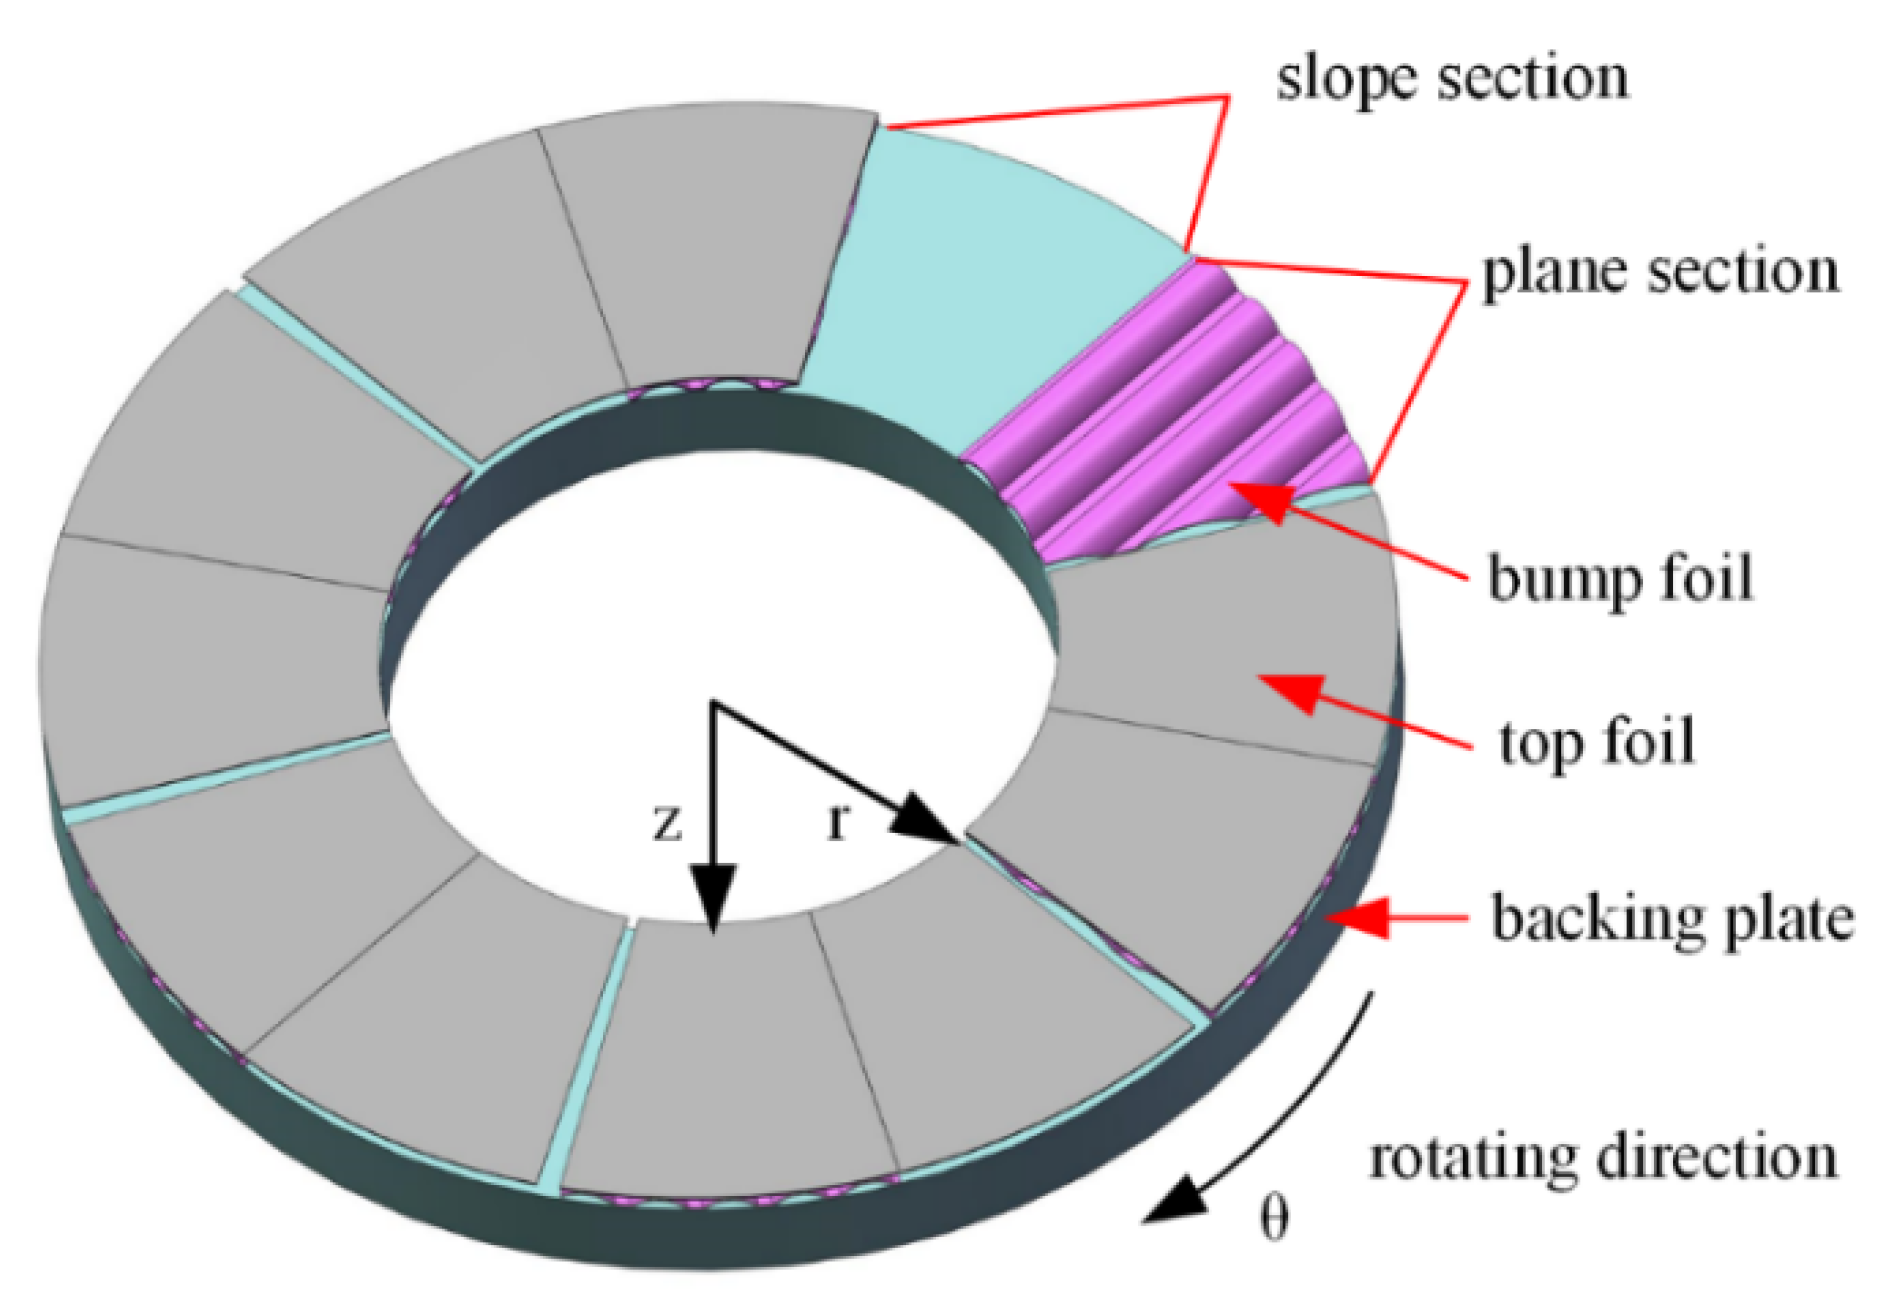
The aerodynamic bump foil thrust bearing mainly consists of three parts: the top foil is used to provide lubricating surface; the bump foil plays the role of elastic support; the bearing housing is applied to fix the top foil and the bump foil. The structure of bump foil thrust gas bearing is shown in Figure 1.
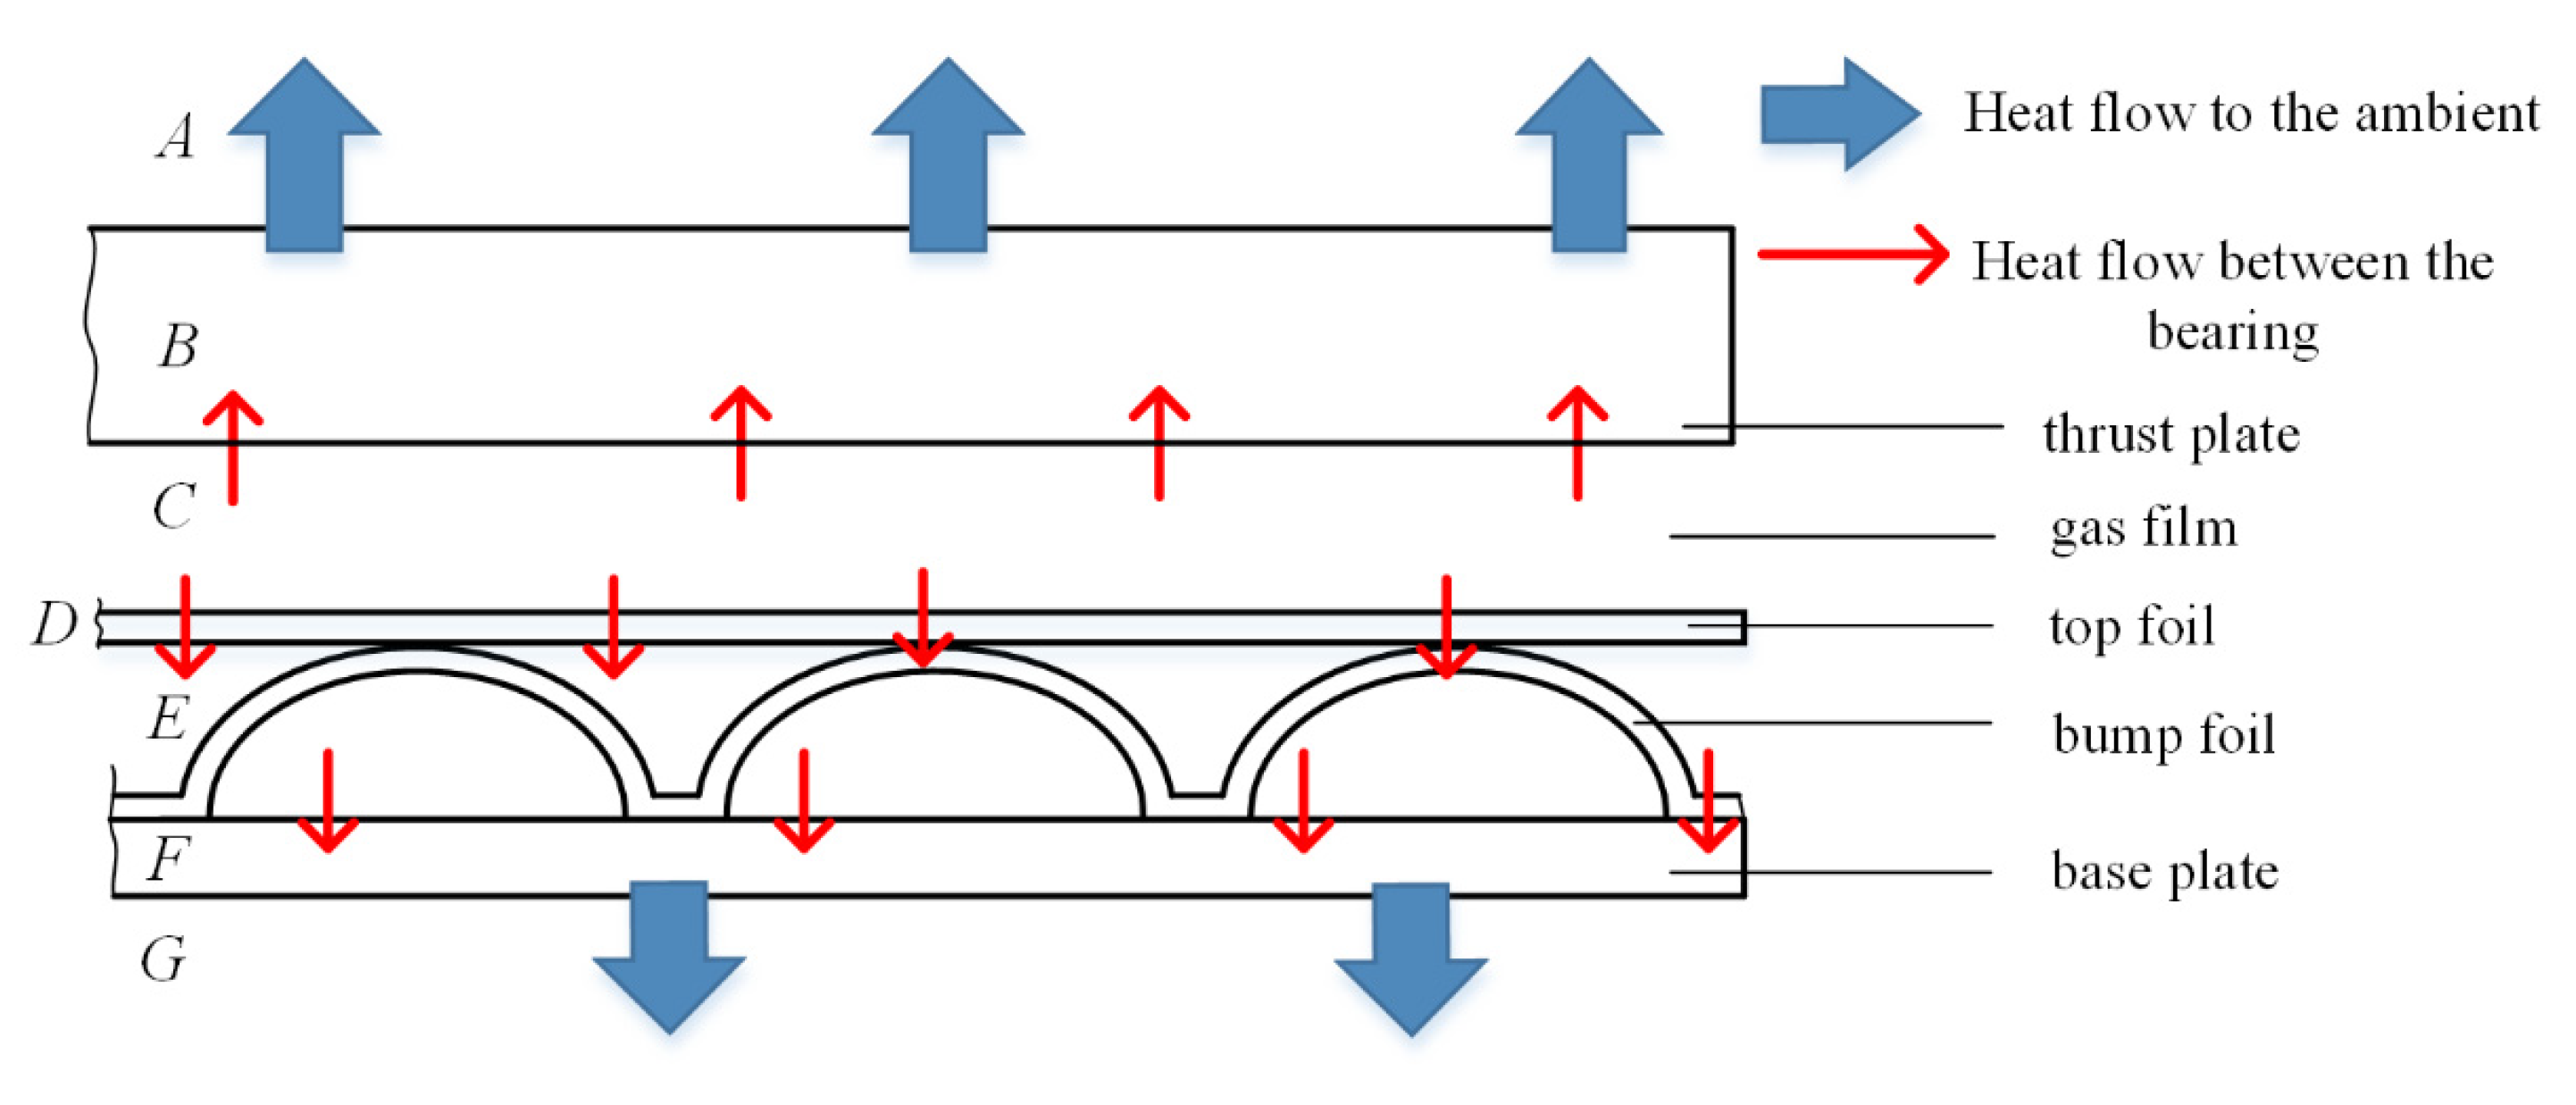
As shown in Figure 2, the entire structural system is divided into six areas along the gas film thickness direction to describe the heat flow. From area A to area G, heat is generated inside the gas film (area C), and one part of the heat is transferred to the ambient or cooling air (area A) through the thrust disc (area B). Another part is transferred to the top foil (area D), and then to the bearing housing (area F) by heat conduction or heat convection (area E) and finally transferred to the open air (area G). When there is cooling air passing through the bump foil channel, only a small part of the heat is transferred to the surrounding air through the bump foil and bearing sleeve.
2.1. Calculation Process and Parameters
In this paper, the energy equation of the gas film in cylindrical coordinate system is established as follow:
where cp is the specific heat capacity of gas at constant pressure (J/(kg·K)); ka is the thermal conductivity of the gas (W/(m·K)); is the gas viscosity which changes with temperature, according to the reference [5], the relationship between and temperature is expressed as:
where the slope a = 4 × 10⁻⁸, when the unit of temperature T is degrees Celsius, Tref = −458.75.
The energy equation is nondimensionalized as follow:
where k1, k2, k3, k4 are expressed as follows:
and the dimensionless coefficients in Equation (3) are defined as follows:
The velocity components could be solved by the continuity equation of hydrodynamics and the boundary conditions assumptions in Reynold’s equation.
2.2. Non-Isothermal Reynolds Equation of Gas Film
When the rotor is running at a higher speed, the heat generated by gas viscous dissipation and compression will increase the gas film temperature. Meanwhile, gas properties such as density and viscosity will change, which can have important impacts on the bearing performance. The non-isothermal gas film Reynolds equation applied in this paper is formulated as:
where μ(T) represents gas viscosity. In the calculation process, the average temperature of the gas film is used to update its viscosity.
2.3. Gas Film Thickness Equation
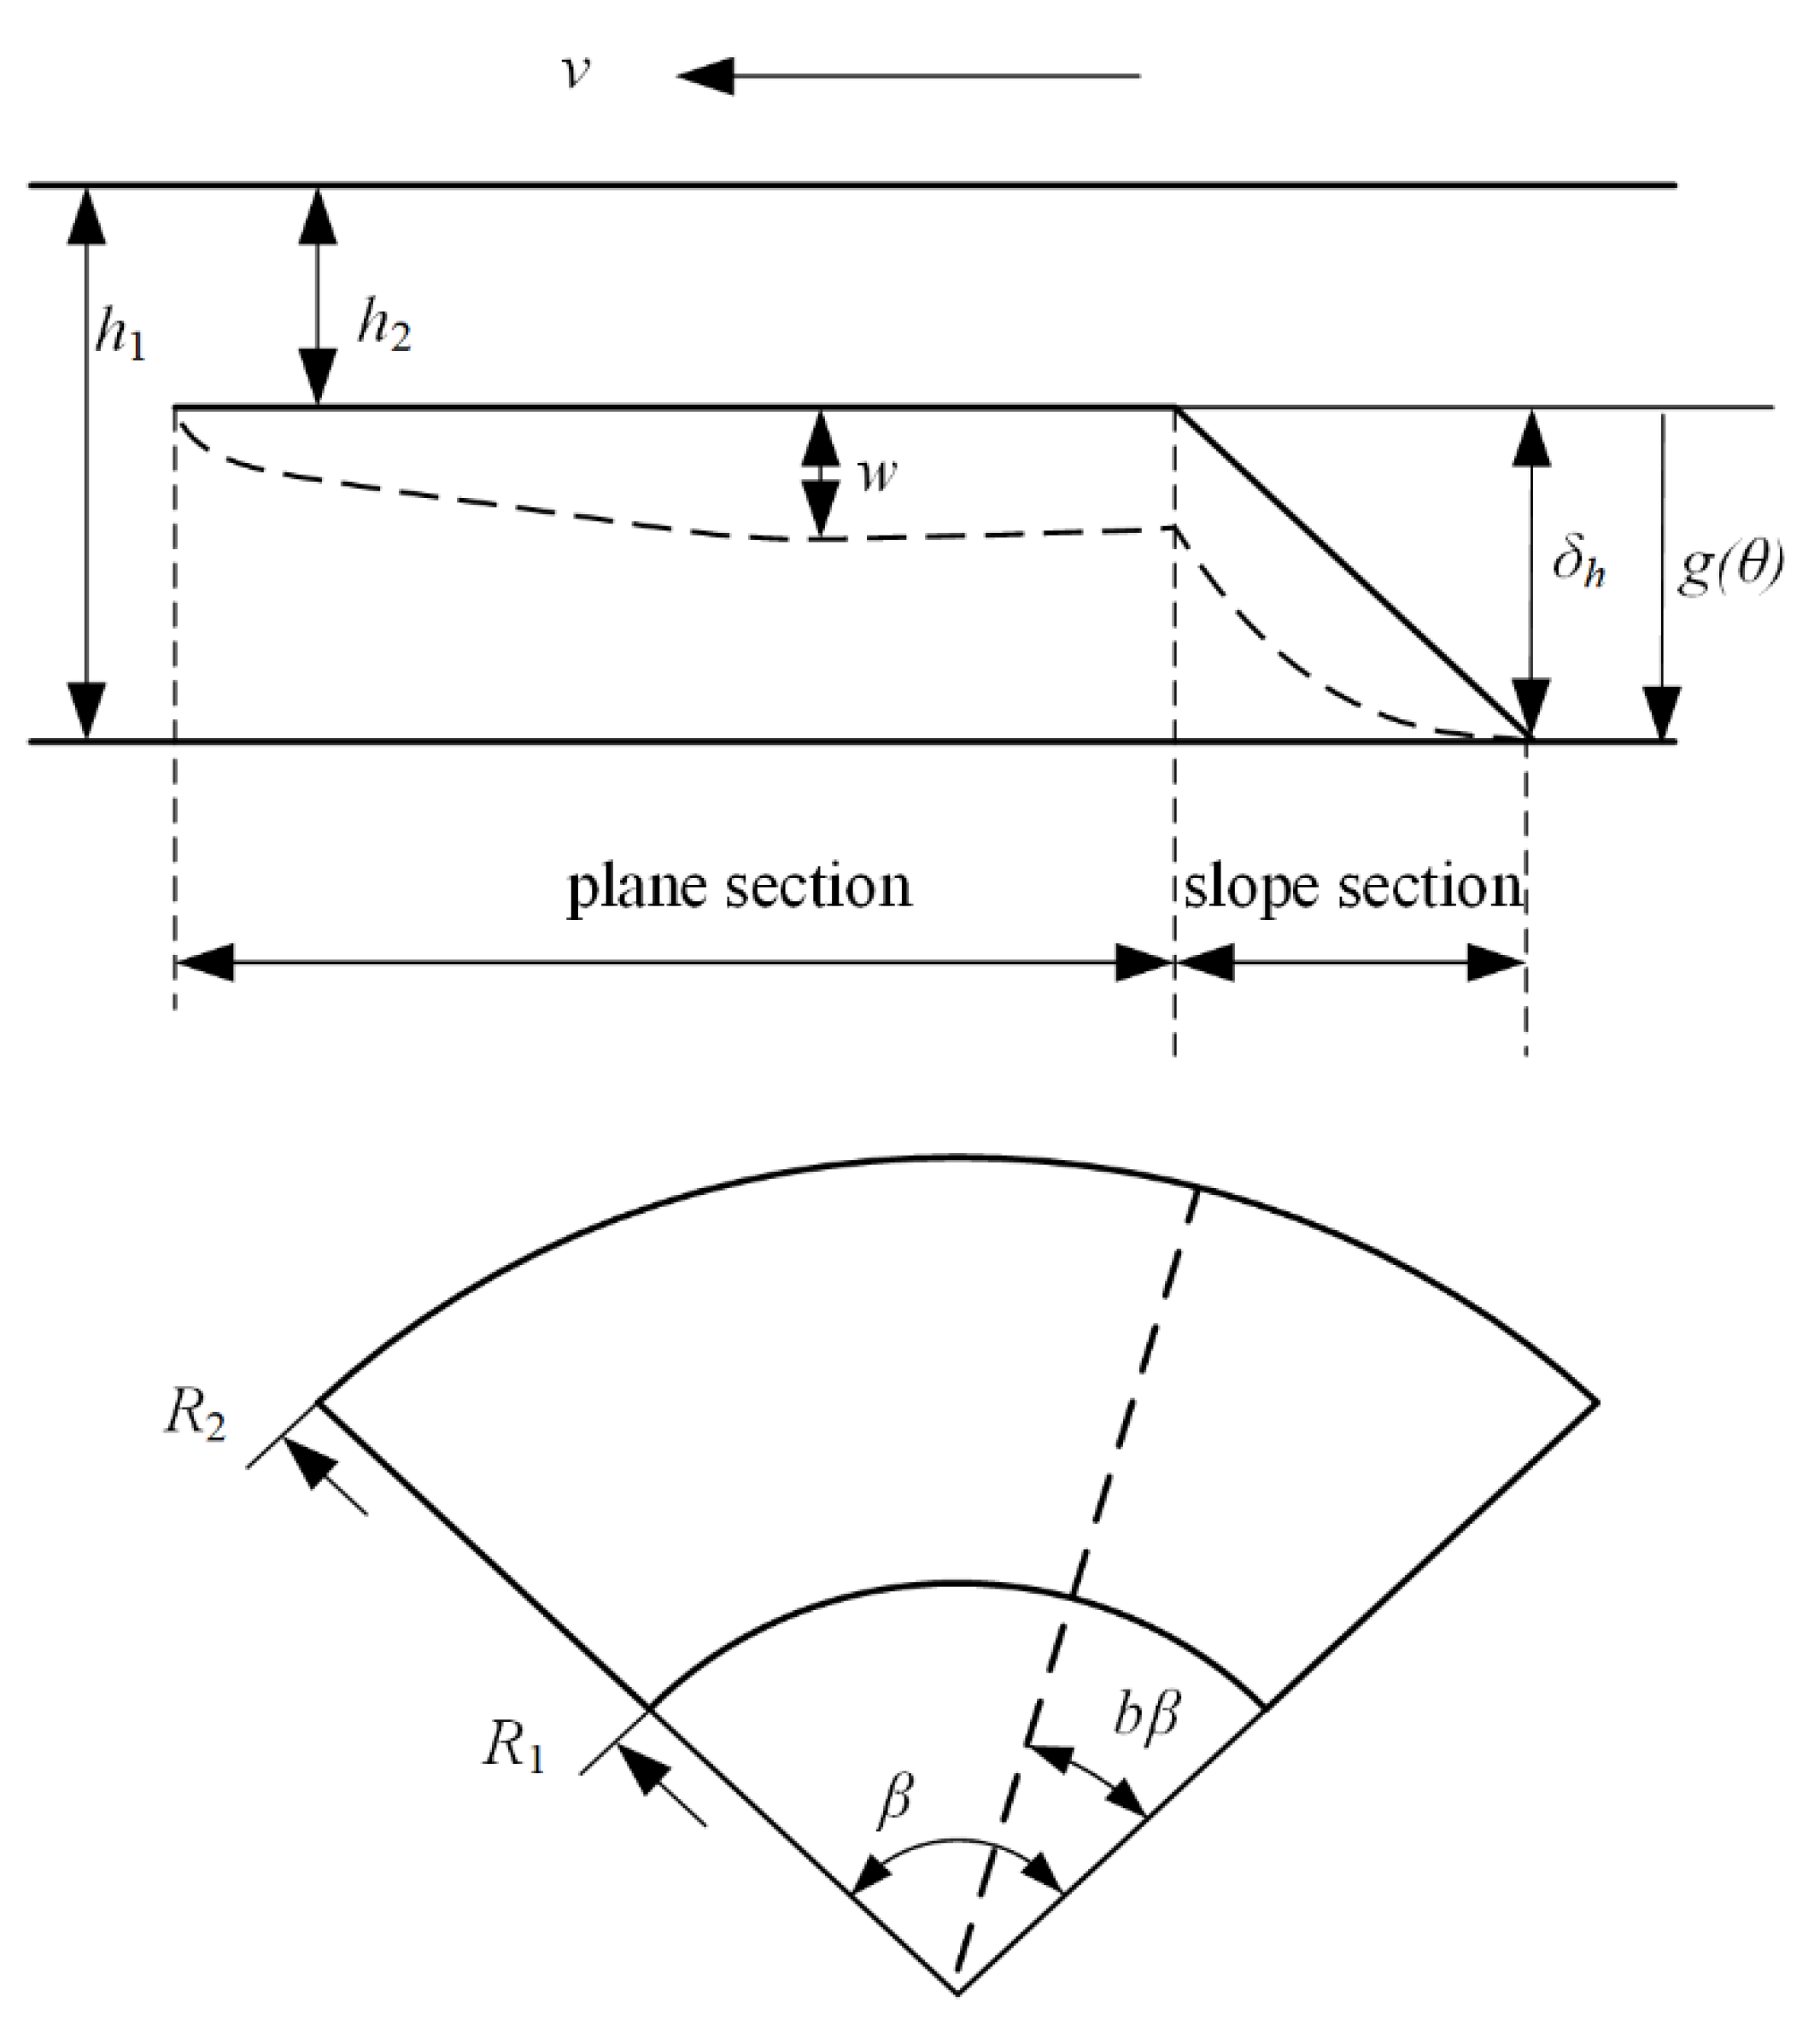
According to the structure form of the thrust bearing, considering the influence of temperature on the thermal expansion of the bearing structure, the gas film thickness distribution is shown in Figure 3, and its equation is as follows:
where h2 is the gas film thickness in the plane area (m); is the initial gas film thickness distribution which minuses the value of h2 (m); is the angle of top foil (°); b is the pitch ratio; is the deformation of top foil under aerodynamic force, and is the stiffness of the bump foil per unit of transverse length (N/m2) [18]; Δthermal is the total thermal expansion of all bearing structures (m).
2.4. Bearing Load Capacity and Friction Loss Power
Load capacity () and friction loss power () are the main static characteristics to measure bearing performance, their calculation formulas are as follows:
where n is the rotational speed of the thrust plate, is friction torque.
2.5. Heat Transfer Model of Bearing Components
2.5.1. Heat Transfer Model of Top Foil Side
In this paper, the equivalent thermal resistance is applied to calculate the overall heat transfer processes when cooling air is introduced or not.
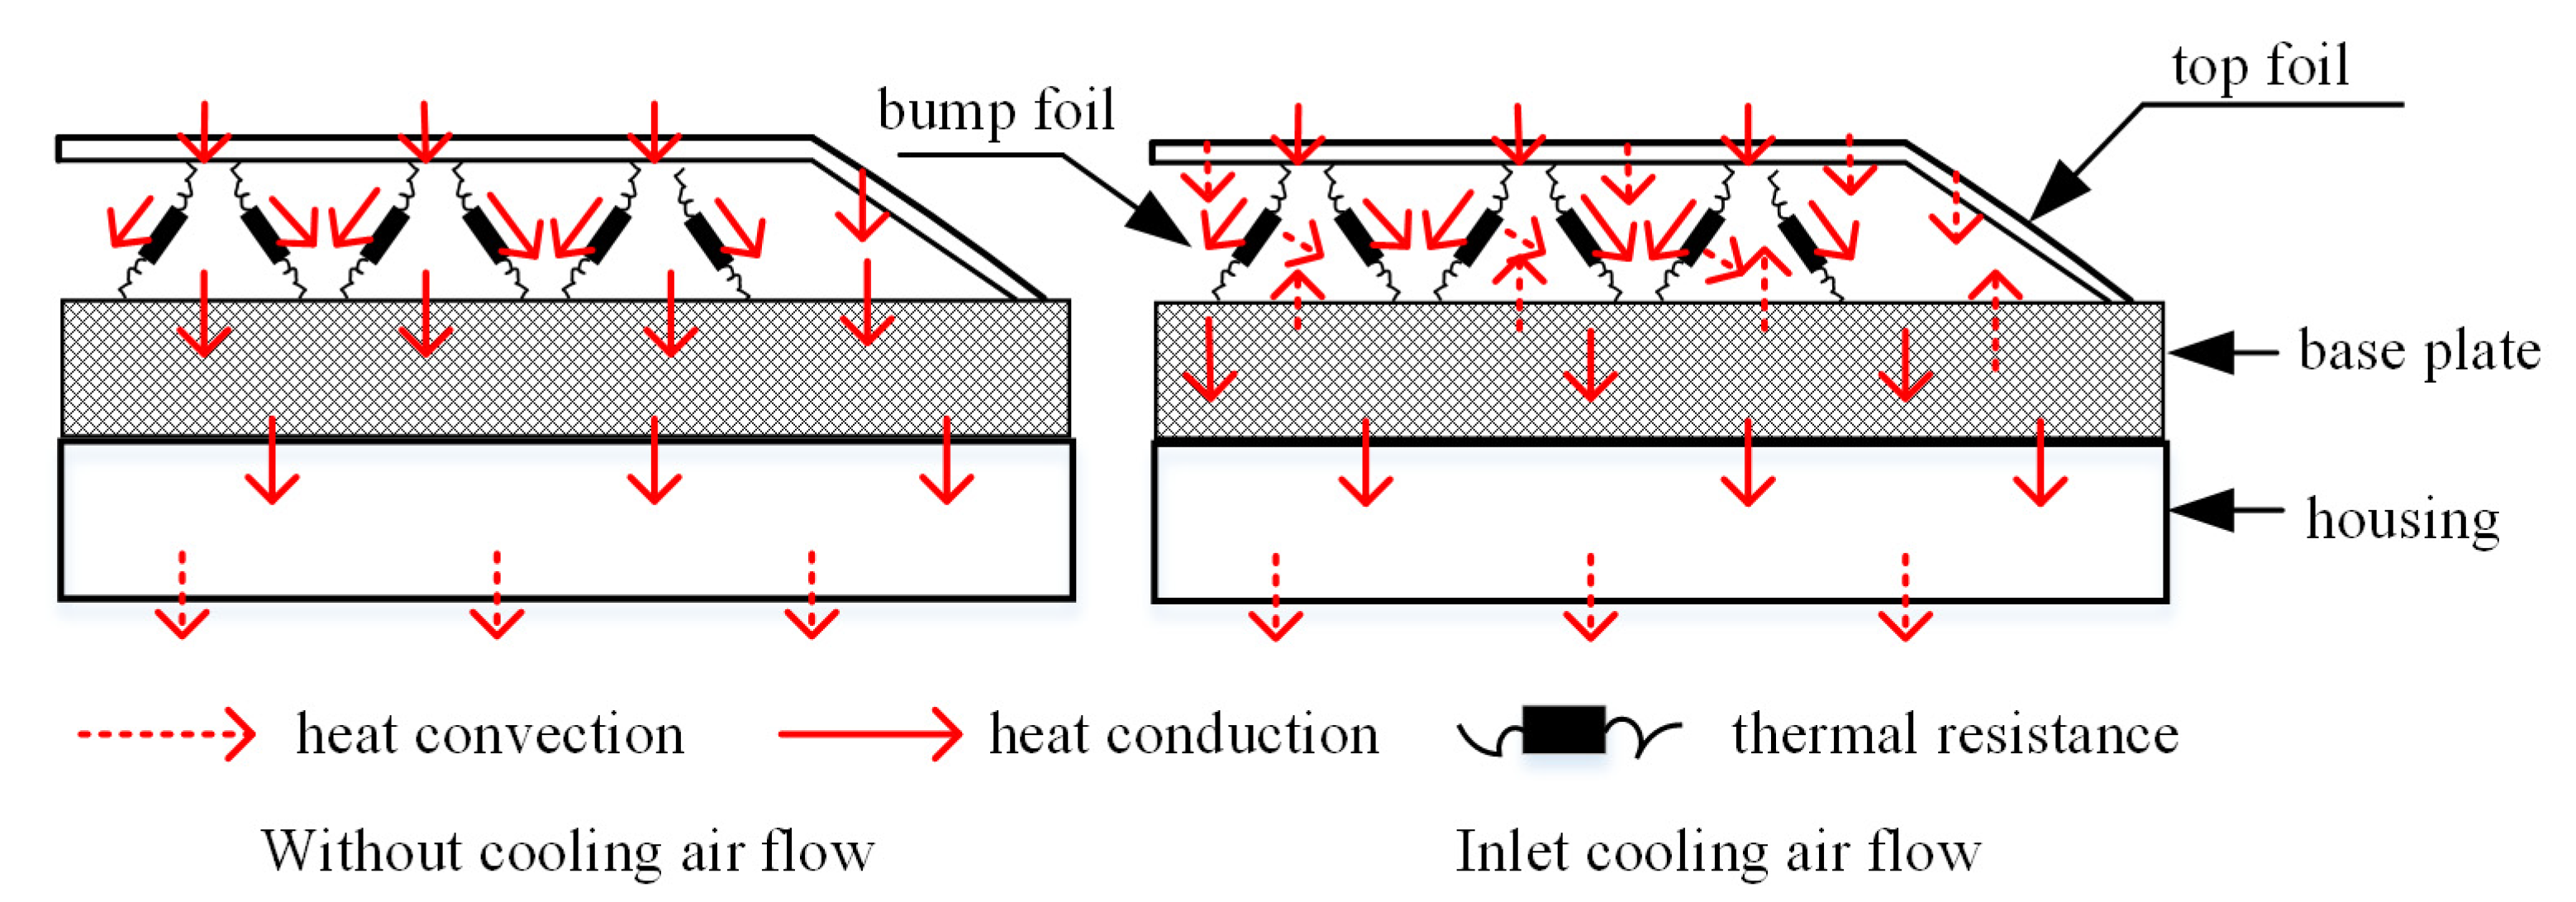
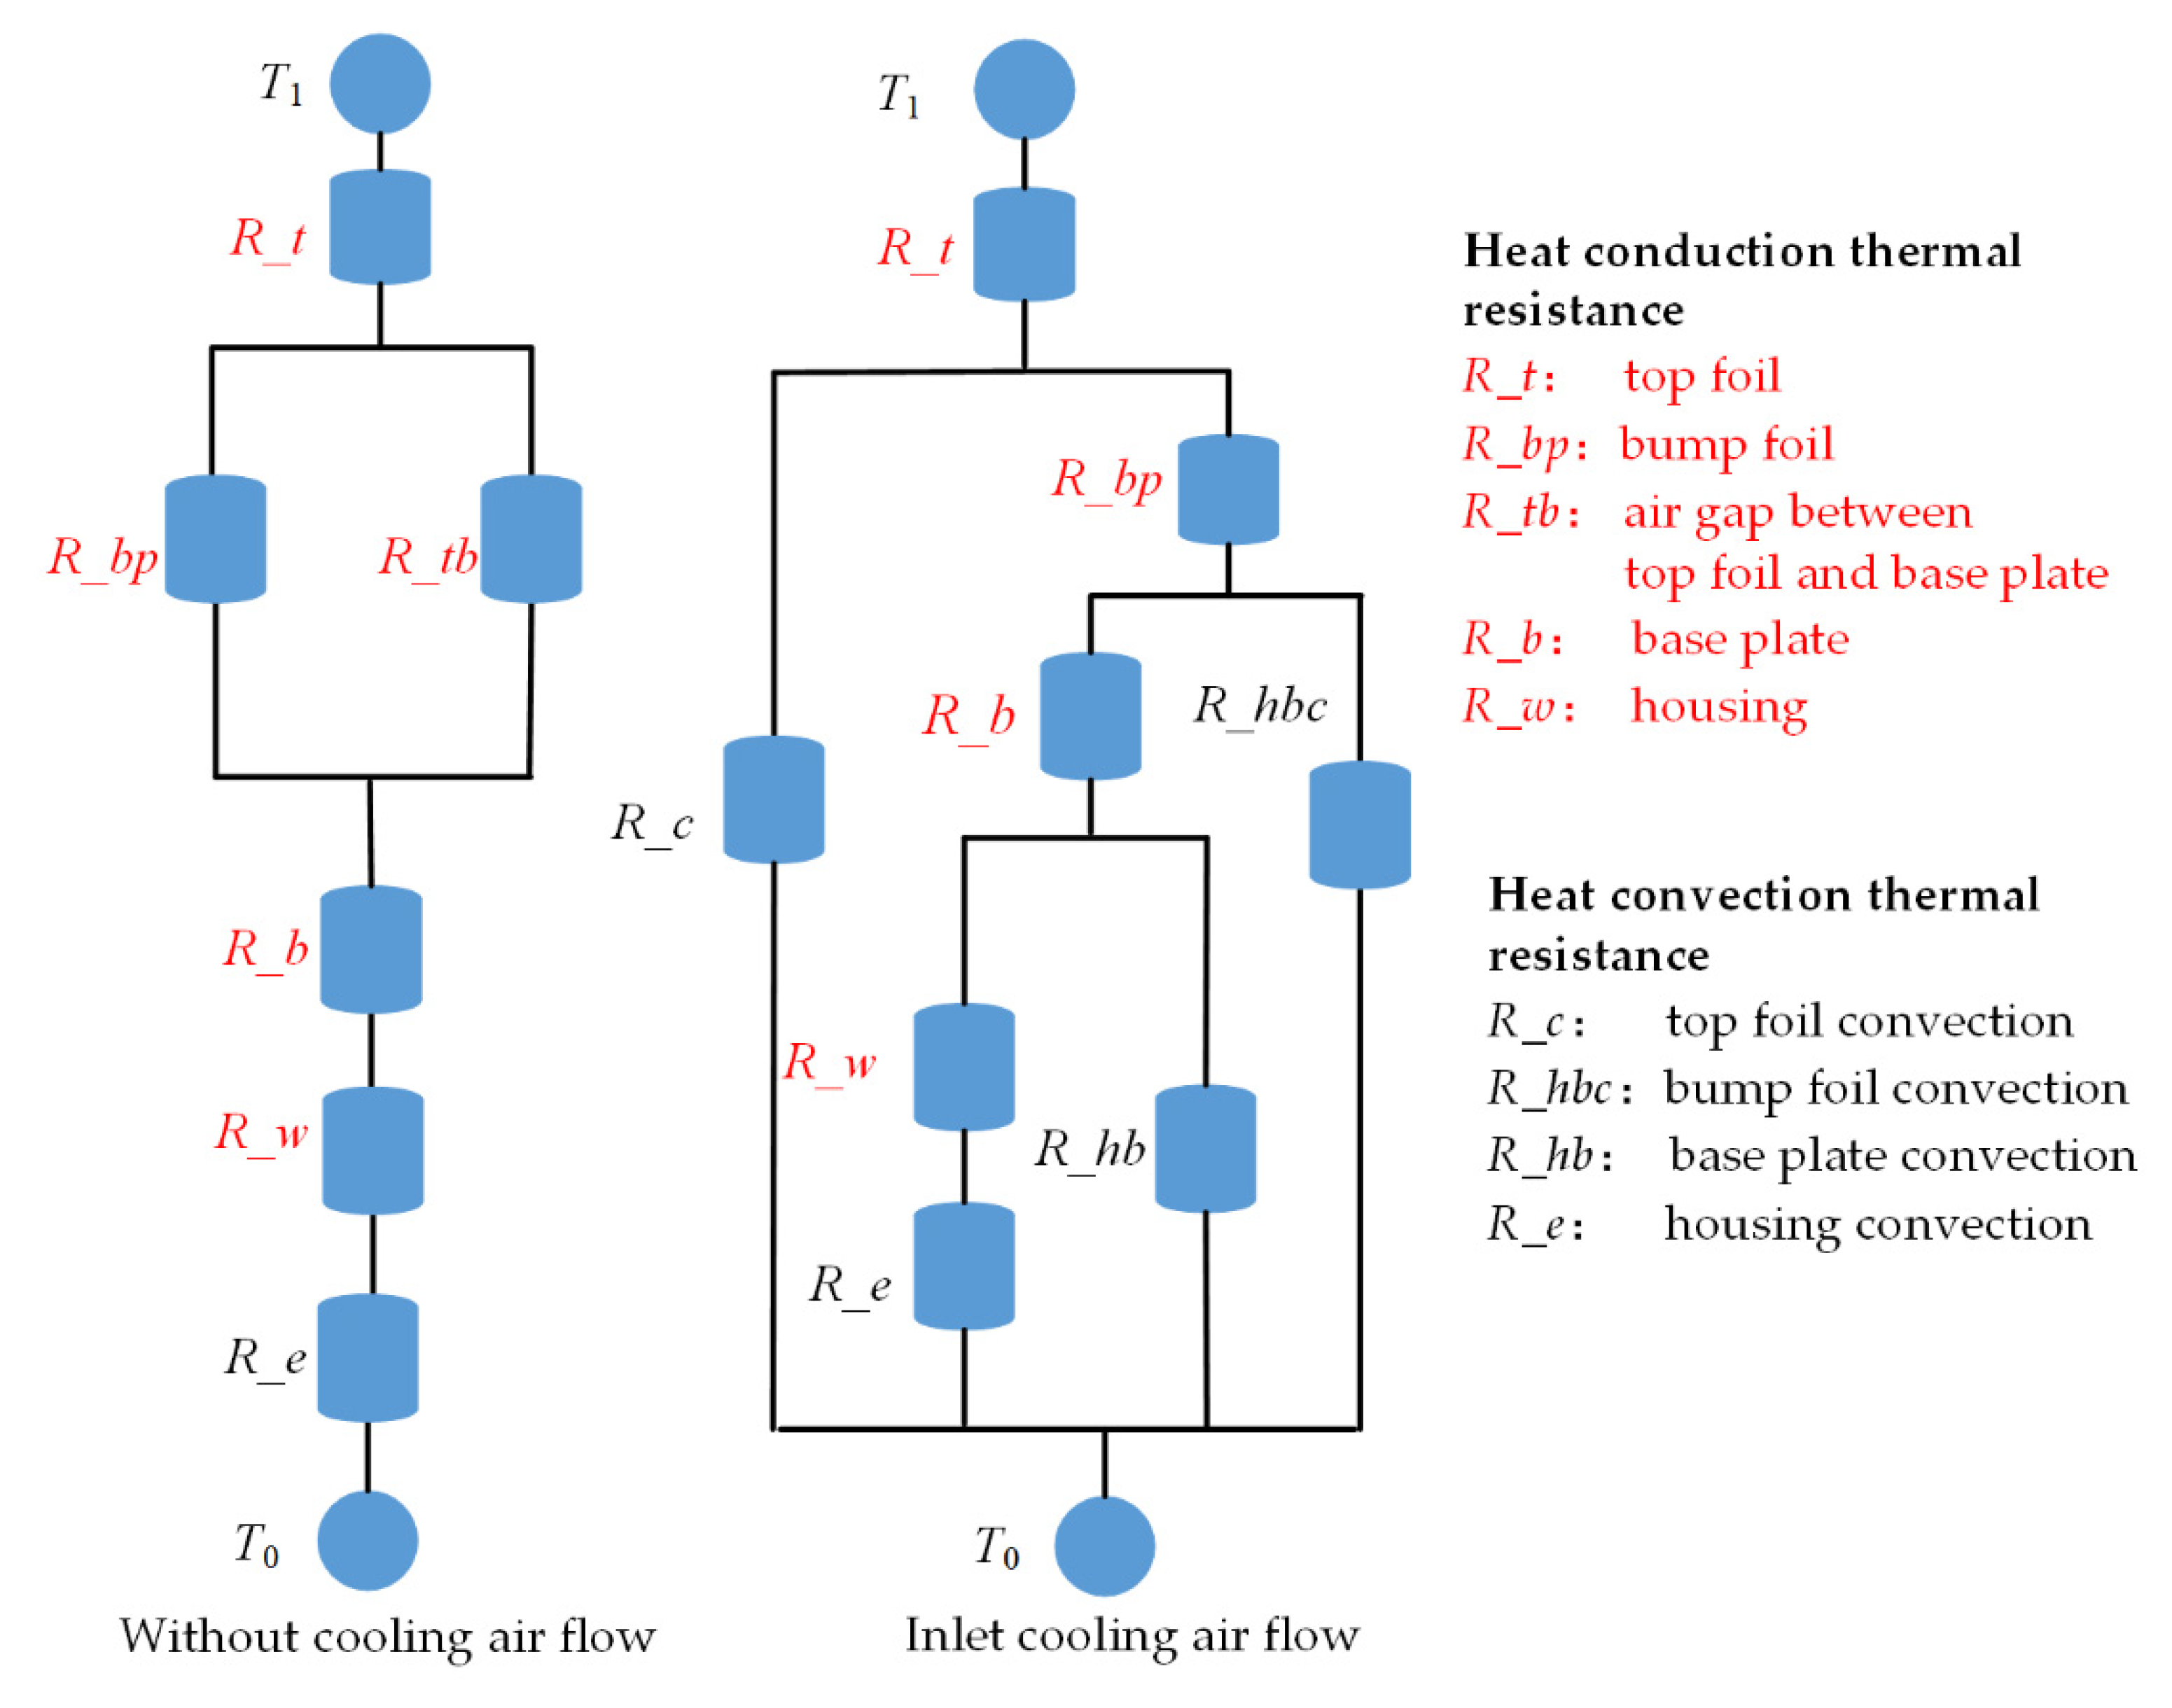
Figure 4 is the heat transfer model on the top foil side. The figure on the left shows that when cold air is not passed into the foil, the heat generated in the gas film passes through the top foil through conduction. Part of the heat is conducted to the base plate through the bump foil, and the other part is conducted to the base plate through the air in the gap between foils. As the base plate is in close contact with the bearing housing, the heat is transferred to the bearing housing through heat conduction, and finally spread out through natural convection. The figure on the right shows that when the cooling air flow is introduced into the foil, the heat generated in the gas film transferred through a different way. The heat passes through the top foil through conduction and part of it is transferred to the bump foil through heat conduction, and another part is taken away by the cold air directly. The heat transferred to the bump foil is conducted to the base plate partly, and the rest of it is taken away by the cold air which passed through the upper and lower surfaces of the bump foil. Then, part of the heat transferred to the base plate is taken away by the cooling air flow on the upper surface of the base plate through convection, the other part is transferred to the bearing housing through heat conduction, and finally spread out through natural convection. Correspondingly, the equivalent thermal resistance models of these two situations are established, respectively.
Figure 5 is the schematic diagram of thermal resistance model established based on the ways of heat transfer in the foil structures, where T1 is the air film temperature on the top foil side; T0 is the ambient temperature. The remaining parameters are the corresponding equivalent thermal resistance.
When there is no cooling air flow injected, the equivalent total thermal resistance is calculated as follows:
when the cooling air flow is introduced into the bump foil, the equivalent total thermal resistance is calculated as follows:
where R_i is calculated as follows:
the calculation formula for each thermal resistance is as follows:
where i,j are the serial number of the thermal resistance; t is the thickness on heat transmission direction (m); k is the thermal conductivity of the material (W/K·m); h is the coefficient of heat convection(W/m2·K); A is the heat transmission area (m2). Under normal circumstances, the parameters t and A are determined by the geometric features of the components, exceptionally, the Ai of R_bp is contact area between the bump foil and base plate, and the Aj of the R_hbc is approximated obtained by straight inclined segments of the bump foil.
When the gas film temperature reaches equilibrium, the heat transferred into the top foil from the gas film will be in dynamic balance with the heat transferred from the top foil side to the outside. Therefore, the heat balance equation between T1 and T0 considering the total thermal resistance of the foil structures Ra will form the:
2.5.2. Heat Transfer Model of the Thrust Plate
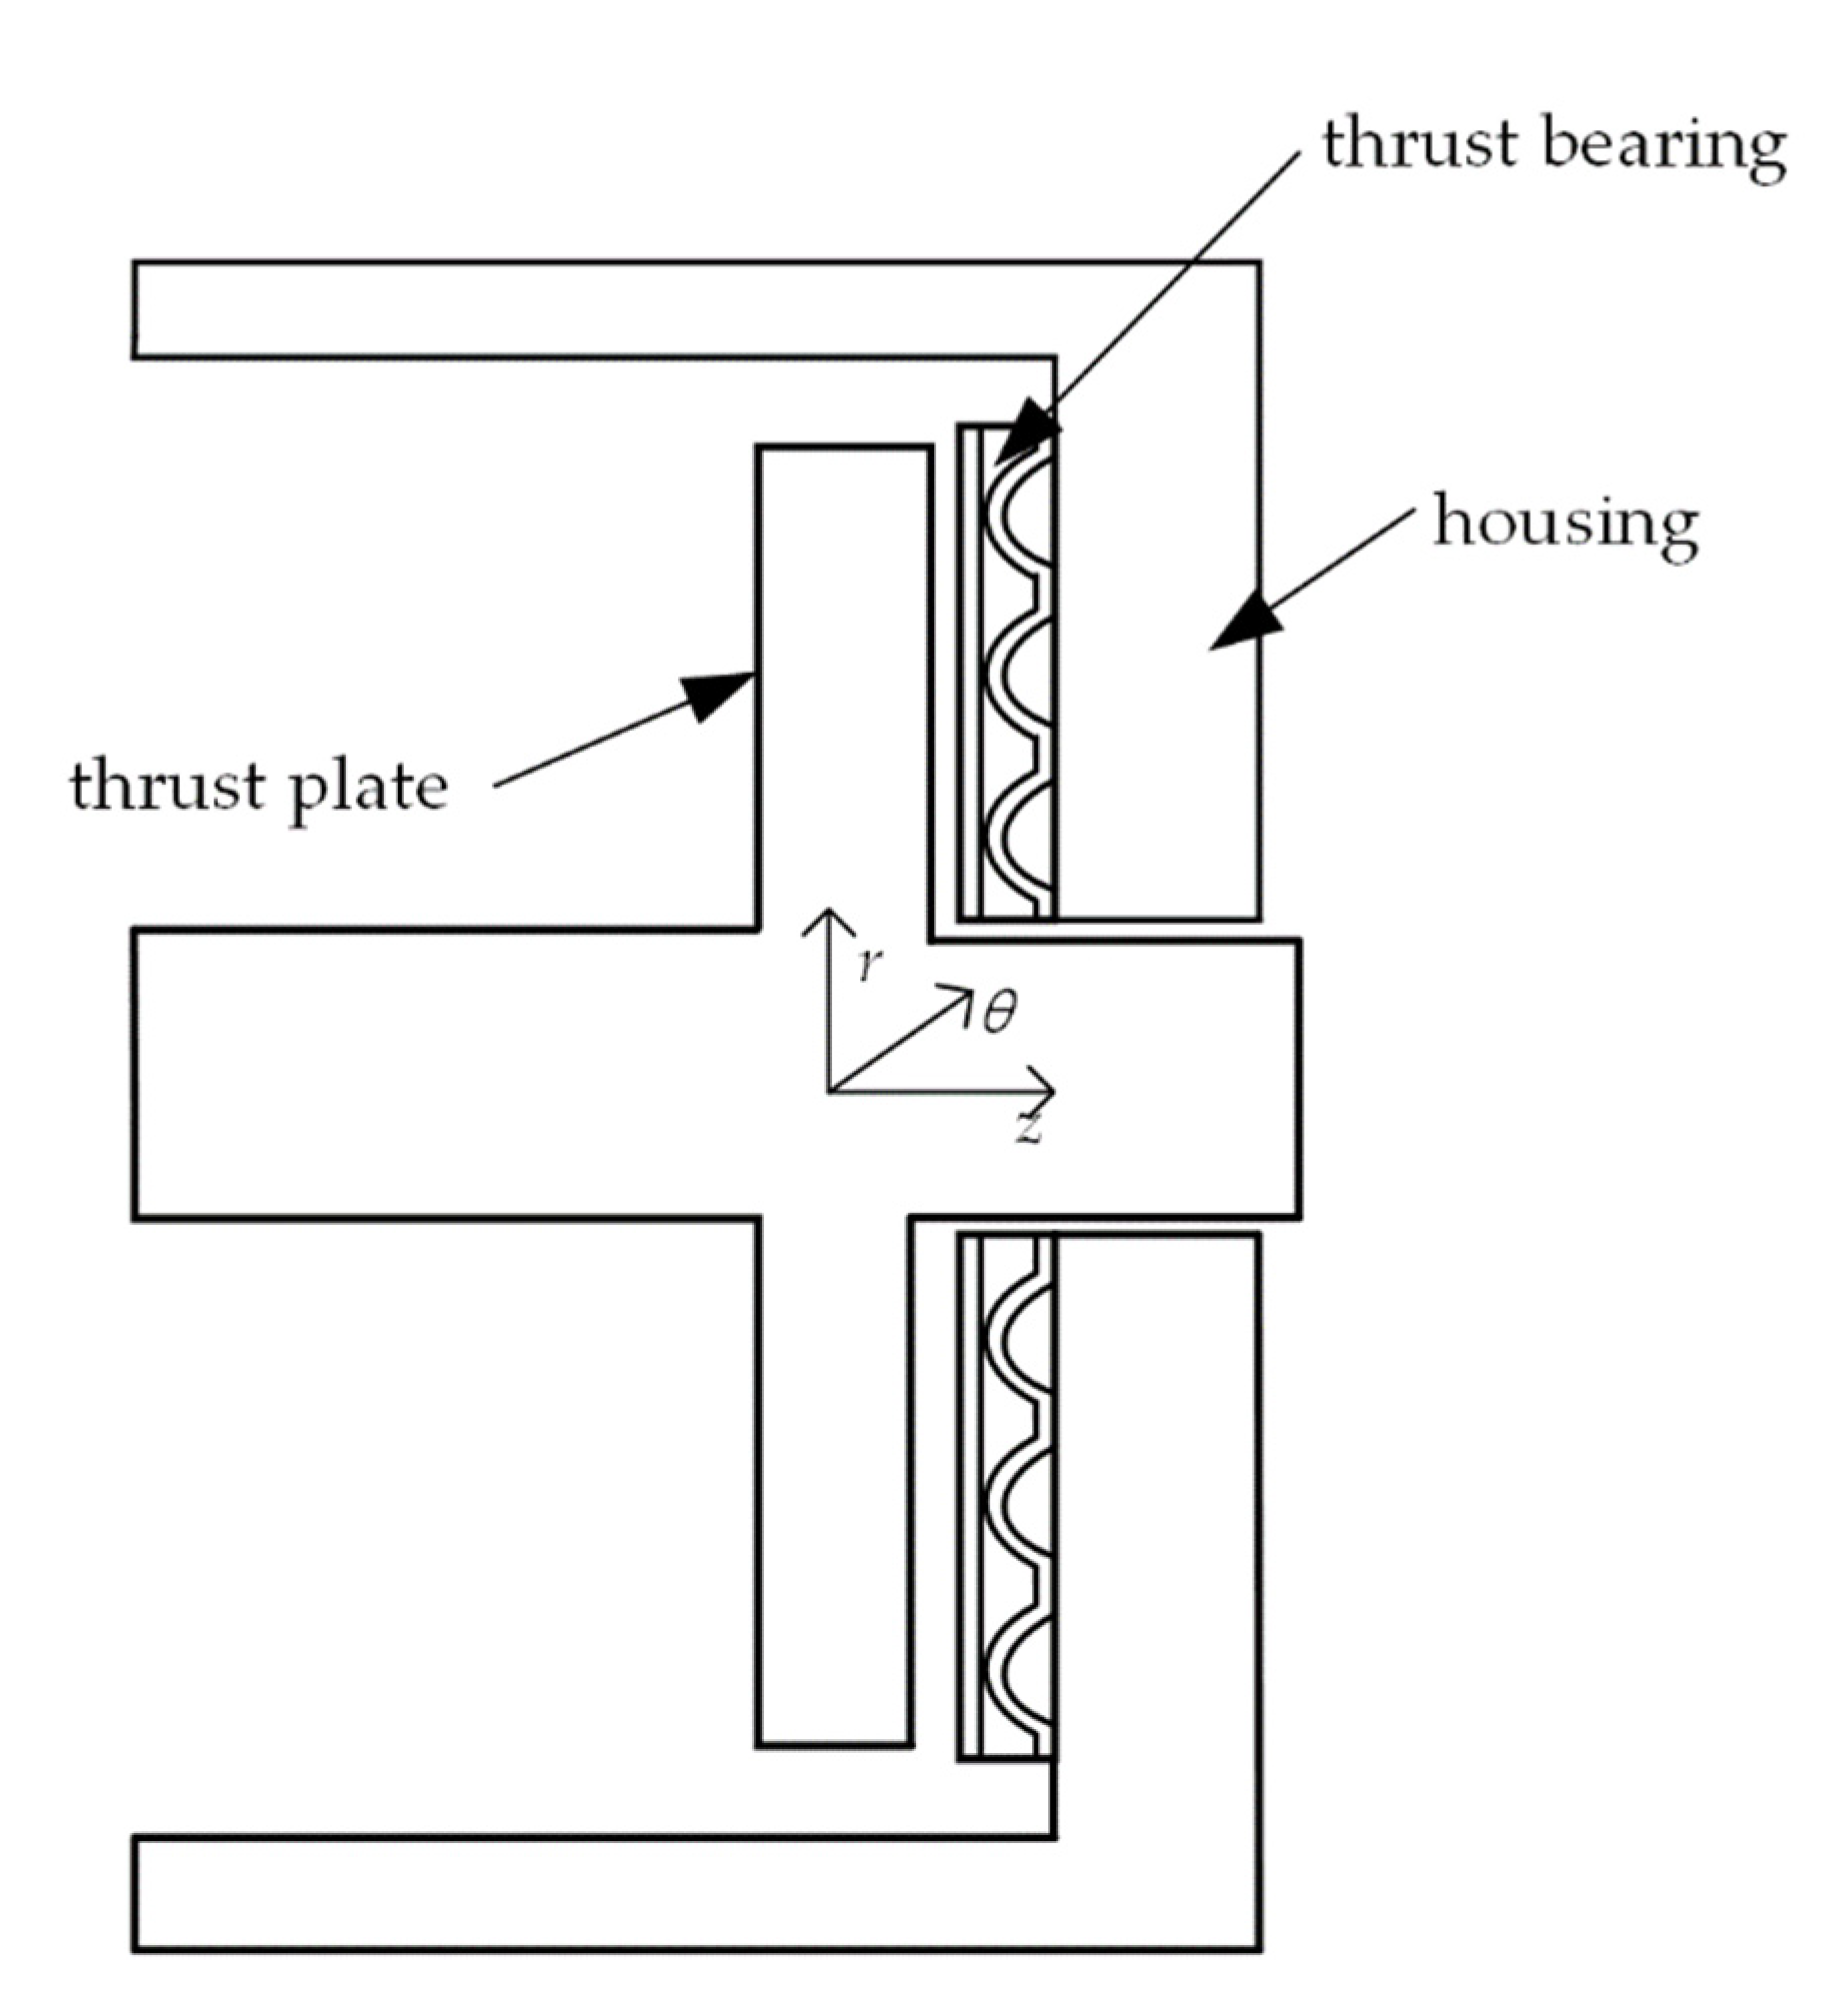
Figure 6 is the assembly diagram of a single side thrust bearing. Considering that the thrust plate has high rotating speed, it is assumed that the surface temperature of the thrust plate is consistent along the circumferential direction in the calculation process.
The governing equation of the one-dimensional thrust plate heat conduction model in the radial direction is formulated as:
where kdisc is thermal conductivity of thrust plate (W/K·m); Tdisc is the thrust plate surface temperature (K); hconv_disc is the convection coefficient of air and thrust plate (W/K·m); tdisc is the thrust plate thickness (m).
The last two items represent the heat flux density from the gas film to the thrust plate and from the thrust plate to the ambient environment through the inner and outer radial, respectively. The heat transferred from the air film to the thrust plate is expressed as:
In this paper, when considering the heat transfer condition on the other side of the thrust plate, the heat dissipation model of the backside of the rotor thrust plate is regarded as the convection heat dissipation of the rotating plate in static air. When calculating the heat dissipation coefficient of convection between the back of the thrust plate and the environment, the calculation formula in reference [19] is used in this article:
where Nu represents the Nusselt number of the fluid, which is used to describe the convective heat transfer intensity, and Reω represents the Reynolds number, and k is the thermal conductivity of thrust plate (W/K·m), and L is the characteristic length (m).
In order the calculate the convective heat dissipation from the thrust plate outer surface to the surrounding air, the convection coefficient on the outer surface of a rotating cylinder is used in this paper [20]:
where Re2 is the Reynolds number with DR being the characteristic length, and DR is equal to 2r2; r2 is the outer radius of the thrust bearing (m); Pr is the Prandtl number of air; kair is the thermal conductivity of gas (W/K·m).
is the heat flux density transferred from the thrust plate to the environment in the radial direction, which is calculated as follows:
2.5.3. Temperature Boundary Condition in the Gas Film Inlet Area
For bump foil thrust gas bearings, the pressure in the gas film area is higher than the ambient atmospheric pressure, thus leading to the leakage of air from the radial boundaries. Meanwhile, the same amount of air suc is brought into the gas film at the top foil leading edge, which will mix with recirculation air rec to achieve the conservation of the total amount of gas in.
The temperature of the inlet mixed air is calculated as follows based on the energy balance condition of the controlled gas volume:
where Tin is the mixed gas temperature at the leading edge of the top foil (K); Trec is the circulating air temperature at the rear edge of the top foil (K); Tsuc is the temperature of the intake cooling air (K).
3. Thermal Analysis
3.1. Calculation Process and Parameters
3.2. Analysis of Influence Factors of Bearing Temperature
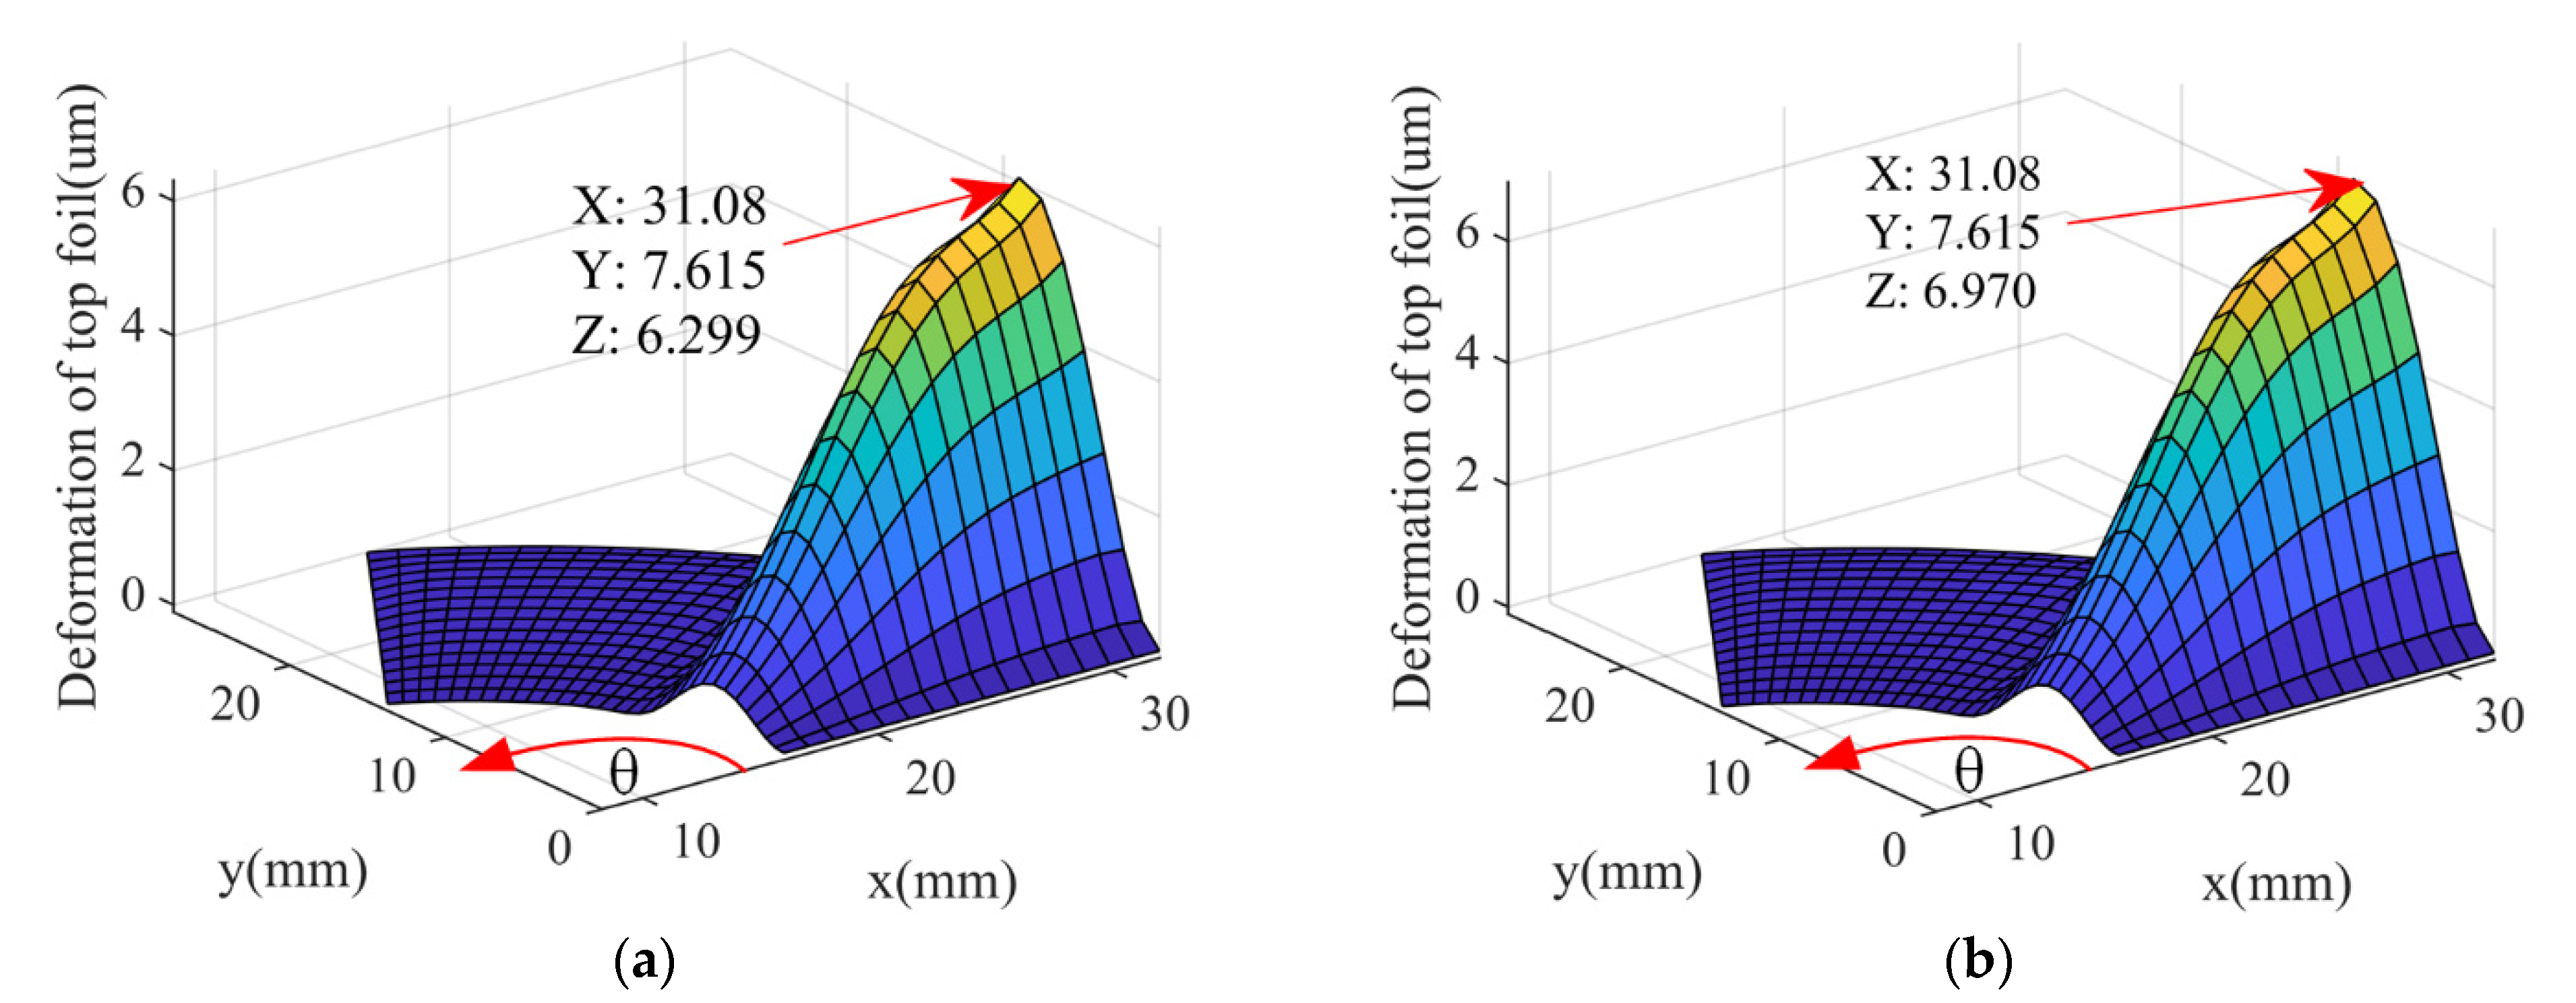
Figure 8 and Figure 9 present the top foil deformations and the dimensionless gas film pressure distributions when the rotor speed is 50 krpm and the initial minimum gas film thickness is 7 μm. Figure 8a,b show the calculation results of the isothermal model and THD model, respectively. It can be seen that the basic variation trends of the top foil deformations calculated by different models are the same, but the top foil deflection calculated by the THD model is larger. This is because the gas film pressure is larger when the temperature effect is considered. The top foil deformation in the inclined section is larger than that of the plane section due to the absence of the corrugated bump foil underneath. The larger foil stiffness in the plane section helps increase the bearing load capacity.
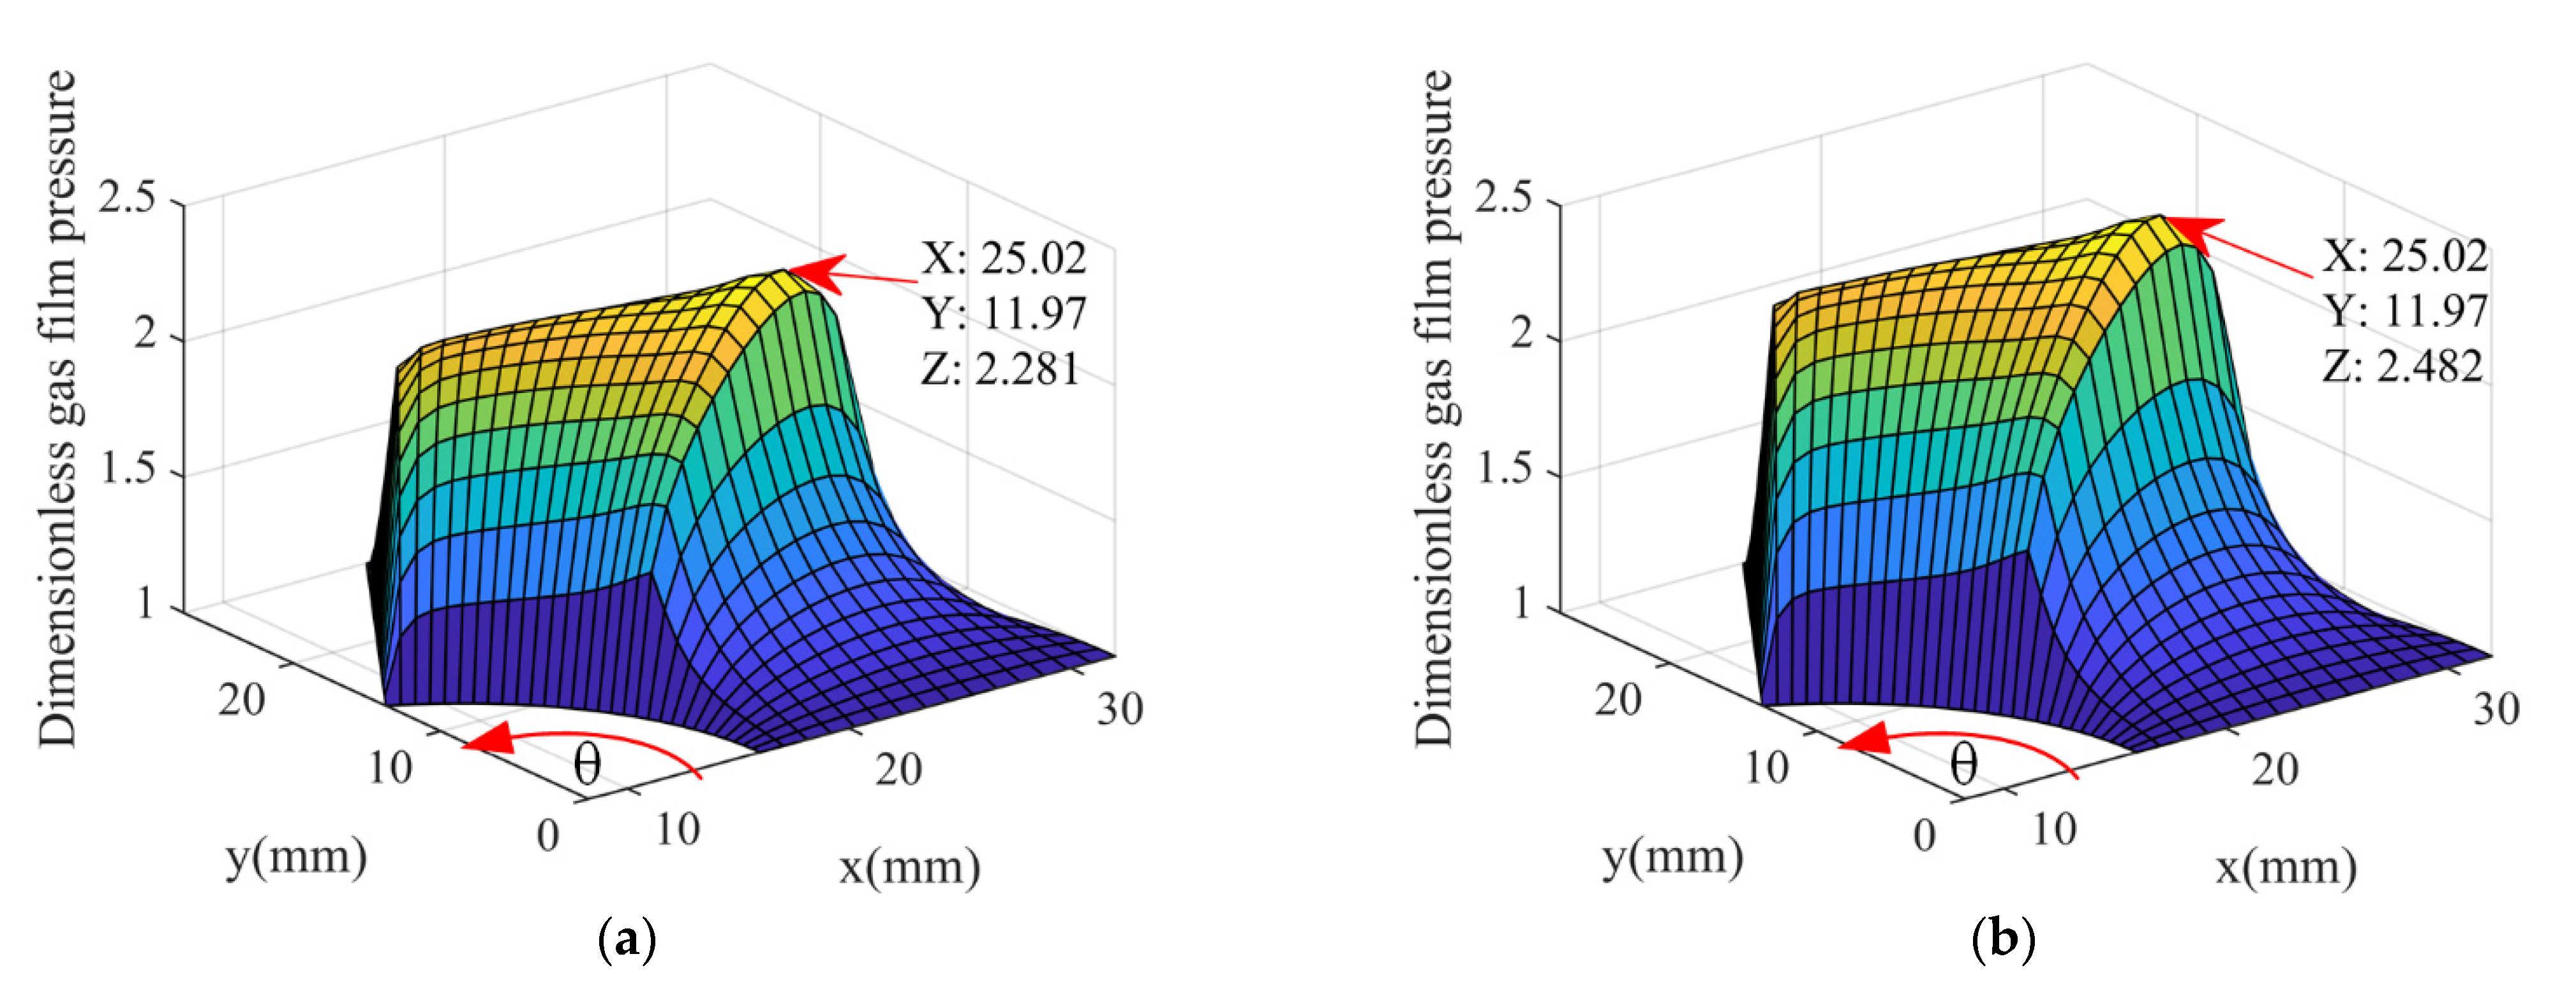
It can be seen from Figure 9 that the pressure distribution under the two calculation models is basically the same. Along the circumferential direction, the gas film pressure increases sharply from the inlet area, and reaches the maximum value when the gas film transits from the inclined area to the horizontal area. Then it slowly decreases, and finally the air pressure drops to atmospheric pressure in the gas outlet area. In the radial direction, both the inner and outer outlet area are atmospheric pressure, so the pressure presents a trend of increasing first and then decreasing from the inner radius to the outer radius boundaries. There is continuous leakage of gas from the radial boundaries when the bearing is under working condition because of the pressure distribution characteristics. Compared with the isothermal model, the gas film pressure calculated by the THD model is larger than that by the isothermal model. This is due to the fact that the gas viscosity continues to increase as the temperature rises, and the gas film thickness is reduced to a certain extent due to the thermal expansions of the thrust plate and the foil structures.
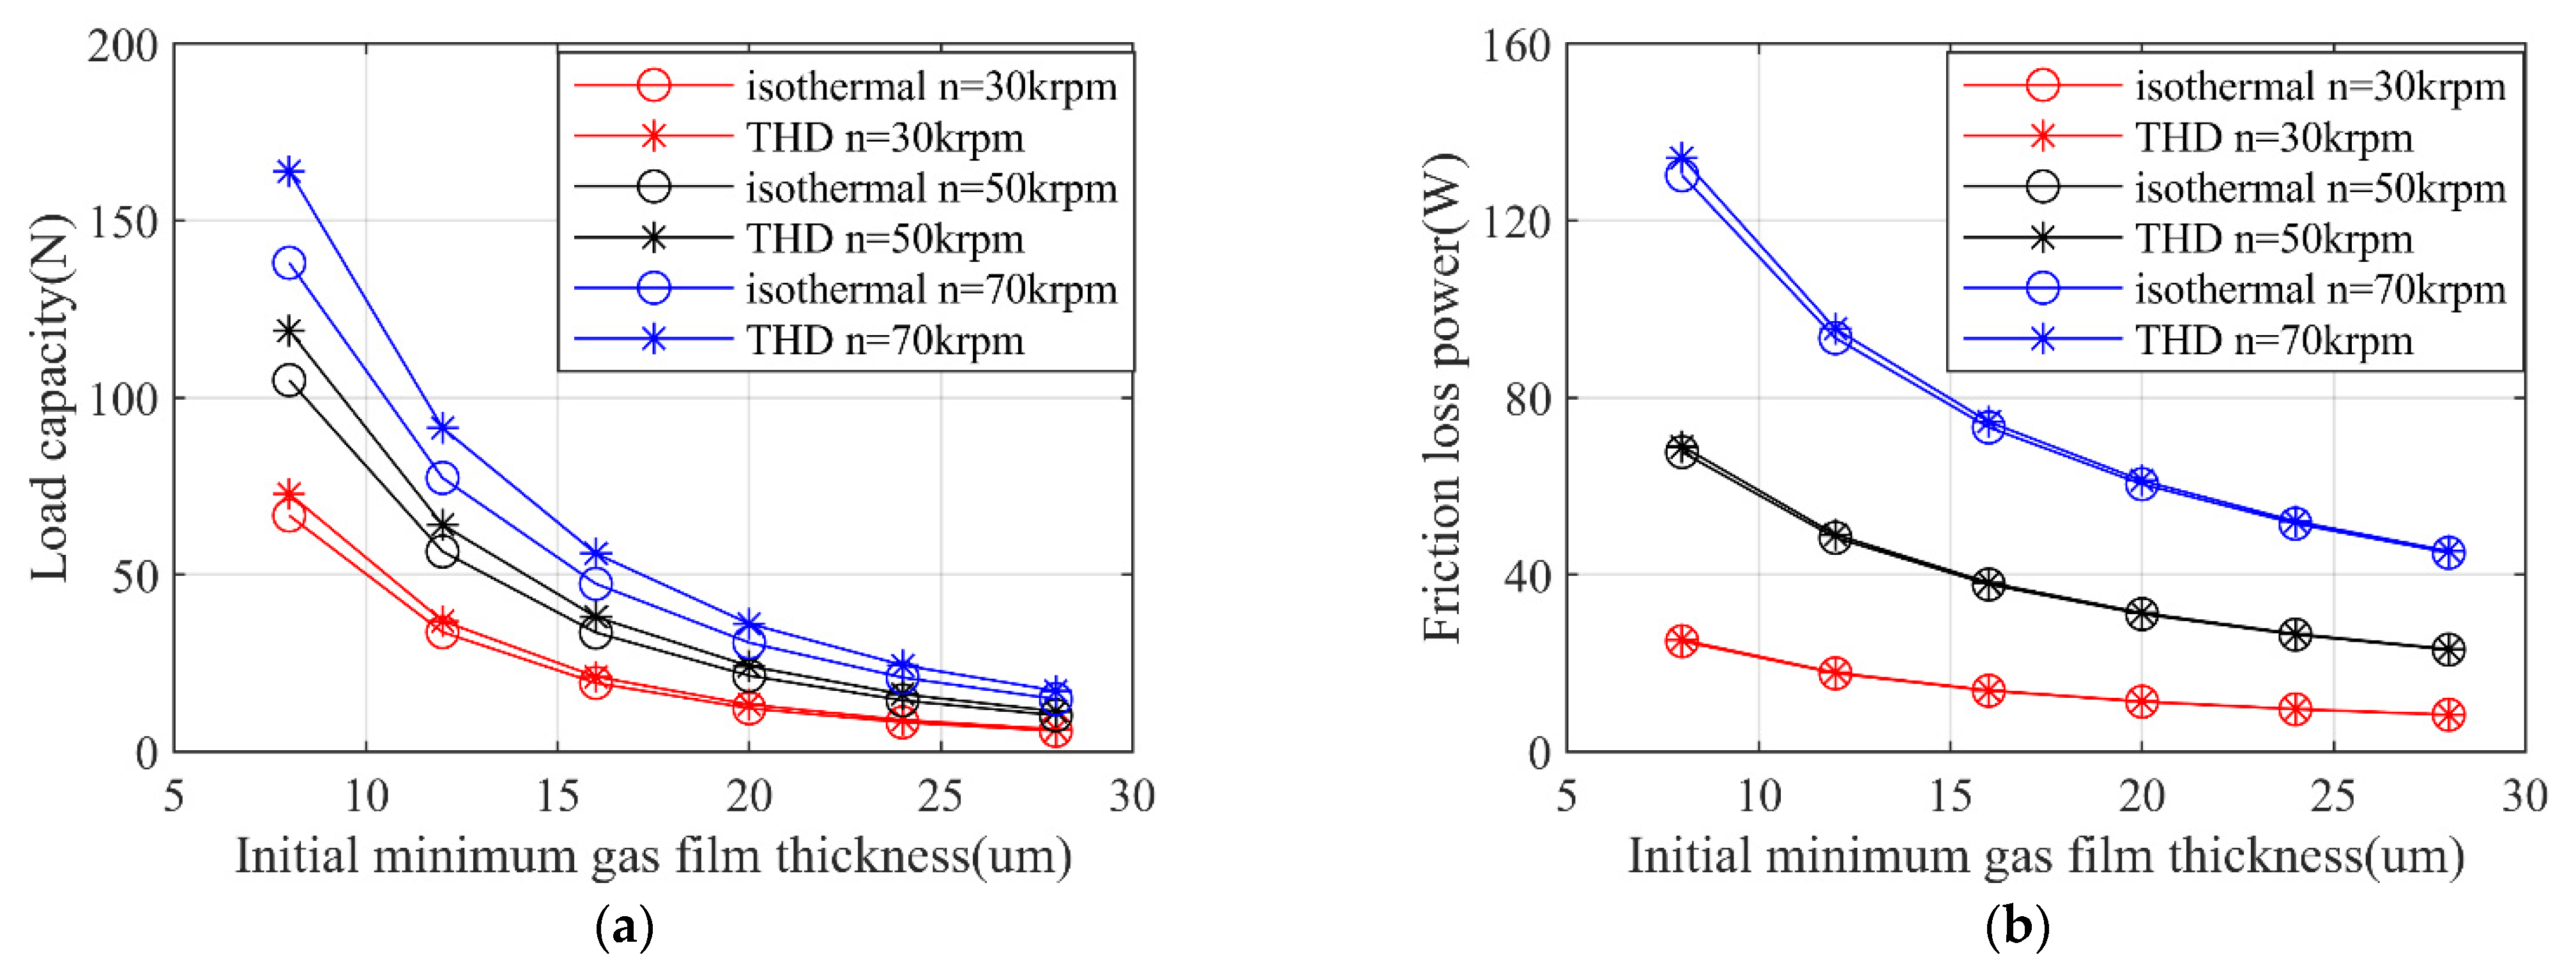
Figure 10 shows the change of bearing load capacity and friction loss power with the initial minimum gas film thickness calculated by the isothermal and THD models. It can be seen from the Figure 10a that bearing load capacity decreases with the increase in the initial minimum gas film thickness. When the initial minimum gas film thickness is increased to 30 μm, the gap between the thrust plate and the top foil is too large. Thus, the lubricating gas film is difficult to form, and the bearing almost has no load capacity. It can be seen from Figure 10b that the frictional loss power decreases as the initial minimum gas film thickness increases, which is because the gas film pressure is very small when the initial minimum gas film thickness is large. However, there is no obvious difference between the values of friction loss power calculated by the isothermal model and the THD model. When the initial minimum gas film thickness is the same, the bearing load capacity and friction loss power both increased when the rotor speed goes up, and the difference between the values of the bearing load capacity calculated by the THD model and the isothermal model increased significantly when the speed reach to higher value. This is due to the rapid rise of the gas film temperature caused by the increased rotational speed, and the gas viscosity increases with the temperature rising up.
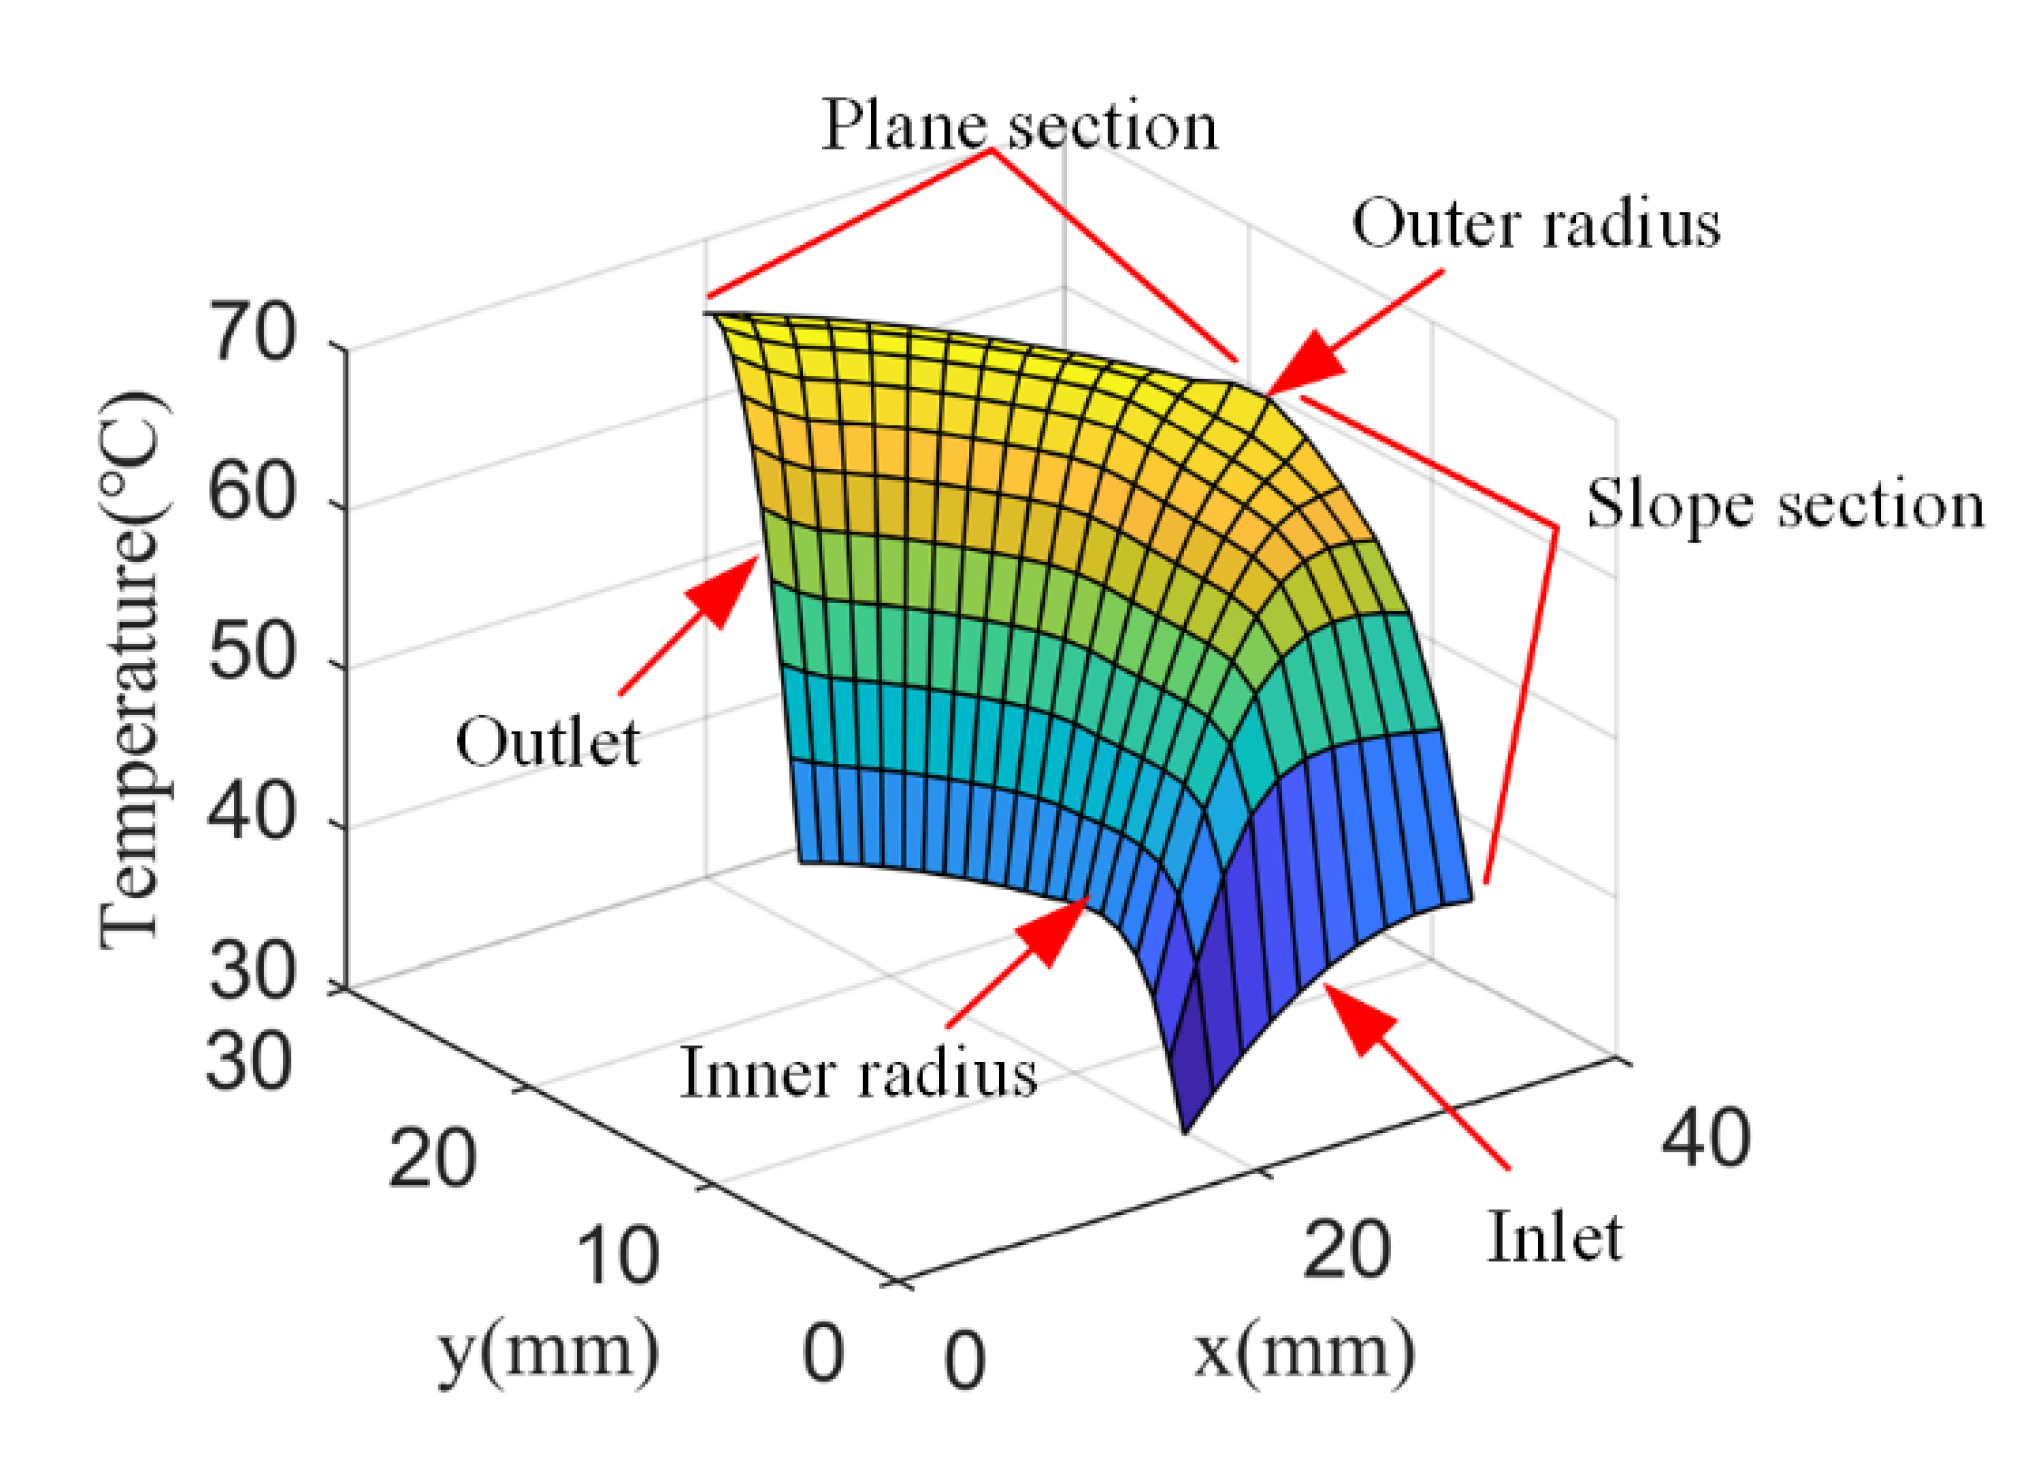
Figure 11 is the temperature distribution diagram of top foil under the rotor speed of 50 krpm and the static load of 100 N. Similar with the distribution of gas film pressure, the surface temperature of the top foil experiences, firstly, increasing along the rotor rotating direction and then maintaining at a certain value. In the entrance area, the temperature of the ambient gas that is brought into the gas film is relatively low, and it will rise sharply after mixing with the recirculation hot air. The top foil temperature in the plane section is almost the same, which is obviously higher than that in the inclined region. In the radial direction, the temperature increases first and then decreases slightly as the radius increases. This is because the larger radius indicates the larger linear velocity of the gas film and the larger amount of heat generated due to viscous friction. The decreasing trend near the edge can be explained as the heat is dissipated by the forced convection on the thrust plate outer radius surface.
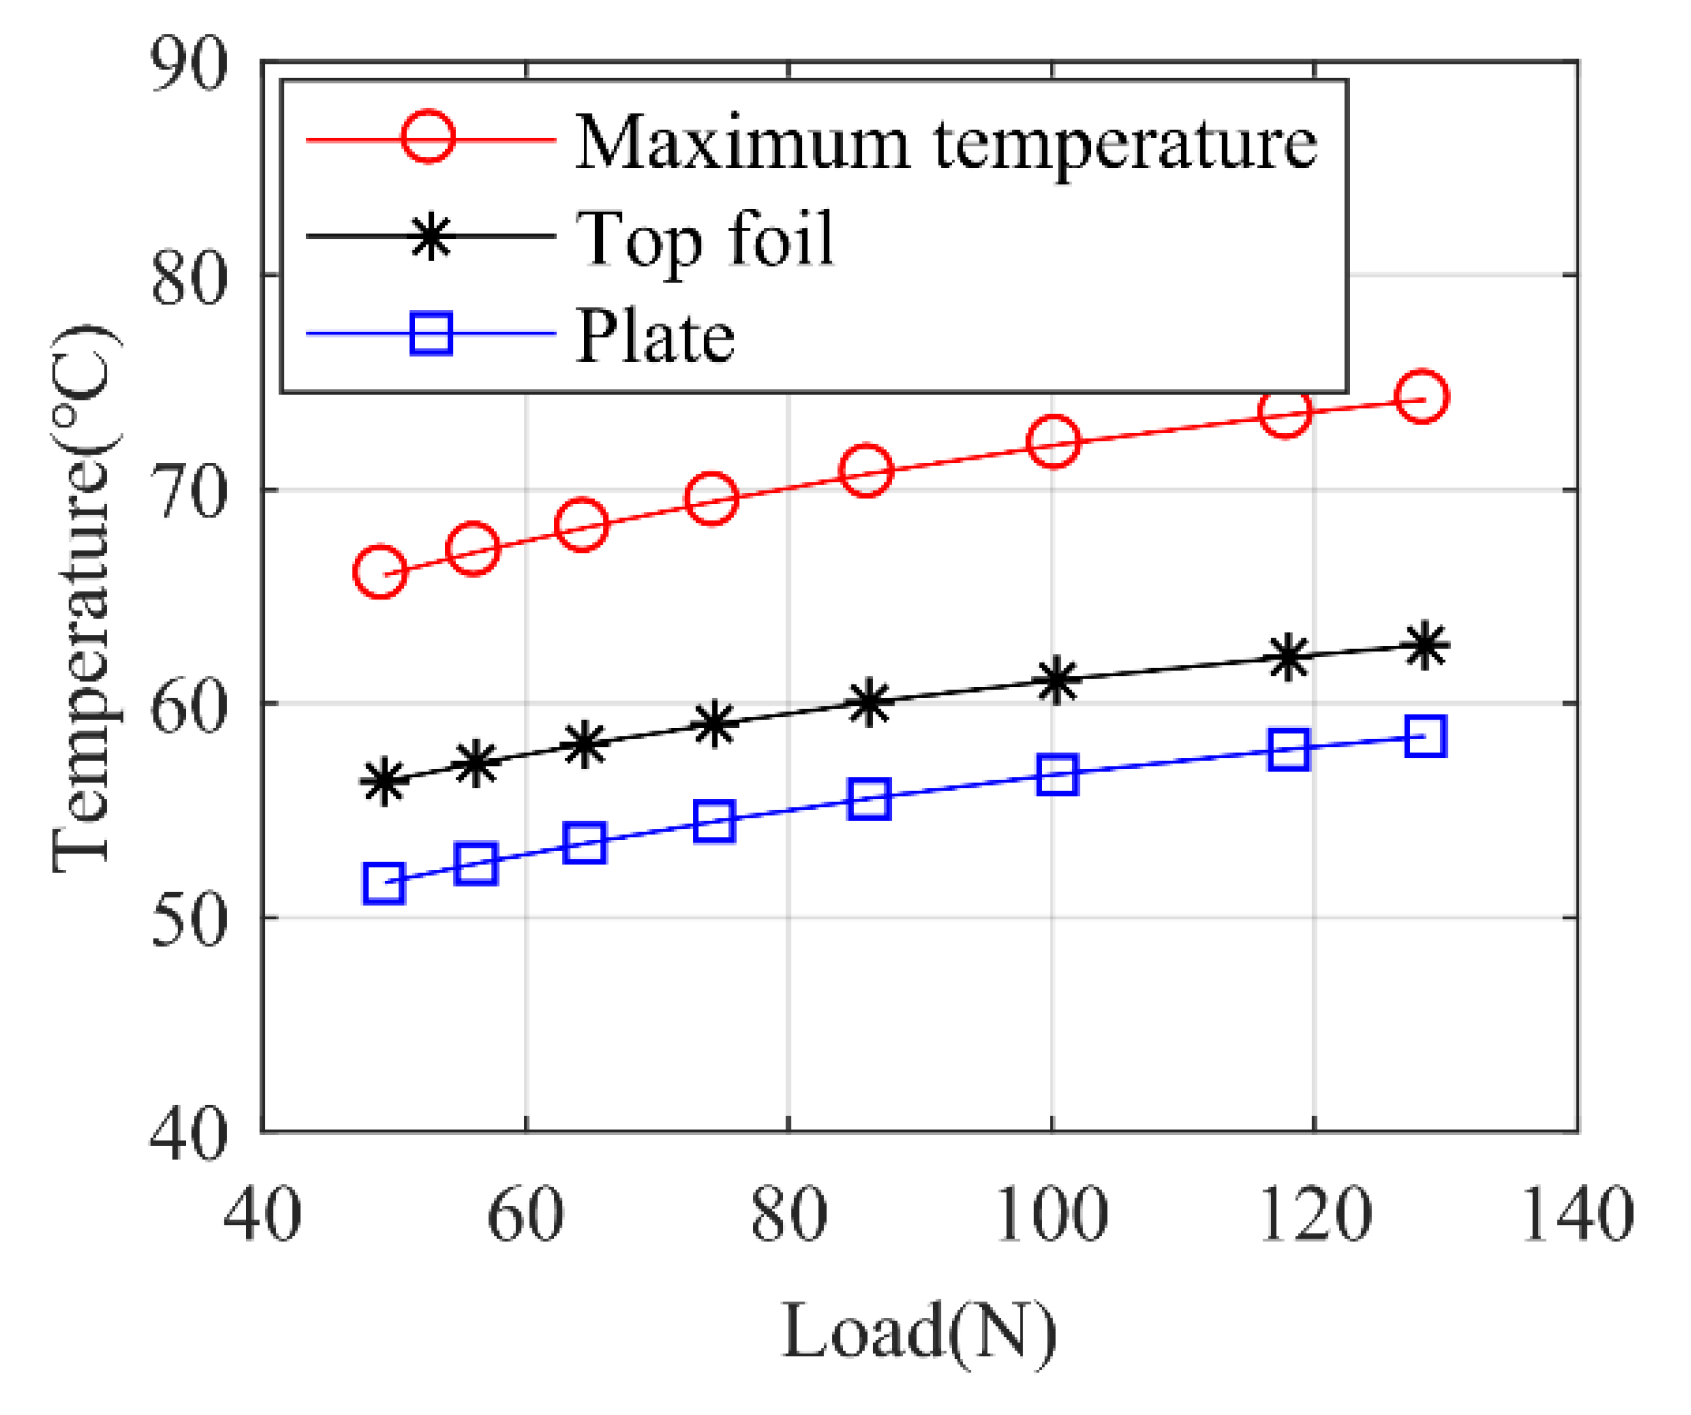
Figure 12 shows the relationship between bearing temperature and the static load at the rotor speed of 50 krpm. The temperatures of top foil and thrust plate are the average values in the simulations. It can be seen from the figure that as the bearing load increases, the gas film temperature increases almost linearly. Additionally, when the bearing load increases, the differences between the maximum air film temperature, the top foil temperature and the thrust plate temperature are almost kept constant. The increase in bearing static load means the gas film is compressed, and the heat generated by the viscous dissipation and the compression in the gas film is larger, resulting in the rise of overall temperature.
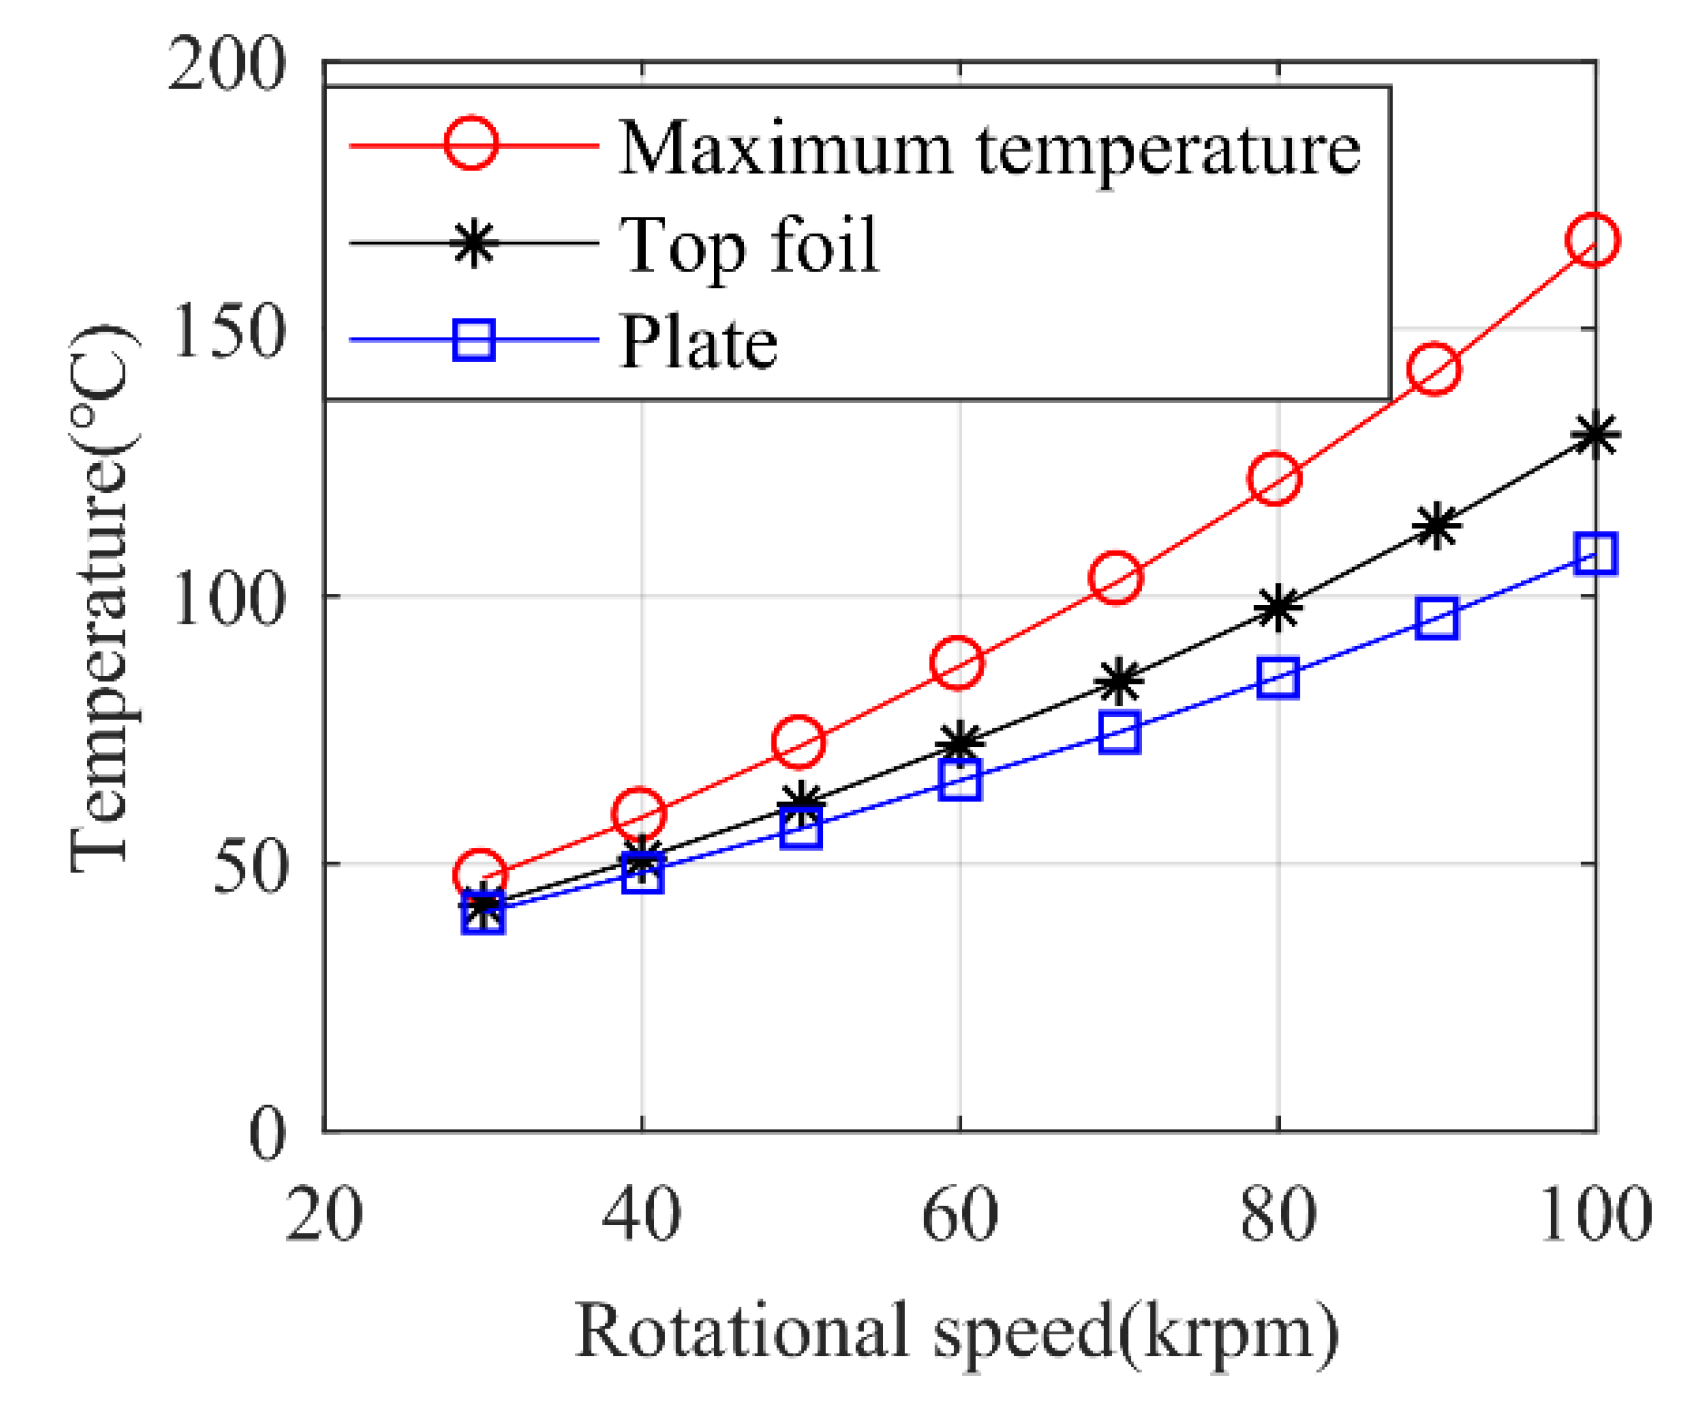
Figure 13 shows the variation of bearing temperature influenced by rotor speed under the bearing static load of 100 N. As the bearing speed increases, the temperatures of gas film, top foil, and thrust plate all increase exponentially. Therefore, rotor speed has a greater influence on the bearing temperature compared with the influence of static load. At low rotor speeds, the difference between the top foil and the thrust plate average temperatures is relatively small, and the maximum temperature of gas film is also relatively small. As the rotational speed increases, the differences between the temperatures of the top foil, thrust plate, and the maximum gas film temperature also increase.
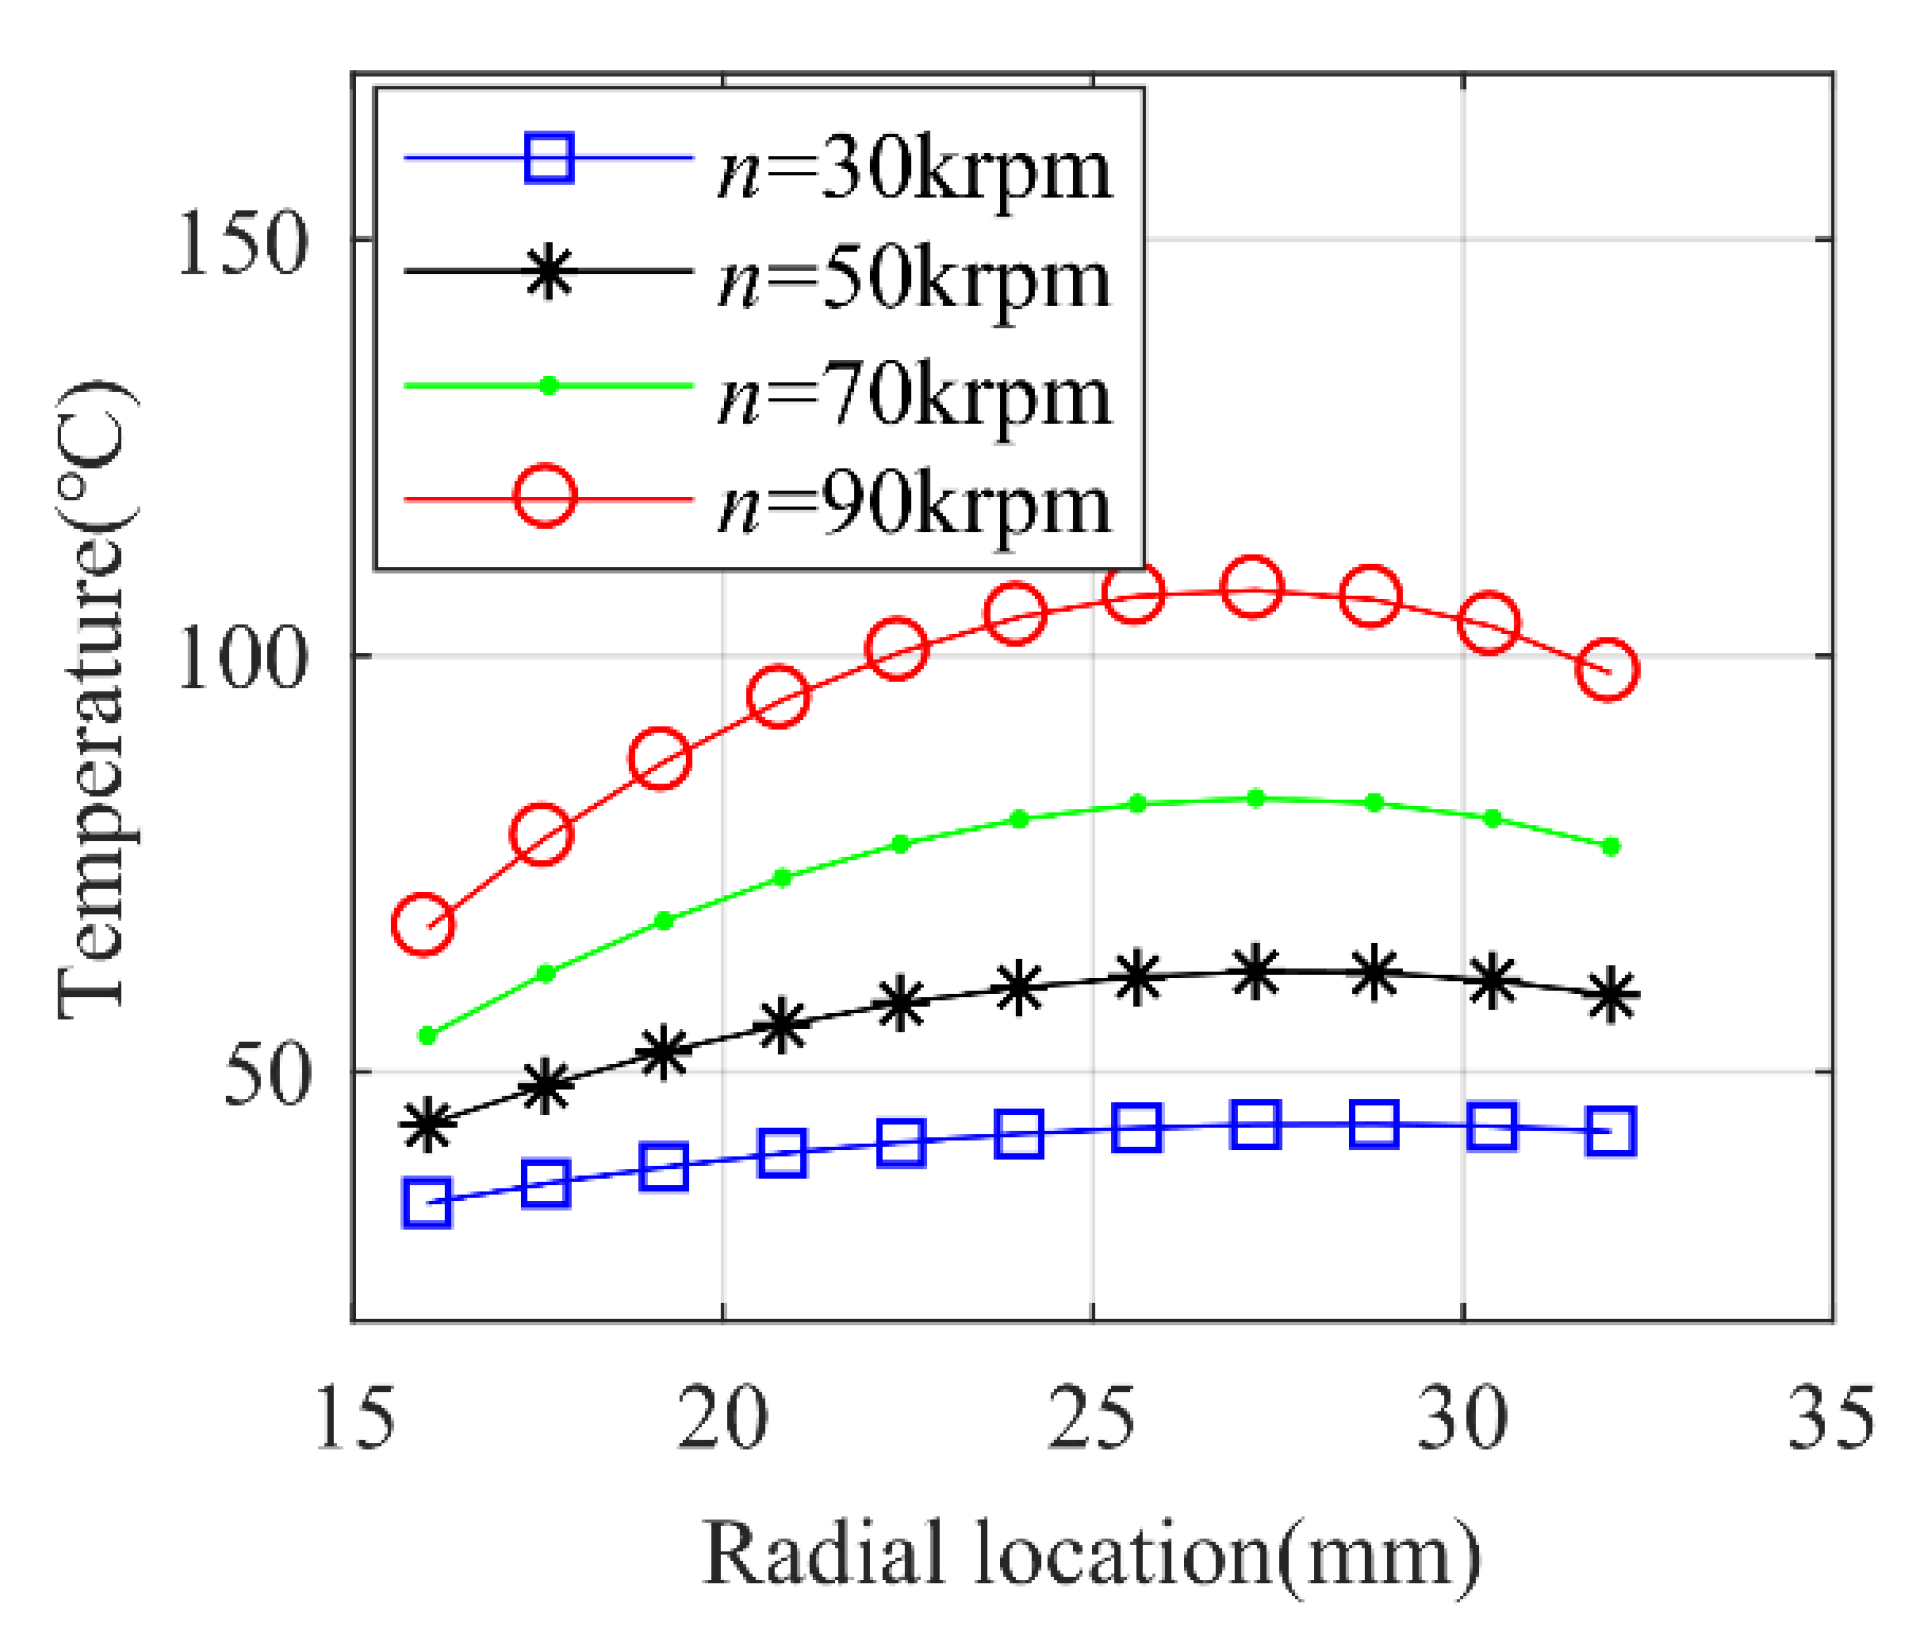
Figure 14 shows the temperature distributions at various radial positions of the thrust plate at different rotor speeds under the same static load of 100 N. It shows that the temperature of the thrust plate first increases and then decreases in the radial direction, and the highest temperature position is closer to the outer radius boundary. With the increase in rotor speed, the distance from this position to the outer radius boundary tends to become larger.
This is because part of the heat is dissipated through forced convection from the cylindrical surface at the thrust plate outer radius, so the gas film temperature will decrease in this area to some extent. As the rotor speed increases, the convective heat exchange effect between the outer edge of the thrust plate and the environment becomes much stronger.
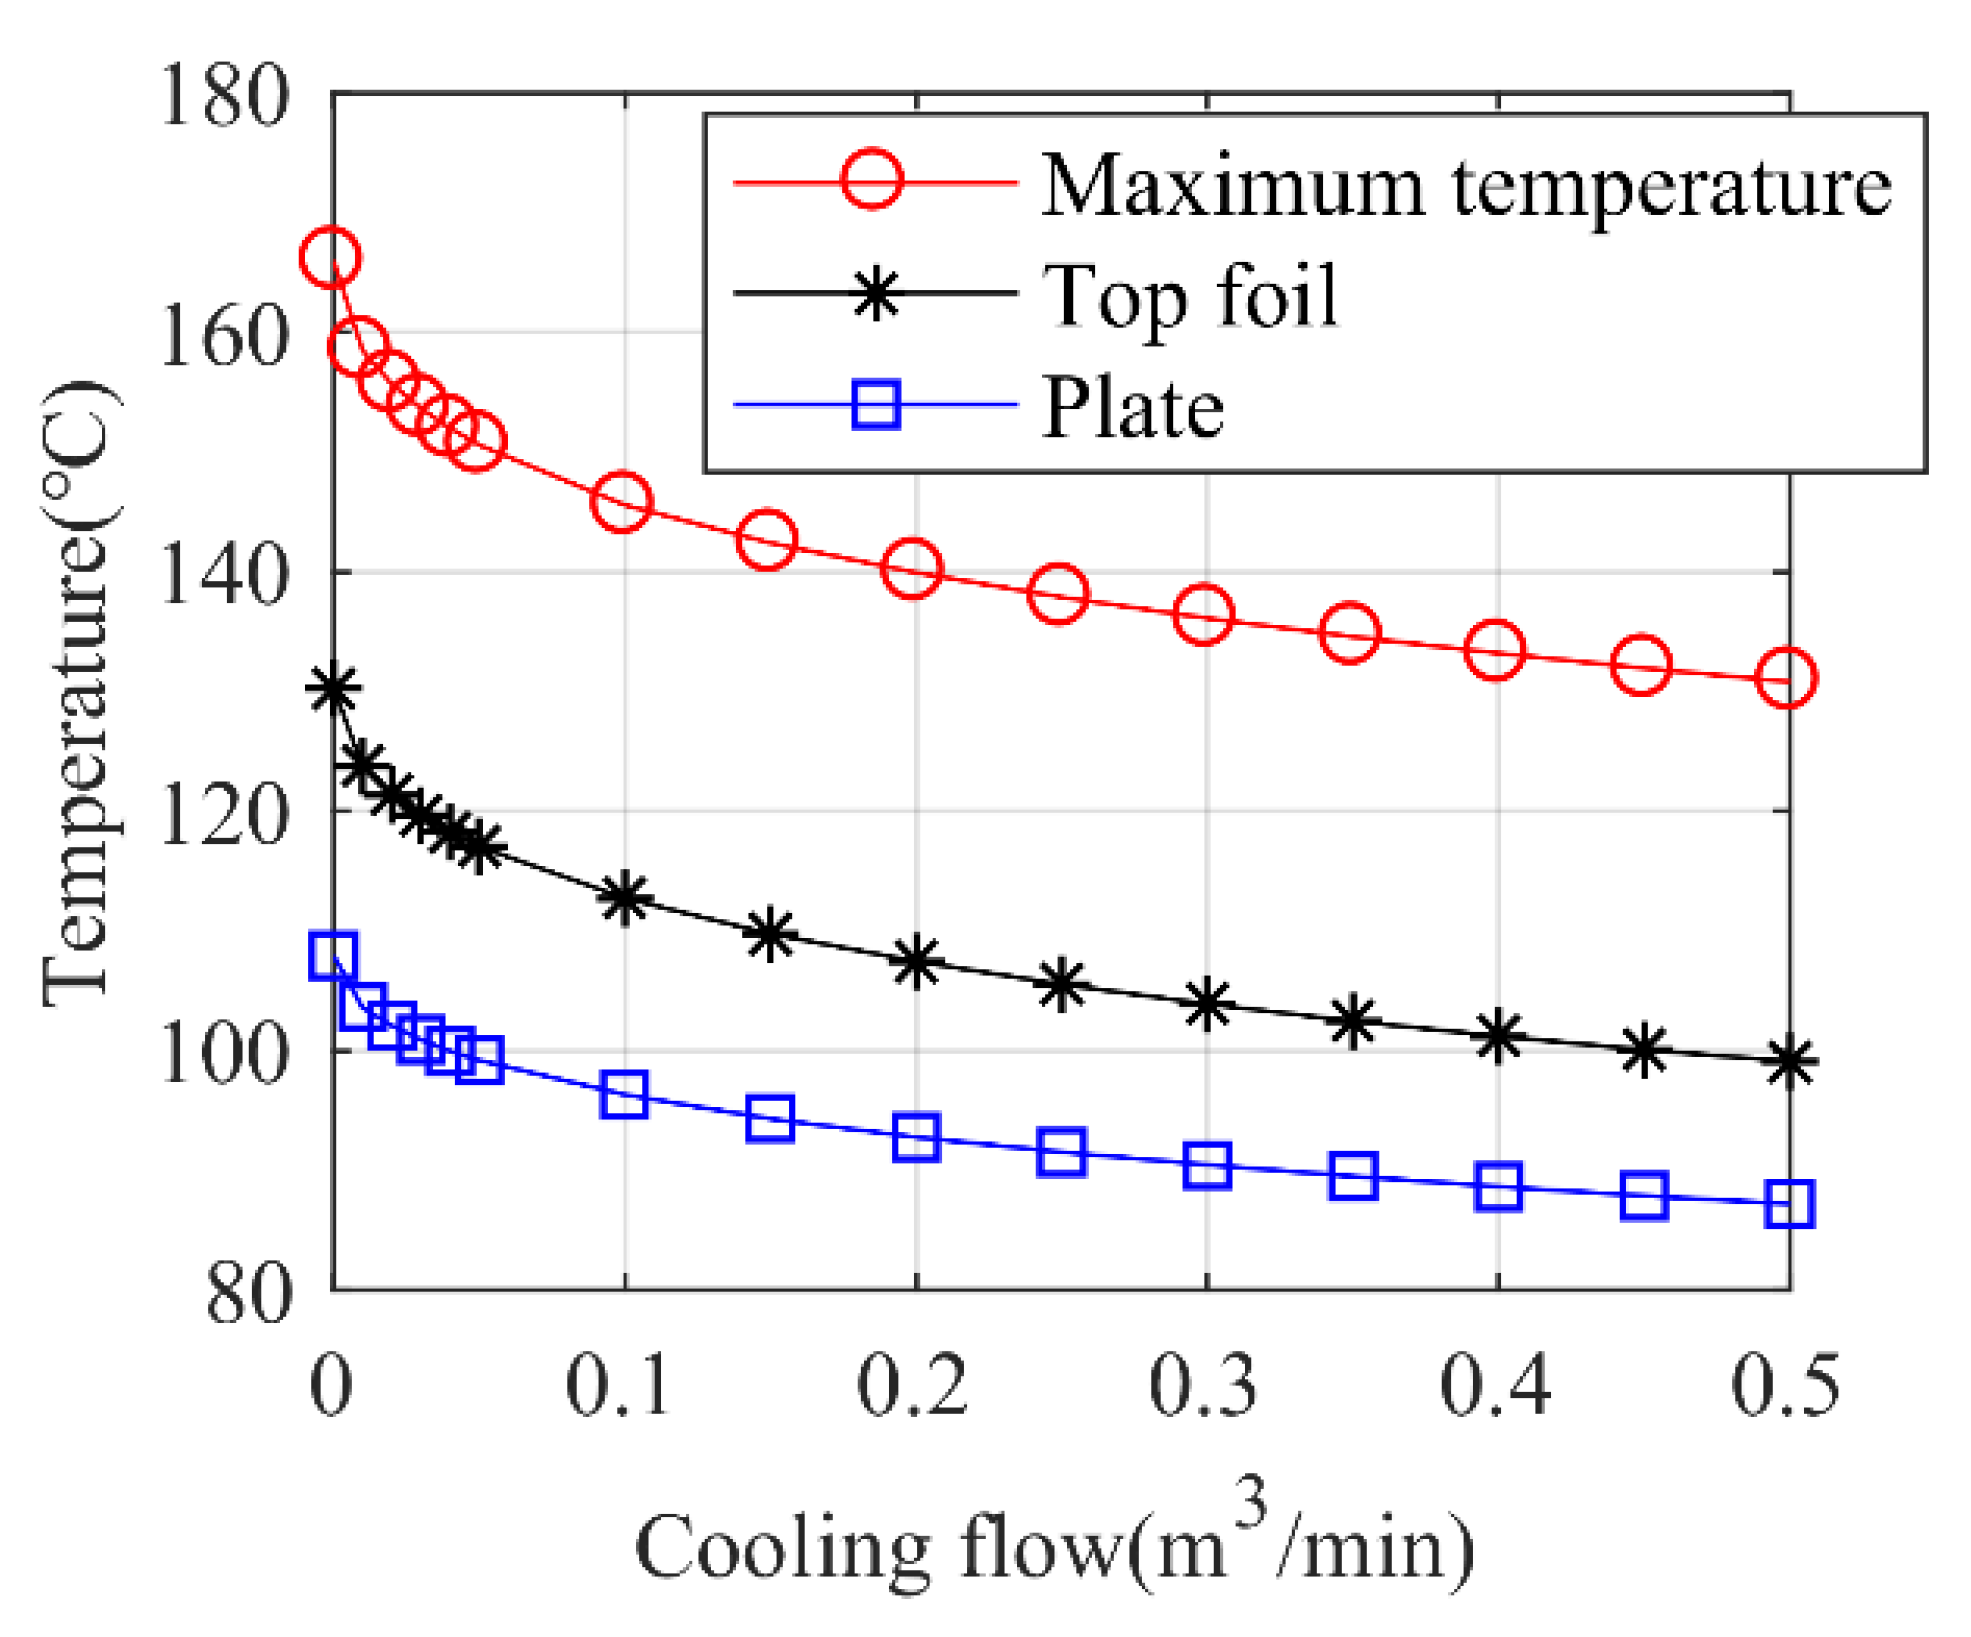
Figure 15 shows the relationship between bearing temperature and the flow rate of cooling gas under the rotor speed of 100 krpm and static load of 100 N. The results show that when the flow rate of cooling gas gradually changes from 0 to 0.2 m3/min, the bearing temperature drops rapidly. If the gas flow rate is further increased, the cooling effect will be weakened gradually. Therefore, in engineering applications, the appropriate flow of cooling gas passed into the foil structure should be designed to decrease the bearing temperature with the maximum efficiency.
4. Experimental Study
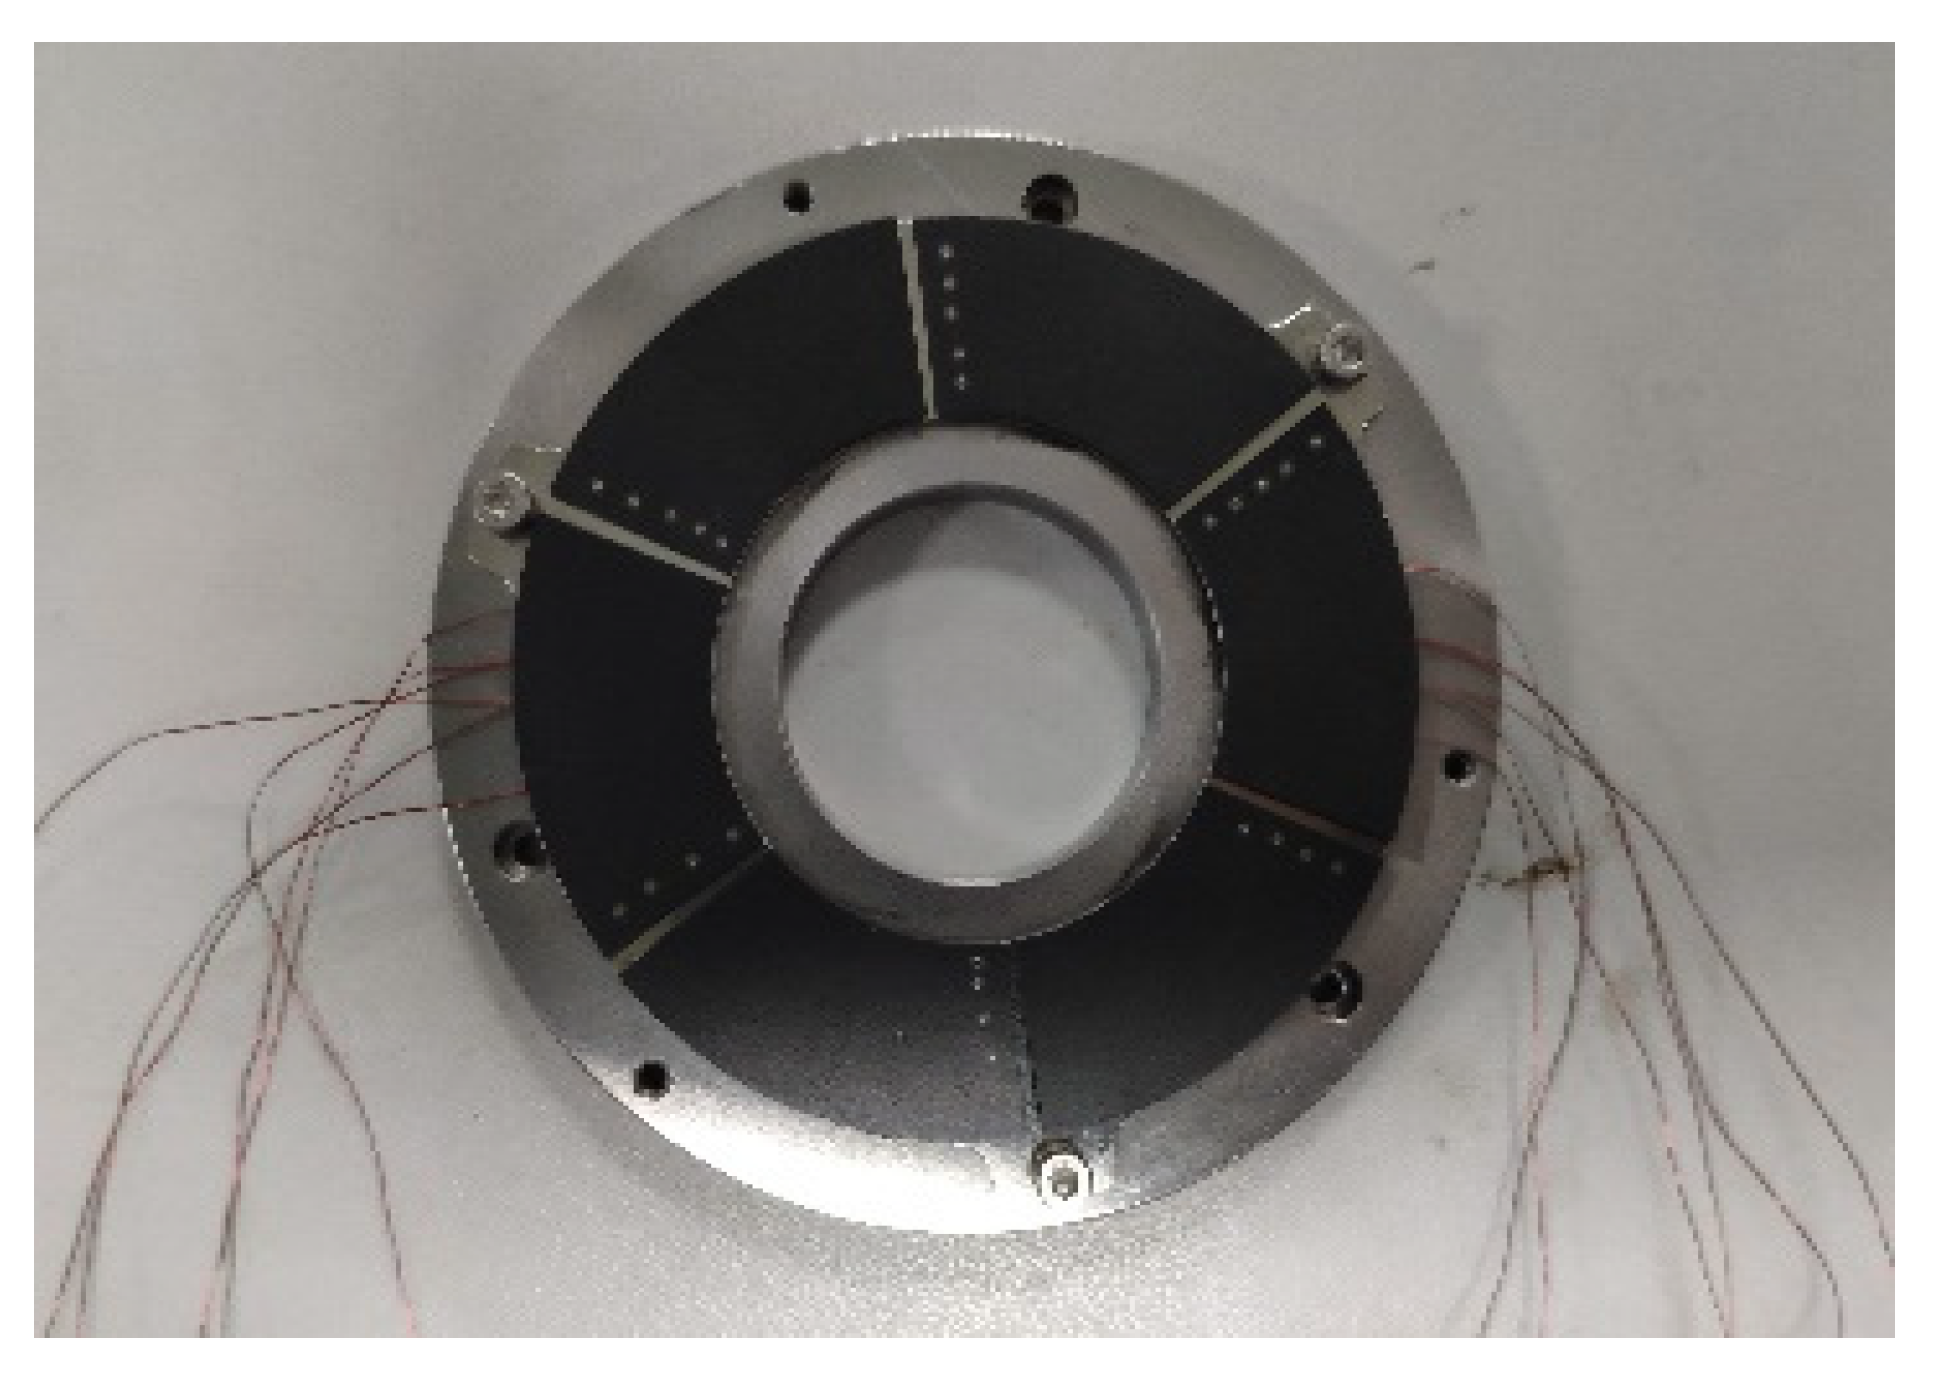
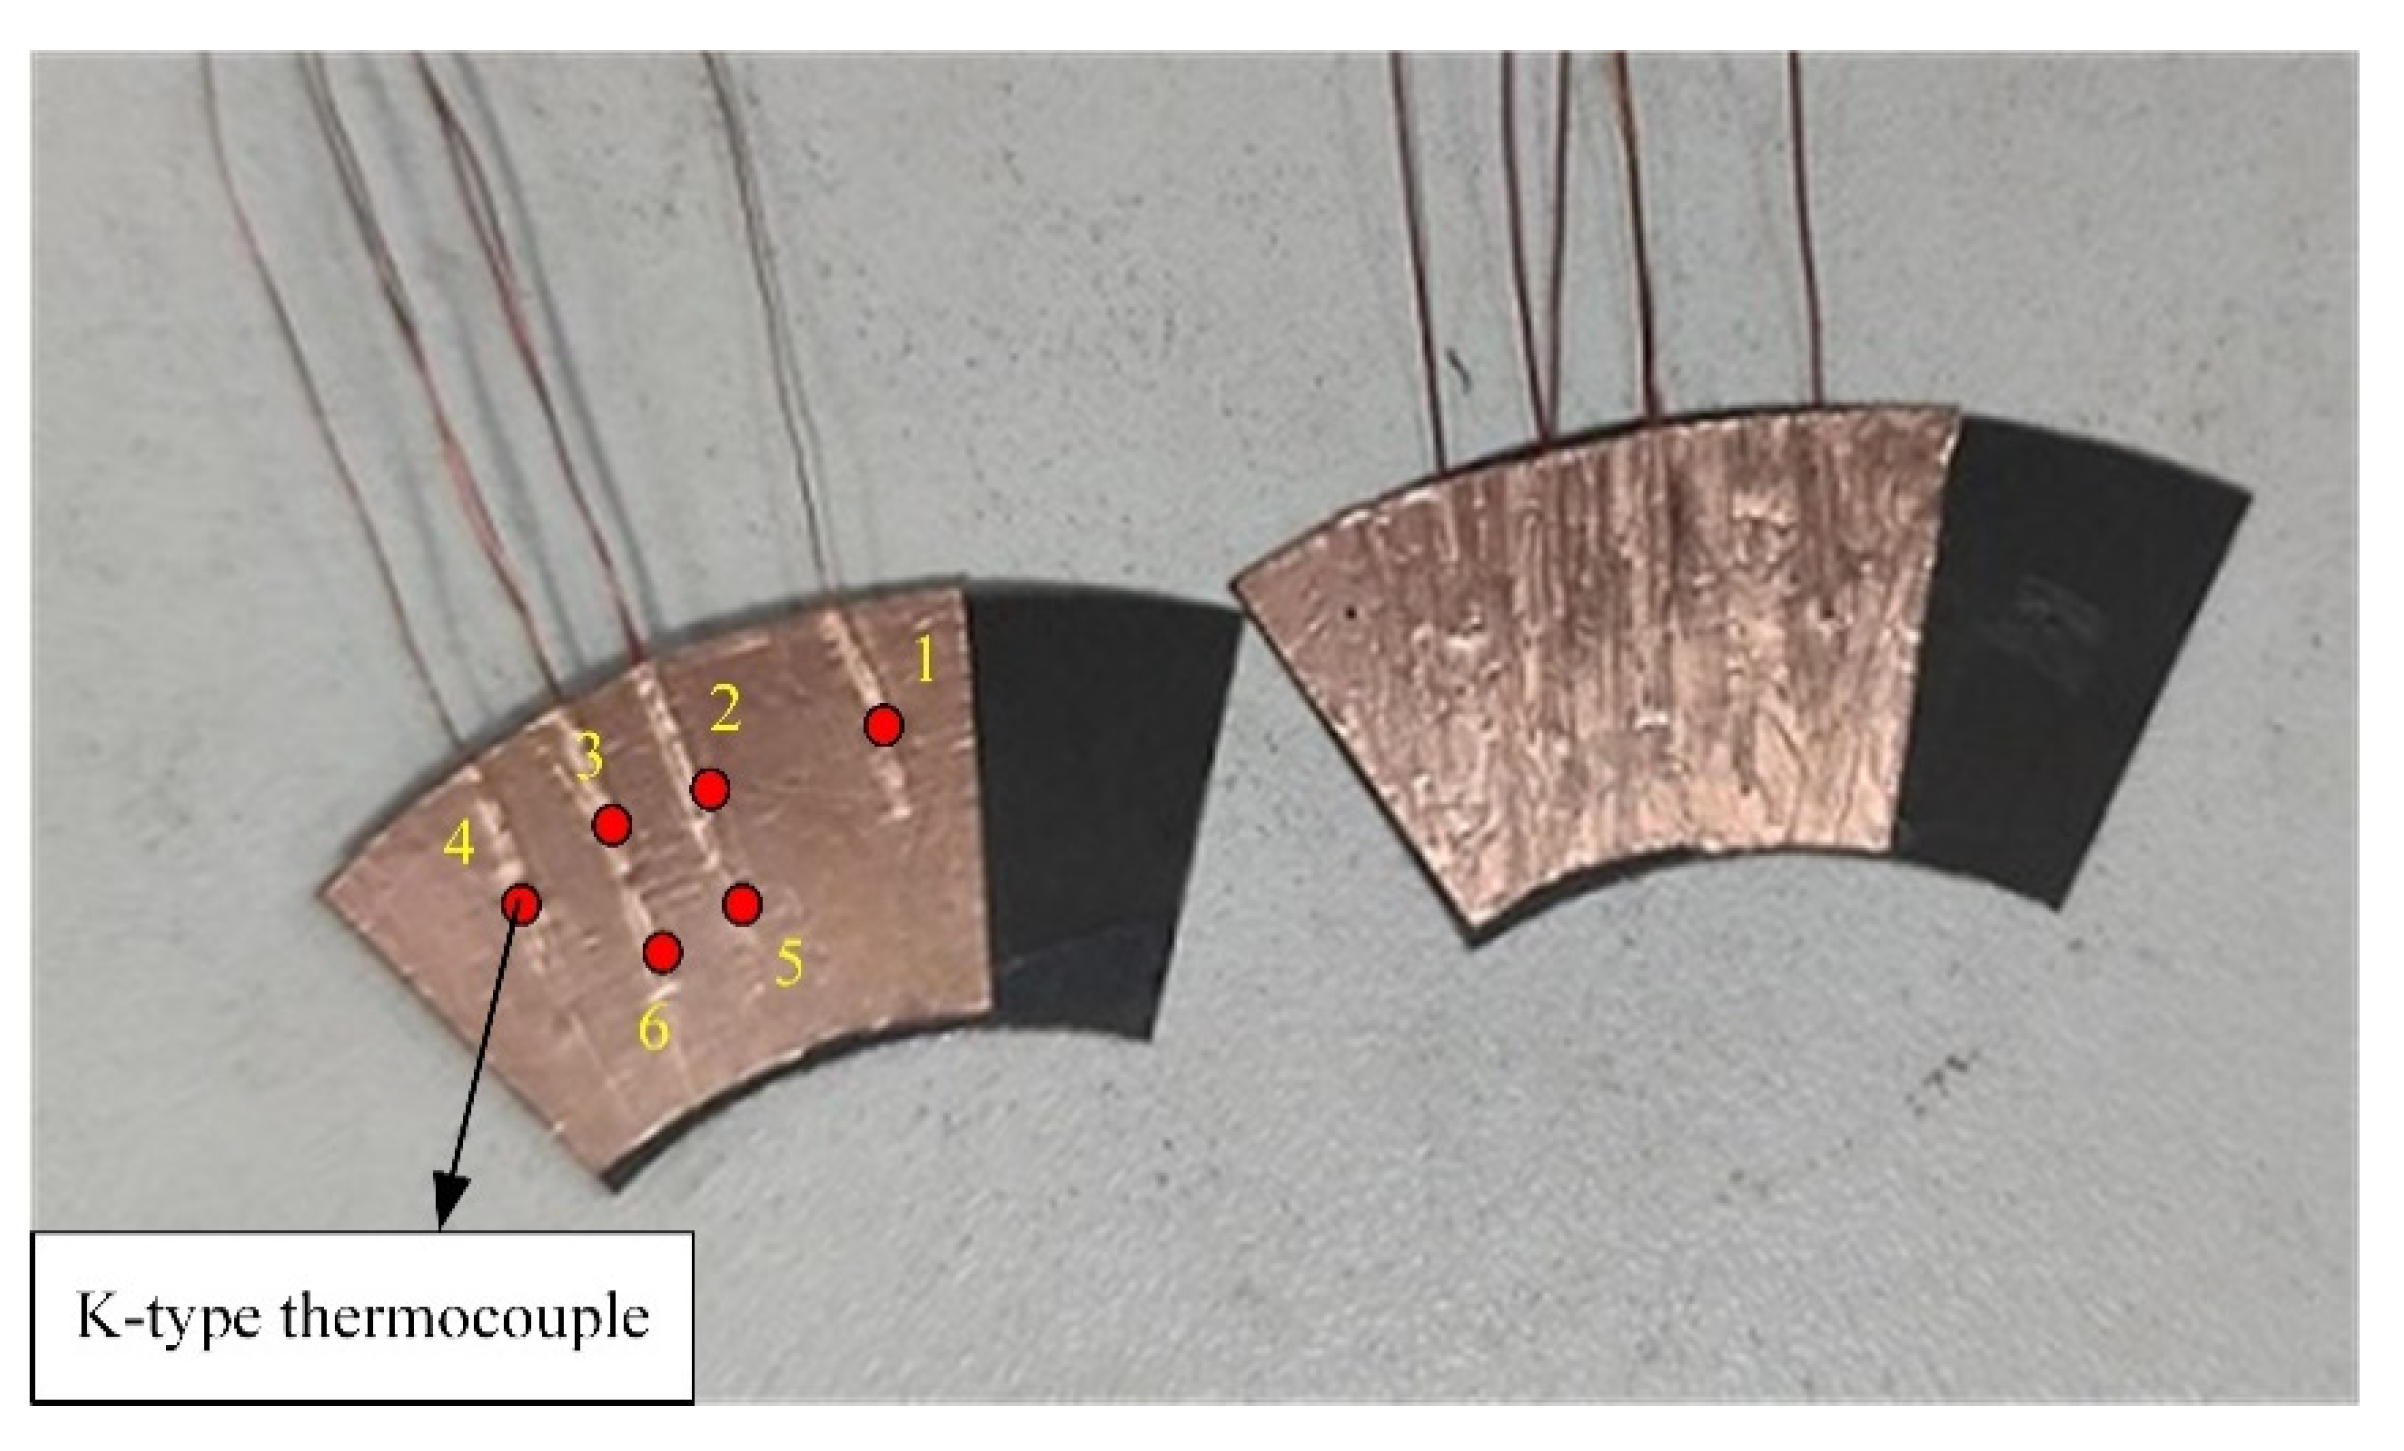
In this paper, the test specimen of the bump foil thrust gas bearing is manufactured and assembled, as shown in Figure 16. The K-type thermocouple is applied to measuring the bearing temperature. A number of thermocouples are stick to the top foil on the back side with copper foil tape. Figure 17 shows the positions of these thermocouples for measuring the local temperature. The thermocouple wire is buried in the bump channel.
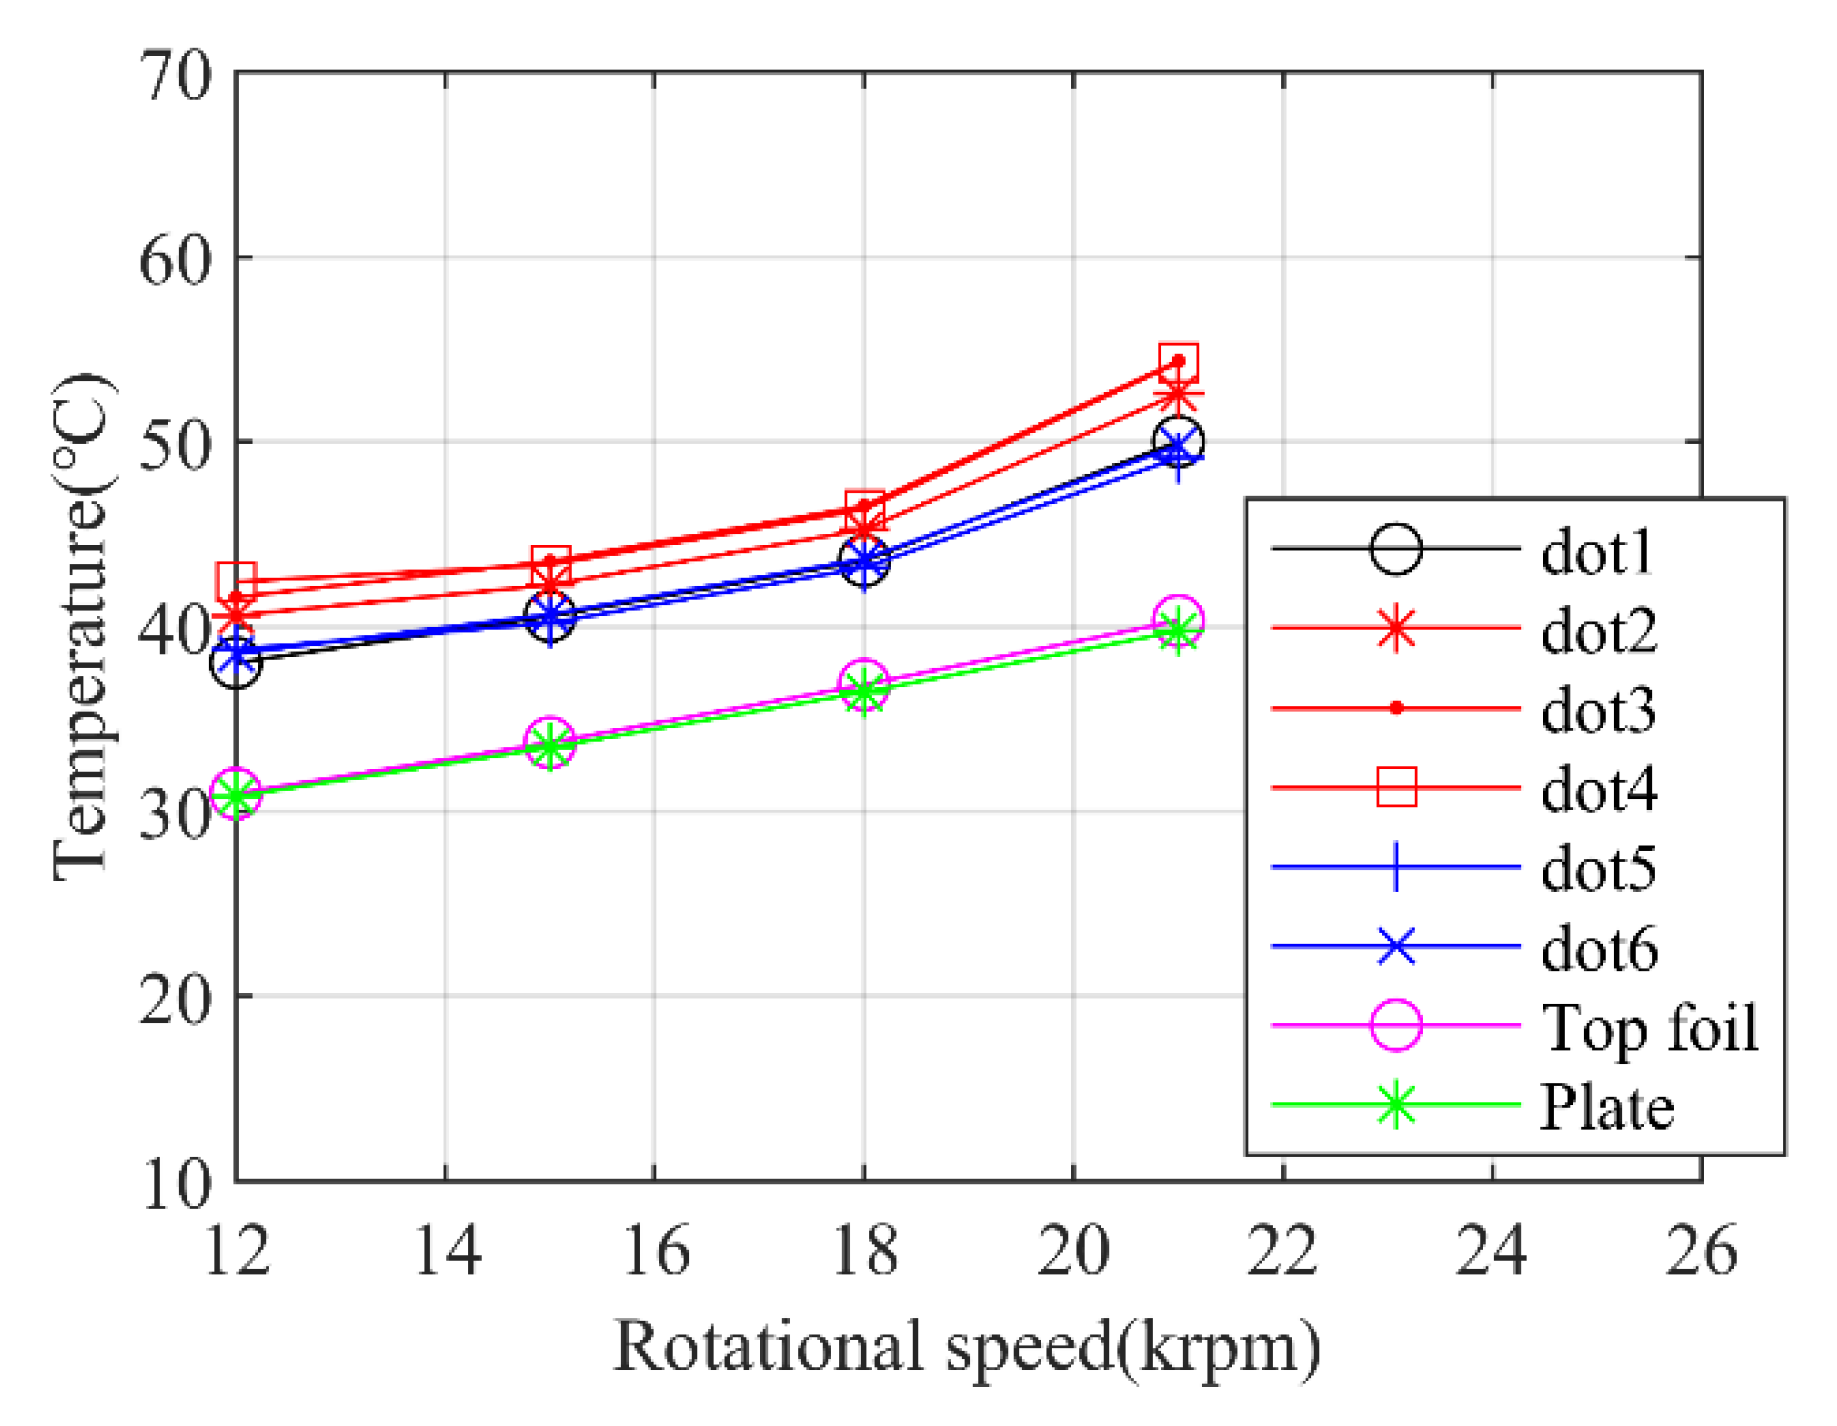
The same number and position of thermocouples are pasted under the two centrosymmetric top foils. The temperature measuring points 1–4 are arranged at the radius of 30 mm, and points 5–6 are arranged at the radius of 25 mm. The temperature measuring point 1 is arranged under the slope section, and the remaining temperature measurement points are in the loading region. The assembly of the bearing is completed by a spot-welding machine.
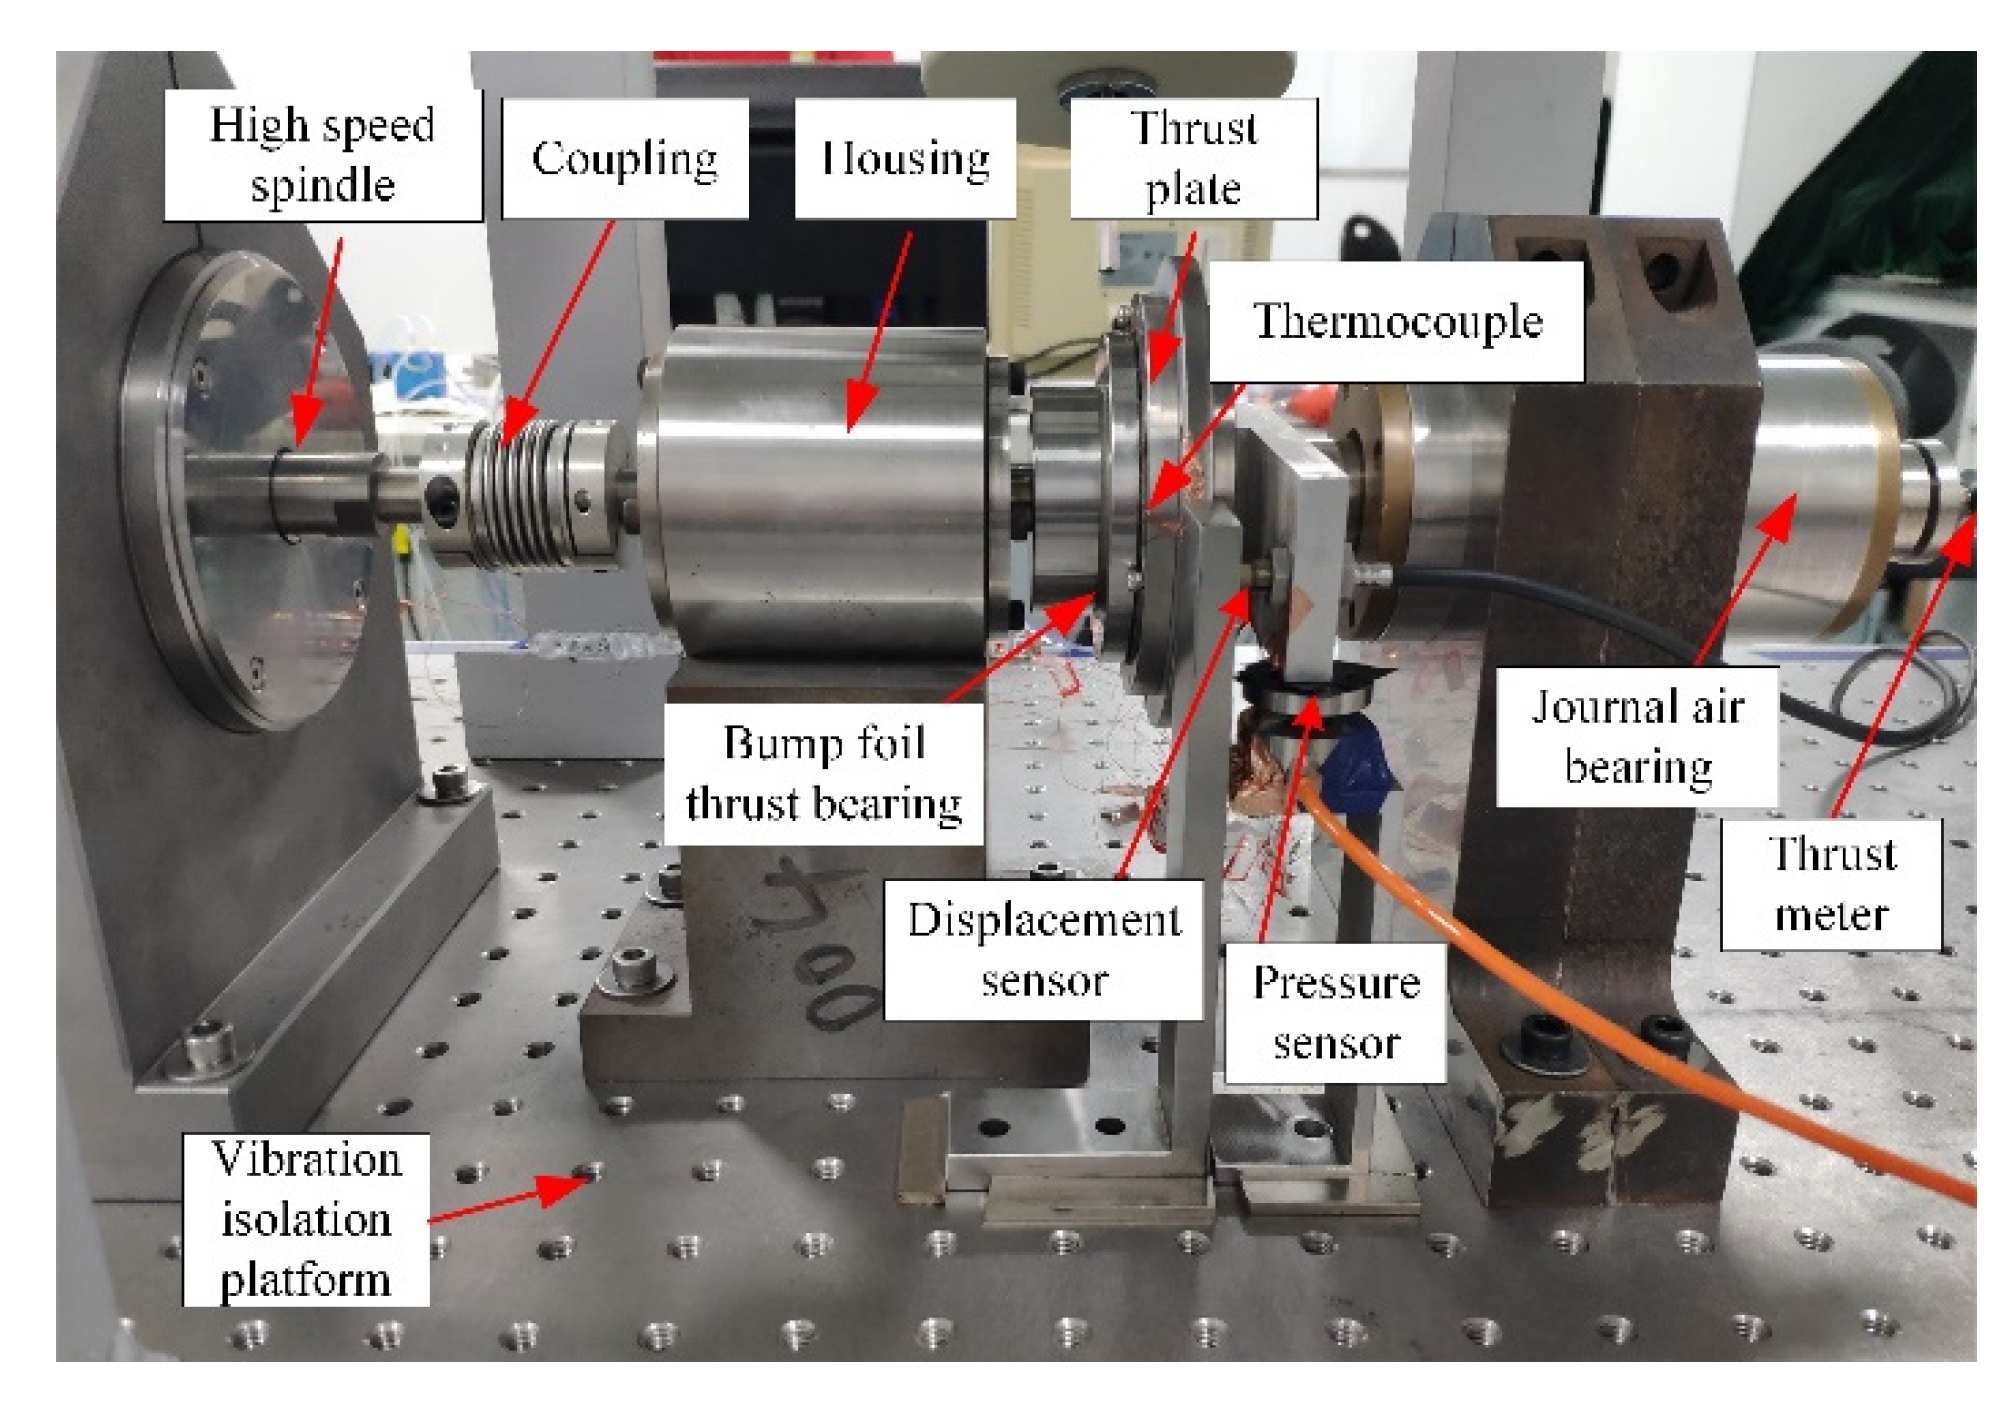
The test bench in this paper is shown in Figure 18. The actual working process of the bearing can be realized by actively controlling the speed of the motorized spindle and by loading the thrustmeter on the other side of the thrust bearing. The displacement between the rotating plate and the bearing is measured by the eddy current displacement sensor.
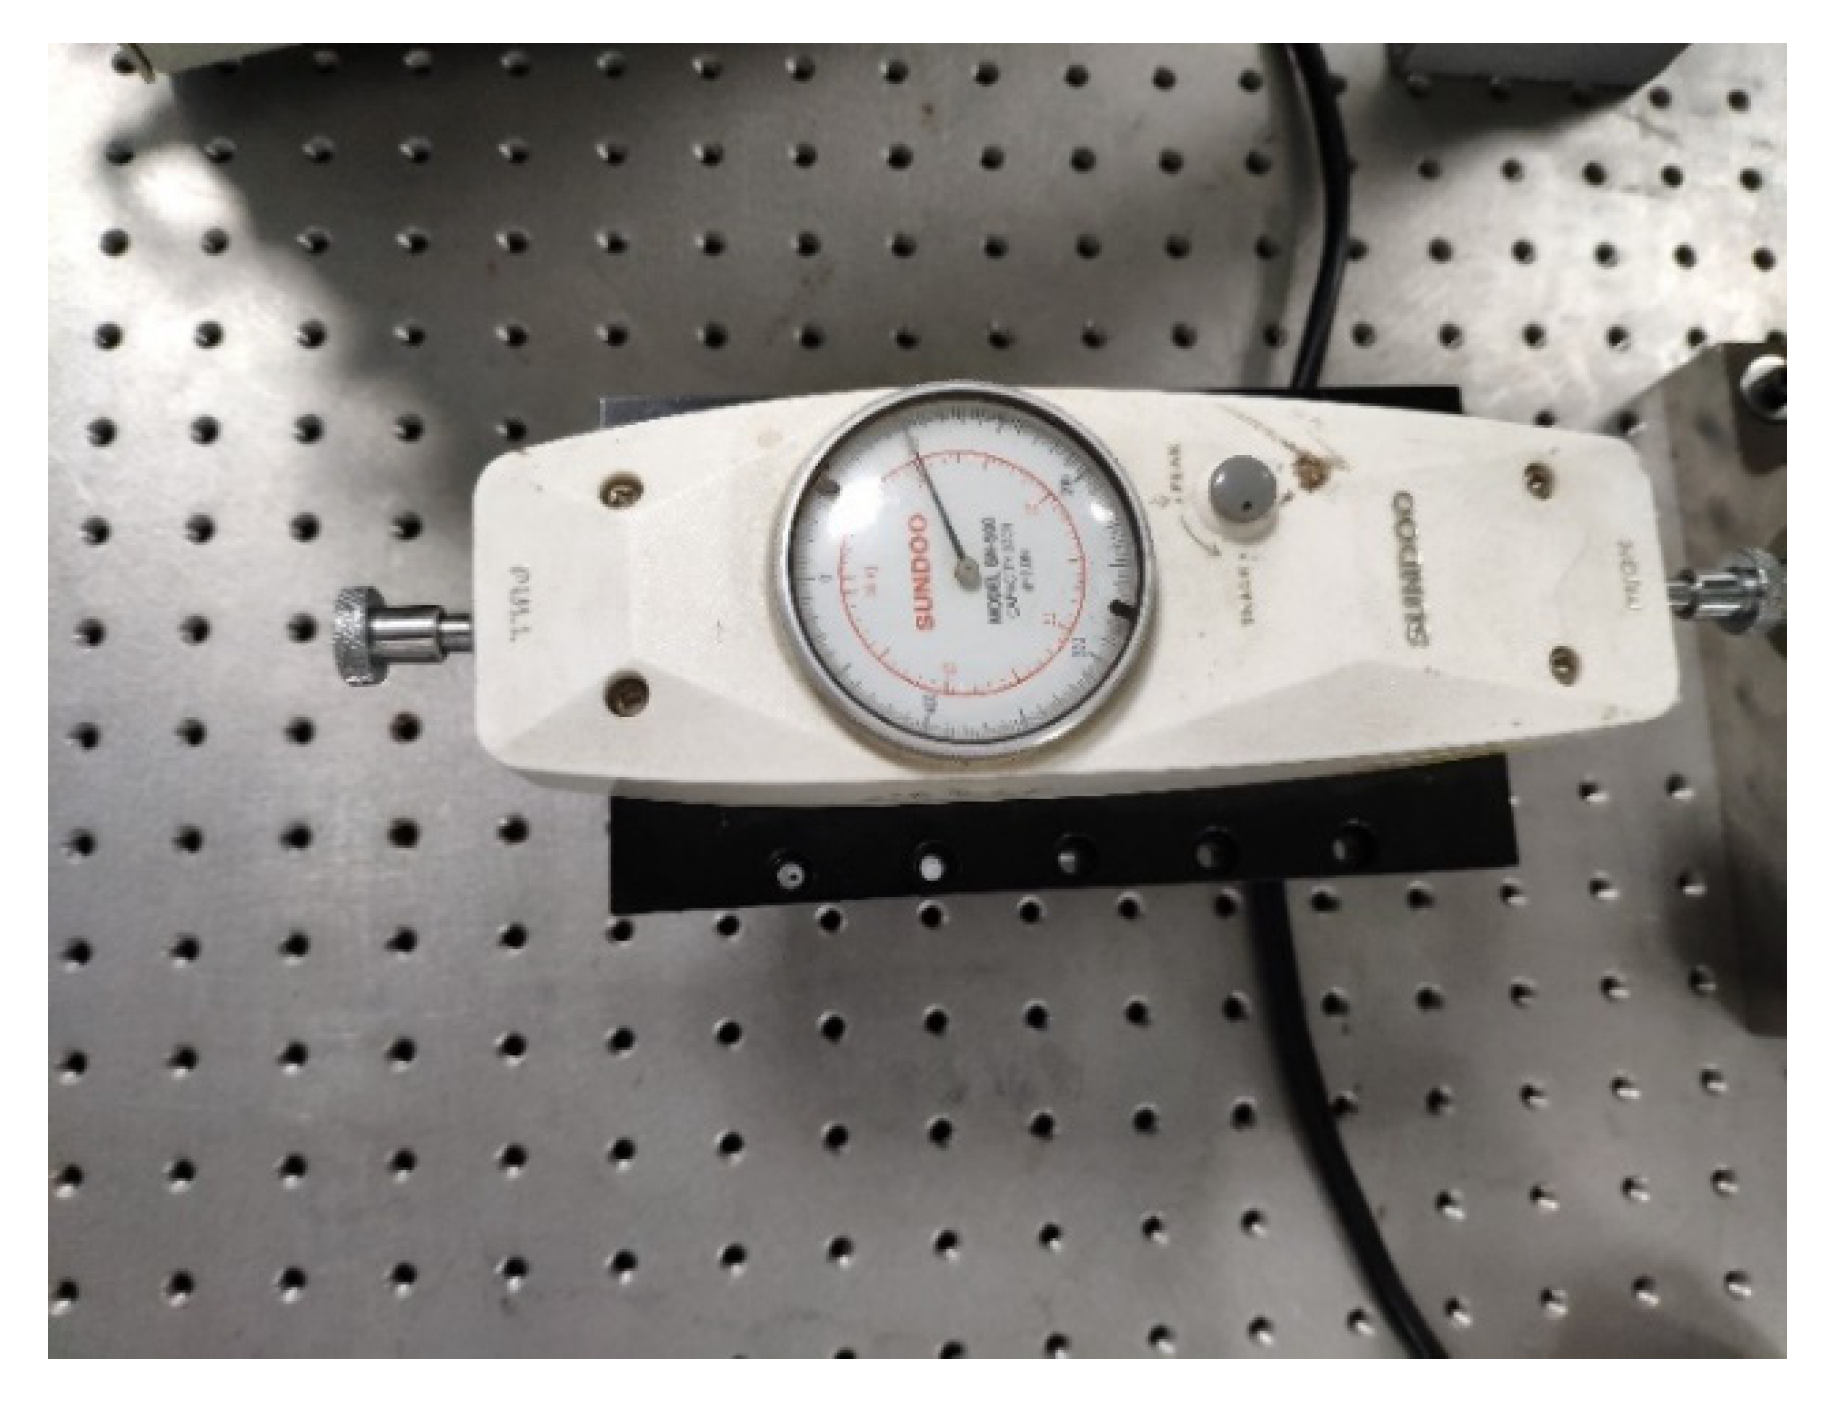
In this experiment, the axial load, which is provided by the SN-500 pointer thruster produced by SUDOO company, is applied on the side of the thrust bearing to simulate the actual axial force of the system. The structure of pointer thruster is shown in Figure 19, where the limit load is 500 N and the resolution is 2 N, the pointer thruster is fixed to the antivibration platform through the supports, and the axial force to the bearing is applied by rotating the button.
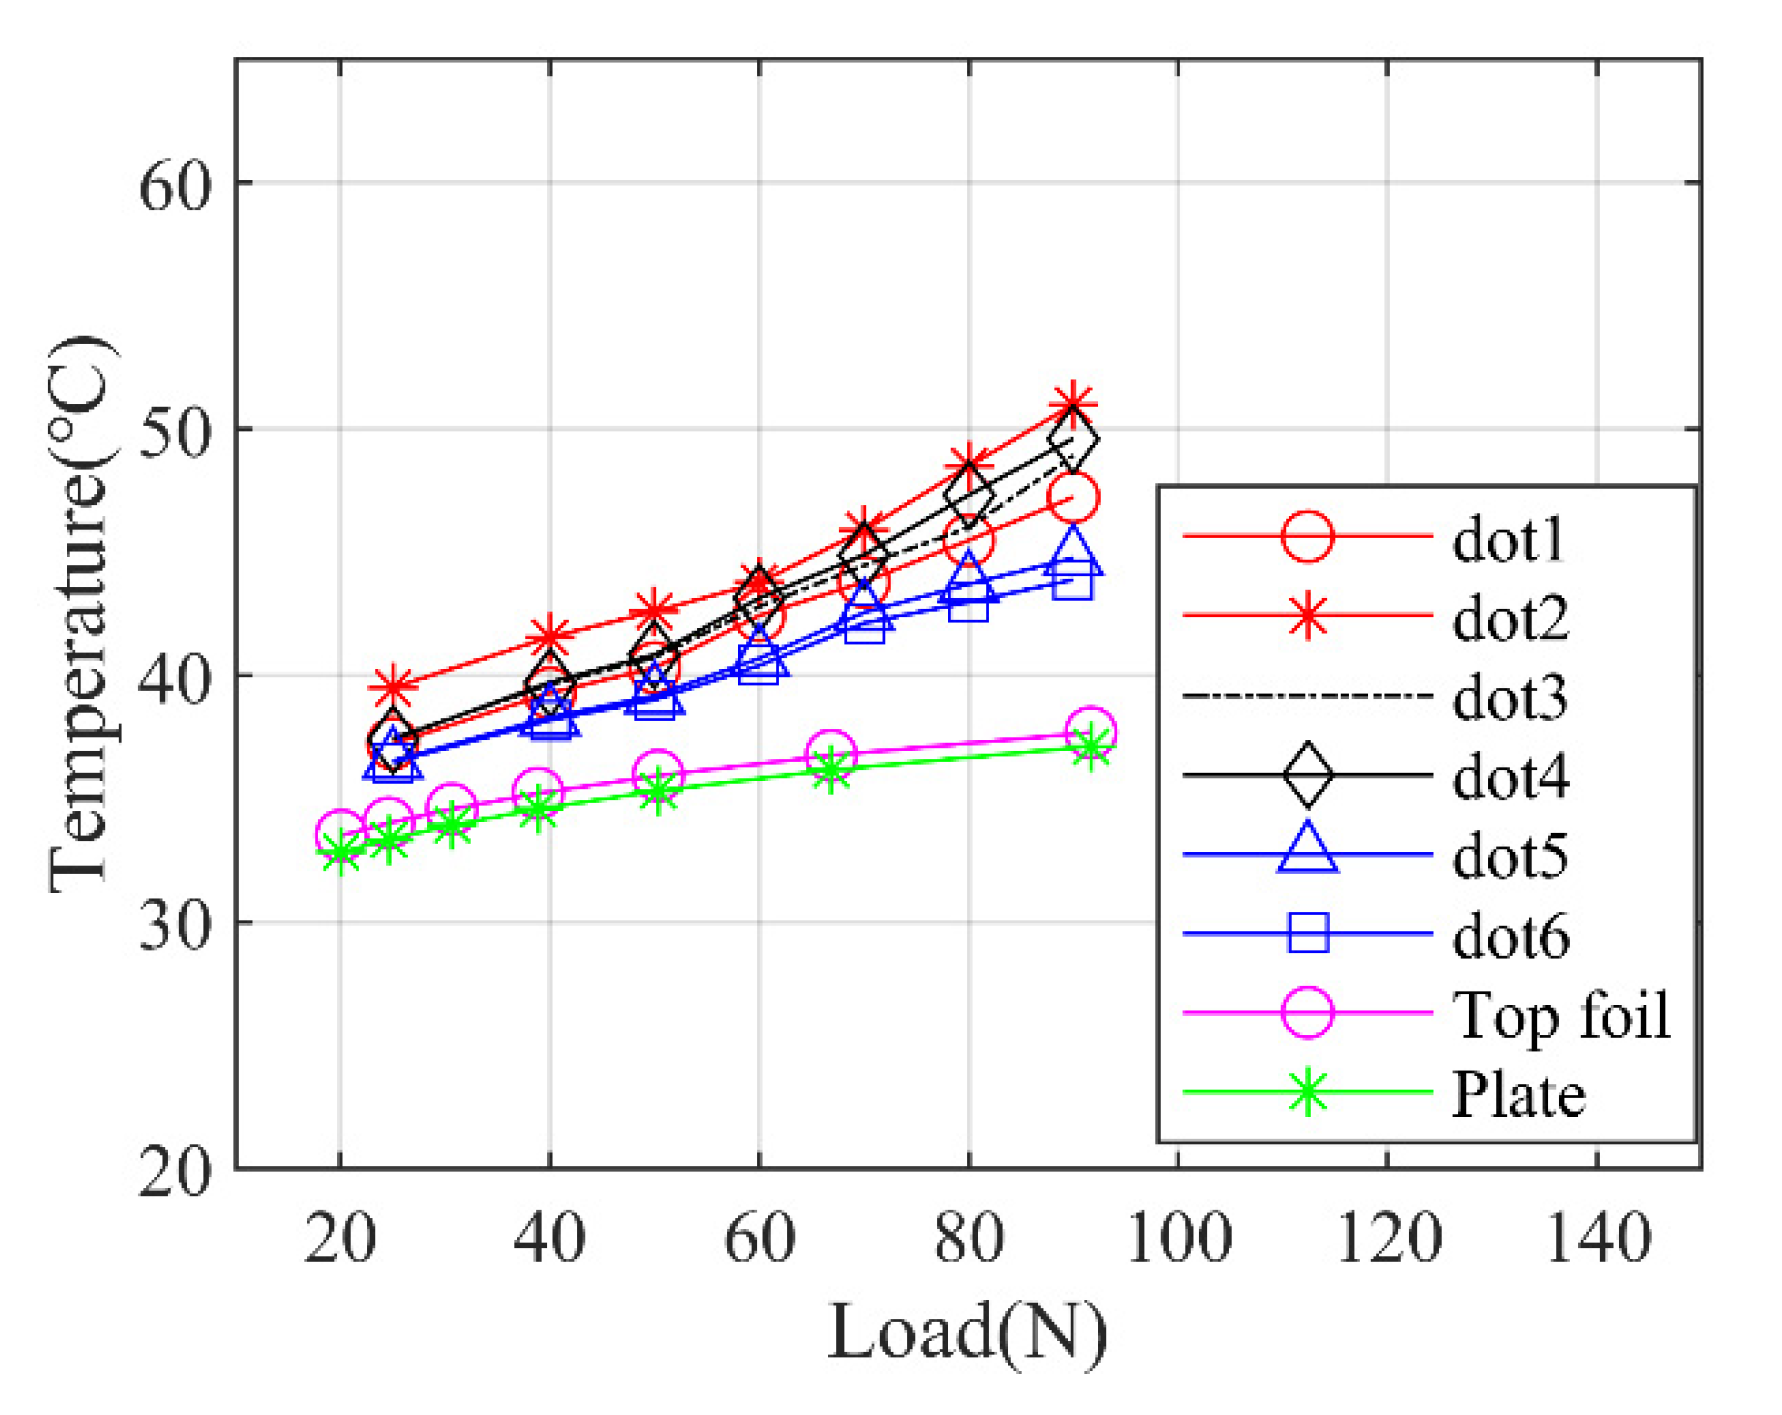
Figure 20 shows the relationship between the tested top foil temperature and the bearing static load at the rotor speed of 15 krpm. During the loading process, the bearing temperature increases continuously. It can be seen from the figure that the measured temperatures on points 2, 3, and 4 are significantly higher than the temperatures on points 5 and 6, and the temperature on point 1 in the slope section is lower compared with the temperatures measured on the points of the same radius. These distribution characteristics of the foil thrust bearing temperature are consistent with the simulation results. Compared with the simulation results, the measured top foil temperatures are relatively lower, which is mainly due to the unclear boundary conditions in the experiments which should be clarified in the simulations.
Figure 21 shows the relationship between the measured top foil temperature and rotor speed under the static load of 80 N. It shows that the temperature distribution regularities of the measuring points are similar with the regularities demonstrated in Figure 20, and the overall trend of the measured temperature is the same with the simulation results, which is the temperature will rise up almost linearly with the rotational speed going up. However, the experimental data are relatively higher than the simulation data, which is probably caused by the unclear boundary conditions in the experiments which should be clarified in the simulations or due to the measurement error during the experiment.
5. Conclusions
In order to study the thermal characteristics of the aerodynamic bump foil thrust bearing, the air-thermoelastic coupling model is developed in this paper with the heat transfer models of the bearing and thrust plate, and the thermal expansion effect of the bearing structure being considered. The temperature field of the gas thrust bearing is solved through the multi-field coupling algorithm. Finally, the experiments of bearing temperature measurement are carried out under different working conditions. Based on the simulation results, the following conclusions are obtained:
- (1)
- The simulation results show that the surface temperature of the top foil experiences firstly increasing along the rotor rotating direction and then maintaining at a certain value. In the entrance area, the temperature is relatively low, and it will rise sharply after mixing with the recirculation hot air. The top foil temperature in the plane section is almost the same, which is obviously higher than that in the inclined region. In the radial direction, the temperature increases first and then decreases slightly as the radius increases;
- (2)
- The value of bearing load capacity calculated by the THD model is higher than the value calculated by the isothermal model, and the differences of them will become more and more apparent as the rotational speed increased and the initial gas film thickness decreased. Compared to the bearing load capacity, the rotational speed has more effect on the temperature. There is little influence on the friction loss power calculated by different models. Injecting the cooling gas flow under the top foil can reduce the bearing temperature, and its efficiency will decrease with the increase in cooling gas flow. For example, under the situation of and the rotor speed of 100 krpm and static load of 100 N with bearing structure parameters used in this paper, when the gas cooling flow rate of increased up to 0.2 m3/min, the cooling effect reach to the maximum;
- (3)
- The variation trends of test bearing temperatures with respect to bearing load and rotor speed are similar with those of simulation results, which verified the reasonability of the THD model to some extent. However, the experimental results are relatively higher than the simulation, which is probably caused by the unclear boundary conditions in the experiments which should be clarified in the simulations or due to the measurement error during the experiment.
The current simulation ignored some factors, which makes the simulation results are not exactly the same with the experiment results. The further research will consider more accurate structure model and thermal model, including the surface roughness of the foils and the friction between them, and more complex heat transfer models, etc.
Author Contributions
Conceptualization, J.D. and X.L.; methodology, X.L.; software, X.L.; validation, X.L., C.L., J.D. and G.N.; formal analysis, J.D.; investigation, G.N.; resources, J.D.; data curation, J.D.; writ-ing—original draft preparation, X.L.; writing—review and editing, X.L.; visualization, C.L.; supervision, C.L.; project administration, J.D.; funding acquisition, C.L. and J.D. All authors have read and agreed to the published version of the manuscript.
Funding
The work described in this paper was supported by National Key R&D Program of China (Grant No. 2018YFB2000100) and the National Natural Science Foundation of China (Grant No. 52005126).
Institutional Review Board Statement
Not applicable.
Informed Consent Statement
Not applicable.
Data Availability Statement
The data presented in this study are available on reasonable request from the corresponding author.
Conflicts of Interest
The authors declare no conflict of interest.
Nomenclature
| Radial, azimuthal, and axial velocity component of the gas flow | |
| Angular velocity of thrust plate | |
| b | Pitch ratio (Ratio of slope section angle to plane section angle) |
| h | Real gap height in the lubricating gas film |
| h2 | Prescribed minimal gap height in the lubricating gas film |
| δh | Slope height of the top foil |
| p | Pressure of the lubricating gas film |
| pa | Reference pressure at boundaries |
| n | The rotational speed of thrust plate |
| N | Number of pads in the foil thrust bearing |
| T | Temperature of the lubricating gas film |
| T0 | Temperature of the enviroment |
| T1 | Temperature of air film on the top foil side |
| r1 | Inner radius of the thrust plate |
| r2 | Outer radius of the thrust plate |
| td | Thickness of top foil |
| tb | Thickness of bump foil |
| tk | Thickness of housing |
| tz | Thickness of thrust plate |
| THD | Thermohydrodynamic |
References
- Heshmat, H.; Walowit, J.A.; Pinkus, O. Analysis of Gas-Lubricated Foil Journal Bearings. J. Lubr. Technol. 1983, 105, 647–655. [Google Scholar] [CrossRef]
- Gad, A.M.; Kaneko, S. Performance characteristics of gas-lubricated bump-type foil thrust bearing. Proc. Inst. Mech. Eng. Part J J. Eng. Tribol. 2014, 229, 746–762. [Google Scholar] [CrossRef]
- Dellacorte, C. Gas Bearing Applications; Springer: Boston, MA, USA, 2013; pp. 1429–1433. [Google Scholar]
- Liu, Z.; Xu, H. Application and Research Progress of Bump-type Foil Aerodynamic Journal Bearings. Bearings 2008, 1, 39–43. [Google Scholar]
- Salehi, M.; Swanson, E.; Heshmat, H. Thermal Features of Compliant Foil Bearings—Theory and Experiments. J. Tribol. 2001, 123, 566–571. [Google Scholar] [CrossRef]
- Lee, D.; Kim, D. Three-Dimensional Thermohydrodynamic Analyses of Rayleigh Step Air Foil Thrust Bearing with Radially Arranged Bump Foils. Tribol. Trans. 2011, 54, 432–448. [Google Scholar] [CrossRef]
- Dickman, J.R. An Investigation of Gas Foil Thrust Bearing Performance and its Influencing Factors. Master’s Thesis, Case Western Reserve University, Cleveland, OH, USA, 2010. [Google Scholar]
- Gad, A.M.; Kaneko, S. Fluid Flow and Thermal Features of Gas Foil Thrust Bearings at Moderate Operating Temperatures. In Proceedings of the 9th IFToMM International Conference on Rotor Dynamics; Springer International Publishing: Cham, Switzerland, 2015. [Google Scholar]
- Lehn, A.; Mahner, M.; Schweizer, B. A thermo-elasto-hydrodynamic model for air foil thrust bearings including self-induced convective cooling of the rotor disk and thermal runaway. Tribol. Int. 2017, 119, 281–298. [Google Scholar] [CrossRef]
- Li, C.; Du, J.; Yao, Y. Temperature calculation and static and dynamic characteristics analysis of bump foil gas bearing. J. Harbin Inst. Technol. 2017, 49, 46–52. [Google Scholar]
- Luo, Y.; Zhang, J. Analysis of the aerodynamic and thermal characteristics of the gap of the dynamic pressure gas thrust bearing. Mach. Build. Autom. 2019. [Google Scholar]
- Peng, Z.C.; Khonsari, M.M. A Thermohydrodynamic Analysis of Foil Journal Bearings. J. Tribol. 2006, 128, 534–541. [Google Scholar] [CrossRef]
- Aksoy, S.; Aksit, M.F. A fully coupled 3D thermo-elastohydrodynamics model for a bump-type compliant foil journal bearing. Tribol. Int. 2015, 82, 110–122. [Google Scholar] [CrossRef]
- Luis, S.A.; Ho, K.T. Thermohydrodynamic Analysis of Bump Type Gas Foil Bearings: A Model Anchored to Test Data. J. Eng. Gas Turbines Power 2010, 132, 042504. [Google Scholar]
- Talmage, G.; Carpino, M. Thermal Structural Effects in a Gas-Lubricated Foil Journal Bearing. Tribol. Trans. 2011, 54, 701–713. [Google Scholar] [CrossRef]
- Daejong, K.; Jeongpill, K.; Youngcheol, K.; Kookyoung, A. Extended Three-Dimensional Thermo-Hydrodynamic Model of Radial Foil Bearing: Case Studies on Thermal Behaviors and Dynamic Characteristics in Gas Turbine Simulator. J. Eng. Gas Turbines Power 2012, 134, 052501. [Google Scholar]
- Keun, R.; Luis, S.A. On the Failure of a Gas Foil Bearing: High Temperature Operation without Cooling Flow. J. Eng. Gas Turbines Power 2013, 135, 112506. [Google Scholar]
- Heshmat, H.; Walowit, J.A.; Pinkus, O. Analysis of Gas Lubricated Compliant Thrust Bearings. J. Lubr. Technol. 1983, 105, 638–646. [Google Scholar] [CrossRef]
- Trinkl, C.-M.; Bardas, U.; Weyck, A.; aus der Wiesche, S. Experimental study of the convective heat transfer from a rotating disc subjected to forced air streams. Int. J. Therm. Sci. 2011, 50, 73–80. [Google Scholar] [CrossRef]
- Mills, A.F. Heat Transfer, 2nd ed.; Prentice Hall: Upper Saddle River, NJ, USA, 1999. [Google Scholar]
Figure 1.
Structure of thrust bump foil gas bearing.

Figure 2.
Heat flow transfer model.

Figure 3.
Gas film thickness distribution diagram.

Figure 4.
Heat transfer paths near the top foil.

Figure 5.
Equivalent thermal resistance model diagram.

Figure 6.
Single side gas thrust bearing configuration.

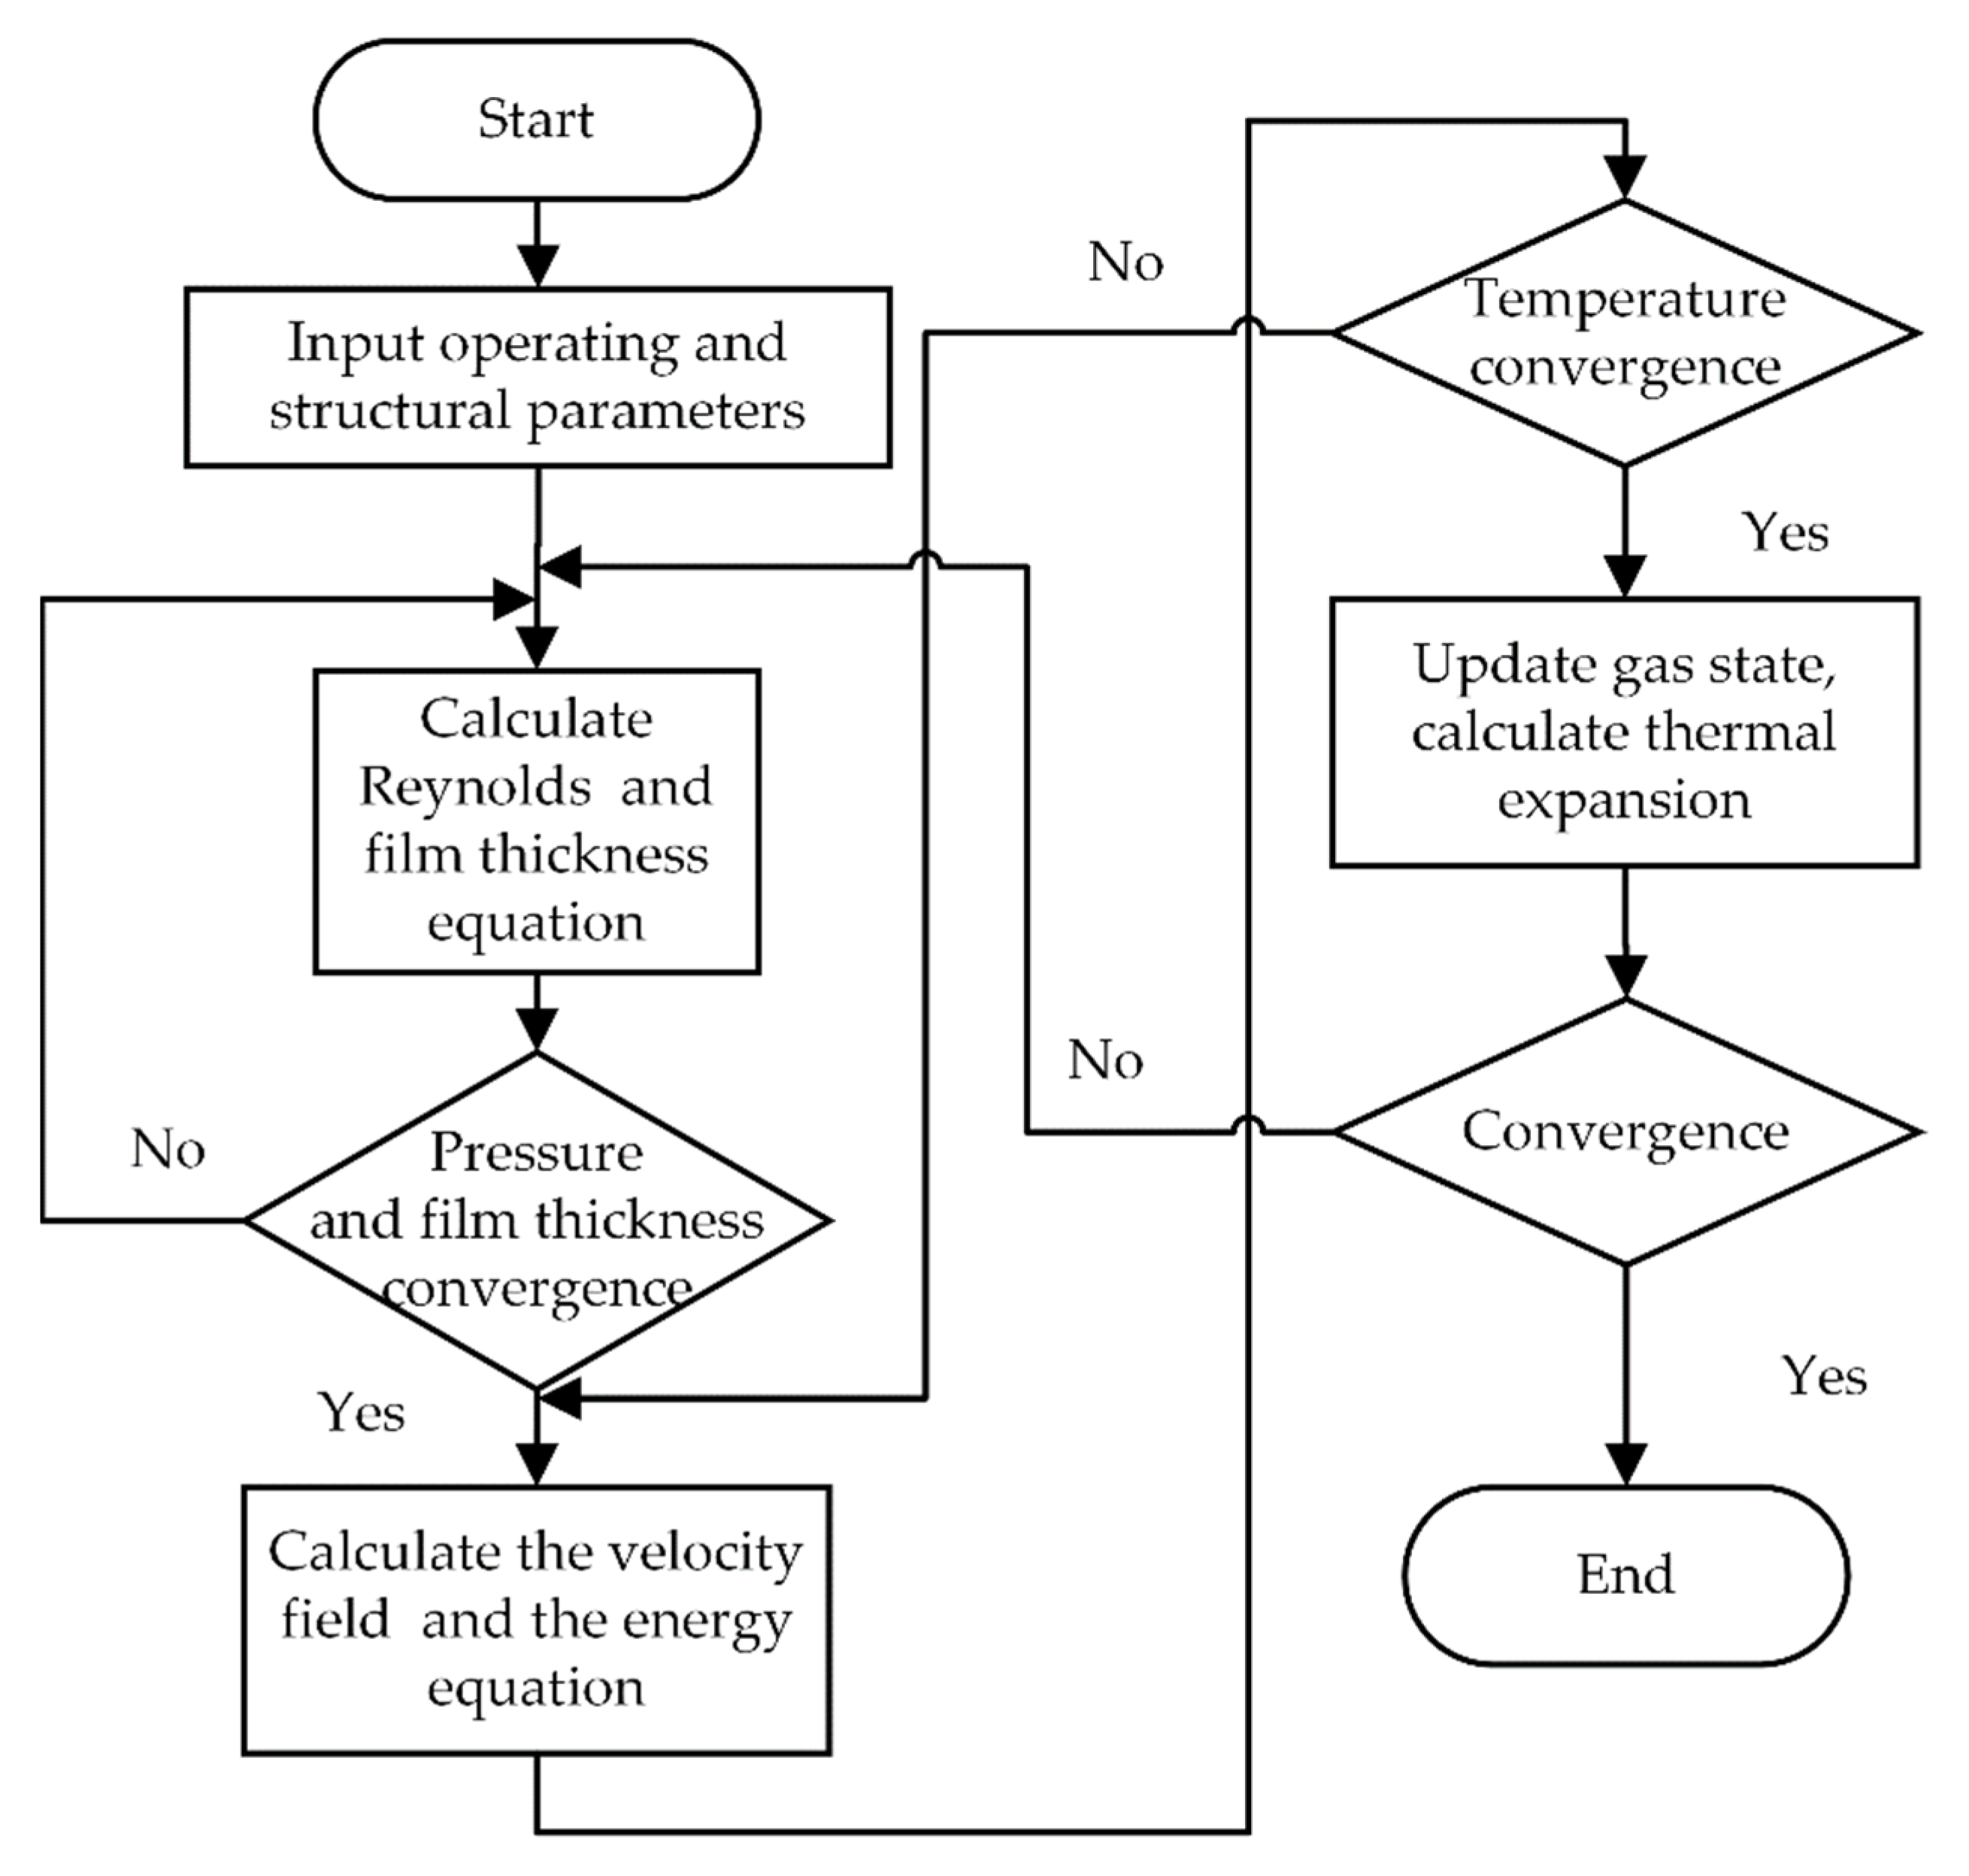
Figure 7.
Algorithm of the air-thermoelastic coupling simulation.

Figure 8.
Deformation distribution of top foil under different thermal model. (a) Isothermal model; (b) THD model.
Figure 8.
Deformation distribution of top foil under different thermal model. (a) Isothermal model; (b) THD model.

Figure 9.
Dimensionless gas film pressure distribution under different thermal model. (a) Isothermal model; (b) THD model.
Figure 9.
Dimensionless gas film pressure distribution under different thermal model. (a) Isothermal model; (b) THD model.

Figure 10.
Static characteristics under different thermal model. (a) Load capacity; (b) Friction loss power.
Figure 10.
Static characteristics under different thermal model. (a) Load capacity; (b) Friction loss power.

Figure 11.
Top foil temperature distribution.

Figure 12.
Relationship between bearing temperature and load.

Figure 13.
Relationship between bearing temperature and speed.

Figure 14.
Relationship between thrust plate temperature and speed.

Figure 15.
Relationship between bearing temperature and cooling gas flow.

Figure 16.
Physical image of experimental bearing.

Figure 17.
Temperature measuring point bonding.

Figure 18.
Thrust bearing temperature test bench.

Figure 19.
Picture of pointer thruster.

Figure 20.
Relationship between bearing top foil temperature and load.

Figure 21.
Relationship between bearing top foil temperature and rotational speed.


Table 1.
This is a table. Tables should be placed in the main text near to the first time they are cited.
Table 1.
This is a table. Tables should be placed in the main text near to the first time they are cited.
| Parameters | Values |
|---|---|
| Bearing inner radius r1 (mm) | 16 |
| Bearing outer radius r2 (mm) | 32 |
| Pitch ratio b | 0.4 |
| Sector tiles number N | 6 |
| Slope height δh (μm) | 40 |
| Top foil thickness td (mm) | 0.2 |
| Bump foil thickness tb, height hb (mm) | 0.15, 0.5 |
| Bump half length l, Bump pitch s (mm) | 0.98, 3 |
| Elastic modulus Eb (GPa) | 214 |
| Poisson’s ratio vb | 0.31 |
| Housing thickness tk (mm) | 16 |
| Foil thermal conductivity kt (W/K·m) | 16.9 |
| Thrust plate thickness tz (mm) | 5 |
Publisher’s Note: MDPI stays neutral with regard to jurisdictional claims in published maps and institutional affiliations. |
© 2021 by the authors. Licensee MDPI, Basel, Switzerland. This article is an open access article distributed under the terms and conditions of the Creative Commons Attribution (CC BY) license (https://creativecommons.org/licenses/by/4.0/).
Share and Cite
MDPI and ACS Style
Liu, X.; Li, C.; Du, J.; Nan, G. Thermal Characteristics Study of the Bump Foil Thrust Gas Bearing. Appl. Sci. 2021, 11, 4311. https://0-doi-org.brum.beds.ac.uk/10.3390/app11094311
AMA Style
Liu X, Li C, Du J, Nan G. Thermal Characteristics Study of the Bump Foil Thrust Gas Bearing. Applied Sciences. 2021; 11(9):4311. https://0-doi-org.brum.beds.ac.uk/10.3390/app11094311
Chicago/Turabian StyleLiu, Xiaomin, Changlin Li, Jianjun Du, and Guodong Nan. 2021. "Thermal Characteristics Study of the Bump Foil Thrust Gas Bearing" Applied Sciences 11, no. 9: 4311. https://0-doi-org.brum.beds.ac.uk/10.3390/app11094311
Note that from the first issue of 2016, this journal uses article numbers instead of page numbers. See further details here.