
Deformation Characteristic of a Supported Deep Excavation System: A Case Study in Red Sandstone Stratum

1
School of Civil Engineering, Central South University, Changsha 410075, China
2
National Engineering Laboratory of High Speed Railway Construction Technology, Central South University, Changsha 410075, China
*
Author to whom correspondence should be addressed.
Appl. Sci. 2022, 12(1), 129; https://0-doi-org.brum.beds.ac.uk/10.3390/app12010129
Submission received: 31 October 2021
/
Revised: 18 December 2021
/
Accepted: 21 December 2021
/
Published: 23 December 2021
(This article belongs to the Special Issue Recent Progress on Advanced Foundation Engineering)
Abstract
:A complete case record of a deep foundation pit with pile-anchor retaining structure excavated in red sandstone stratum is presented in this study. The horizontal displacement of pile top, the horizontal displacement at various depths, the axial force of anchor cable, and ground settlement during construction are measured. A three-dimensional numerical model is established to analyze the additional stress and deformation induced by the excavation and the accuracy of the FEM model is verified by comparing with field measured results. Both the measured and numerical simulation results show that the deformation of the pile-anchor supported deep excavation is significantly affected by the spatial effect. The results show that the deformation in the middle of the foundation pit is greater than the pit angle and that the deformation of the long side is greater than that of the short side and gradually decreases from the middle to the pit angle. The deformation and stress in the middle of the long side of the foundation pit are the largest, which is the most unfavorable part. With the increase of vertical excavation depth, the spatial effects tend to increase, and the influence scope of spatial effects is about five times the vertical excavation depth in the red sandstone stratum. The ground settlement outside the pit is mainly distributed in a groove shape, and the maximum settlement occurs about 8.5 m away from the pit edge. Finally, parametric studies of reinforcement parameters indicated that 1.5–2.0 times the initial elastic modulus and cohesive force of soil should be used for reinforcement. It is recommended that the ranges for pile diameter, pile spacing, anchor cable prestressing and inclination angle should be selected as 0.8–1.2 m, 1.4–2.0 m, 100–150 kN, and 10°–20°, respectively.
1. Introduction
With the large-scale construction of urban railways and high-rise buildings, comprehensive foundation pits are emerging [1], and the scale of foundation pits becomes larger, the excavation depth is deeper, and the surrounding environment is more and more complex and sensitive. Considering the impact of deep excavations on the stability of the existing structure and the surrounding environment, the control of deep foundation pit deformation is a key issue in design and construction progress [2,3].
The methods used to investigate pit deformation behavior include, but are not limited to, empirical methods, field monitoring, and numerical simulation. Among these research methods, the empirical method was used to find the deformation pattern of pits by analyzing a large number of existing cases of foundation pits. Xiao et al. [4] analyzed 92 cases of deep excavations in China and found that the deformation of pit sidewalls and surface settlement show regular changes with the width of the foundation pit. Finno et al. [5] proposed an empirical formula for predicting the displacements of pits at different locations under three-dimensional conditions, combining the displacement results of more than 150 pits with different lengths, widths, and excavation depths. Field monitoring can thoroughly reflect the actual situation of deep excavations. Studies of conventional diaphragm walls combined with inner supports in sandy and soft soil areas have found that the deformation near the corners is less than that in the middle, and a large amount of data suggests that there is a spatial effect in foundation excavation [6,7,8,9]. Field monitoring tests of composite structural pits in soft soil areas showed that buildings around the foundation pit were also affected by the excavation of foundation pits, with temporal and spatial effects [10,11]. Through numerical simulating, the influence of various pit excavation and support parameters on pit deformation can be comprehensively considered, so that reasonable parameters can be selected to provide a basis for the foundation pit design [12,13].
For deep and large excavations, support systems, such as diaphragm walls and inner supports, are relatively expensive. Soil nail wall is not optimal for controlling the deformation of foundation pits. Due to the simplicity of construction, capacity to control deformation, and low interference with pit excavation, pile-anchor support systems are frequently utilized for deep and large foundation pits [14,15]. The pile-anchored support structure has received the attention from engineering and academic community. Goldberg et al. [16] investigated the influence law of soil distribution and support form on the deformation of the support structure by analyzing the measurement results of several deep foundation pits. Clough et al. [17] summarized the deformation form of the supporting structure in foundation pit excavation as three categories, namely cantilever type, internal convex type, and combined type. Guo et al. [18] monitored the stress and displacement of the supporting pile in a pile-anchored support structure of a foundation pit, and the results showed that the bending moment of the pile gradually increased with the excavation depth, and the point of maximum bending moment gradually moved towards the bottom of the foundation pit. Li et al. [19] found that the crown beam in the pile-anchored support structure can play a certain coordination role in the displacement of the pile top through field tests.
Scholars have conducted an abundance of studies on pile-anchored support systems. However, in the current design of deep and large foundation pits, the deformation of the foundation pit is regarded as a plane strain problem, and its spatial effect is frequently ignored, resulting in the deformation prediction of a foundation pit that differs greatly from the actual measurement, and imposing a negative impact on the construction [20,21]. Ashraf et al. [22] compared the analysis results between two-dimensional and three-dimensional finite element models and found that the three-dimensional FEM outperformed the two-dimensional plane strain model in predicting the lateral deformation and vertical soil settlement of underground diaphragm walls. Feng et al. [11] found that the greater the long side of the foundation pit, the greater the horizontal displacement due to the spatial effect. Through case studies, Zhe et al. [23] demonstrated that the spatial variability of the soil has a considerable influence on the structural response caused by excavation. Yang et al. [24] found that considering spatial effects during excavation of extra-long foundation pits can effectively reduce the deformation of the supporting structure and the surrounding strata through numerical simulations. The foundation pit deformation results obtained from 3D finite element calculations were compared with the plane strain results, and it was found that the safety factor of the foundation pit obtained from the 3D analysis was greater than that obtained from the 2D analysis [25]. The current research mainly explores the deformation of the pile-anchored support pit excavation process under two-dimensional conditions. However, there are fewer studies on the optimal selection of design parameters of pile-anchored support, and the analysis of deformation induced by deep excavation of foundation pits considering spatial effects has often been ignored.
The field monitoring and numerical simulation were conducted to investigate the deformation characteristics of deep excavations with pile-anchor support structures in red sandstone strata. The changes in the horizontal displacement of the piles, ground settlement, and axial force of the anchor cables during the excavation of the foundation pit are compared and analyzed to verify the reliability of the numerical simulations. At the same time, considering the spatial effect of the pit excavation, numerical simulation is used to change the parameters, including the soil layer, piles and anchor cables, to determine the best parameters to control the pit deformation and to propose reasonable parameter values for the design of deep and large pile-anchor supported pits.
2. Project Background
2.1. Construction Site
The deep excavation of Ganzhou west railway station reserved metro station is located in Fenggang town, the Ganzhou economic development zone. The station is an underground three-story island platform station with a structure of three layers and one span of a reinforced concrete rectangular frame. The excavation size is 274.8 m × 62.4 m, and the excavation depth is 26.9–29.5 m. The scale of excavation is a large-span deep foundation pit. The upper part of the foundation pit is excavated by step-slope excavation and supported by soil nail walls. Vertical excavation is adopted for the lower part. The depths of the two parts are 10 m and 16.5–18.9 m. The main body of the pit is supported by bored piles and pre-stressed anchor cables.
2.2. Geological and Hydrogeological Data
The construction site terrain is flat and broad. The surface water is not developed and varies with the seasons. The buried depth of the stable groundwater table is 0.5–10.8 m.
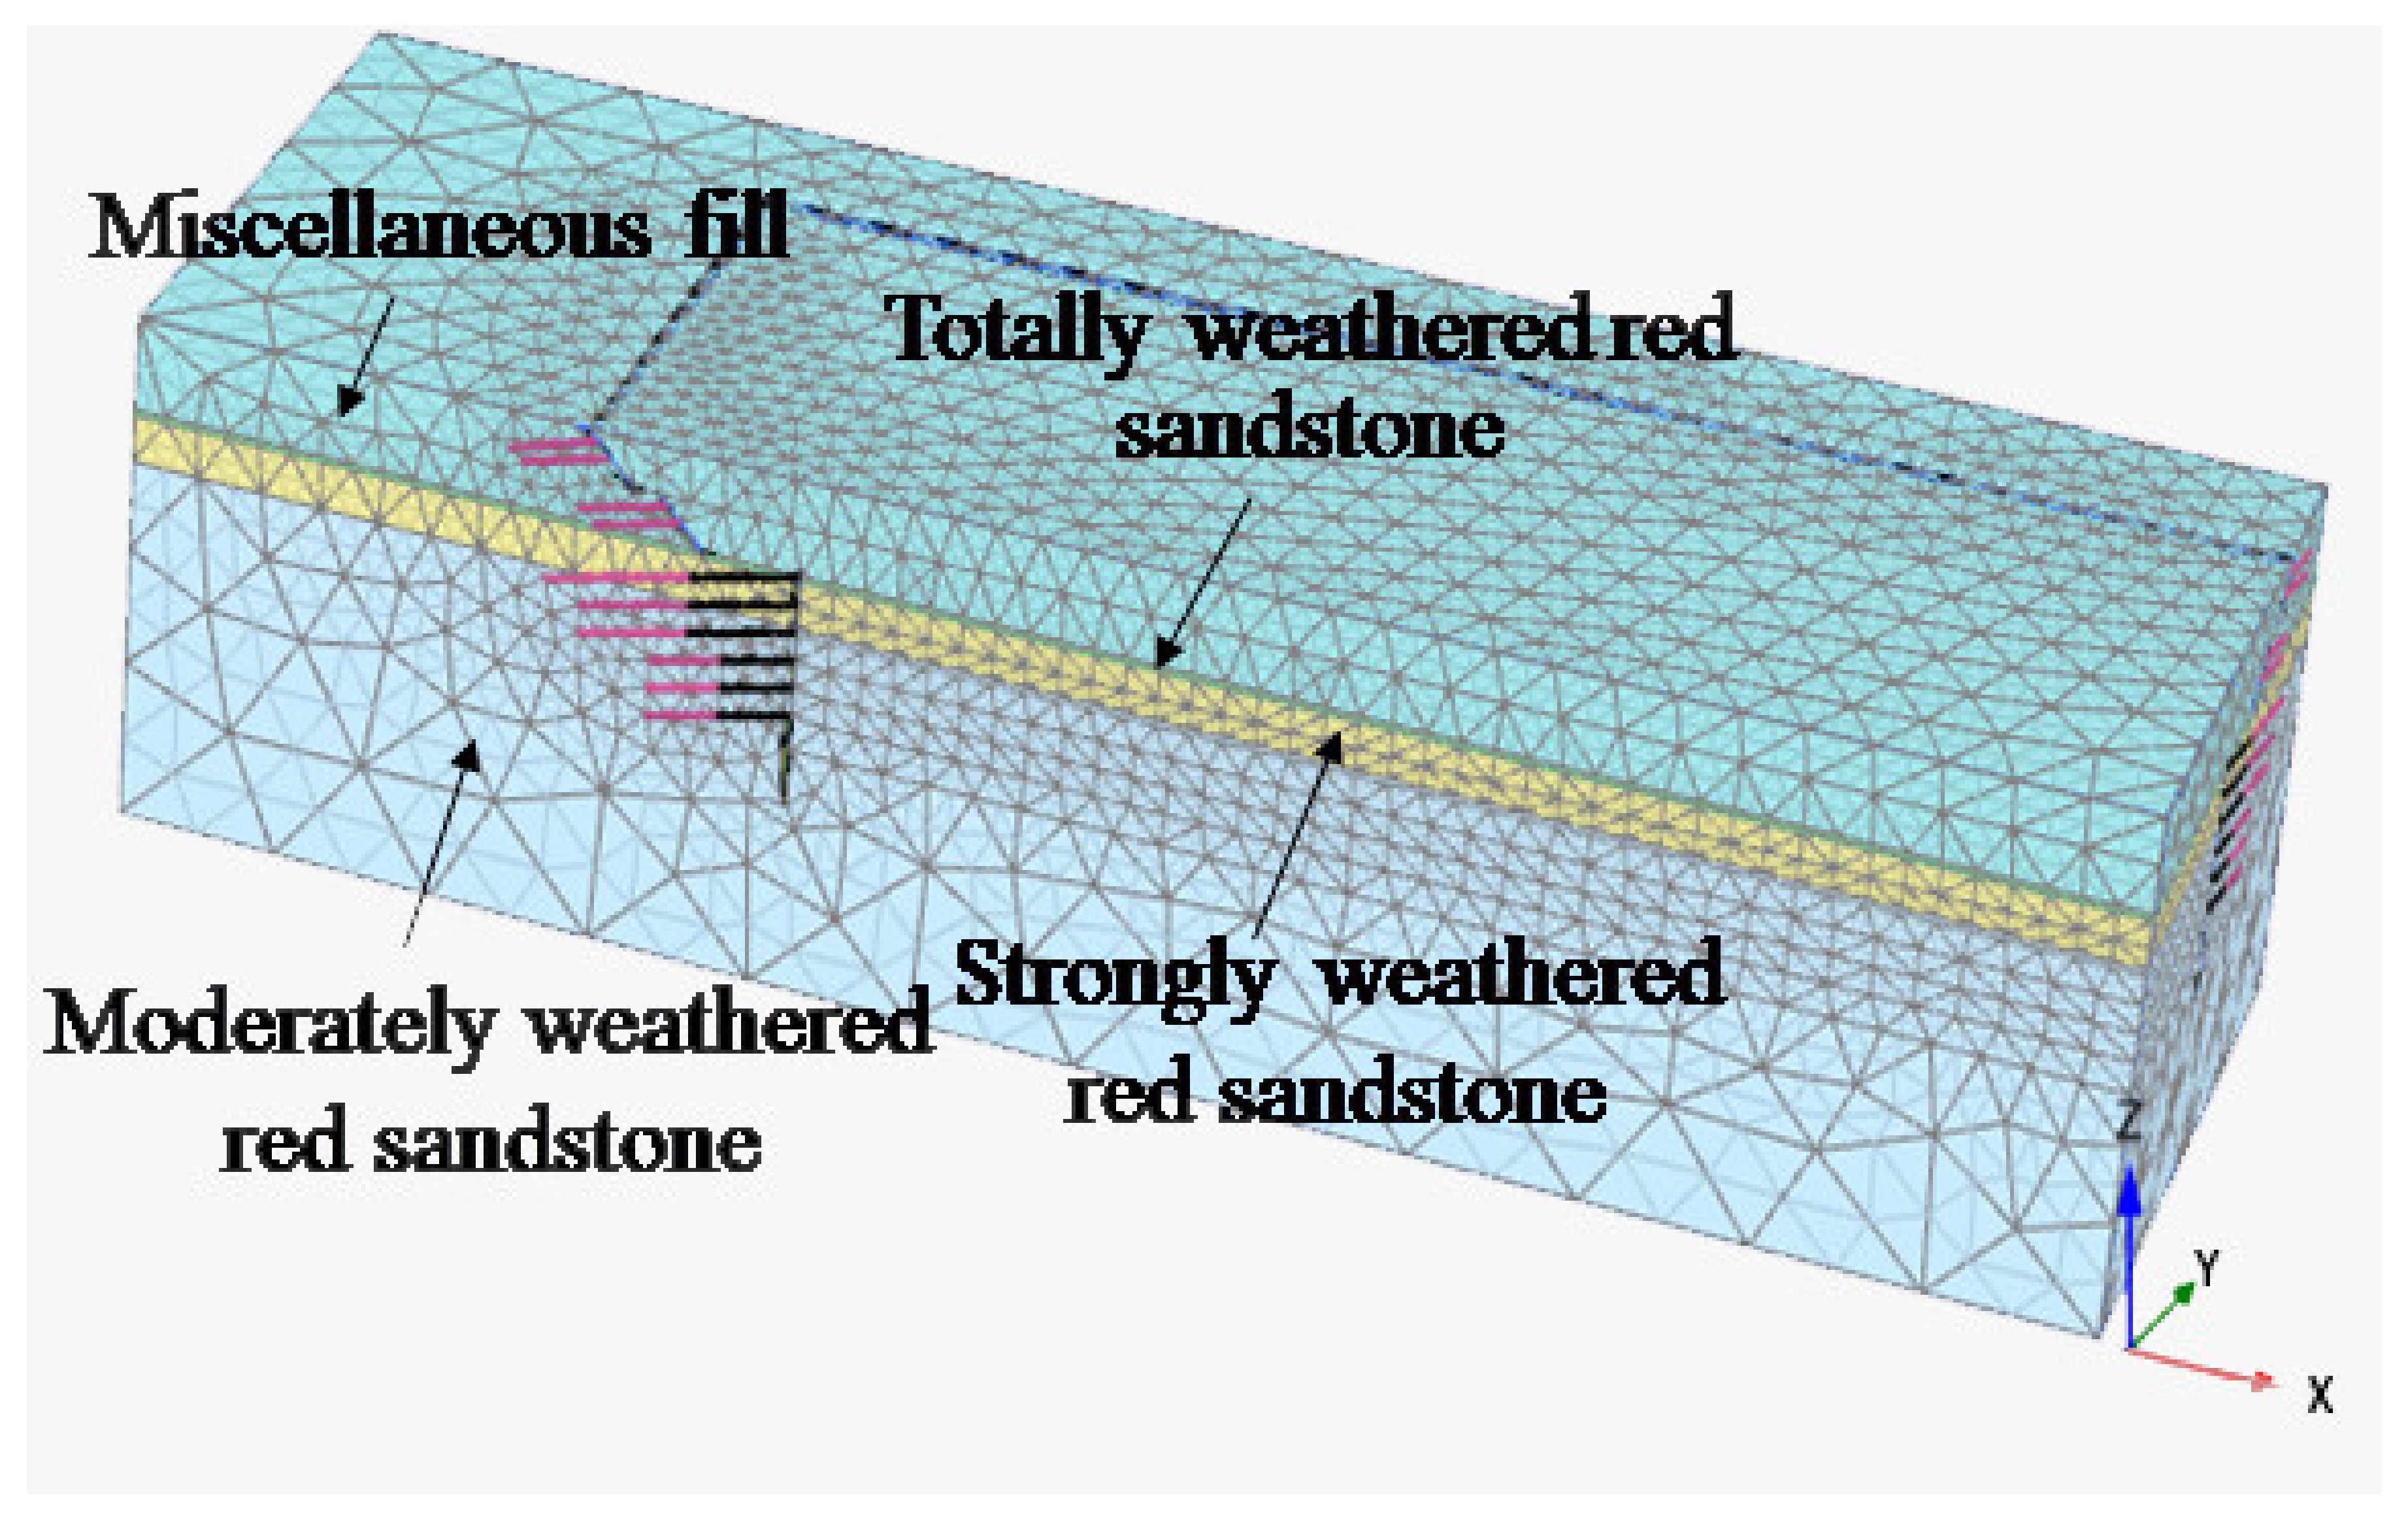
The strata in this area from top to bottom are: miscellaneous filling, totally weathered red sandstone, strongly weathered red sand sandstone, and moderately weathered red sandstone. Physical and mechanical parameters of each soil layer are shown in Table 1.
Red sandstone shows favorable engineering characteristics in the natural state, including high shear strength and stability. While red sandstone is disturbed, its strength rapidly decreases, and the permeability coefficient changes as well. When red sandstone is exposed to water, it can disintegrate. To ensure that the excavation of the pit is not affected by groundwater, temporary drainage trenches and water collection wells can be installed in the pit after the construction of the crown beam is completed to allow for pumping and draining during excavation. The wells are drained when the water level rises to ensure that the water table is below the working face of the pit.
2.3. Design of the Support Structure and Excavation
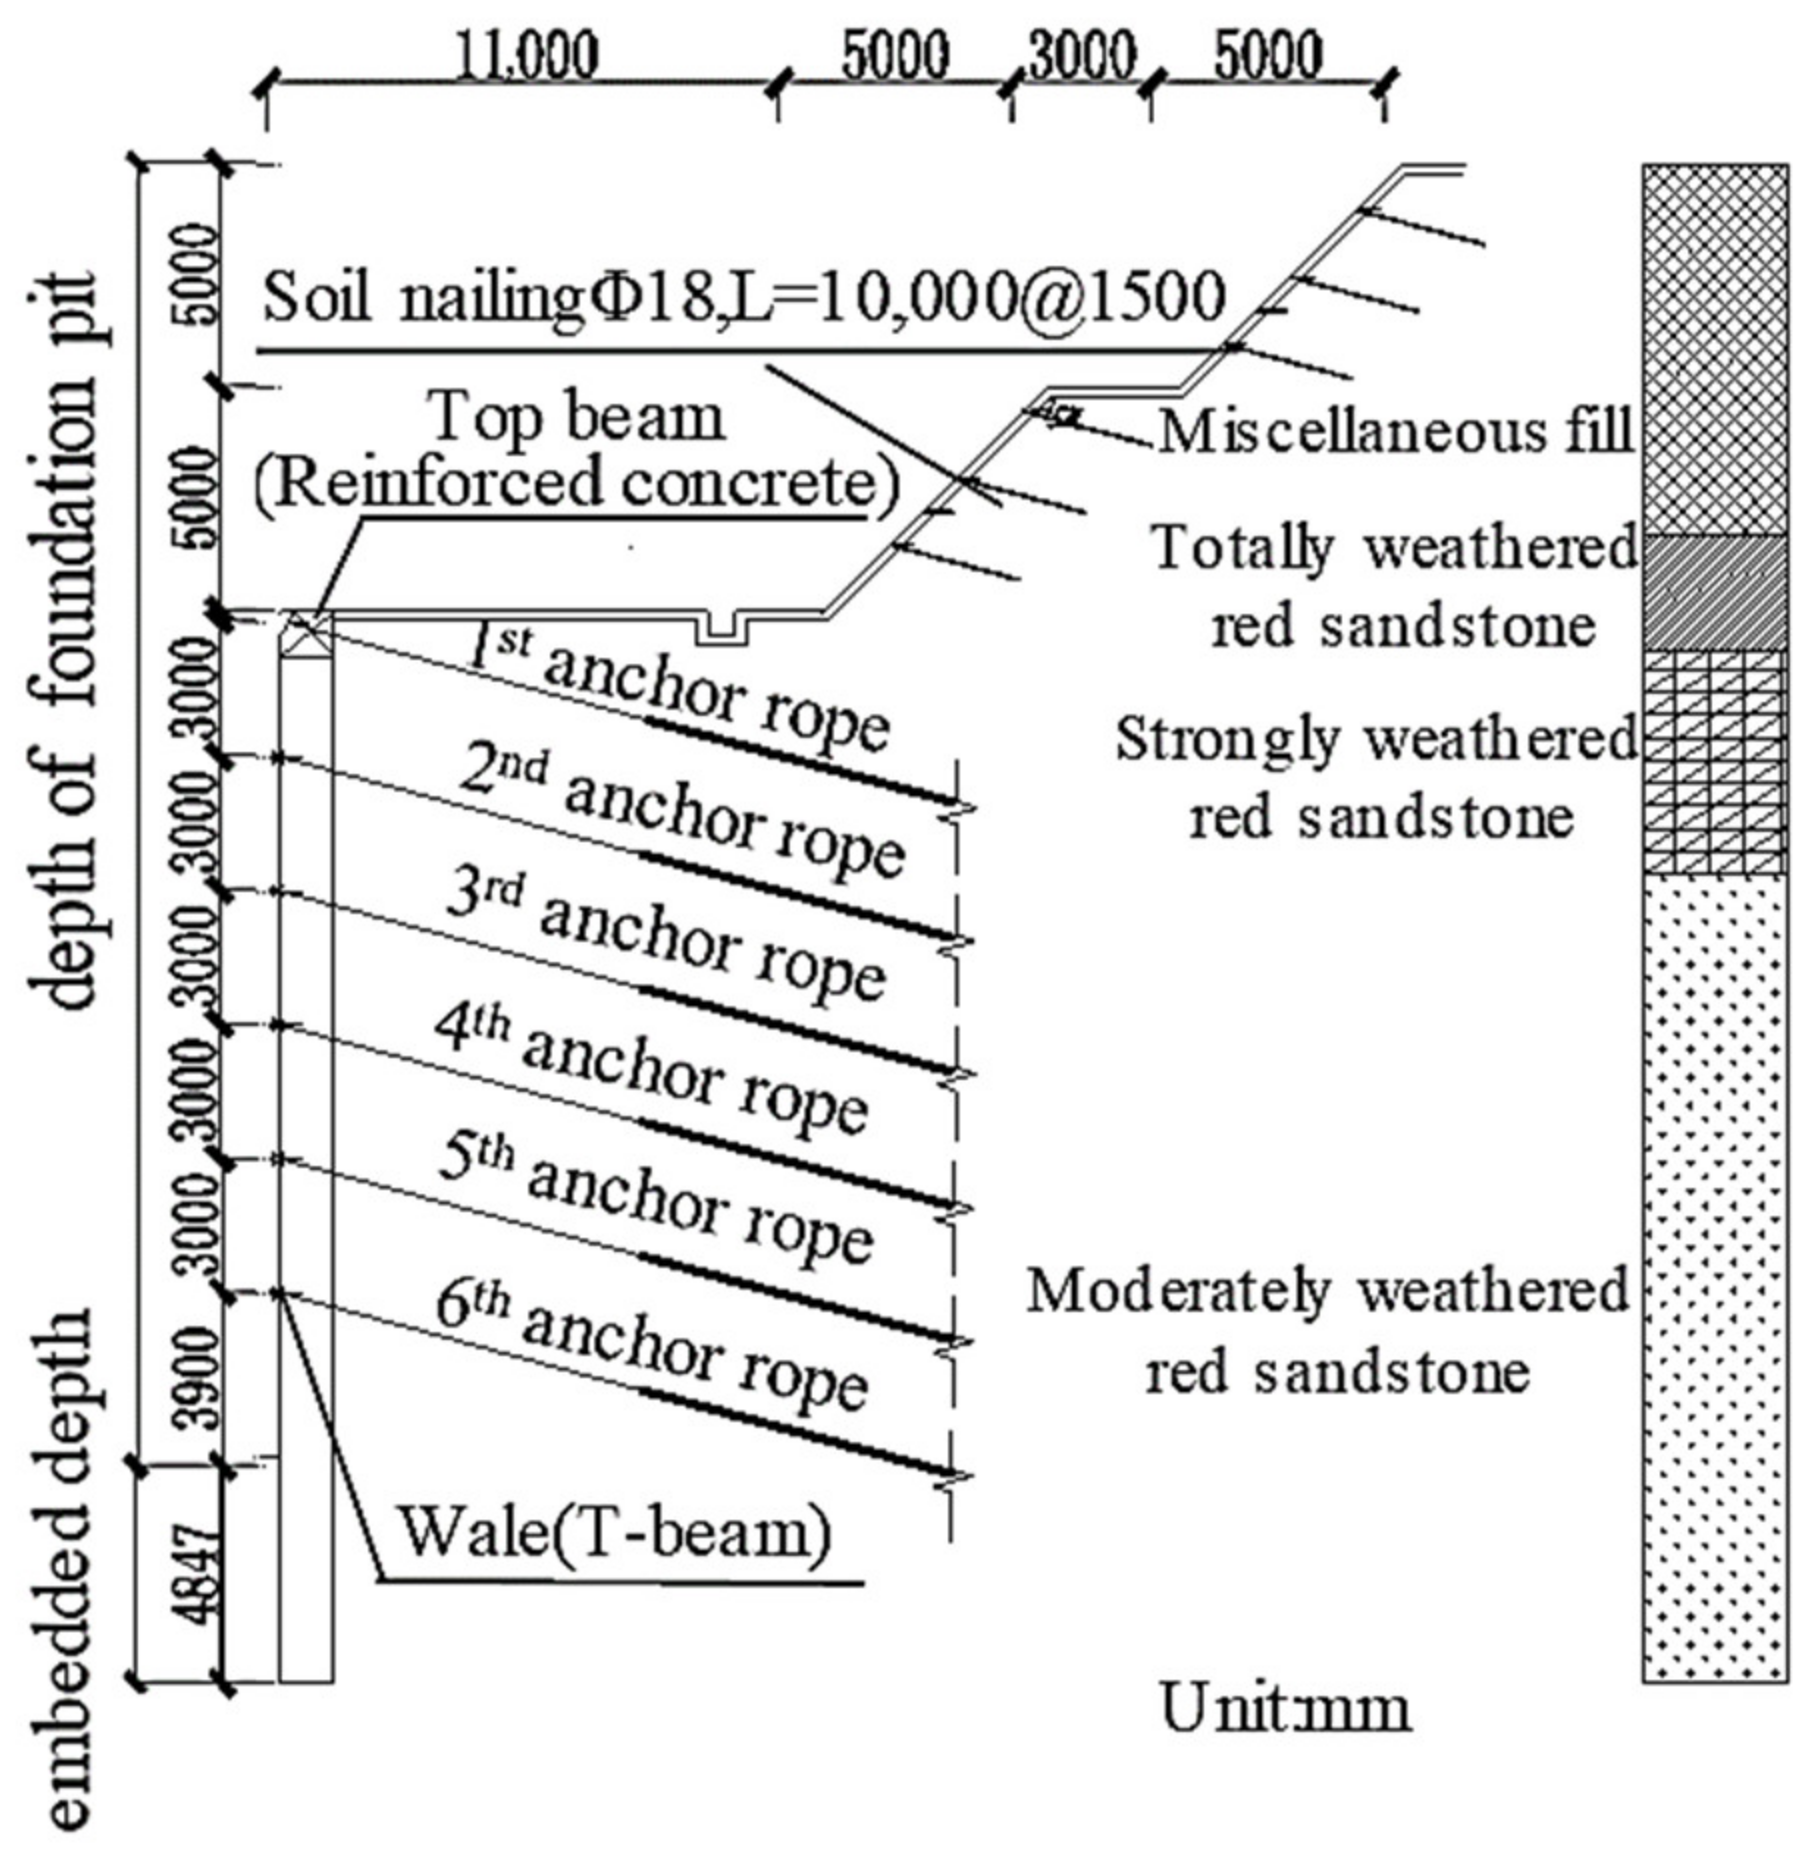
The reinforced bored piles are 1.2 m in diameter, 1.4 m in pile spacing, and 20.4 m to 23.0 m in length. A reinforcement mesh of 20 cm in length and width is suspended between the piles, with 8 mm diameter reinforcement in the mesh, and a 10 cm thick C25 shotcrete surface layer. The slope angle of foundation pit excavation is 45°. The angle between soil nailing and the horizontal direction is 15°, the embedding length is 10 m, and the vertical spacing between soil nailing is 1.5 m. There are six lines of prestressed anchor cables, set every 3 m from top to bottom. The reinforced concrete top beam with 1.2 m in width and 1.0 m in height secures the first anchor cable. The waist beam also secures other five anchor cables. The anchor cable is adopted secondary pressure grouting, with water-cement ratio of 0.45~0.50. The cable is 14~30 m in length and 15° in the horizontal inclination angle. The support structure design of a typical foundation pit cross-section is shown in Figure 1.
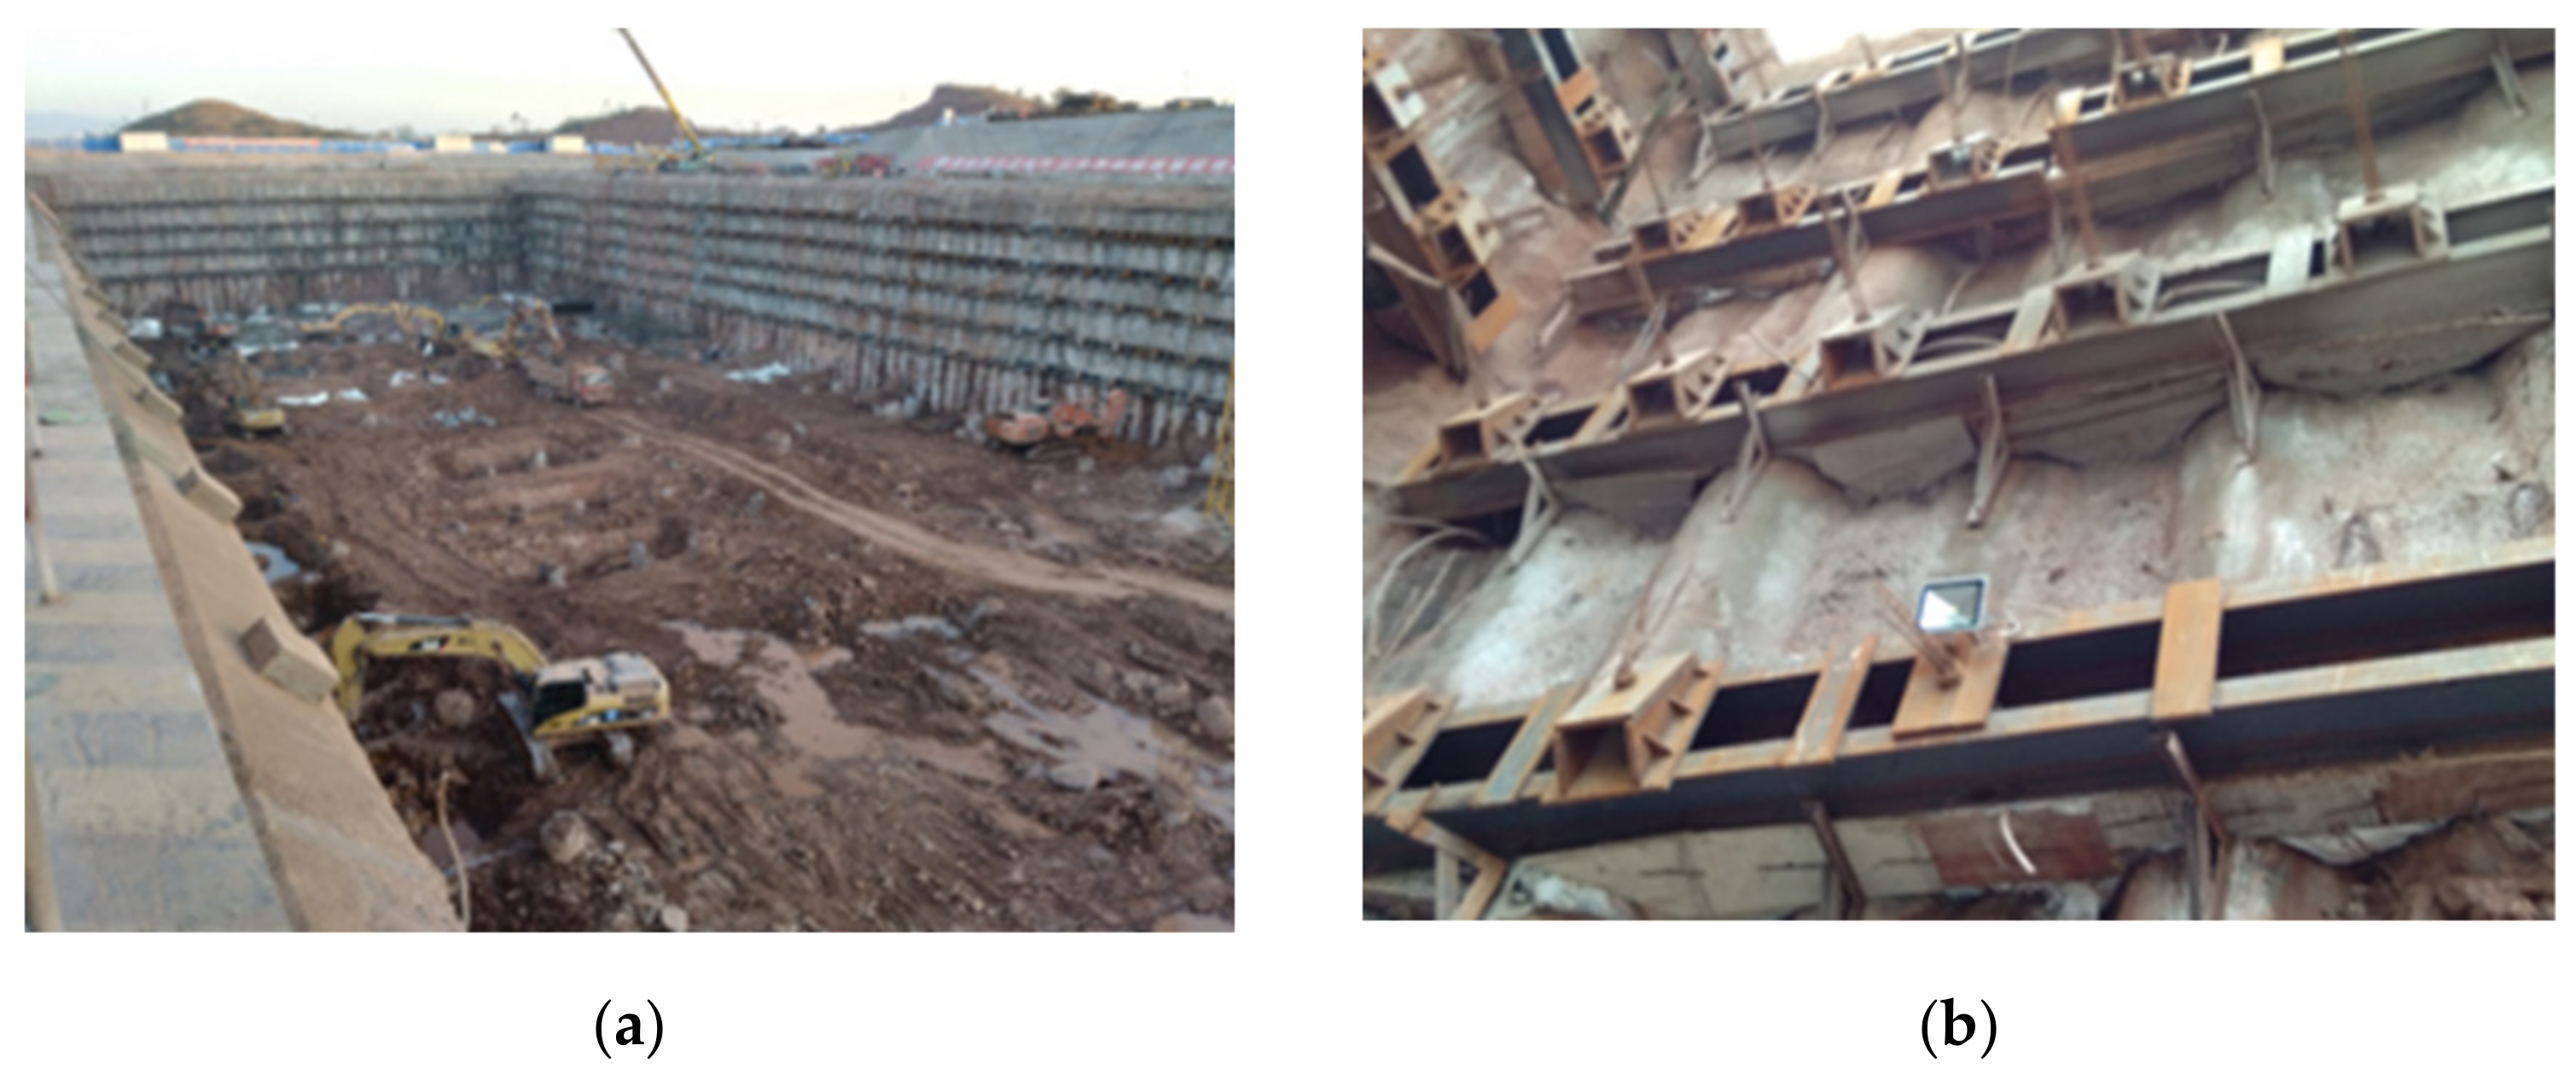
The excavation is divided into six layers, each ranging in depth from 2.5 to 3 m. The prestressed anchor cables were installed simultaneously during the excavation of the foundation pit, and prestressing force was applied when the excavation reached the crown beam or 0.5 m below each waist beam. The construction site plan is shown in Figure 2. The contents of the foundation pit excavation working conditions are shown in Table 2.
3. Field Monitoring
3.1. Monitoring Scheme
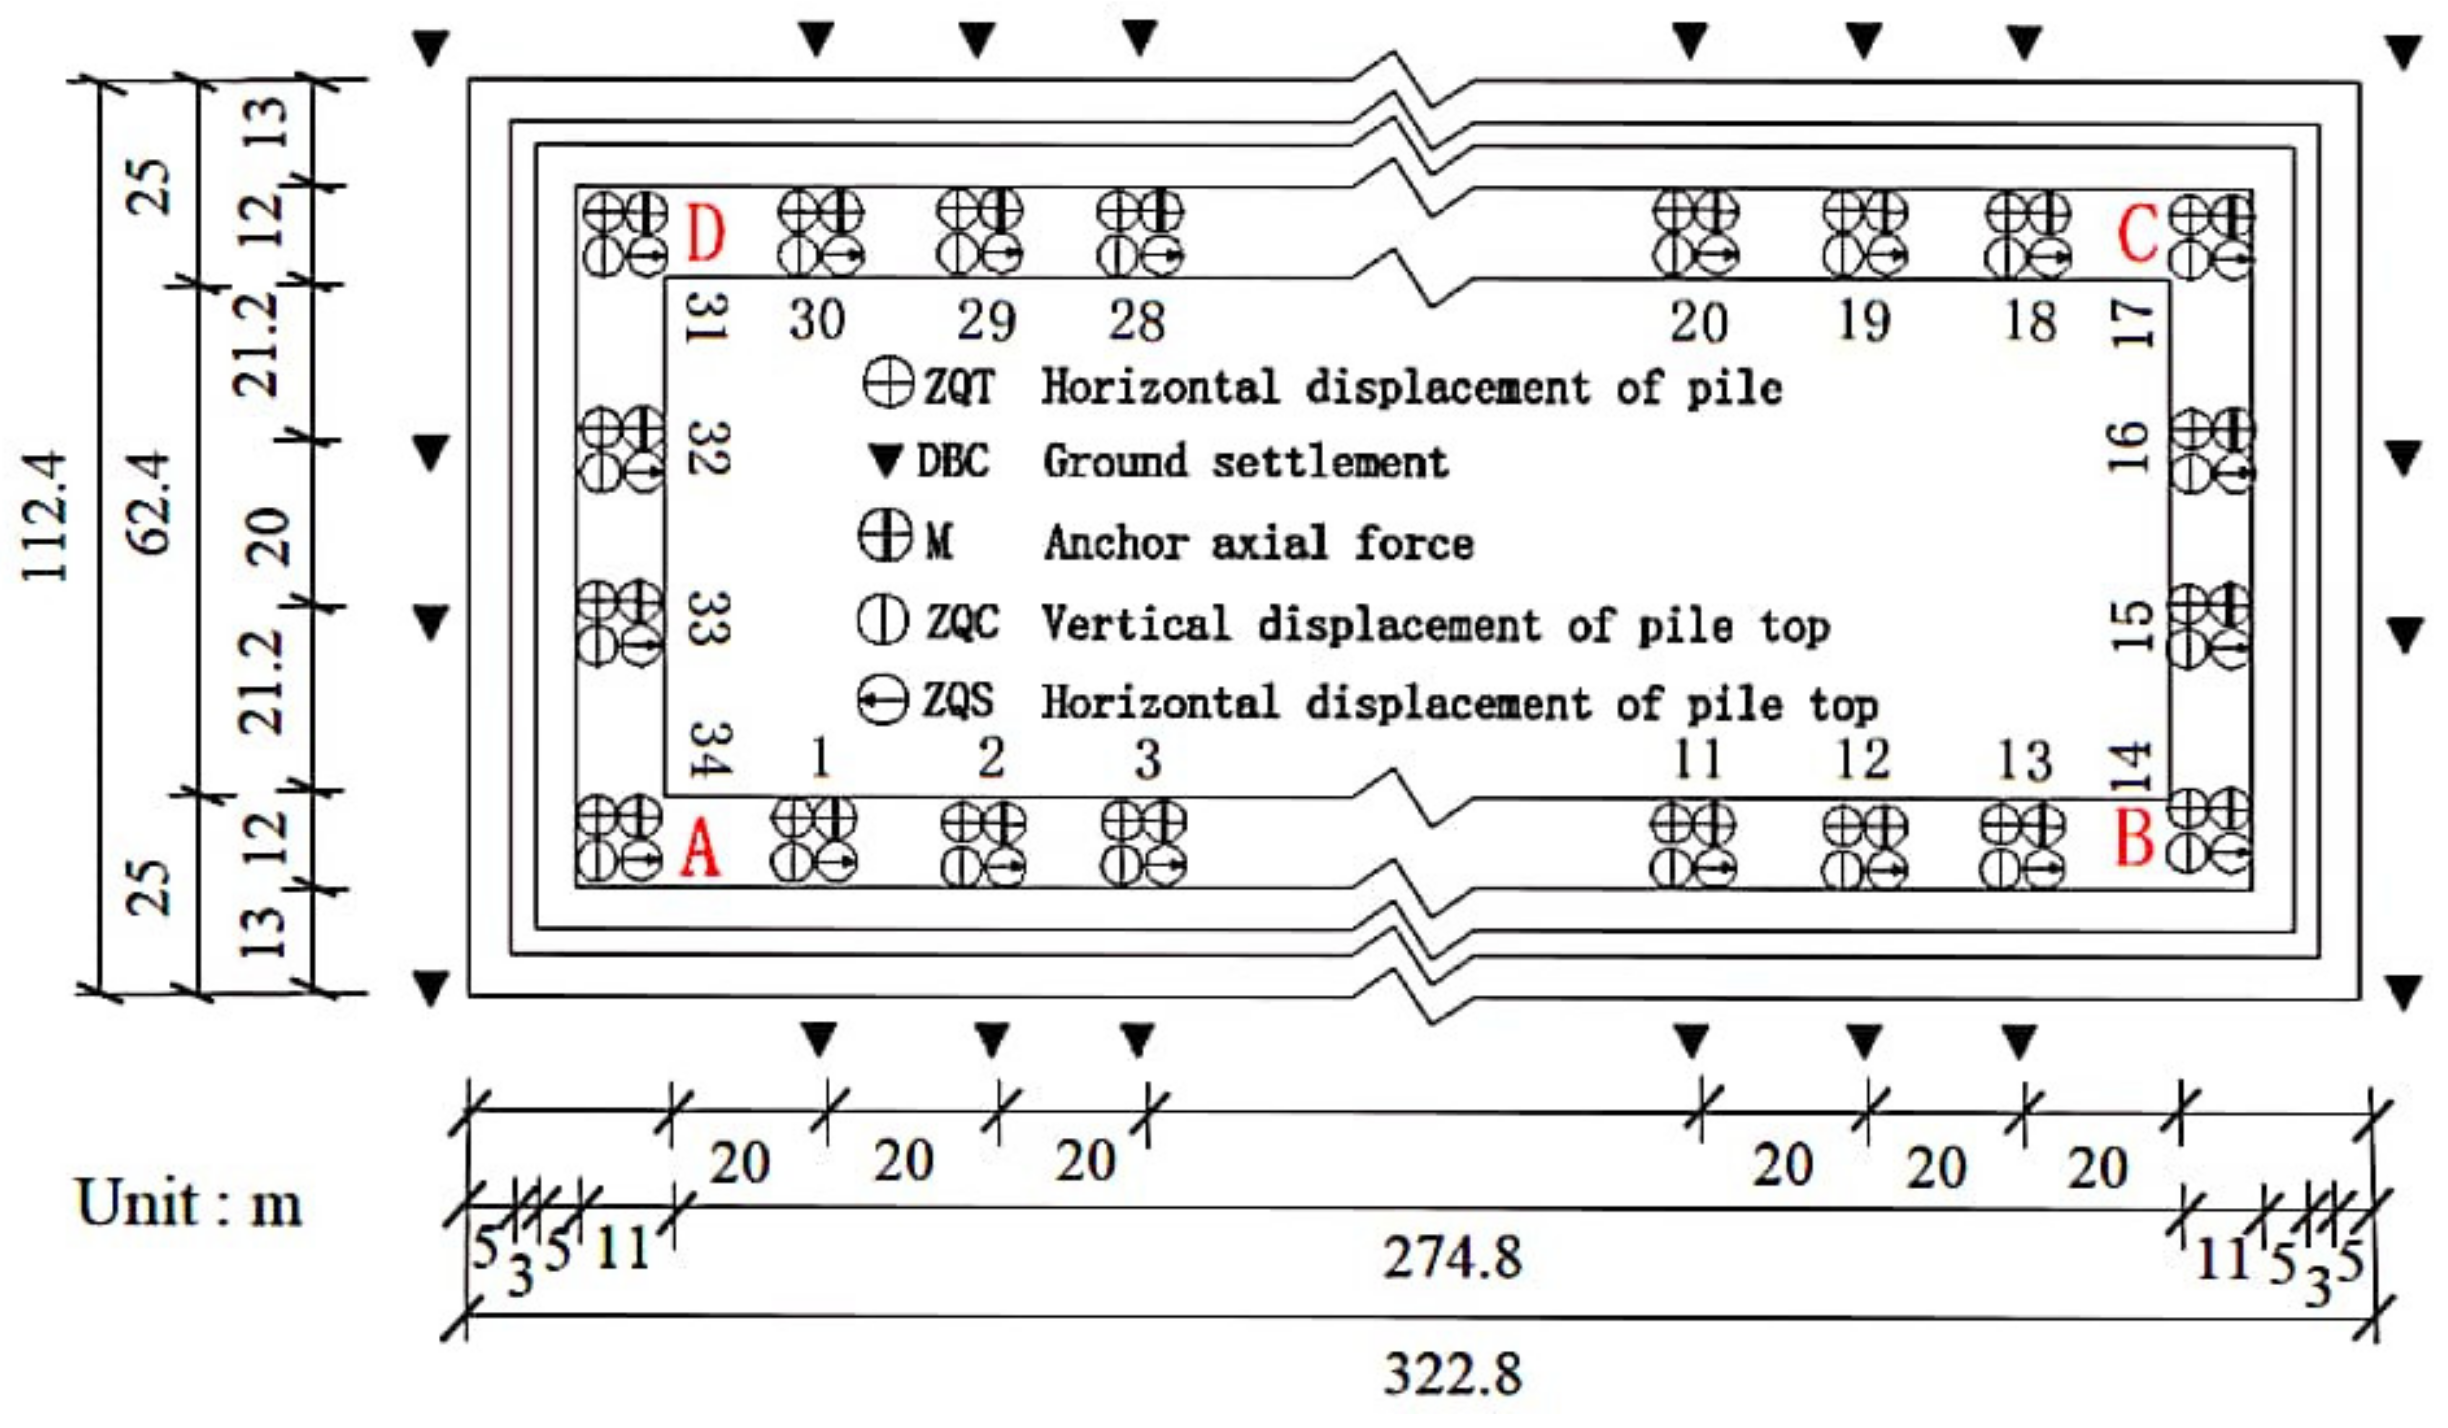
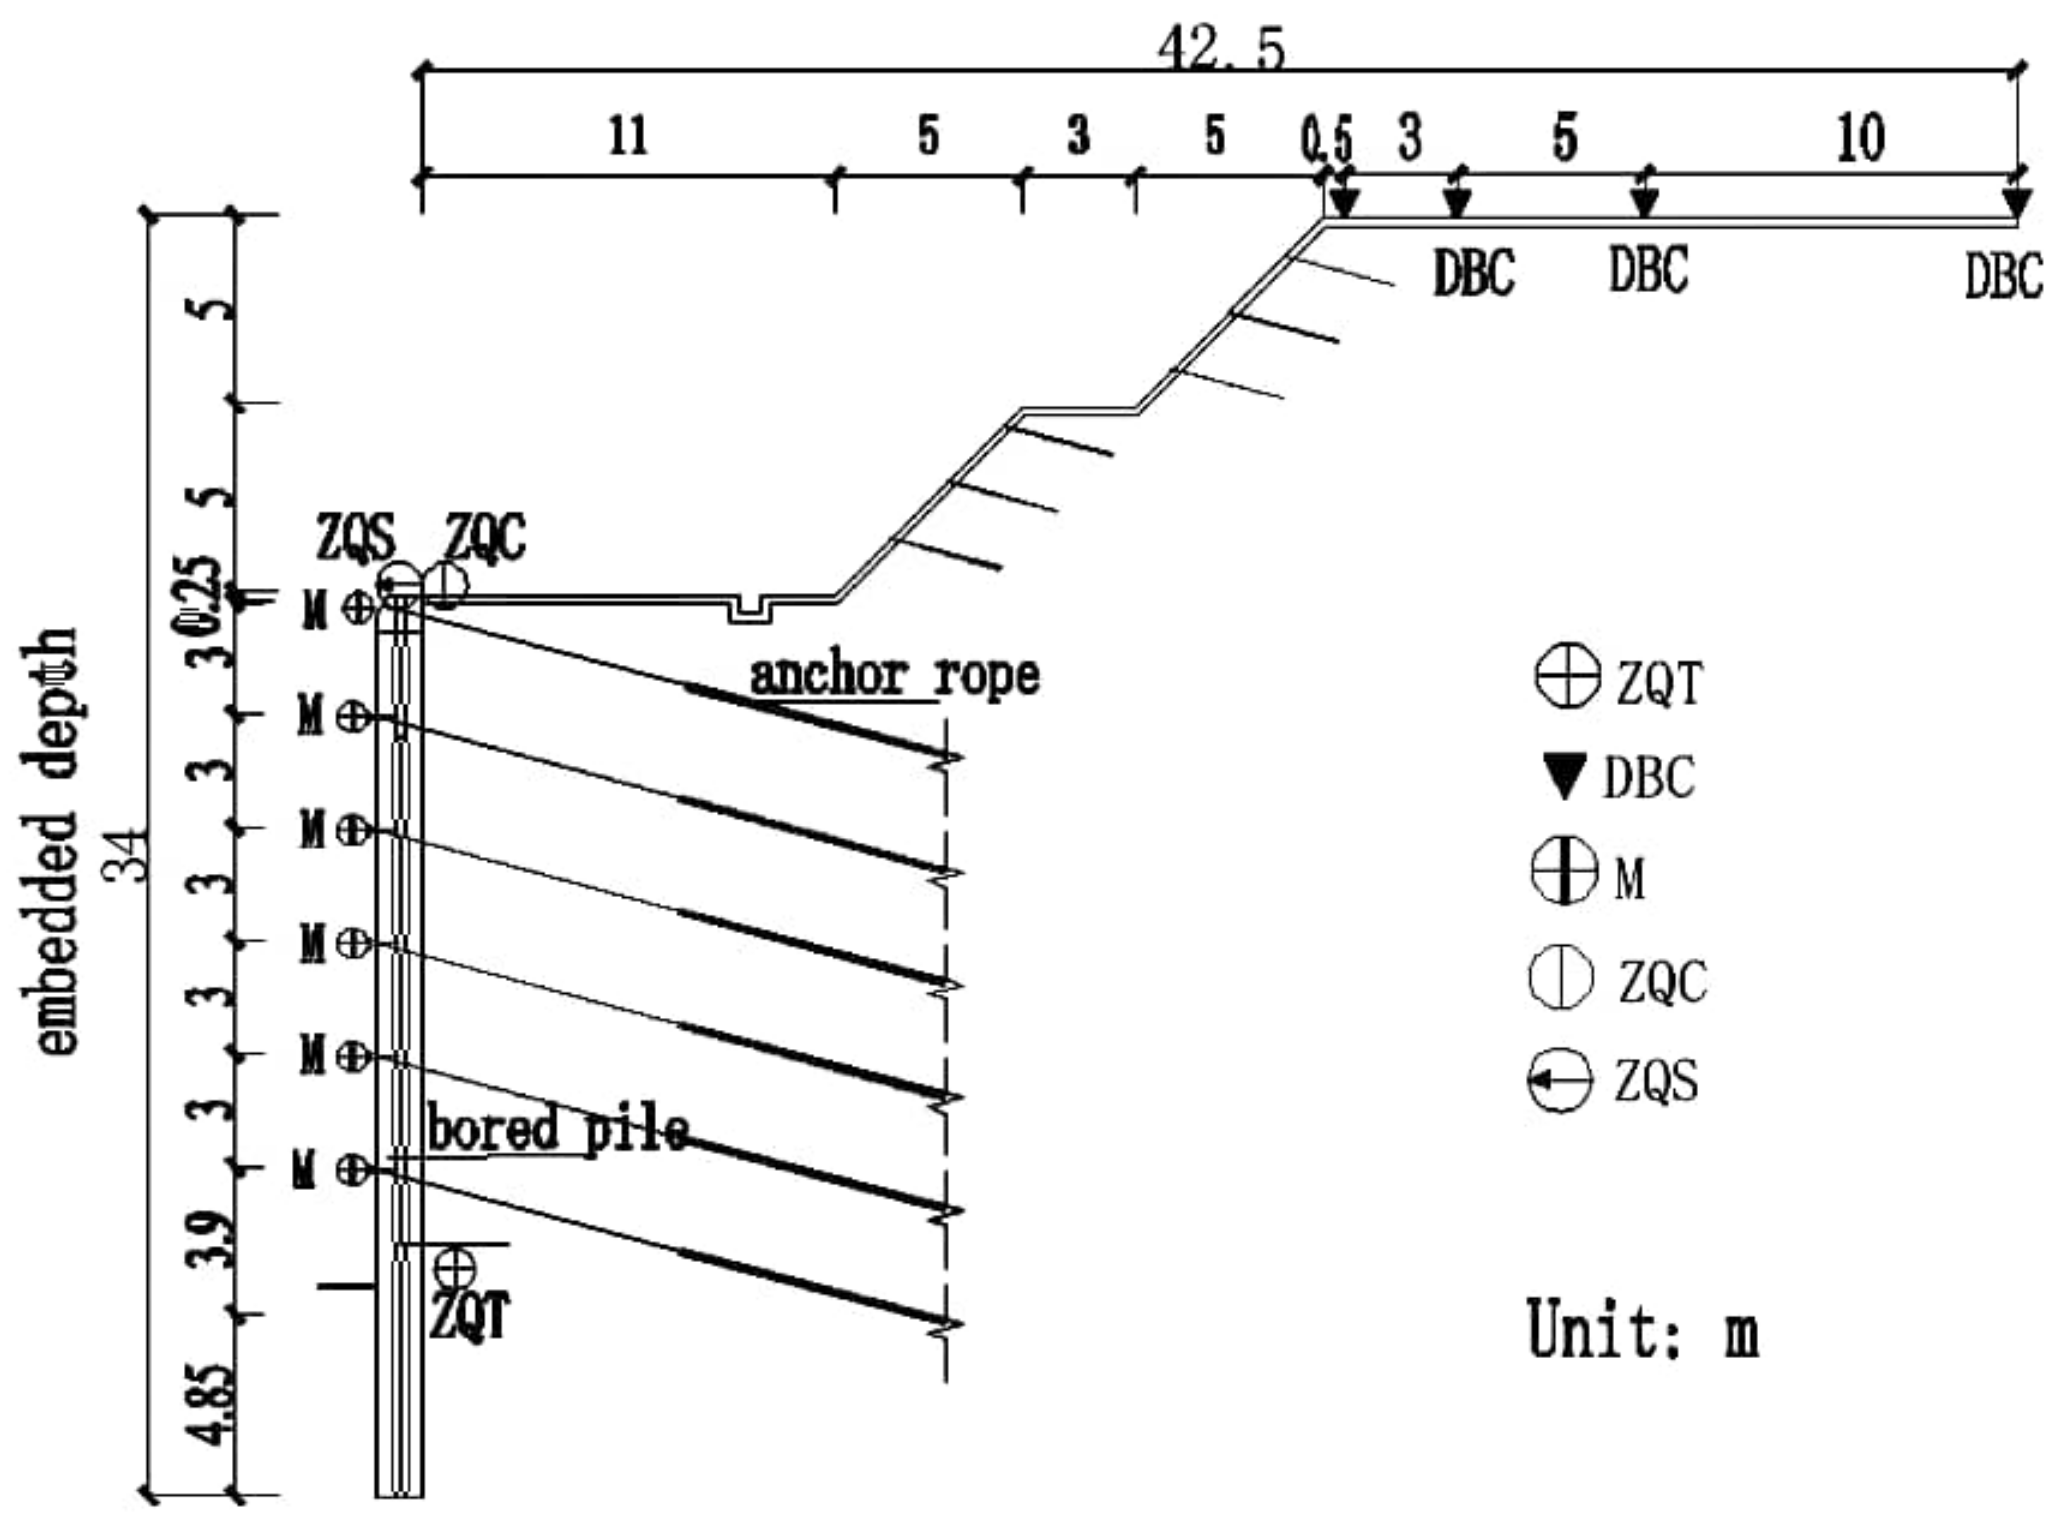
In the field, the pit was mainly monitored by instruments and supplemented by visual observation. A master survey section was set up each 20 m along the edge of the foundation pit, which had a total of 34 master survey sections. The top and body of the pile in the foundation pit were fitted with measurement points in each main section. The TOPCOM 7001 total station, Leica DNA03 precision level, and CX-08A inclinometer were used to monitor the horizontal displacement of the top of the pile, the vertical displacement of the top of the pile, and the horizontal displacement of the body of the pile. The above monitoring instruments are highly accurate and can measure up to 0.01 mm of the deformation, which can play a good role in measuring the deformation of the foundation pit. All anchor cables in each main survey section were equipped with force gauges to monitor the axial force of the anchor cables. Two rows of measurement points were arranged at the surface of each main survey section at the vertical pit edge, with each row of four measurement points spaced at 0.5 m, 3 m, 5 m and 10 m, to measure surface settlement using Leica DNA03 precision levels. At the edge of the foundation pit, monitoring posts were placed at 20 m intervals (in line with the main survey sections). While the top of the bored piles was being filled in each main survey section, prefabricated metal markers were placed and the horizontal displacement of the pile top was measured using a total station and the polar coordinate method. At the same time, a tilt pipe hooked directly to the bored pile’s reinforcing cage was used to monitor the pile’s horizontal displacement. Before the foundation pit was excavated, initial values were measured for each project. Monitoring occurred once every three days when the excavation depth was small. The frequency of monitoring increased as the depth of the excavation increased. Monitoring once or twice each day was required when the excavation depth surpassed 15 m. Figure 3 shows the location of each measurement point, and Figure 4 shows the arrangement of a typical monitoring section. In the figure, ZQT, DBC, M, ZQC, and ZQS represent the horizontal displacement at various depths, ground settlement, anchor cable internal force, vertical displacement of the pile top and horizontal displacement of the pile top, respectively.
3.2. Analysis of Monitoring Results
The monitoring data of horizontal displacement of the pile top, ground settlement, and horizontal displacement of the pile are analyzed from sections 14 and 34 of the pit corners, section 15 on the short side BC, section 33 on the short side CD, and sections 1 to 13 on the long side AB. Figure 3 illustrates the position of each monitoring site.
3.2.1. Horizontal Displacement of the Piles
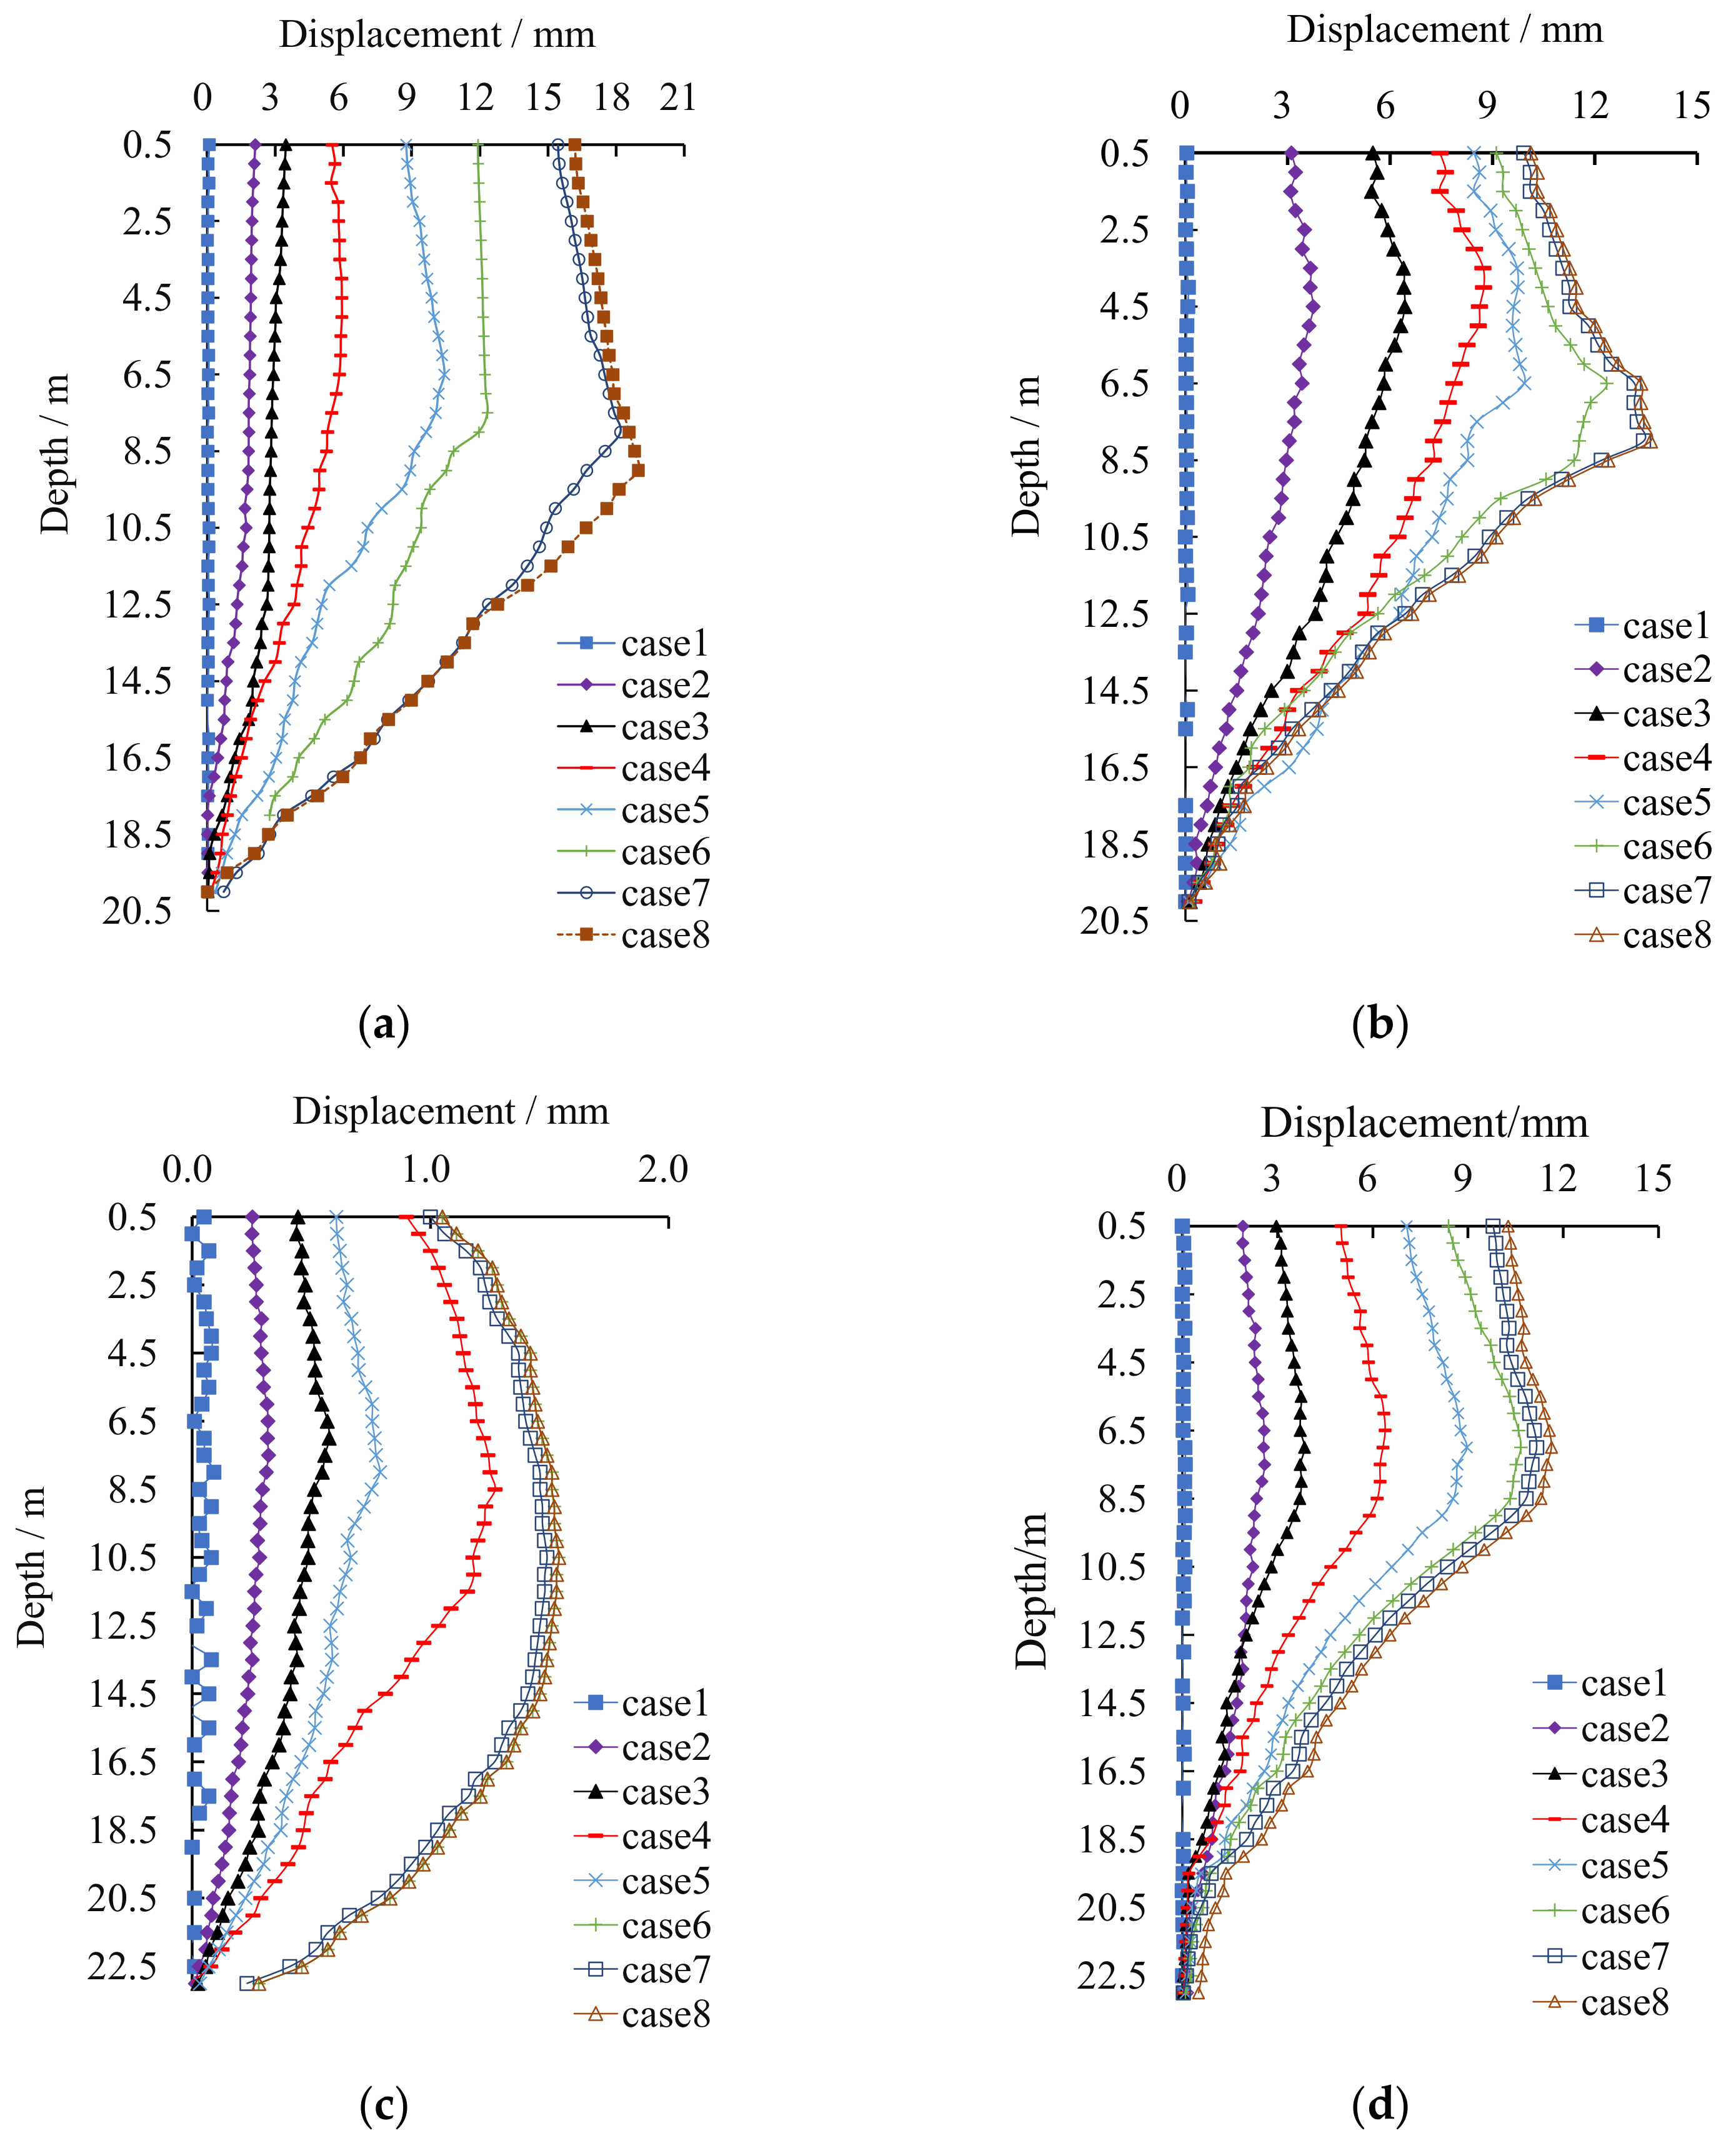
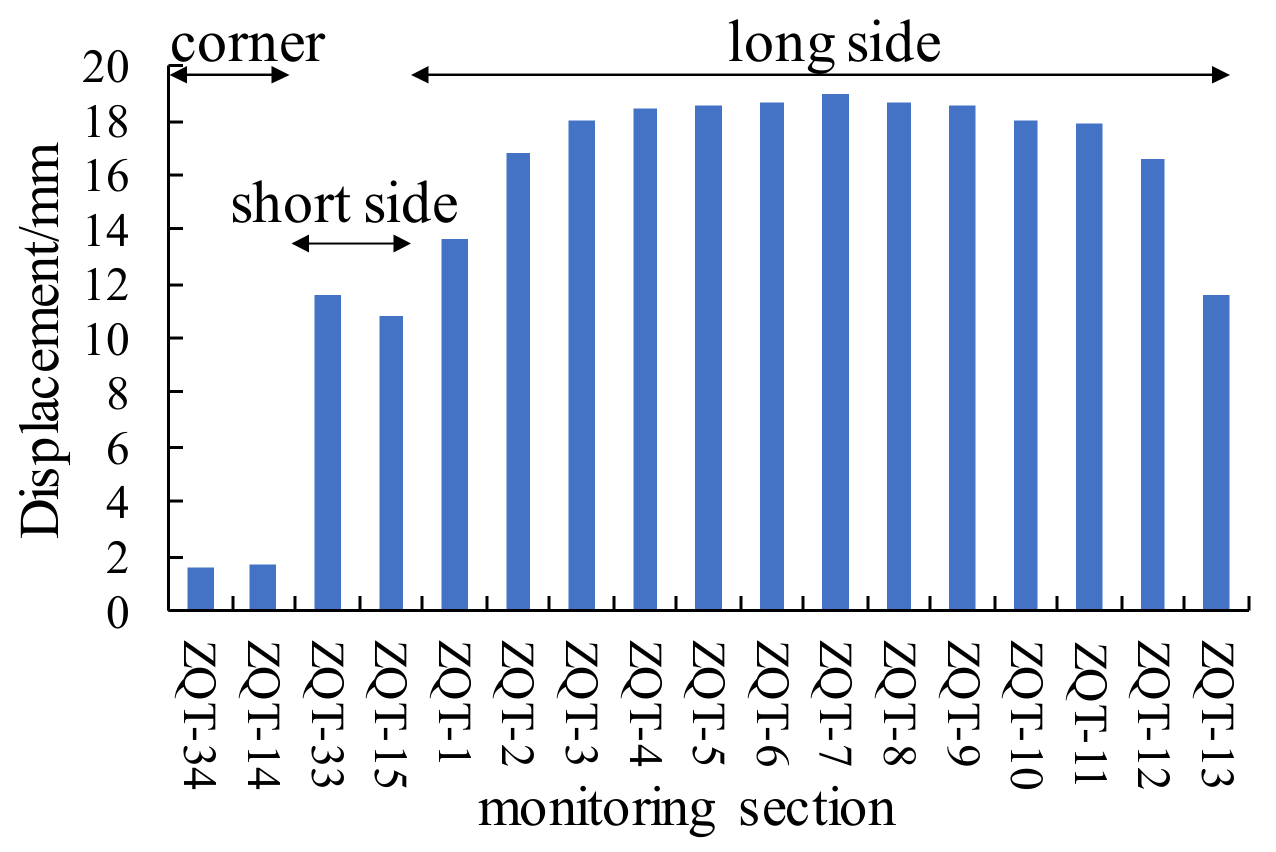
As shown in Figure 5, the maximum horizontal displacements at ZQT-7, ZQT-1, ZQT-34, and ZQT-33 are 17.93 mm, 13.63 mm, 1.54 mm, and 11.63 mm, respectively. After case 1 was completed, the pile’s horizontal displacement at different depths was modest. With the excavation of earthwork, the horizontal displacement of the pile increased steadily, peaking at 1/3 to 1/2 of the pile. The horizontal displacement curve of the pile was small at both ends and large in the middle. Similarly, the spatial effect of horizontal displacement of the pile is obvious, which is shown in Figure 6. The maximum horizontal displacement at ZQT-7 is the largest, followed by ZQT-15, and the smallest at ZQT-14 and ZQT-34. At the corner of the pit, the support structure is constrained by two directions simultaneously, which restrains the development of displacement and force in the area near the pit corner and effectively decreases the deformation of the support structure.
3.2.2. Horizontal Displacement of the Pile Top
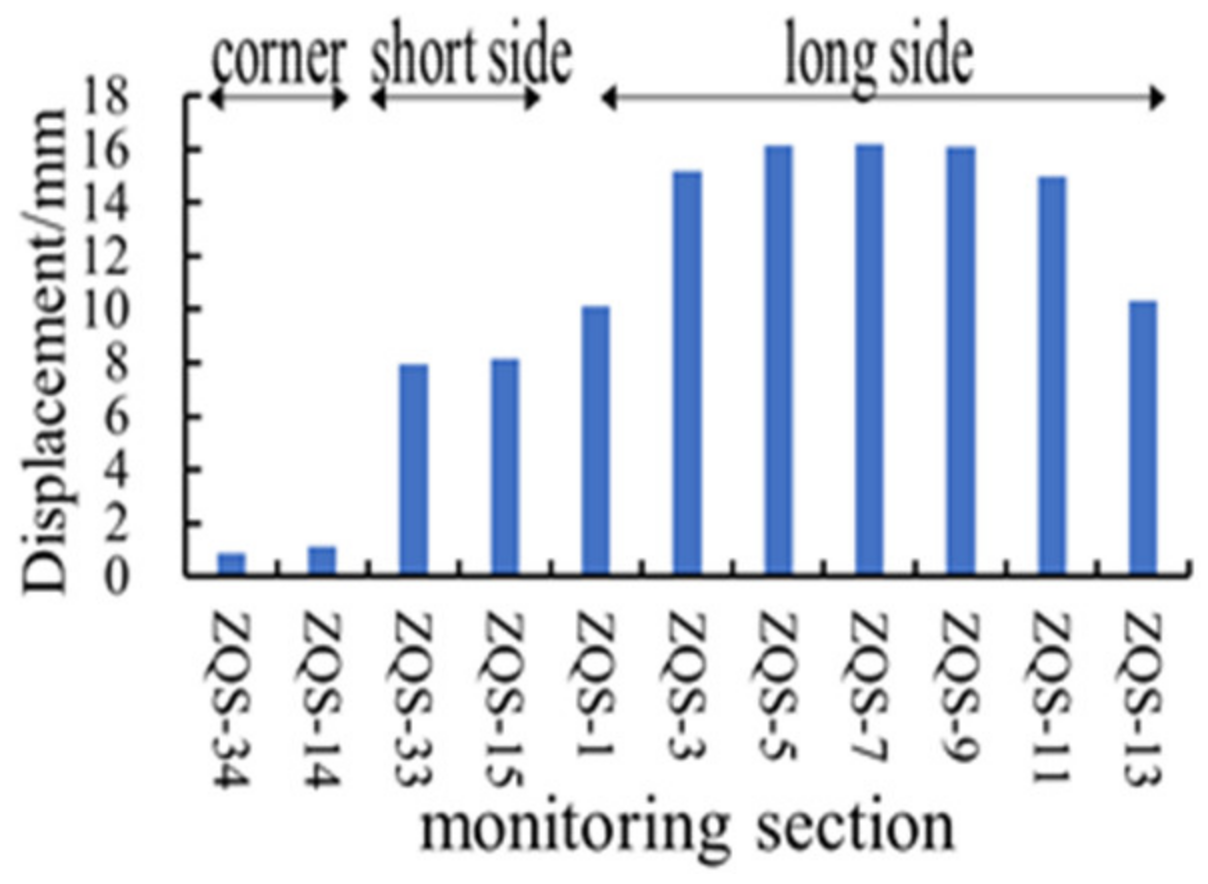
As shown in Figure 7, ZQS-7, which is the horizontal displacement of the pile top in the middle of the long side AB, is the largest (16.18 mm) and the pile top displacement decreases gradually from the middle to the sides of the foundation pit. ZQS-34 and ZQS-14, which are the horizontal displacements of the pile top of the pit corner, are small—1.03 mm and 1.11 mm, respectively. In addition, the horizontal displacements of ZQS-15 and ZQS-33 on the short side are 8.16 mm and 7.97 mm, which are both smaller than the value at ZQS-7 and larger than ZQS-34 and ZQS-14. The distribution of horizontal displacement of the pile top presents an obvious spatial effect.
3.2.3. Ground Settlement
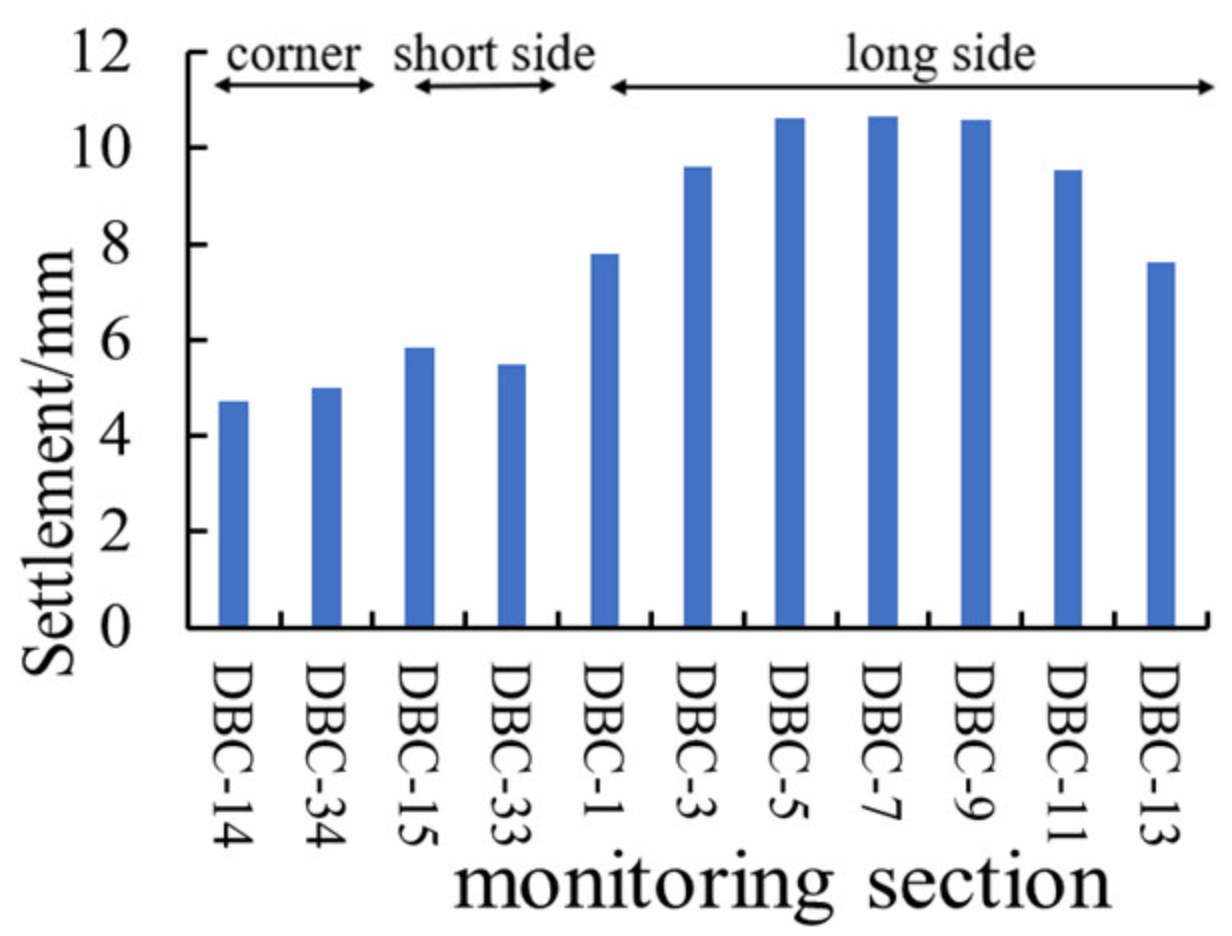
It can be seen from Figure 8 that the maximum value of ground settlement also has an obvious spatial distribution effect. The maximum value of the surrounding ground settlement occurs in the middle of the long side. The variation of ground settlement with working conditions for different monitoring sections is shown in Figure 9. The excavation of the foundation pit will disturb the surrounding strata and cause the ground around the pit to settle. At the early stage of excavation, the ground settlement is small. As the work proceeds, the ground settlement increases significantly and the final settlement value tends to be stable. At the same time, the distribution rule of ground settlement around the pit can be seen: the maximum settlement value is not near the pit edge, but a certain distance away from the pit edge. The maximum settlement position is about 6.5 m away from the pit edge.
After excavation of the foundation pit, the piles lost the support of the original inner soil as the inner soil of the pit was excavated. The piles are subjected to active earth pressure exerted by the pit soil, which causes a change in the stress and displacement fields of the soil around the pit, resulting in deformation and displacement of the support structure, which is consistent with the results in Figure 5.
The same row of piles on each side of the pit is restrained by the waist beam to form a single unit, and the forces of the structure are similar to those of a slab structure. The slab is restrained by the piles on one vertical side at the corner position of the pit and by the soil at the bottom of the pit, with the top of the piles in a free state. Both earth pressure and anchor cable forces act on the slab structure. As a result, the slab structure is subject to large deformations near the middle, with less deformation at the corners of the pit and near the bottom of the pit, in line with the results shown in Figure 6 and Figure 7.
When the piles in the pit are deformed, the soil around the pit is displaced by the active earth pressure, which will fill the space formed by the deformation of the piles and cause the settlement of the ground outside the pit. As the pile deformation in the middle of the pit is greater than the deformation in the corner of the pit, the ground settlement appears similar in nature, with the ground settlement near the middle of the pit being greater than the ground settlement near the corner of the pit, the same as the results in Figure 8.
4. Numerical Simulation
4.1. D Numerical Model
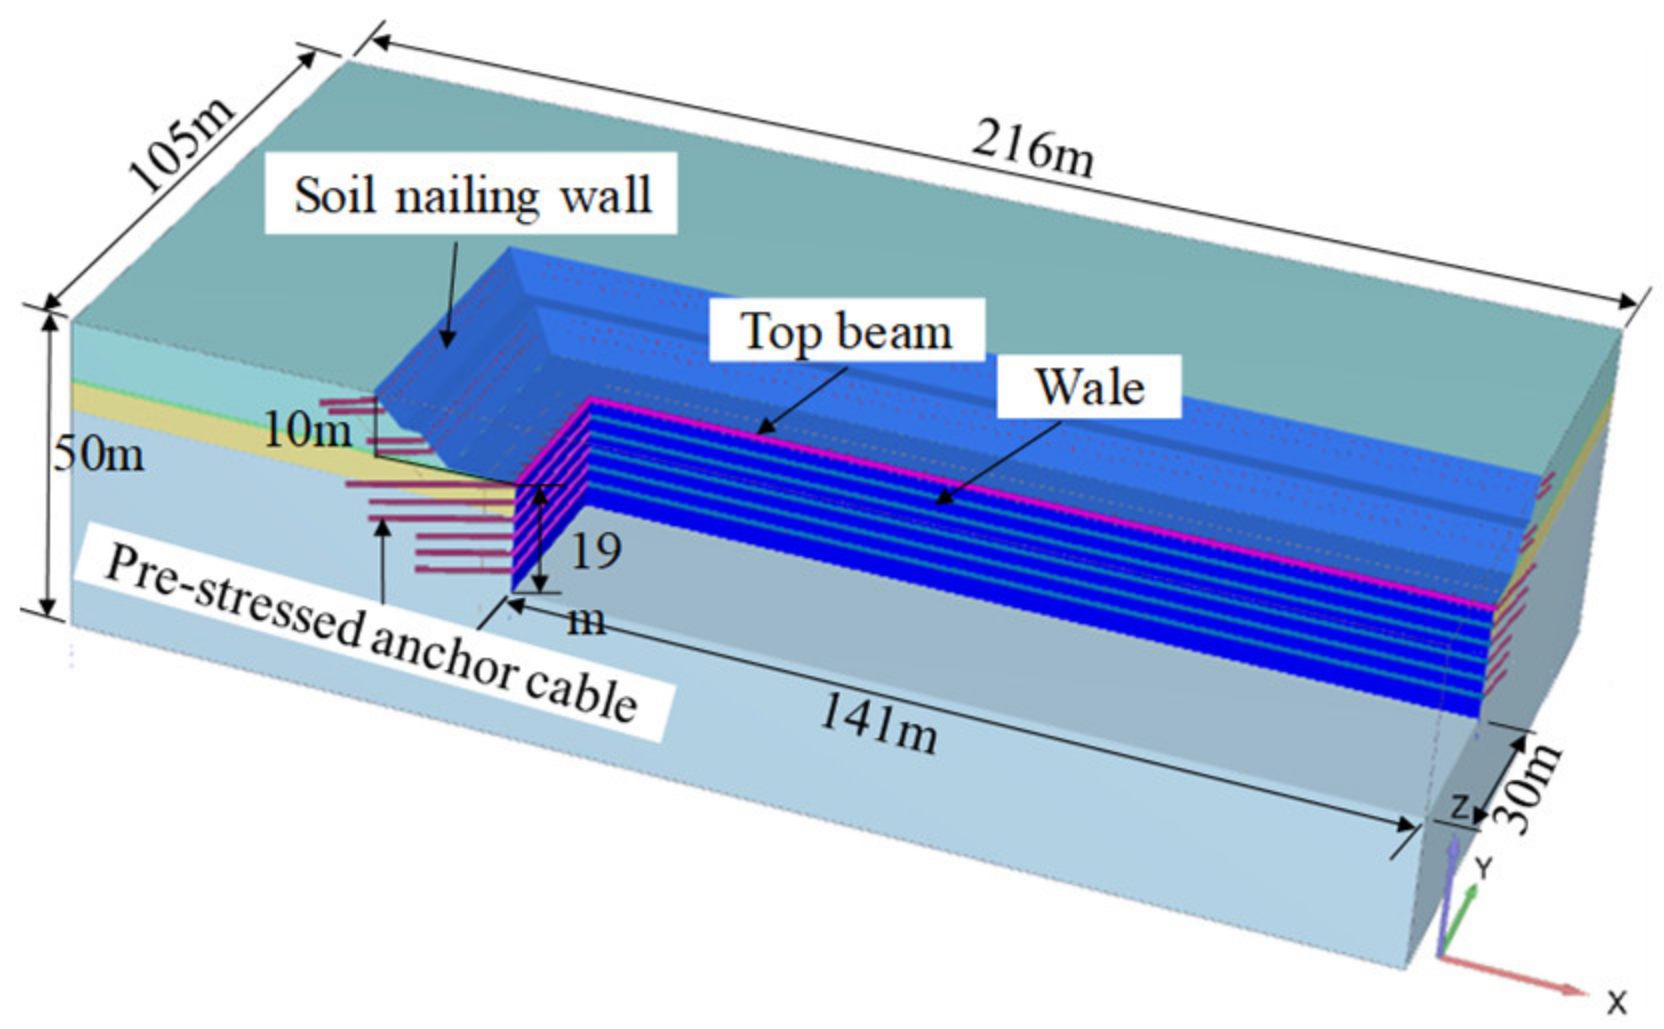
The finite element software is used to simulate the excavation of the foundation pit. To simplify the calculation and eliminate the influence of the model size effect, 1/4 of the foundation pit is chosen for modeling. The model size is 216 m × 105 m × 55 m. Figure 10 shows the 3D finite element model. All soil layers are modeled using the hardening soil (HS) model. The HS model considers not just the non-linear features of soil, but also the complex stress patterns associated with deep foundation construction. Compared with other soil principal structure models, the hardened soil principal structure model is more suitable for the calculation and analysis of deep foundation works [26,27]. At the same time, the model was considered to have the following assumptions: (1) the relative slip generated on the contact surface between the support structure and the surrounding soil is not considered, and they are considered to be in a state of coordinated deformation at all times; (2) only the initial stresses in the self-weight stress field are considered and the tectonic stress field is not considered, so that the soil layer reaches equilibrium under self-weight and then the excavation of the pit is simulated; (3) the sequence of construction steps is used to simulate the whole construction process.
The embedded beam unit is used to simulate soil nail support. The top of soil nailing is set as a rigid connection model with the concrete wall so that its displacement and rotation are consistent. The main parameters of soil nailing are shown in Table 3. The slope hanging shotcrete and the same row of bored piles are simulated by the plate element, and the relevant parameters are shown in Table 4. The equal stiffness substitution between the same row of bored piles and the plate is calculated by the following formula [28]:
where D is the diameter of the bored cast-in-place pile; t is the net distance between the two piles; h is the thickness of the equivalent plate.
The bolt element simulates the prestressed anchor cable’s free part, whereas the embedded beam element simulates the anchoring section. Table 5 shows the main parameters. The interface element simulates the interaction between soil and structure. The discounting factor for interface strength Rinter takes into account the soil’s cohesion and internal friction angle, and the interface represents the strength relationship between soil and structure through the discounted internal friction angle and cohesion [12], with Rinter set at 0.65.
Due to the precipitation measures taken before construction, the influence of groundwater is not under consideration during the simulation process. The mesh is divided using a finite element mesh cell with 10-node tetrahedral cells. Boundary conditions of the model are established in accordance with actual circumstances. The four sides of the model have fixed constraints, the bottom of the model has fixed restrictions and the top surface of the model is free. Figure 11 represents the model’s three-dimensional mesh. The specific processes of slope excavation, soil nail wall construction, and shotcrete surfacing are not discussed in this paper.
4.2. Simulation Results and Comparative Analysis
4.2.1. Comparison of Simulation Results
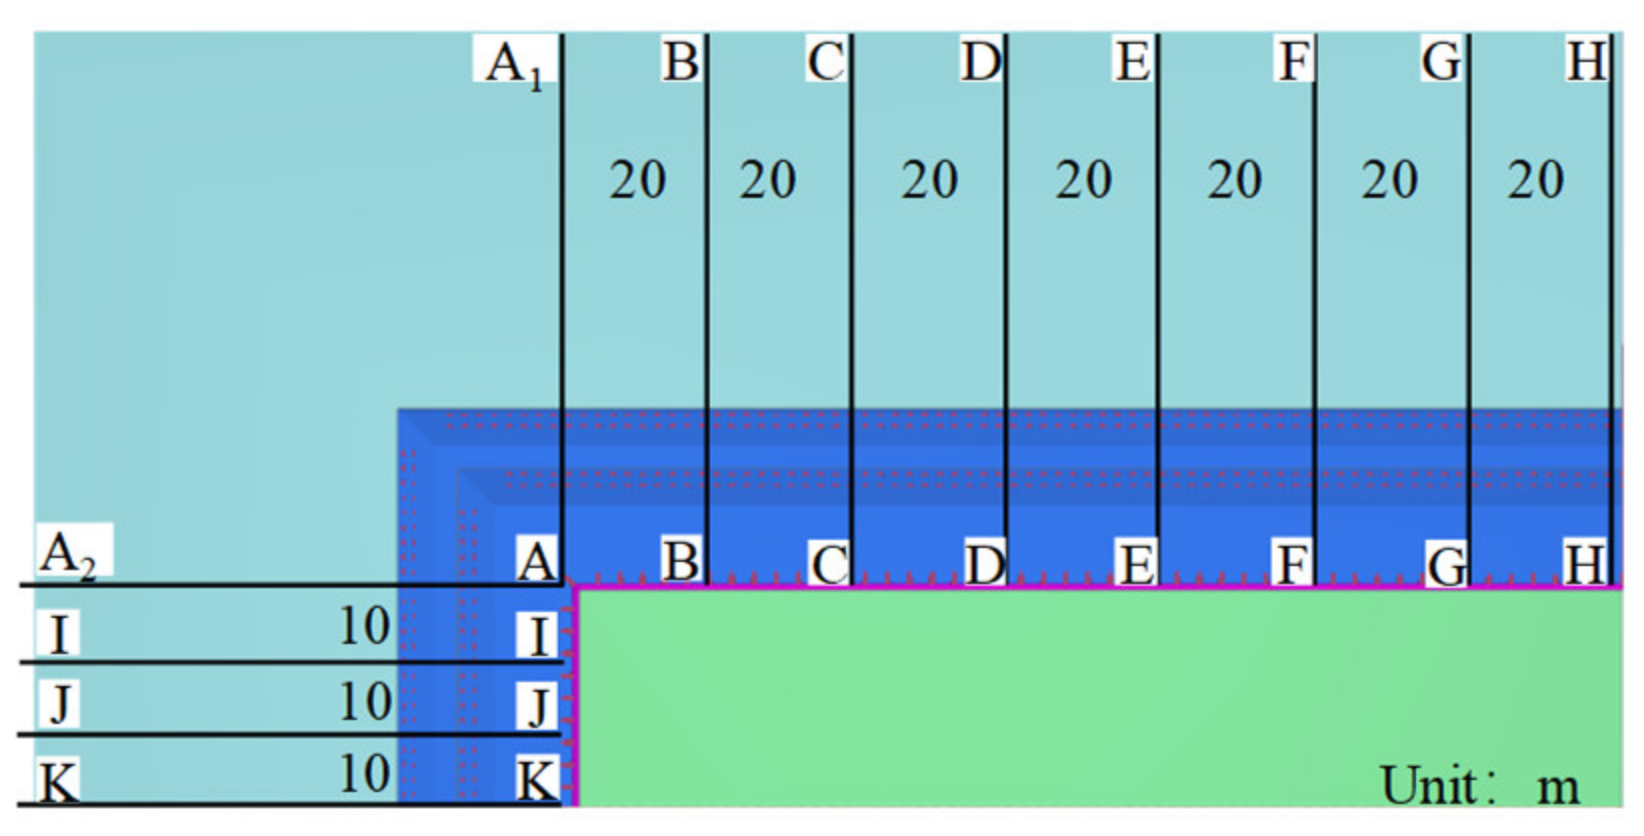
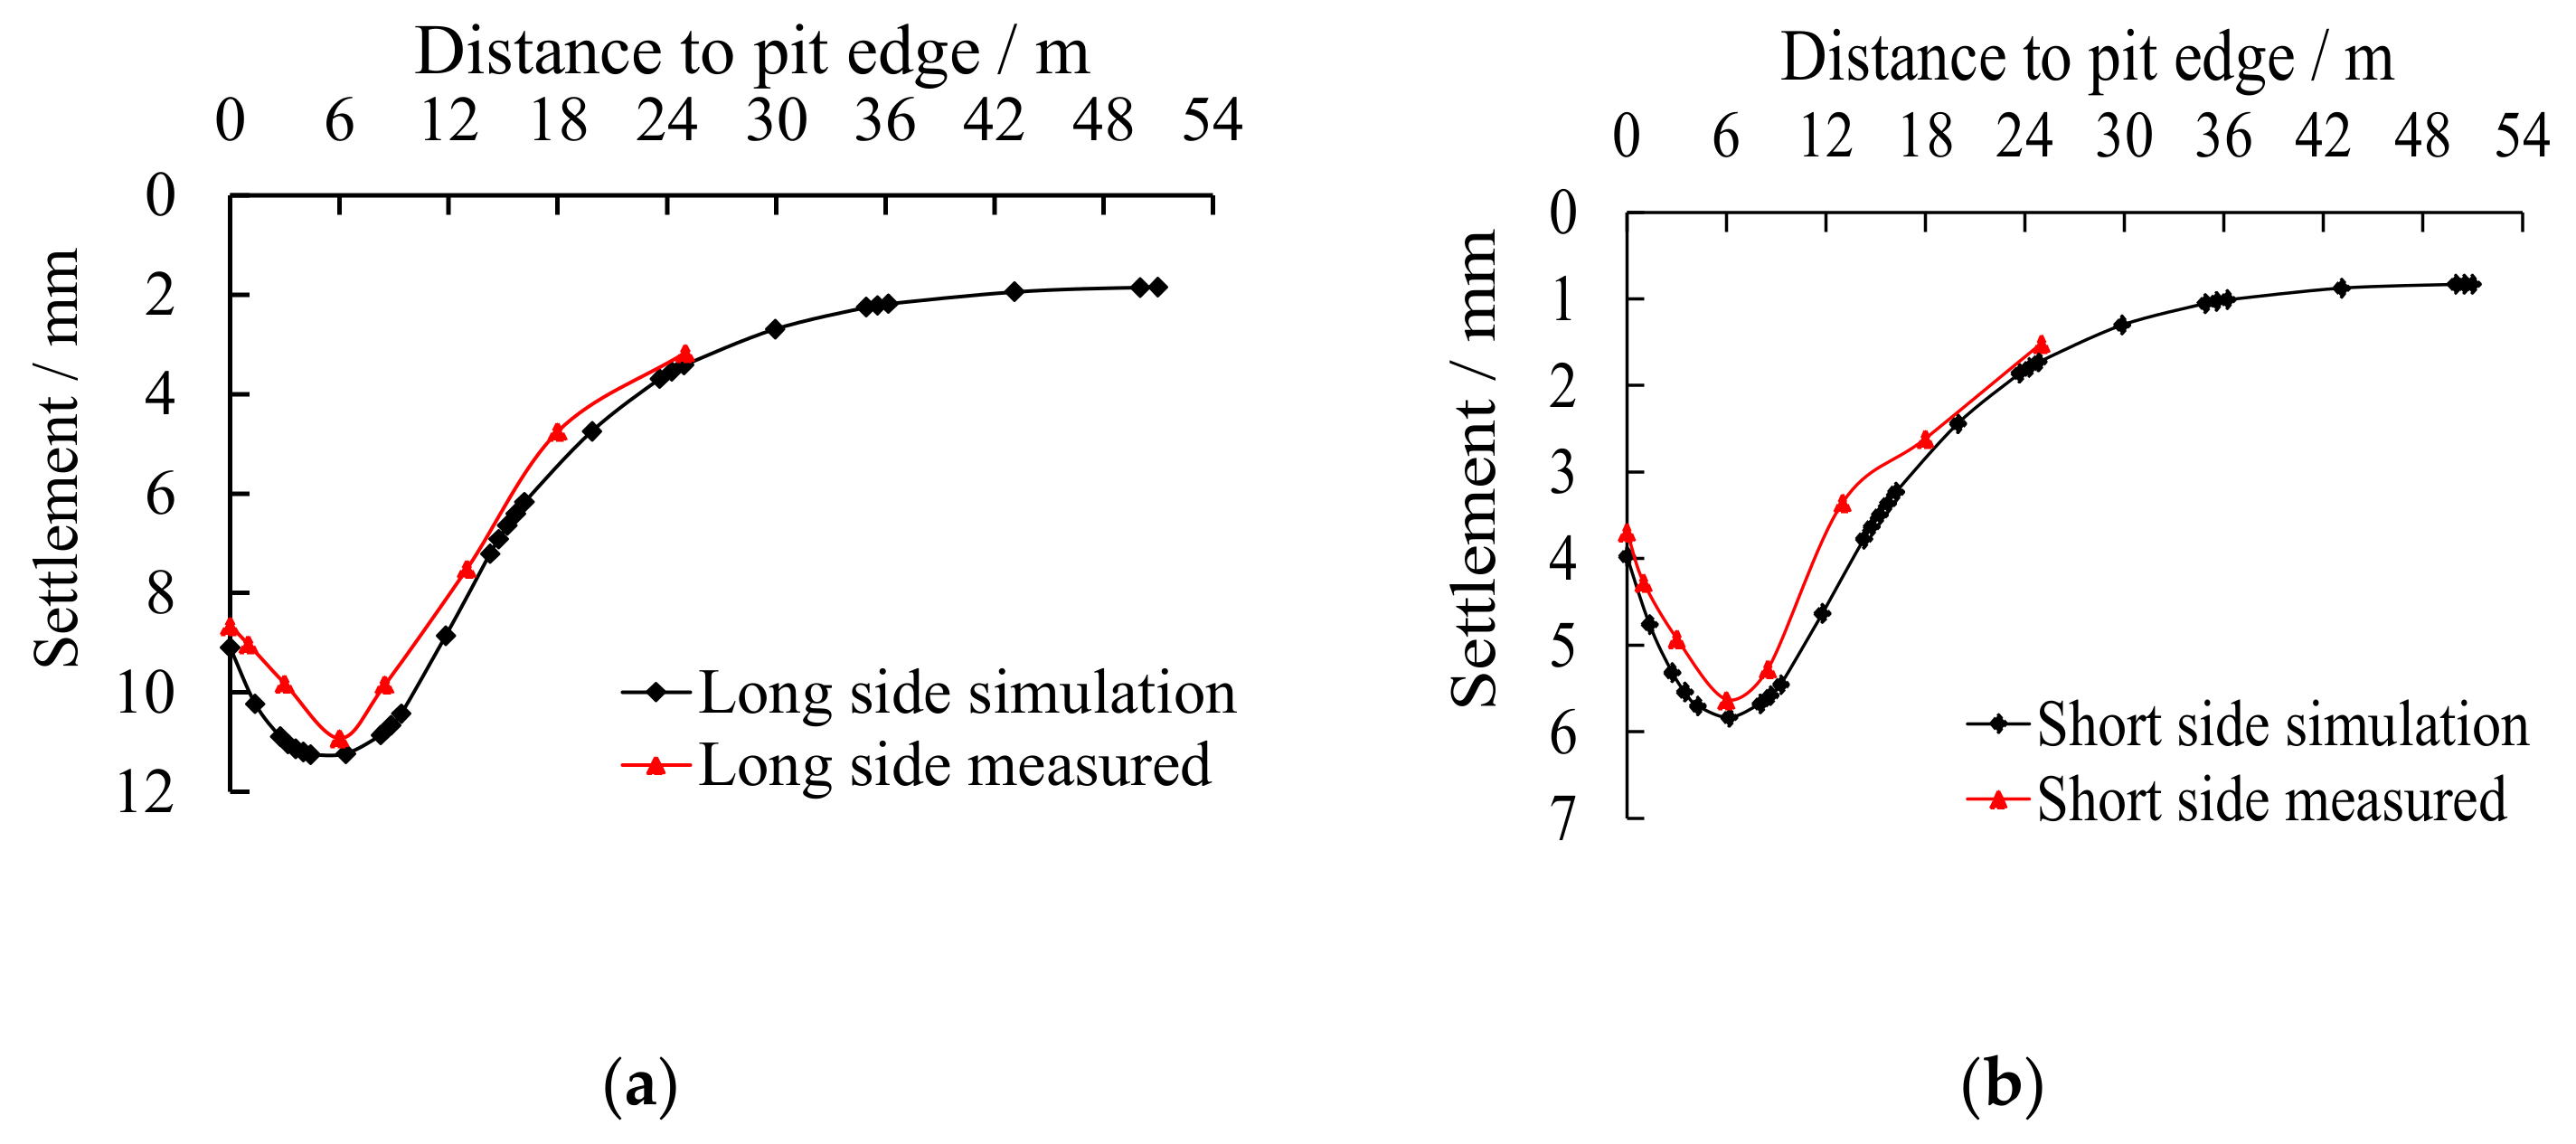
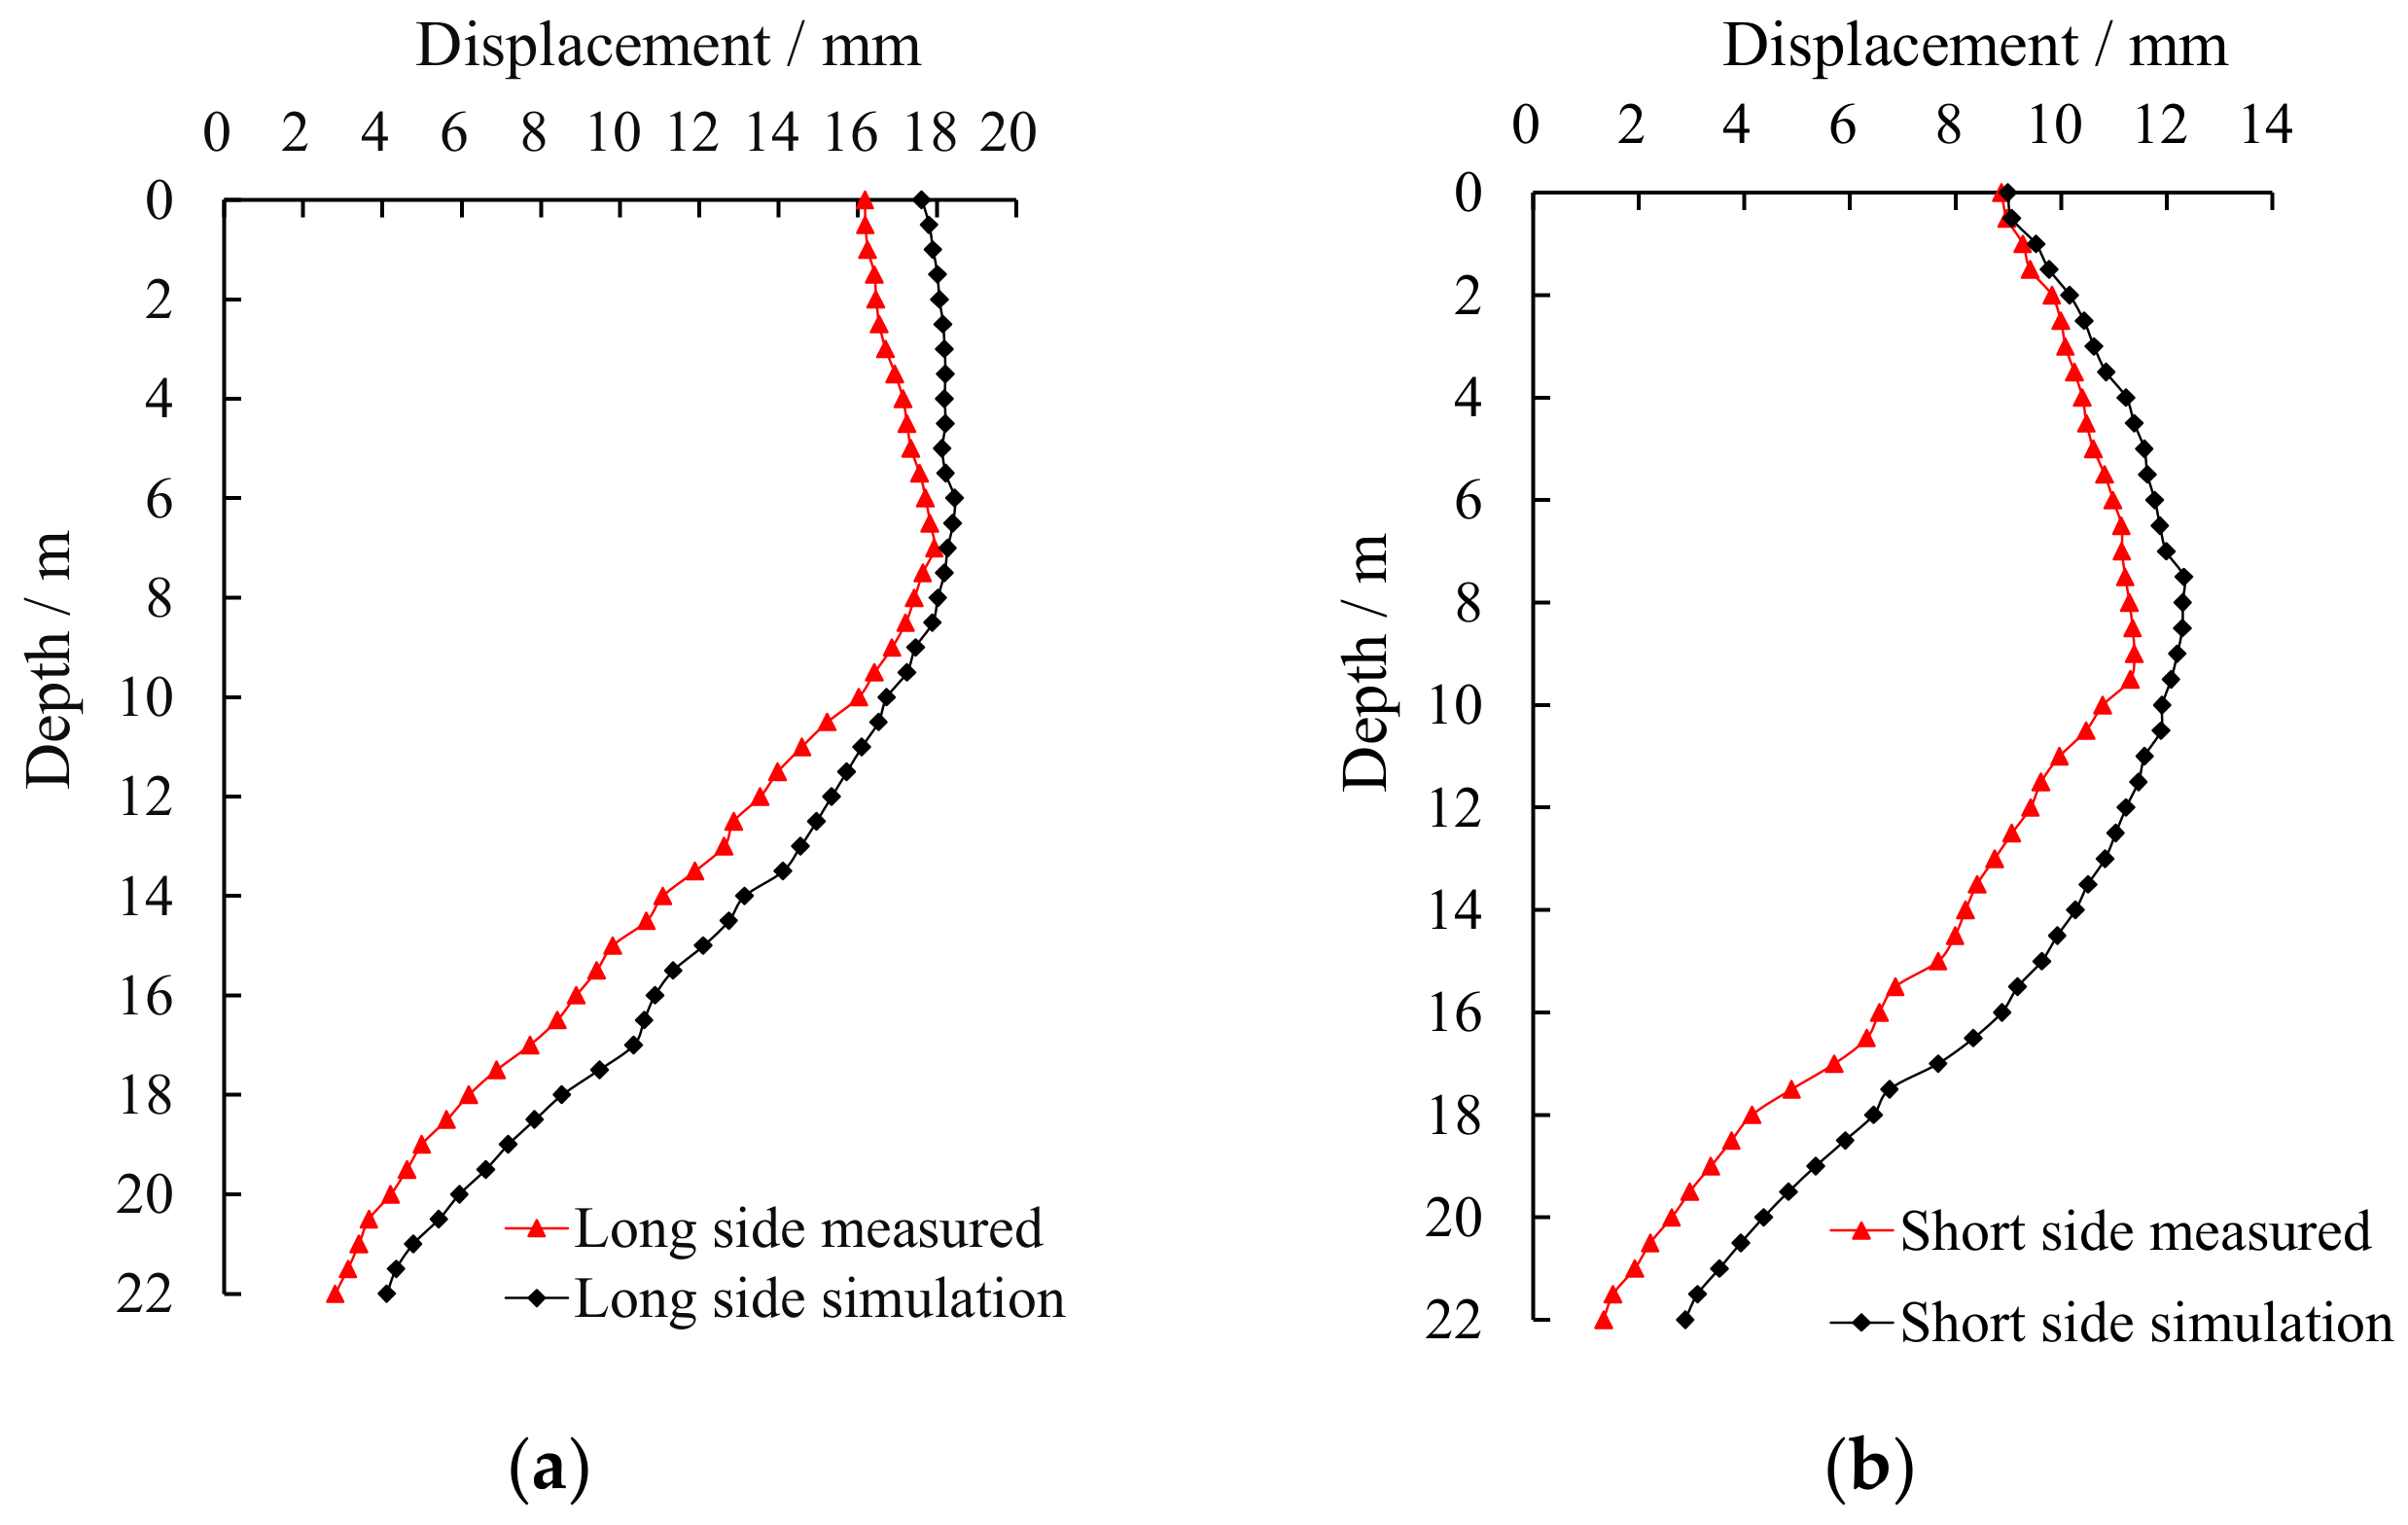
Several primary sections are chosen for analysis based on the monitoring sites, and properly characterize the 3D spatial stress and deformation of the foundation pit. The sections are shown in Figure 12. The HH section on the long side and the KK section on the short side of the foundation pit are selected to compare ground settlements, horizontal displacement of the pile’s top, and the horizontal displacement of piles at various depths. The results are shown in Figure 13, Figure 14 and Figure 15.
As can be seen from Figure 13, the measured values of ground settlement at sections HH and KK are both less than the calculated values and the curve of settlement morphology in the shape of “groove” and the maximum settlement occurs around 6 m away from the edge of the pit. The simulated maximum values of sections HH and KK are 11.25 mm and 5.83 mm, respectively, more than 0.31 mm and 0.20 mm from the measured values.
Figure 14 shows that the horizontal displacement of the pile top at the pit corner is obviously less than that at the middle, no matter the measured value or the simulated value. Although the simulated values are slightly larger than the measured values, the deformation trends are consistent. The result illustrates that the spatial effect of pit deformation through the 3D simulation is correct.
It can be seen from Figure 15 that the measured horizontal displacements of the pile at sections HH and KK are slightly smaller than the calculated value. The deformation curve is the same trend for both. The curve of pile at section HH is in the shape of a “belly drum”, in which the bottom is very small and the middle and upper are large. The curve of the horizontal displacement of the pile at section KK is in the shape of a “bow”. The maximum horizontal displacements simulated for sections HH and KK were 18.44 mm and 12.32 mm, which were located 6.5 m and 7.5 m below the pile top, respectively. The measured maximum horizontal displacements were 17.43 mm and 11.38 mm, which occurred at 7.0 m and 9.0 m below the pile top, respectively.
It can be seen from the above comparison results that the numerical model in this paper can reflect the deformation of pile anchor support structure during excavation in red sandstone area moderately.
4.2.2. Spatial Effect Analysis
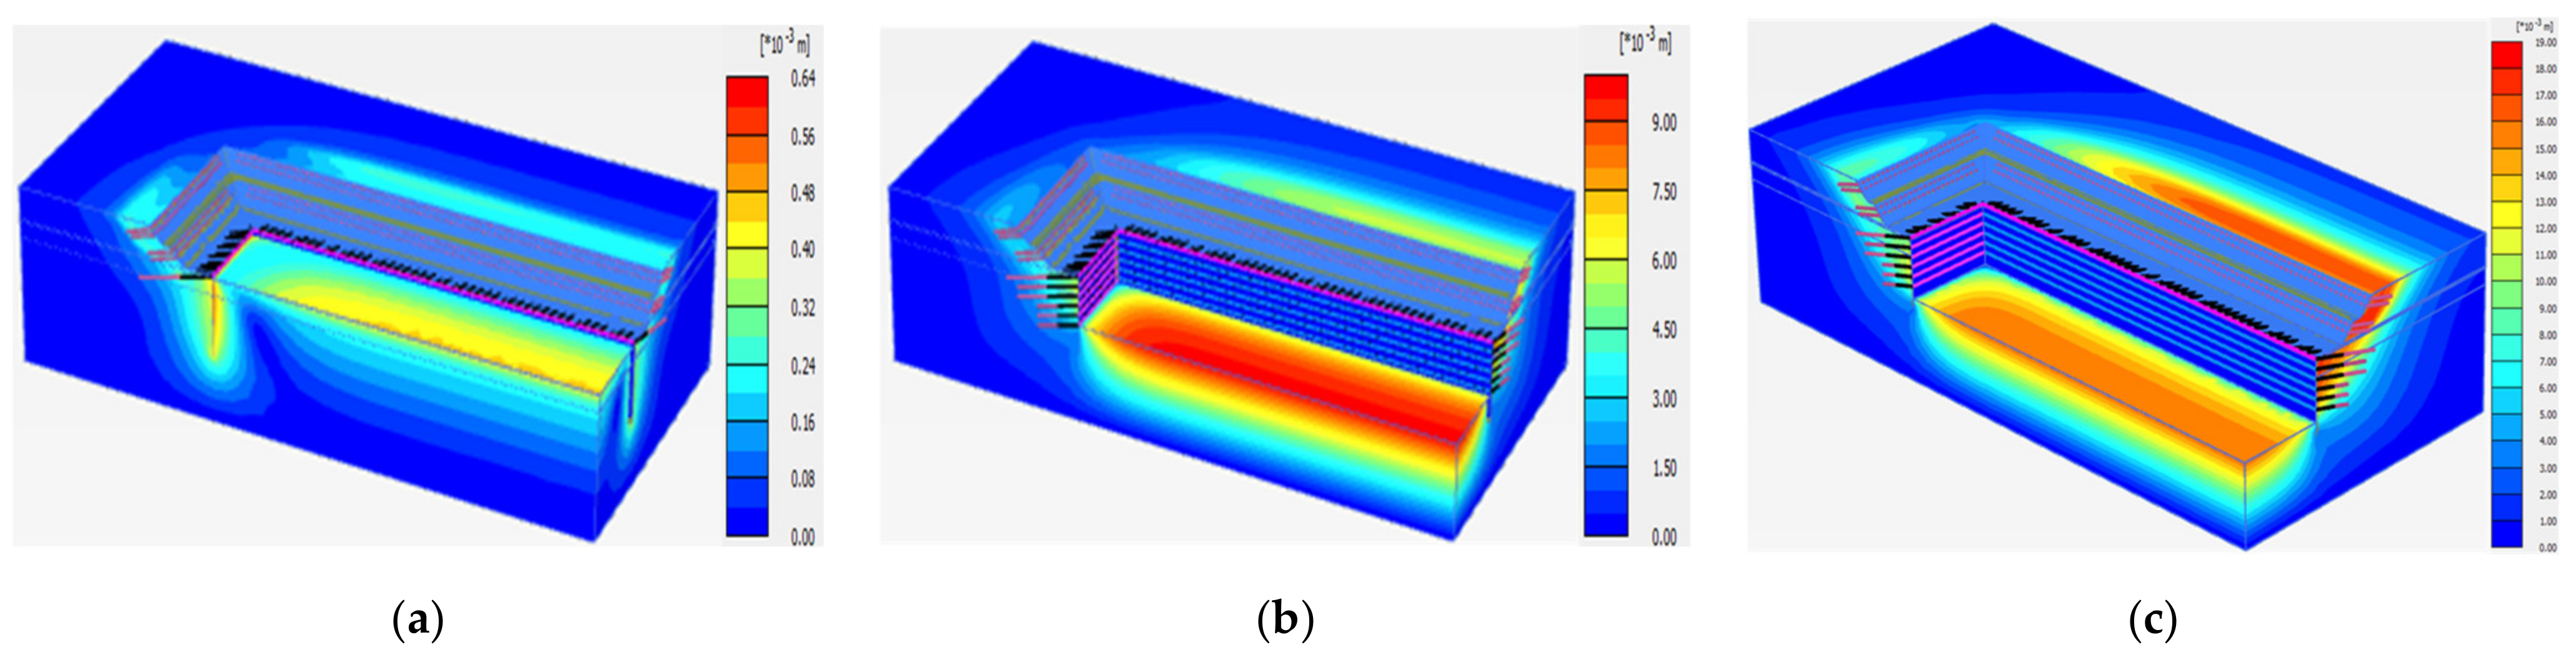
Figure 16 shows the spatial distribution of pit deformation during excavation under several typical working conditions. It can be seen from the figure that, as the advance of the working condition, the amount of surface settlement perpendicular to the edge of the pit and the extent of the occurrence of surface settlement gradually increase. The overall deformation of the pit shows a spatial effect during excavation, with the deformation in the middle of the pit being significantly larger than the deformation in the corners of the pit.
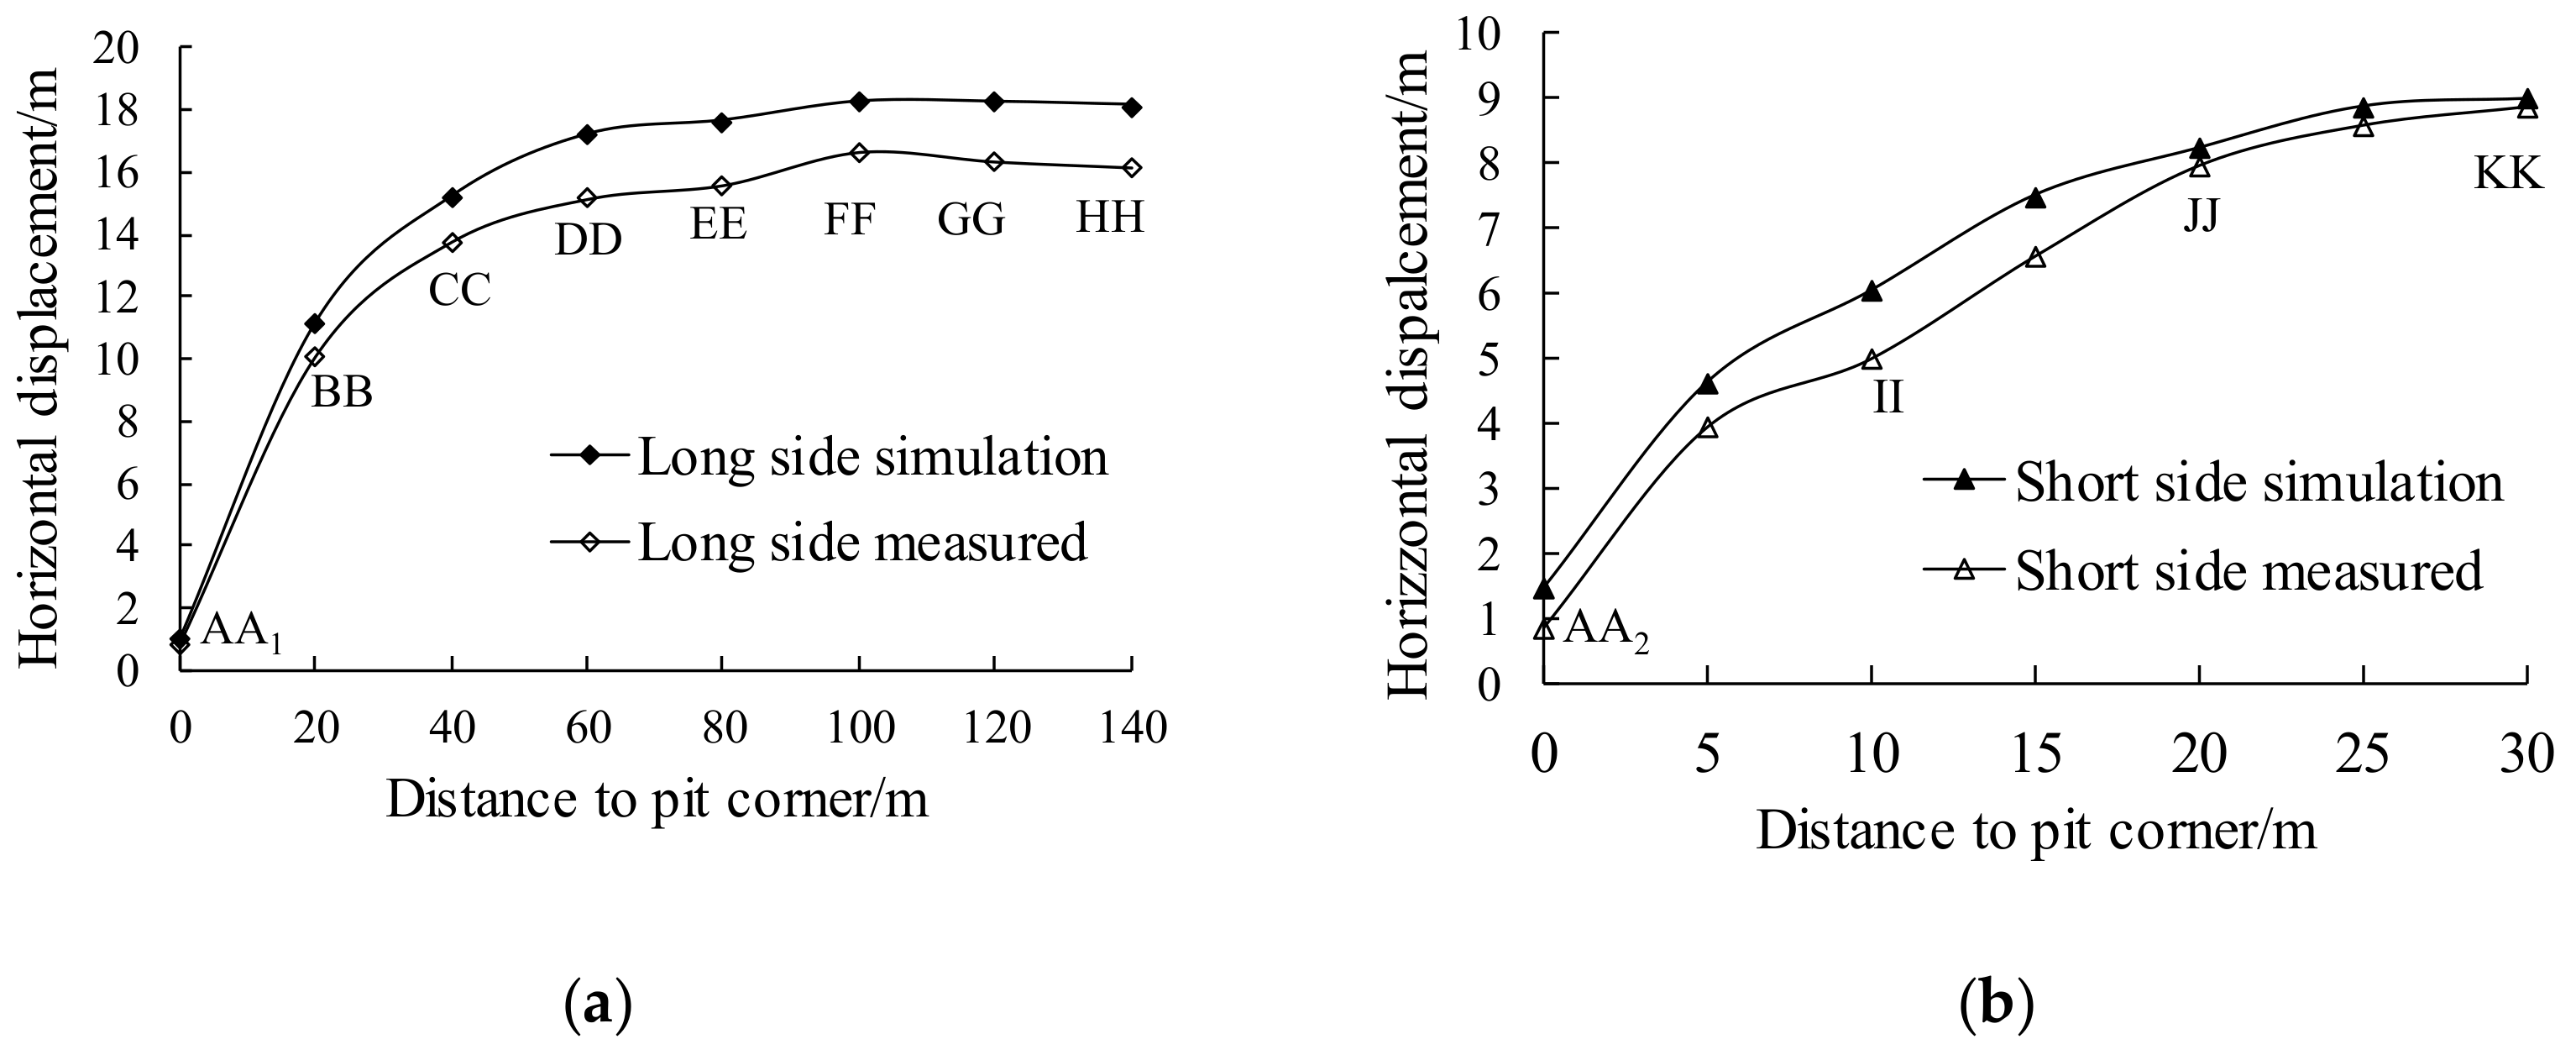
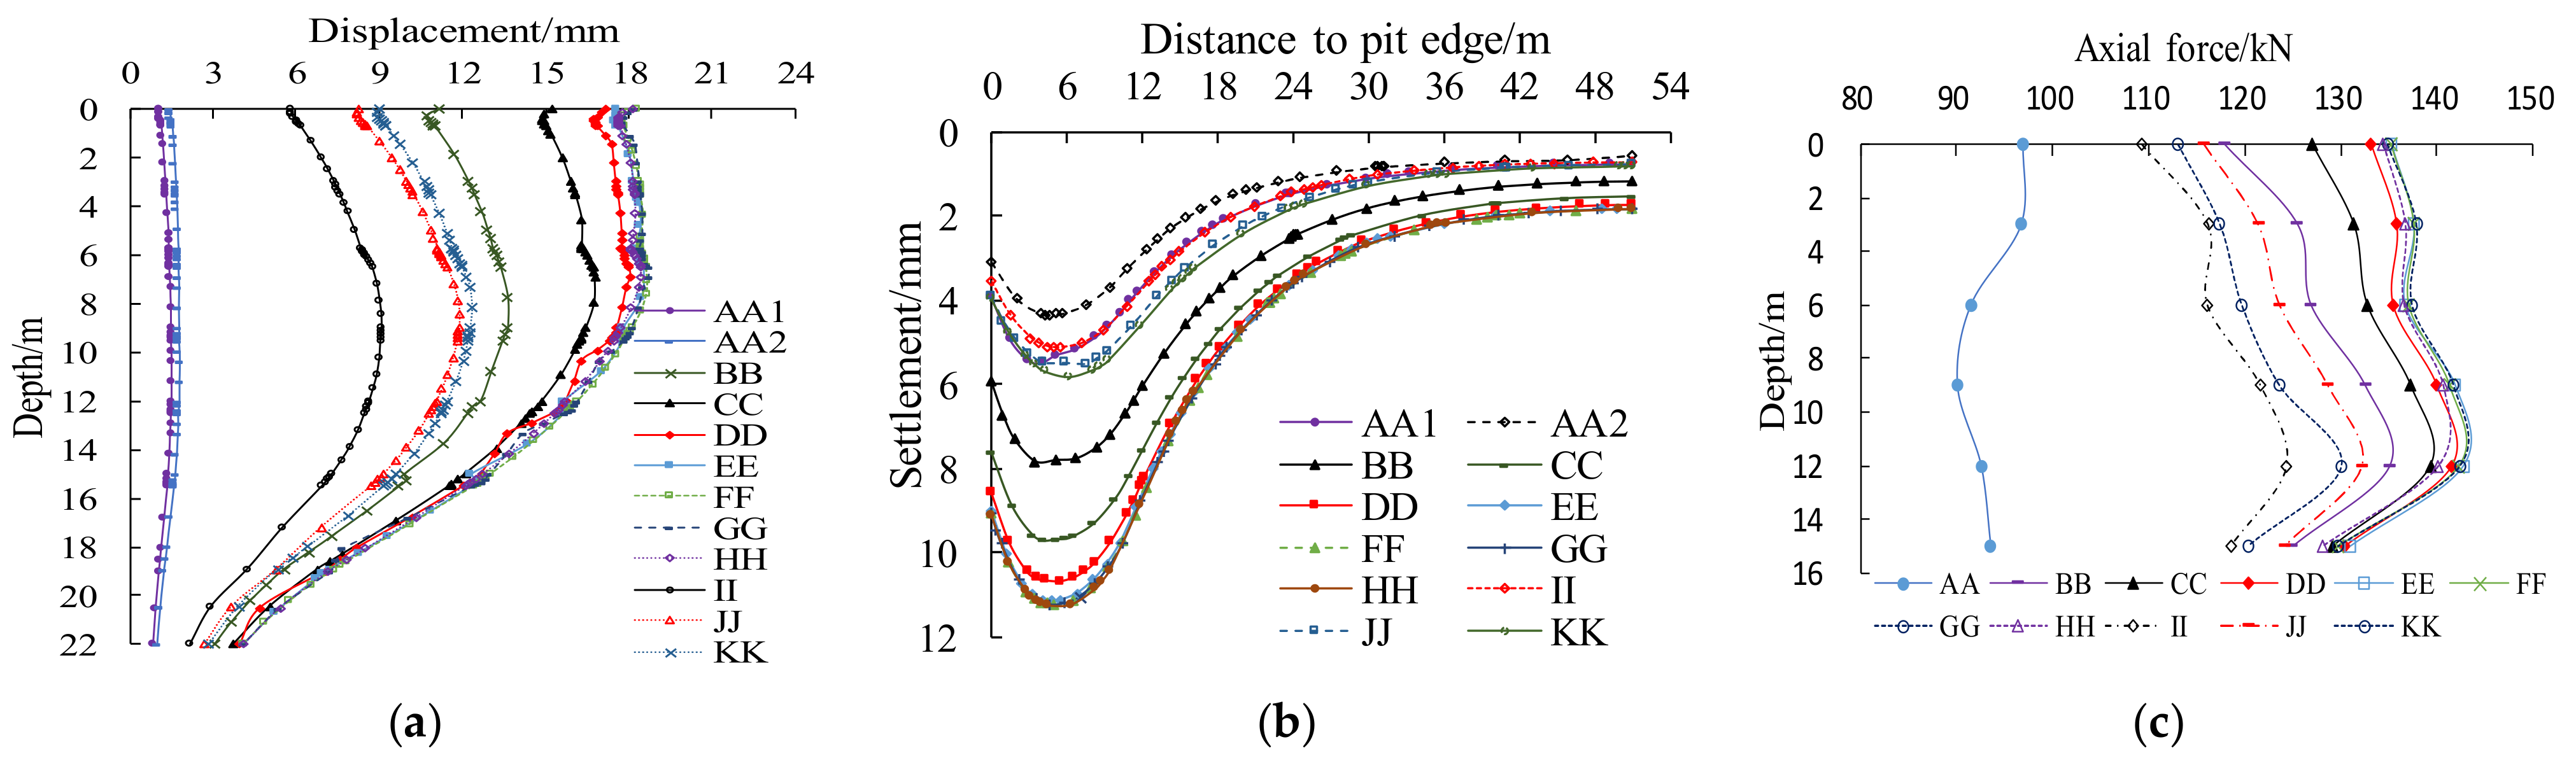
The deformation of the pile, as can be seen from Figure 17a, presents obvious spatial characteristics. The horizontal displacement of the pile at the foundation pit’s corner is the smallest. With the increase of the distance from the pit corner, the horizontal displacement of the pile gradually increases and reaches the maximum value at a certain distance from the corner. From sections AA1 to HH, the horizontal displacement curve of the pile changes from “bow” to “belly drum”. Moreover, the curve shape keeps the same “bow” from sections AA2 to KK.
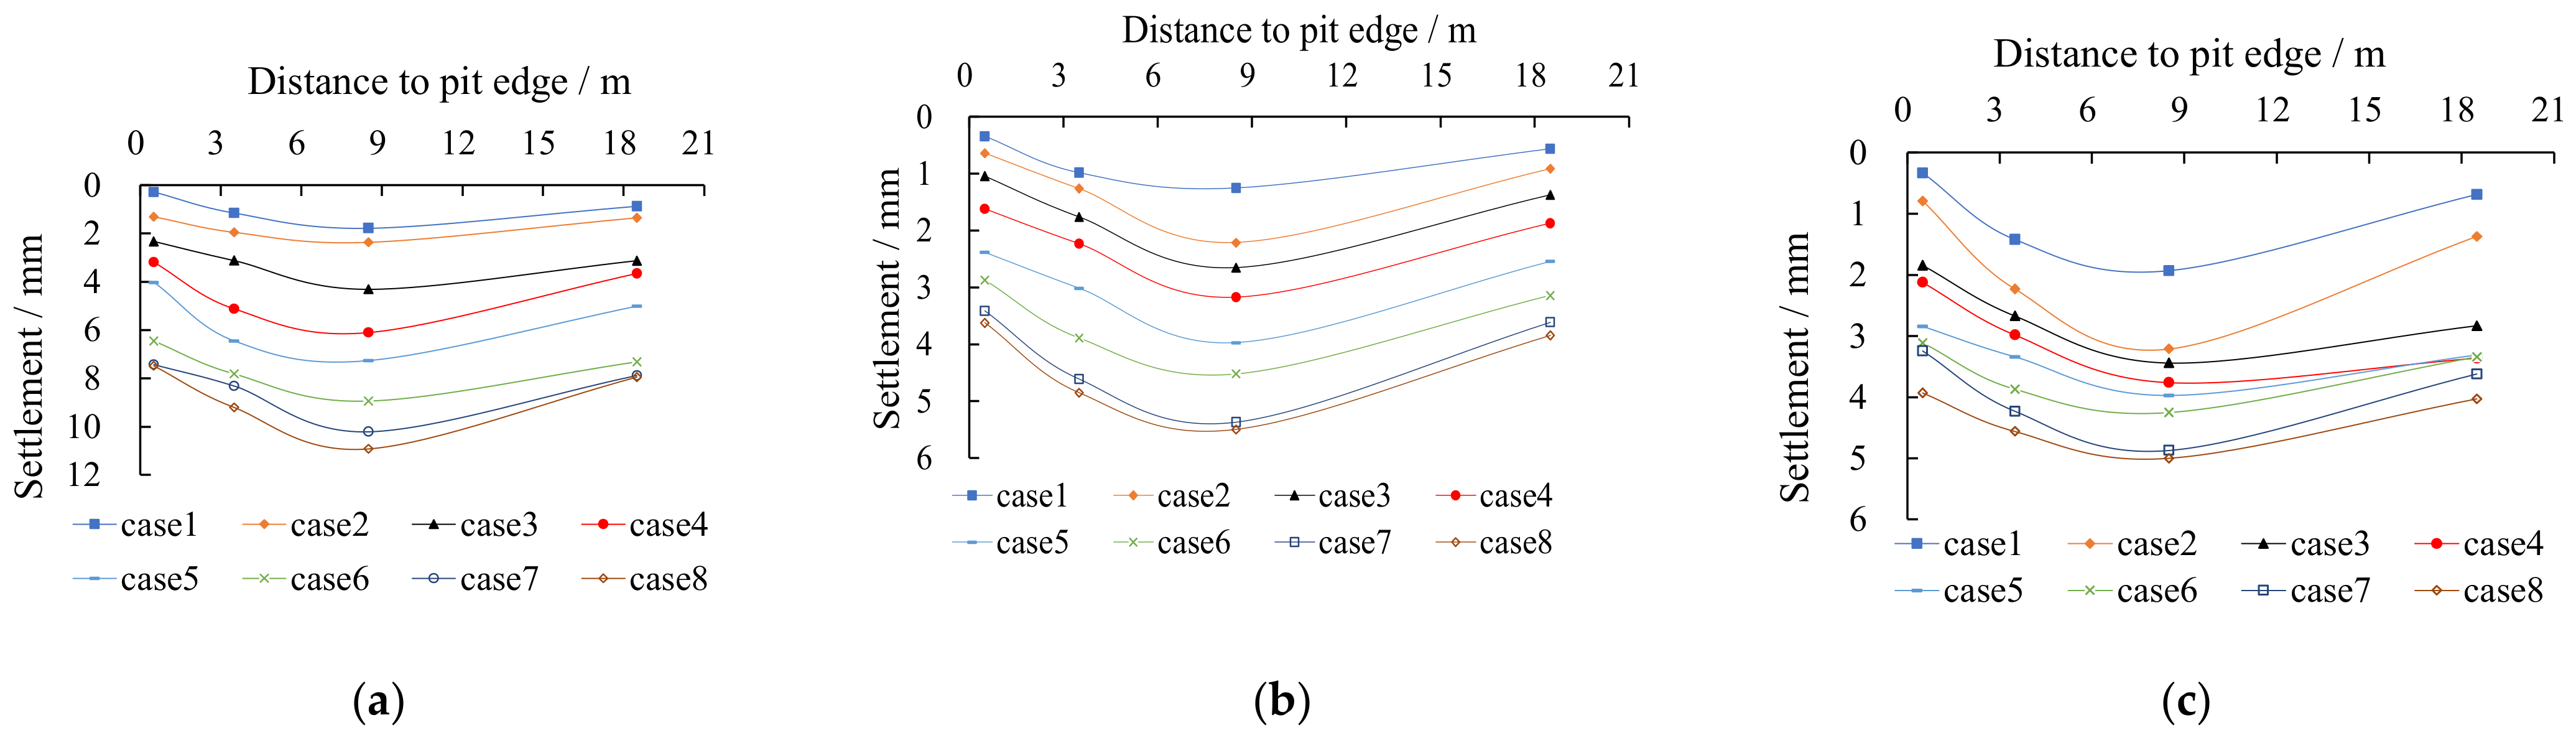
It can be seen from Figure 17b that the ground settlement is distributed along the long side with an obvious spatial effect, with the settlement at the pit corner being smaller than that at the middle. The ground settlement perpendicular to the pit edge also has a spatial effect as well: when approaching the middle of the pit, the ground settlement tends to grow at first and then subsequently diminishes.
As can be seen from Figure 17c, the axial force of the anchor cable presents a spatial effect consistent with the horizontal displacement of the pile and ground settlement in the direction of the long side. Meanwhile, the axial force also presents a certain degree of spatial effect along with the depth of the pit. The distribution curve of axial force is approximately parabolic and reaches its maximum value at the fifth cable.
In Figure 17, the horizontal displacement, ground settlement and axial force at section JJ are smaller than that at section BB. Sections JJ and BB are at the same distance from the foundation pit corner. In addition, Figure 13 shows that the displacement of the pile top along the short side is smaller than the long side, while the two sections have the same distance from the pit corner. To a certain extent, the spatial effect of the direction of the short side of the pit is more obvious than that of the long side.
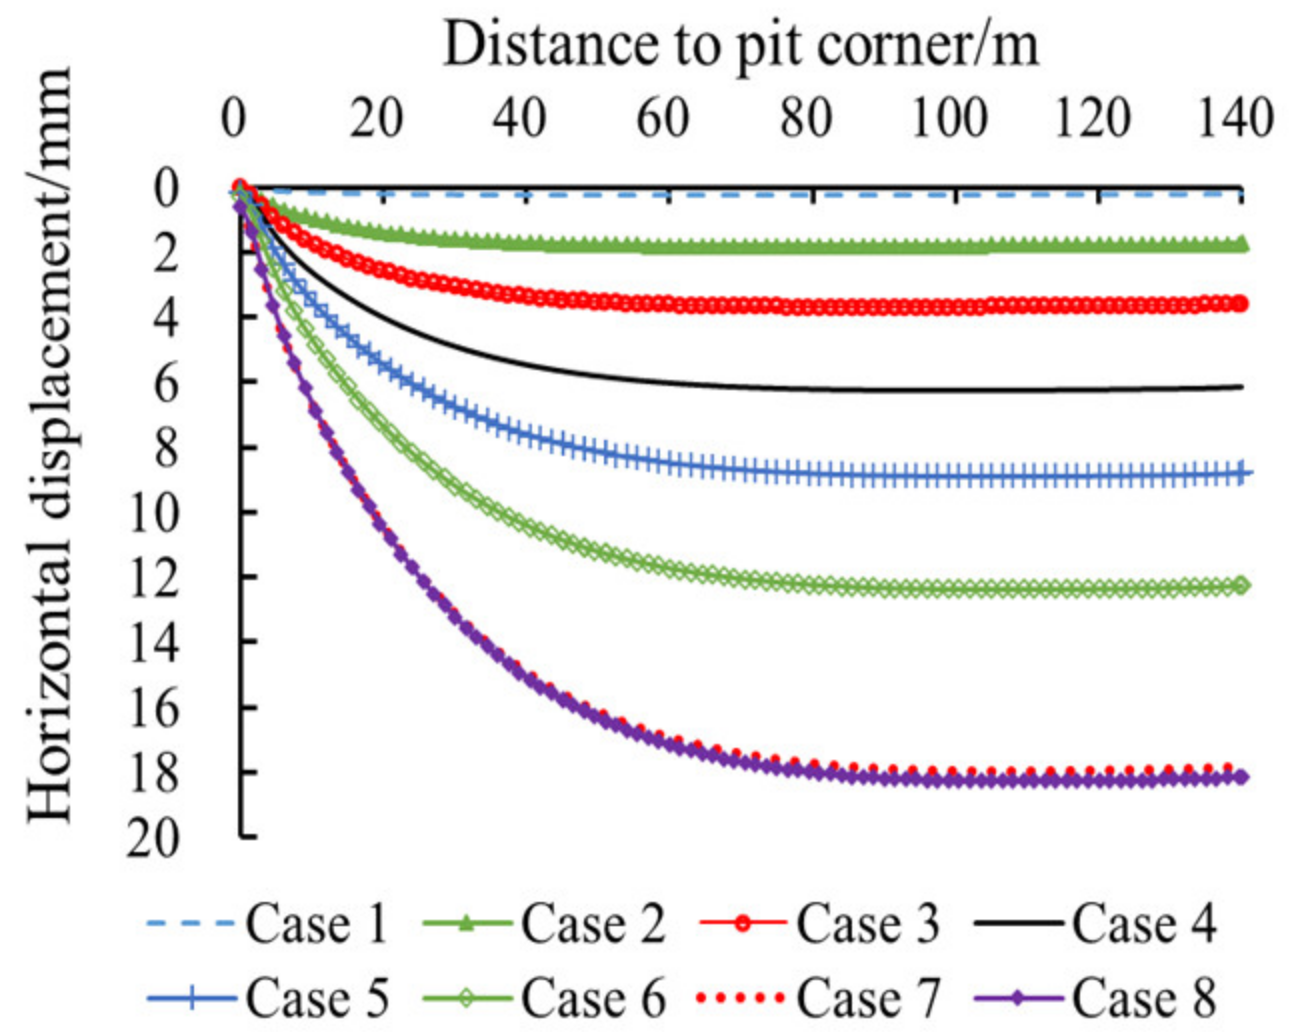
As can be seen from Figure 18, the horizontal displacement of the pile top gradually increases from the pit corner to the middle of the long side and remains stable at a certain distance from the pit corner. With excavation cases from 1 to 8, the spatial effect influence range is 3 m, 19 m, 35 m, 48 m, 60 m, 78 m, 92 m, and 92 m, respectively. With the increase of excavation depth, the influence of spatial effect also increases, and the scope of influence is 0~92 m, which is about five times the excavation depth. Beyond this scope, the displacement is almost unchanged. The short side of the pit in this project is greatly affected by the spatial effect. Within 98 m in the middle of the direction of the long side, it is less affected. In this case, it can be calculated according to the two-dimensional strain method.
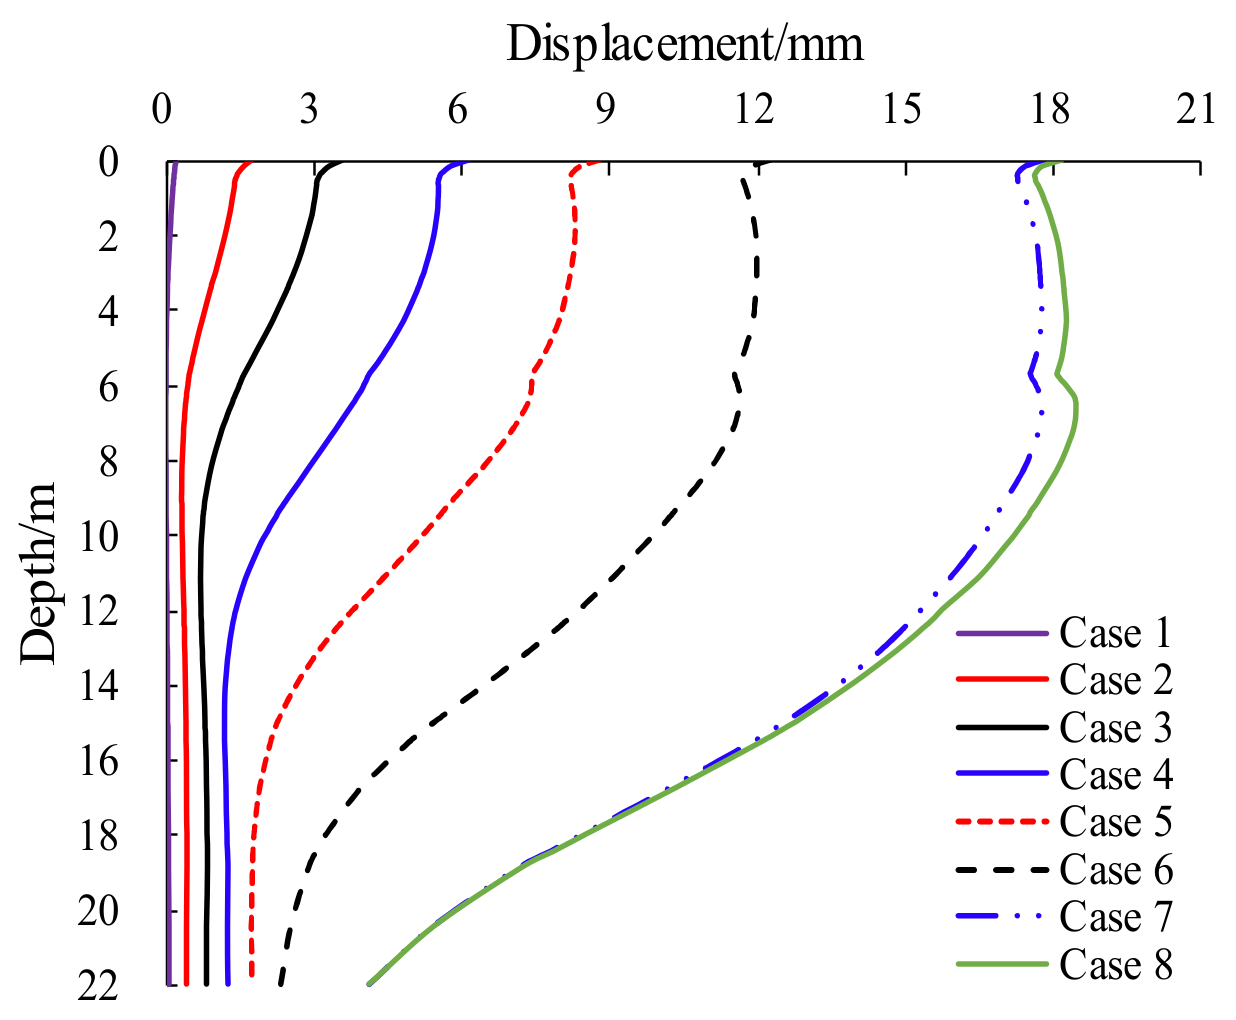
As can be seen from Figure 19, with the excavation and support of the pit, the horizontal displacement of the pile gradually increases, and the deformation tends to be stable at case 7. The shape of the deformation curve changed from “cantilever” to “belly drum”. The maximum value occurs between 6.0~8.0 m, which is about 1/3 of the length of the pile. In addition, it can be found that with the increase of the excavation depth, the difference of horizontal displacement of piles in adjacent cases keeps increasing, so the influence range of the spatial effect tends to increase with the increase of the excavation depth.
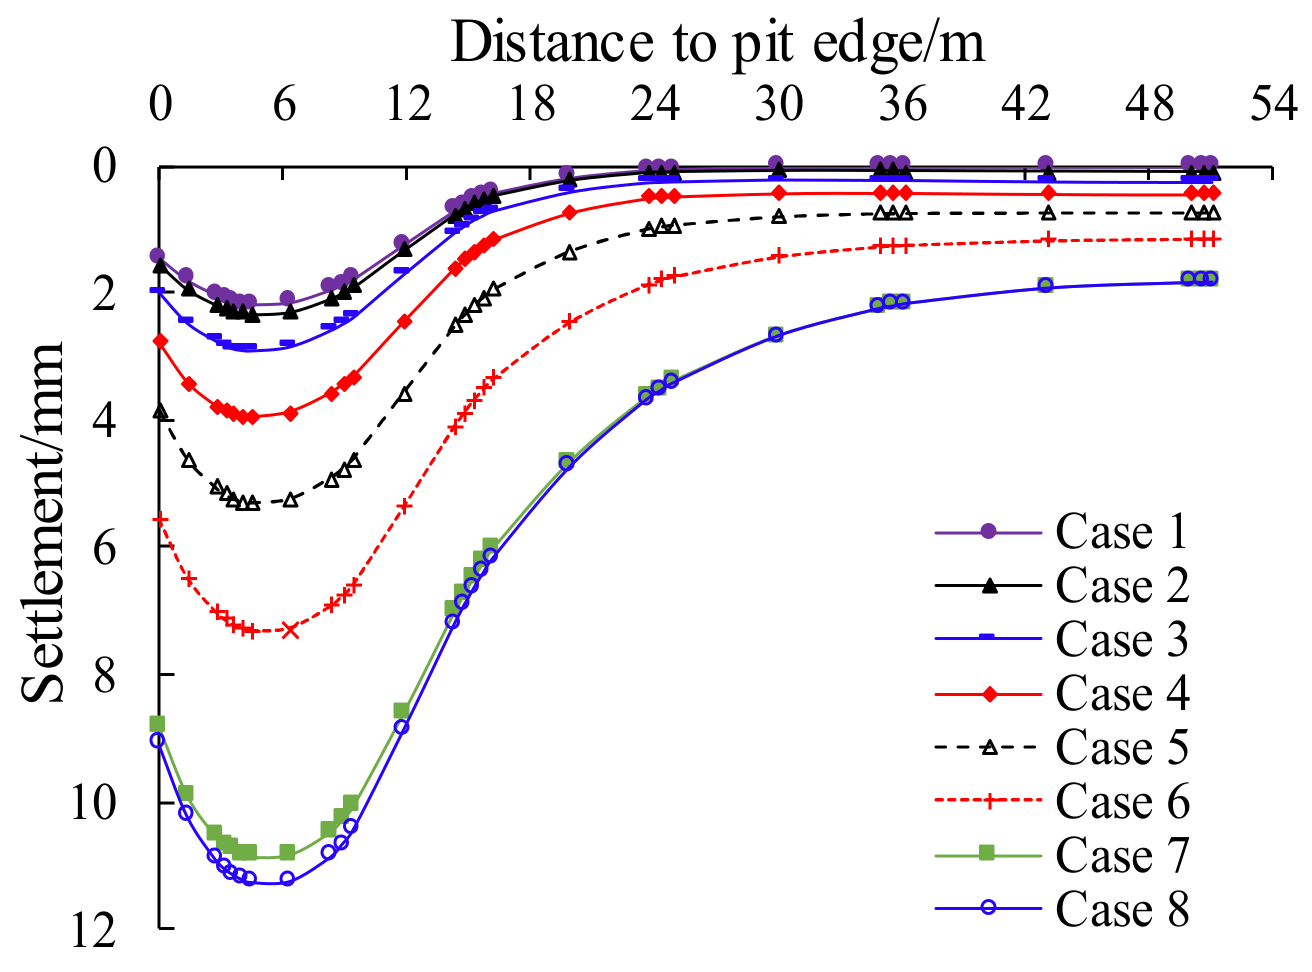
The shape of ground settlement with displacement, as shown in Figure 20, is similar to the results obtained by Hsieh et al. [29]. The settlement curve is a single-peaked curve with a “trough” shape. In each case, the settlement curves are compared and analyzed. The settlement grows in each case, and the shape of the settlement curve is virtually the same in each case. In general, the excavation has an impact on surface settlement in the range of about 30 m. The settlement steadily expands with a distance in the range of 0 to 6 m. The settlement reaches a maximum at 6 m from the edge and, after exceeding 6 m, it gradually decreases and finally stabilizes. When the foundation pit was excavated to a depth of 19 m, the settlement reached a maximum of 11.23 mm. This is consistent with the change rule of horizontal displacement of the pile. With the increase of excavation depth, the settlement difference of adjacent cases also increases continuously. It can be found that the maximum horizontal displacement of the pile and the maximum ground settlement occurs in the same section. Therefore, it can be seen there is a correlation between the spatial effect of settlement and the horizontal deformation of the pile.
5. Analysis of Influence Factors
In the above modeling analysis and calculation, the horizontal displacement, ground settlement and axial force of the pile are the largest in the HH section. The characteristics of the piles in the HH section can effectively reflect the spatial effects. In exploring the influencing factors, the effect of parameters is reflected by the different behavior of piles in the HH section.
5.1. Influence of Stratum Conditions
Based on the original model, the univariate method was used to take 0.5 times, 0.75 times, 1.5 times, and 2 times of the modulus of elasticity E and cohesion C of the original model soil for the calculation of the new model, respectively.
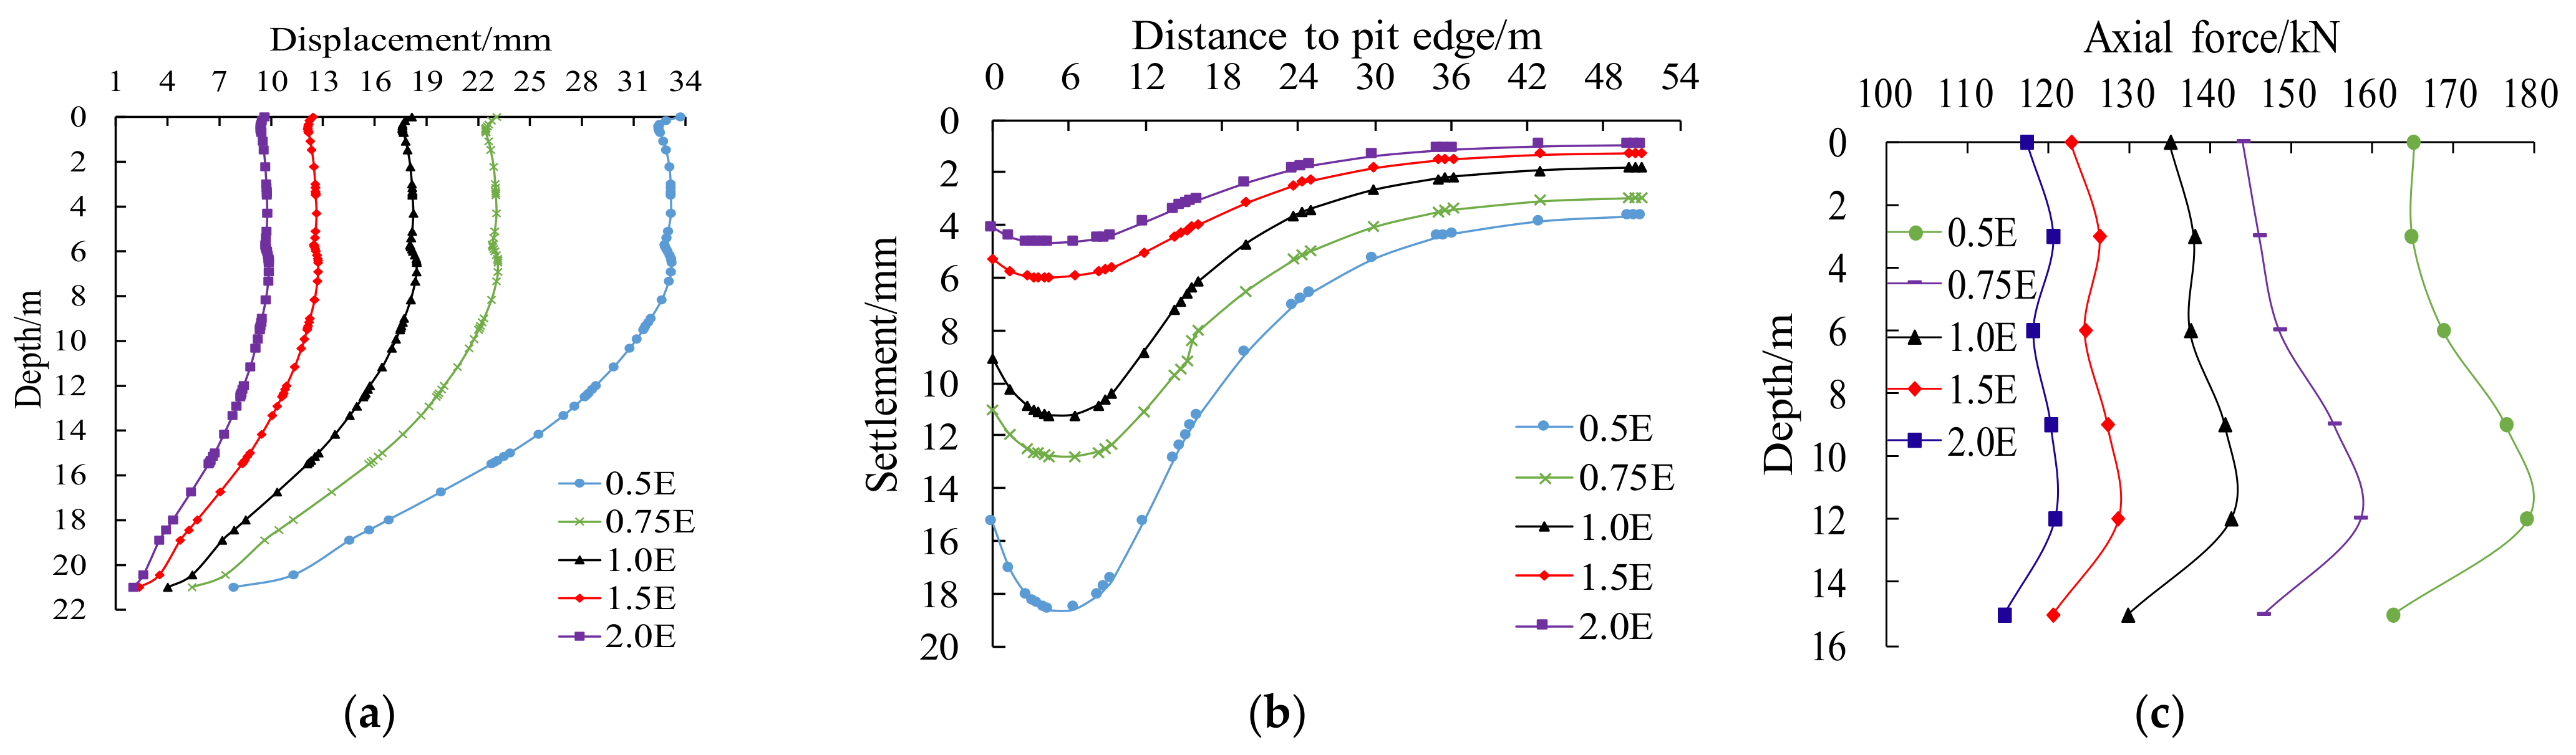
5.1.1. Influence of Elastic Modulus
As can be seen from Figure 21, the change of the elastic modulus has a certain degree of influence on the horizontal displacement of the pile, ground settlement and axial force, but the curve forms all stay the same under each case. When the elastic modulus is 0.5 E, 0.75 E, 1.0 E, 1.5 E, and 2.0 E, maximum horizontal displacements of piles are 33.86 mm, 24.27 mm, 18.44 mm, 12.53 mm, and 9.87 mm, respectively. When the elastic modulus increases from 0.5 E to 1.0 E and then from 1.0 E to 2.0 E, the maximum displacement of the pile was reduced by 83.6% and 53.8%, respectively. The change in elastic modulus has little effect on the extent of ground settlement around the foundation pit. When the elastic modulus increases from 1.0 E to 1.5 E and then from 1.5 E to 2.0 E, the maximum settlement decreases by 46.8% and 21.2%, respectively. When the elastic modulus increases from 1.0 E to 2.0 E, the maximum axial force decreases from 142.43 kN to 120.65 kN, decreasing by 15.3%.
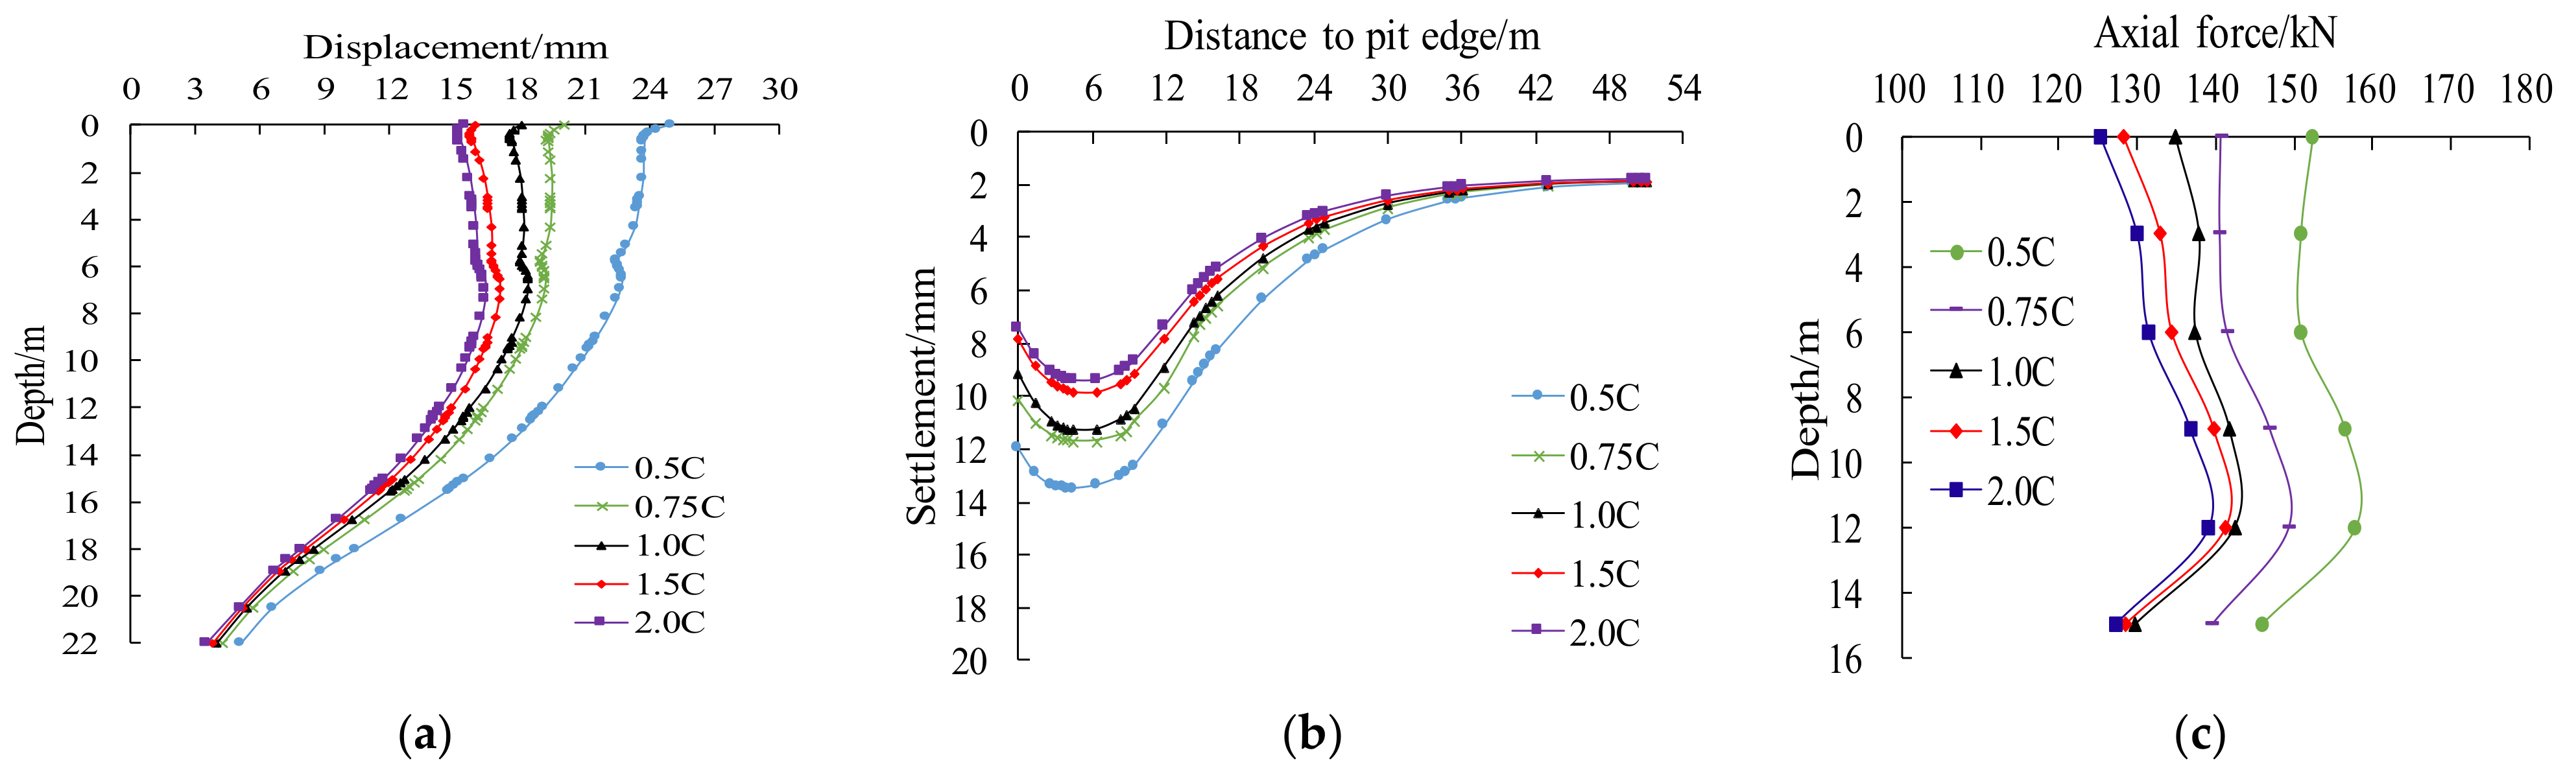
5.1.2. Influence of Cohesion
As can be seen from Figure 22, when the cohesion decreases from 2.0 c to 0.5 c, the changing trend of horizontal displacement of the pile, settlement, and axial force are similar to the change of elastic modulus from 2.0 E to 0.5 E. The shape of the curve is basically unchanged. When the cohesion increased from 1.0 c to 2.0 c, the maximum values of horizontal displacement, settlement and axial force decreased by 10.8%, 16.7%, and 2.3%, respectively.
It can be concluded that when the stratum conditions are poor, the spatial effect is more obvious and the elastic modulus has a greater influence than the cohesion. At the same time, the elastic modulus has a greater influence on the pit deformation and the internal force of the structure than the cohesion. It is suggested that the elastic modulus and cohesion of the soil should be increased to 1.5~2.0 times the initial value when the soil is reinforced by grouting.
5.2. Influence of Pile Parameters
Based on the original model, the single-variable method was used to calculate the effect of pile diameters D of 0.6 m, 0.8 m, 1.0 m, 1.2 m, and 1.4 m, and then the pile spacing S of 1.2 m, 1.4 m, 1.6 m, 1.8 m, and 2.0 m on the foundation pit, respectively.
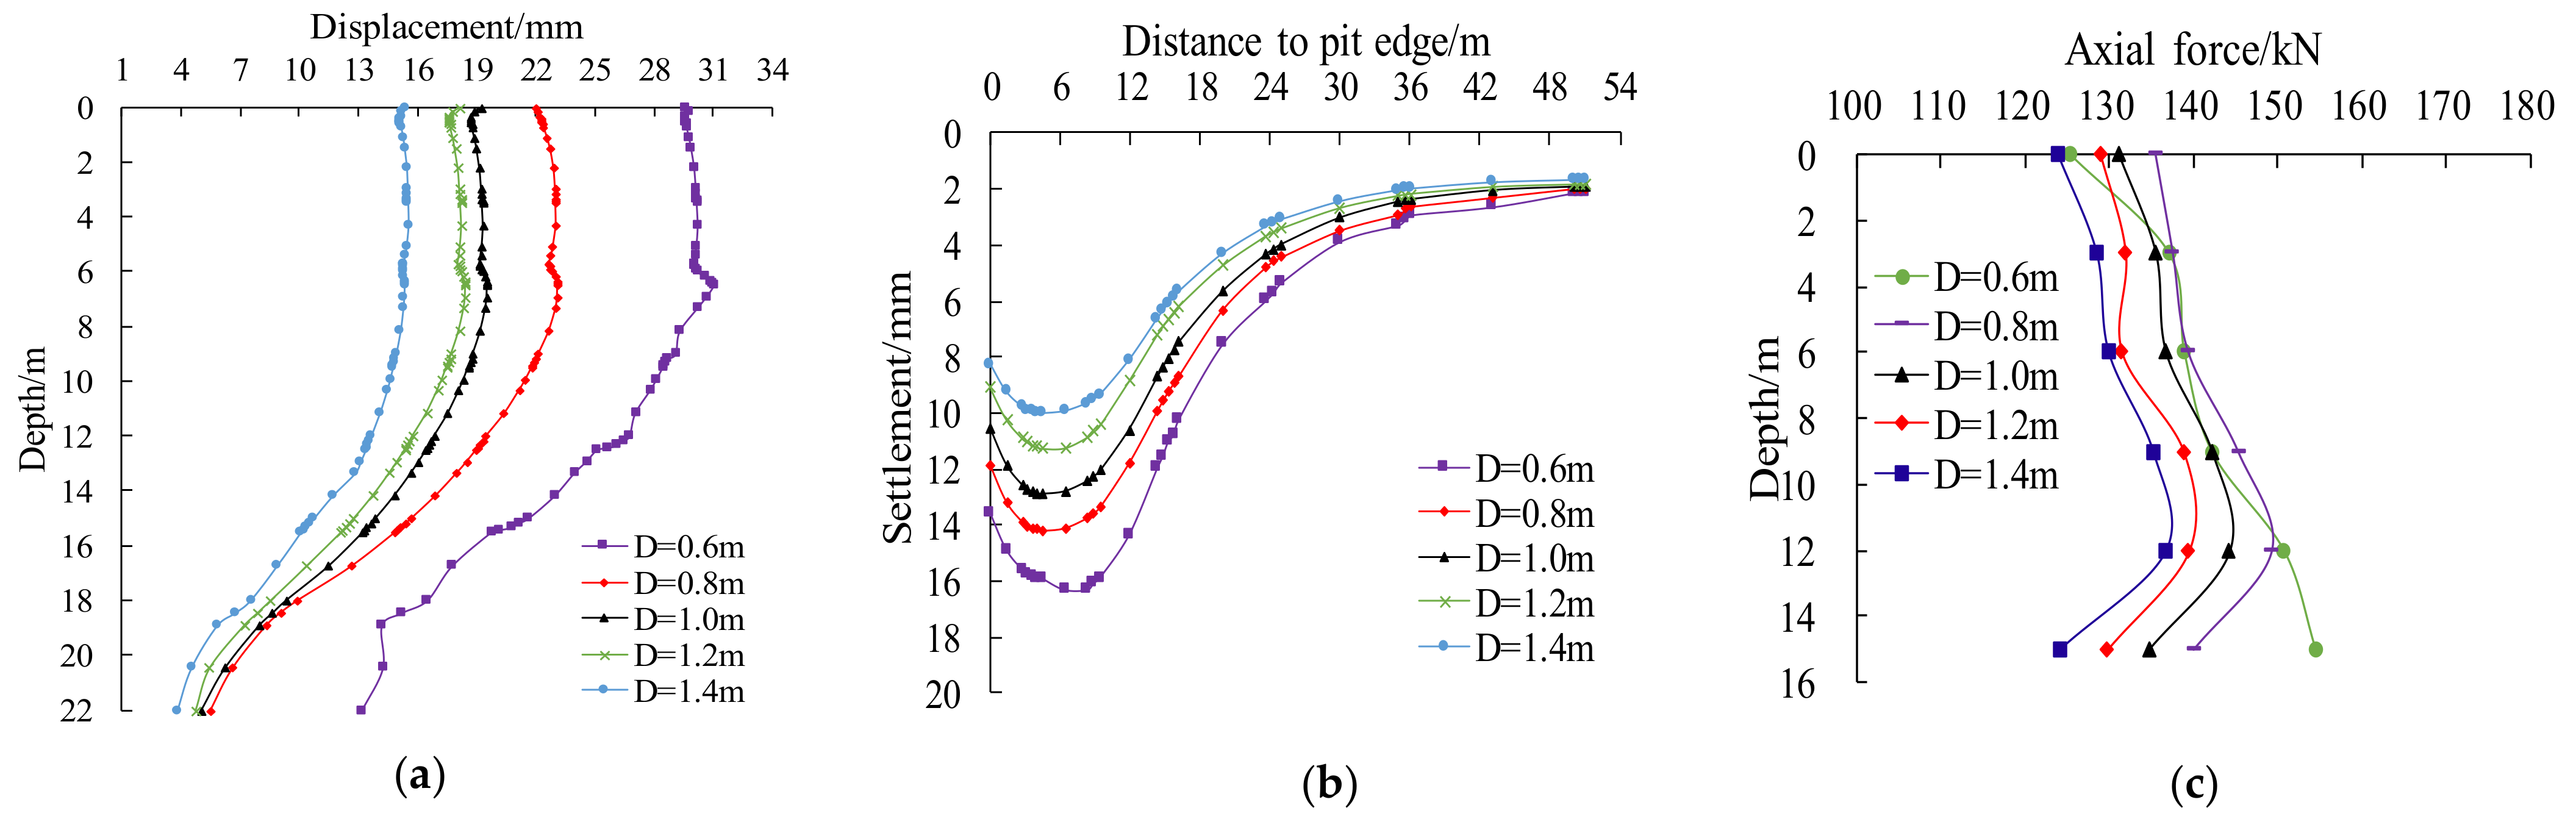
5.2.1. Influence of Pile Diameter
Figure 23 indicates that, when the pile diameter is reduced by 0.2 m each time, the horizontal displacement and settlement of the pile do not grow in a constant proportion, but the rate of increase gradually increases. When the pile diameter is reduced to 0.6 m, the horizontal displacement is more than 30 mm, exceeding the maximum value allowed. The curve of horizontal displacement of the pile is no longer smooth from the top of the pile 12 m to the bottom. While the pile diameter is 0.6 m, the axial force curve shape has changed from a kind of parabolic into a growth curve along with the depth. In the range of 0.8 to 1.4 m, the lower part of the pile has little effect with the change of pile diameter, and the curve fit is tight, which indicates that the lower part of the pile is well embedded. It is suggested that the pile diameter can be reduced to 0.8~1.2 m based on the original pile diameter.
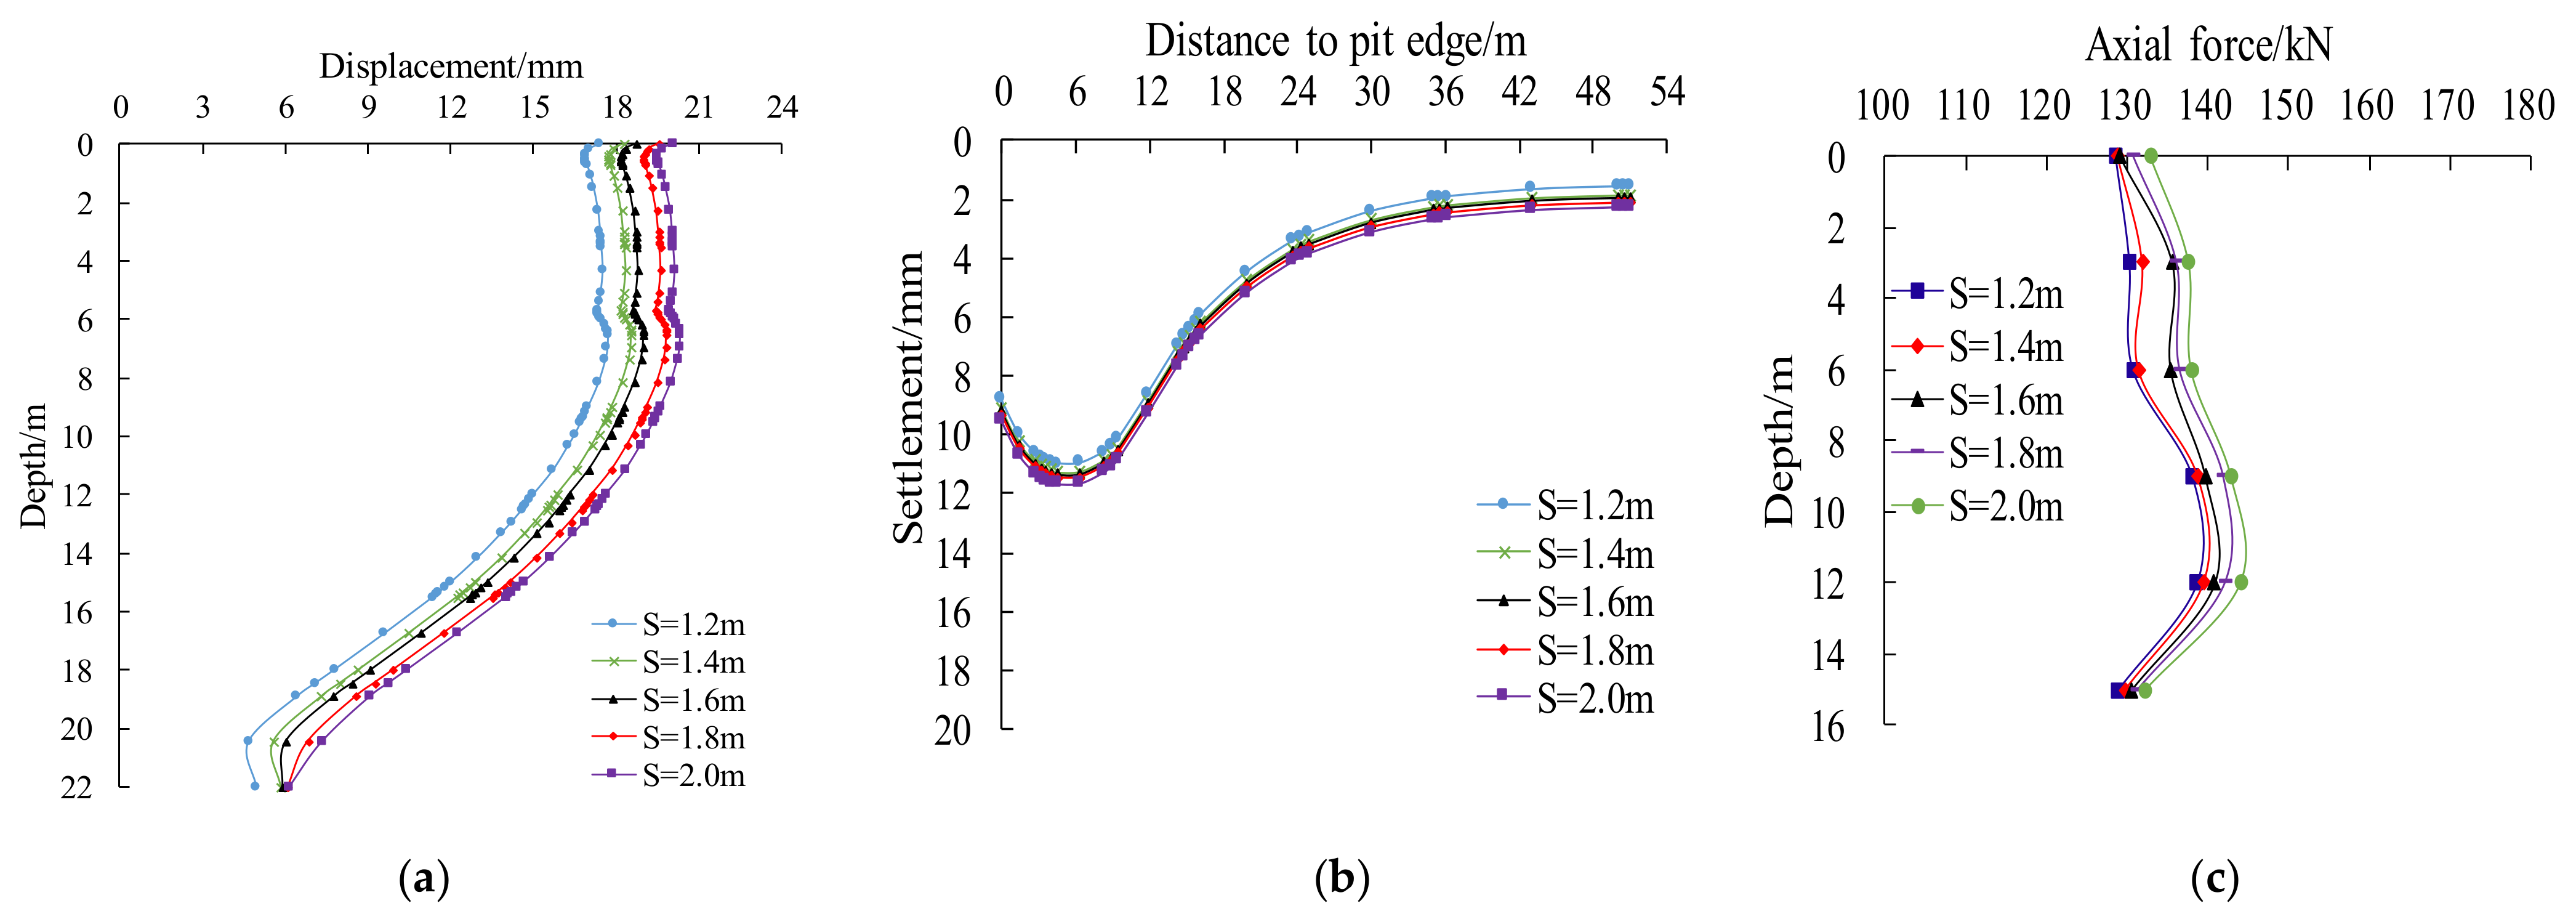
5.2.2. Influence of Pile Spacing
As can be seen from Figure 24, the horizontal displacement of the piles is essentially the same for different pile spacings. When the pile diameter is reduced by every 0.2 m, the curve of horizontal displacement, settlement, and axial force of the pile at each pile distance are compact. Under the condition of the stratum, the pile spacing changing within the scope of 1.2 m to 2.0 m does not have a significant influence on retaining structure and settlement. Therefore, the pile spacing is suggested to be increased appropriately to 1.4~2.0 m.
5.3. Influence of Anchor Cable Parameters
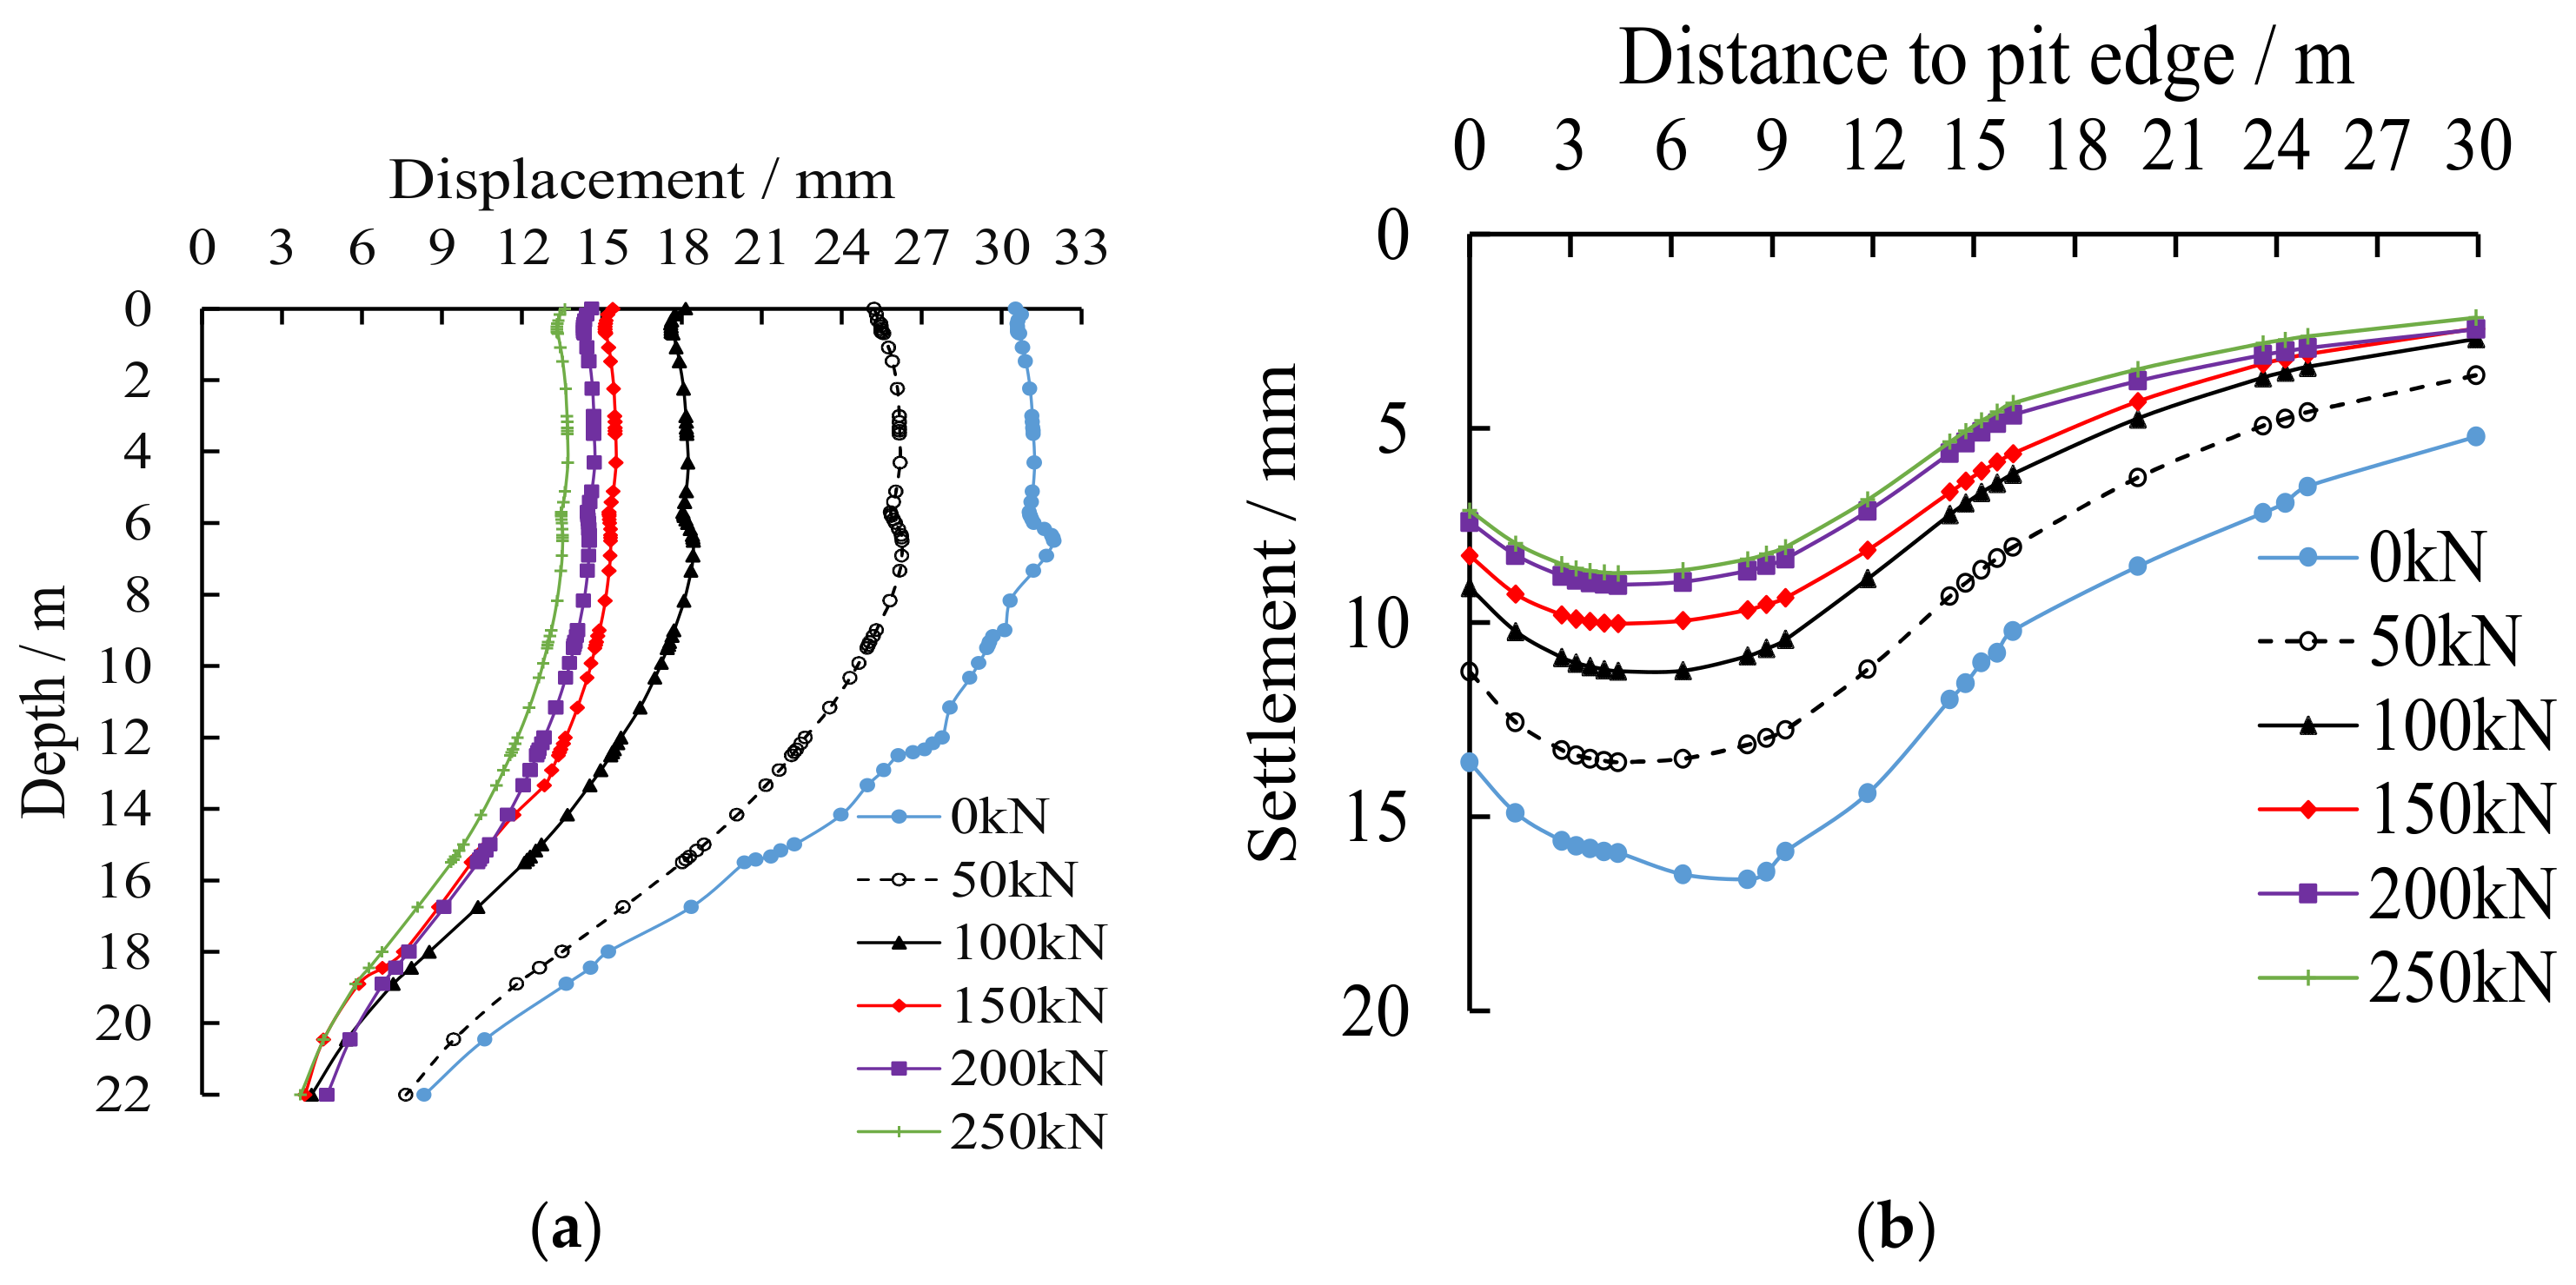
To understand the effect of anchor cables on pit deformation, four prestress values (0, 50 kN, 100 kN, 150 kN, 200 kN) and four inclination angle values (10°, 15°, 20°, 25°, 30°) were used to simulate anchor cables with other parameters held constant.
5.3.1. Influence of Prestress
As can be seen from Figure 25, when the prestress increases from 0 to 250 kN, the maximum horizontal displacement of the pile decreases from 31.87 mm to 13.53 mm, with a decrease of 57.5%. The ground settlement decreases from 16.61 mm to 8.72 mm, with a decrease of 47.5%. It shows that increasing the prestress value can significantly decrease the horizontal displacement of the pile and control the ground settlement.
When the prestress is 0 and 50 kN, the maximum horizontal displacement exceeds the maximum value allowed. As the prestress increases from 150 to 250 kN, the horizontal displacement curve of the pile and the settlement curve fit tightly. It indicates that the effect of increasing prestressing force is limited in reducing the pit deformation. This is uneconomical if the prestressing force keeps increasing and it may cause the displacement of the supporting structure to the back of the pit, which may have a bad effect on the surrounding environment of the pit. Therefore, the reasonable range of prestressing is 100~150 kN.
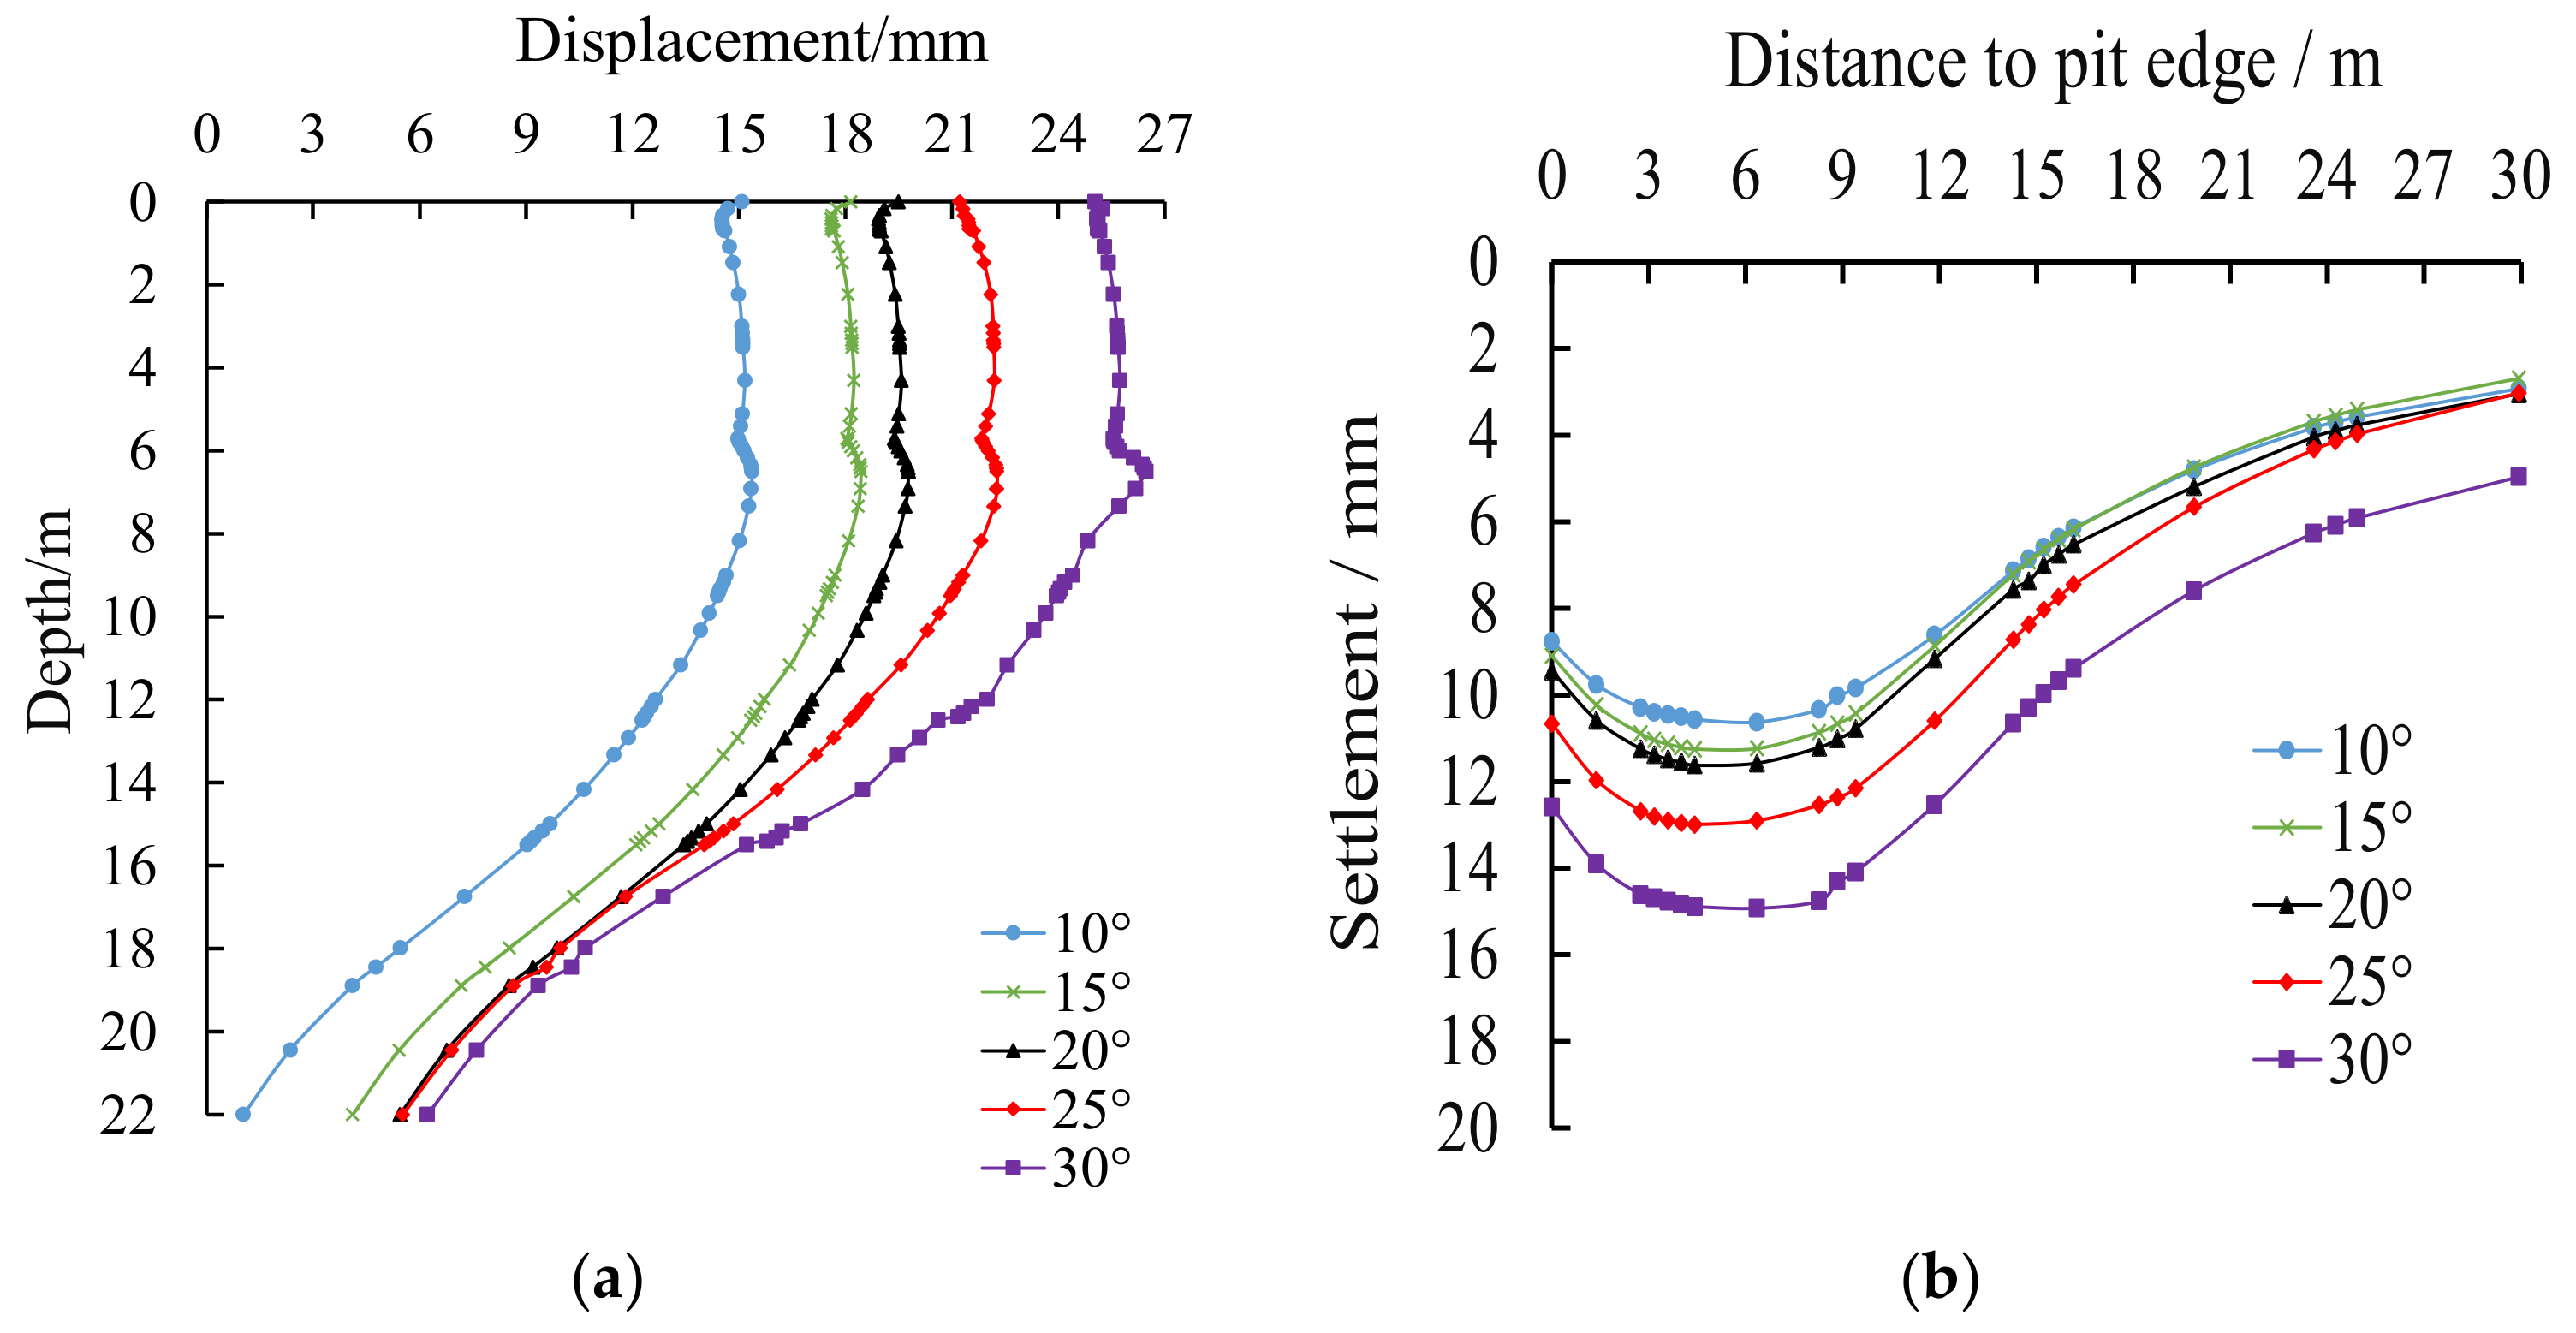
5.3.2. Influence of Tilt Angle
It can be seen from Figure 26 that, when the tilt angle of the anchor cable increases from 10° to 30°, both the horizontal displacement of the pile and the ground settlement increase obviously. When the tilt angle is 25° and 30°, the horizontal displacement of the pile top exceeds the deformation control scope, and the supporting effect are poor. When the tilt angle is 10°~20°, the deformation of pile and ground settlement are well restrained, and the maximum horizontal displacement of the pile and ground settlement have little difference at each tilt angle. In order to give full play to the role of anchor cable, it is suggested that the tilt angle of the anchor cable should be between 10° and 20°.
Comparing the ground settlement and the horizontal displacement of the pile under various parameters in Figure 21, Figure 22, Figure 23, Figure 24, Figure 25 and Figure 26, some deformation laws can be found:
- With the increase of distance, both the ground settlement and the horizontal displacement of the pile increase first and start to decrease after reaching the maximum value at a certain position;
- The maximum values of both the ground settlement and the displacement of the pile occur at the position of 6–8 m of the ground or the pile;
- The maximum horizontal displacement of the pile is 15–30 mm, while the maximum settlement of the ground is 7.5–15 mm. The length of significant deformation occurring in the pile is approximately 19 m and the extent of significant ground settlement is approximately 40 m wide.
In the field monitoring section, the maximum horizontal displacement of the pile is twice the maximum settlement of the ground, while the length of the pile deformation is half the width of the settlement occurring in the ground. According to this law, the surface settlement and pile deformation of similar foundation excavations can be predicted in advance to ensure construction safety.
6. Conclusions
Through the field measurement and numerical simulation of a deep foundation pit with pile-anchor supporting structure in red sandstone stratum, the horizontal displacement, axial force and ground settlement during construction were explored, and the spatial effect induced by the excavation was evaluated. The following conclusions were drawn from the above results and discussion:
- (1)
- The field monitoring results show that the spatial effects of pile top horizontal displacement, the horizontal displacement at various depths, anchor cable axial force and surface settlement are obvious. The deformation decreases gradually from the middle part to the pit angle. It is suggested to make full use of the spatial effect of the pit corner in the design, to reduce the support grade appropriately at the pit corner of the foundation pit;
- (2)
- With the excavation of the foundation pit, the form of pile deformation curve changes from cantilever type to belly drum type. The maximum horizontal displacement occurs between 6.0 and 8.0 m from the top of the crown beam, which is about 1/3 of the pile length;
- (3)
- The axial force of the anchor cable is distributed in a parabola along with the depth of the foundation pit. The axial force of the anchor cable of layer 3, layer 4 and layer 5 is generally greater than that of layer 1, layer 2 and layer 6, and the maximum axial force appears at the anchor cable of layer 4. It is recommended to appropriately increase the distance between the bottom layer anchor cable and the upper layer anchor cable;
- (4)
- The width of ground settlement occurring in the same monitoring section is twice the length of deformation occurring in the pile, while the maximum ground settlement is half the maximum deformation of the pile, showing an obvious deformation coordination relationship;
- (5)
- When the stratum condition is poor, the spatial effect of foundation pit deformation is more obvious. With the increase of soil elastic modulus and cohesion, the horizontal displacement of pile, axial force of anchor cable, and surface settlement gradually decrease, and the influence of elastic modulus is more significant. It is suggested that the elastic modulus and cohesion should be increased to 1.5–2.0 times the initial value during grouting reinforcement;
- (6)
- With the increase of the pile diameter or the decrease of the pile spacing, the horizontal displacement of the pile, the axial force of the anchor cable and the surface settlement gradually decrease, while the influence of changing the pile spacing on the spatial effect is limited; The pile diameter of 0.8–1.2 m and the pile spacing of 1.4–2.0 m are more suitable in practical engineering;
- (7)
- With the decrease of the prestress or the increase of the tilt angle, the horizontal displacement, the axial force and the surface settlement gradually increase. The value of the axial force is suggested to be set in the range of 100–150 kN and the tilt angle ranges from 10° to 20° in the design.
The conclusions drawn from the study of deformation control technology for the deep foundation excavation of large rail transit stations in red sandstone strata have certain engineering application value for similar projects. However, there are still some problems to be further studied: the influence of the temporal effect on deep foundation excavation deformation needs to be investigated further, and the effect of temporary loads surrounding the foundation pit may influence its deformation, which is not considered in the modeling in this research.
Author Contributions
Conceptualization, W.L.; data curation, T.L.; methodology, W.L and T.L.; investigation, W.L. and J.W.; software, J.W. and T.L.; formal analysis: W.L. and T.L.; visualization, J.W.; writing and editing, W.L. and T.L. All authors have read and agreed to the published version of the manuscript.
Funding
This research was funded by Hunan Provincial Natural Science Foundation of China (2019JJ40344), and the Science and technology planning project of Hunan Provincial Department of housing and urban rural development (KY201943).
Institutional Review Board Statement
Not applicable, this study does not involve humans or animals.
Informed Consent Statement
Not applicable, this study does not involve humans.
Data Availability Statement
The data presented in this study are available on request from the corresponding author.
Conflicts of Interest
The authors declare no conflict of interest.
References
- Zhao, W.; Han, J.; Li, S.; Guan, Y. Stresses and deformations in pile-anchor support system of deep foundation pit in sandy layers. J. Northeast. Univ. Nat. Sci. 2015, 36, 576–580. [Google Scholar] [CrossRef]
- Di, W. Monitoring and analysis of deformation of a foundation pit in Lanzhou. In Proceedings of the 5th International Conference on Green Materials and Environmental Engineering (GMEE 2019), Guangzhou, China, 27–29 December 2019; pp. 124–130. [Google Scholar] [CrossRef]
- Liang, Y.; Liu, G.; Hu, R.; Zhang, M. Deformation analysis of adjacent metro during deep pit excavation. Appl. Mech. Mater. 2011, 1446, 651–655. [Google Scholar] [CrossRef]
- Xiao, H.; Zhou, S.; Sun, Y. Wall deflection and ground surface settlement due to excavation width and foundation pit classification. KSCE J. Civ. Eng. 2019, 23, 1537–1547. [Google Scholar] [CrossRef]
- Finno, R.J.; Blackburn, J.T.; Roboski, J.F. Three-dimensional effects for supported excavations in clay. J. Geotech. Geoenviron. Eng. 2007, 133, 30–36. [Google Scholar] [CrossRef] [Green Version]
- Lee, F.H.; Yong, K.; Quan, K.; Chee, K. Effect of corners in strutted excavations: Field monitoring and case histories. J. Geotech. Geoenviron. Eng. 1998, 124, 339–349. [Google Scholar] [CrossRef]
- Finno, R.J.; Roboski, J.F. Three-dimensional responses of a tied-back excavation through clay. J. Geotech. Geoenviron. Eng. 2015, 131, 273–282. [Google Scholar] [CrossRef]
- Liu, N.; Gong, X.; Yu, F.; Fang, K. Analysis of spatial effects in strutted excavation and related influential factors. Rock Soil Mech. 2014, 35, 2293–2306. [Google Scholar] [CrossRef]
- Tan, Y.; Wei, B.; Diao, Y.; Zhou, X. Spatial corner effects of long and narrow multipropped deep excavations in shanghai soft clay. J. Perform. Constr. Facil. 2014, 28, 04014015. [Google Scholar] [CrossRef]
- Yang, X.; Wu, F.; Teng, W.; Liu, C. Analysis of monitoring results of a deep foundation pit with pile-anchor retaining structure. Appl. Mech. Mater. 2014, 7, 28–33. [Google Scholar] [CrossRef]
- Feng, S.; Wu, Y.; Li, J.; Li, P.; Zhang, Z.; Wang, D. The analysis of spatial effect of deep foundation pit in soft soil areas. Procedia Earth Planet. Sci. 2012, 5, 309–313. [Google Scholar] [CrossRef] [Green Version]
- Wang, Z.; Zhou, J. Three-dimensional numerical simulation and earth pressure analysis on double-row piles with consideration of spatial effects. J. Zhejiang Univ. Sci. A 2011, 12, 758–770. [Google Scholar] [CrossRef]
- Blackburn, J.T. Automated Remote Sensing and Three-Dimensional Analysis of Internally Braced Excavation. Ph.D. Thesis, Northwestern University, Evanston, IL, USA, 2005. [Google Scholar]
- Zhen, G.; Deng, X.; Liu, C.; Liu, Q. Comparative analysis of influences of different deformation modes of retaining structures on displacement field of deep soils outside excavations. Chin. J. Geotech. Eng. 2014, 36, 273–285. [Google Scholar] [CrossRef]
- Wang, F.; Shi, G.; Zhai, W.; Li, B.; Zhang, C.; Fang, H. Internal force on and deformation of steel assembled supporting structure of foundation pit under thermal stress. Appl. Sci. 2021, 11, 2225. [Google Scholar] [CrossRef]
- Goldberg, D.; Jaworski, W.; Gordon, M. Lateral Support Systems and Underpinning. Volume III. Construction Methods; FHWA-RD-75-130; Federal Highway Administration, Offices of Research and Development: Washington, DC, USA, 1976. Available online: https://rosap.ntl.bts.gov/view/dot/14531 (accessed on 10 October 2021).
- Clough, G.; Thomas, D. Construction induced movements of in situ walls. Earth Retaining Struct. 1990, 25, 18–21. [Google Scholar]
- Guo, Y.; Zhao, G.; Sun, Y.; Guo, Y.; Bao, Z.; Li, J.; Xie, F. Test study on the internal force and deformation for anchored bracing pile. Chin. J. Undergr. Space Eng. 2009, 34, 1020–1024. [Google Scholar]
- Li, H.; Song, Y.; Zhou, J.; Li, J.; Shen, Z. Filed test of pile-anchor retaining structure mechanical and deformation characteristics in deep foundation pit. Chin. J. Undergr. Space Eng. 2017, 13, 264–270. [Google Scholar]
- Lou, C.; Xia, T.; Liu, N. Spatial effects of deformation due to excavation in soft clay. Chin. J. Geotech. Eng. 2019, 41, 249–252. [Google Scholar]
- Wang, D.; Feng, C.; Sun, J. Analysis and research the influence about the control from the excavation way to deformation of foundation pit. Adv. Mater. Res. 2014, 2837, 815–820. [Google Scholar] [CrossRef]
- Ashraf, H.; Mohamed, E.; Mai, A.; Mariam, J. Three-Dimensional Response of the Supported-Deep Excavation System. Geosciences 2020, 10, 76. [Google Scholar] [CrossRef] [Green Version]
- Zhe, L.; Di, H.; Mehrad, K.; Li, Y. Effects of soil spatial variability on structural reliability assessment in excavations. Undergr. Space 2020, 5, 71–83. [Google Scholar] [CrossRef]
- Yang, L.; Pang, Y.; Li, S. Research on Construction Spatial Effects in Long Foundation Pit. J. Jilin Univ. Earth Sci. Ed. 2015, 45, 541–545. [Google Scholar] [CrossRef]
- Zhang, F.; Gohb, T.A. Three-dimensional finite element analyses of deep braced excavation in soft clay. In Proceedings of the 18th Southeast Asian Geotechnical Conference and Inaugural AGSSEA Conference, Singapore, 29–31 May 2013; pp. 289–294. [Google Scholar] [CrossRef]
- Fu, Y.; He, S.; Zhang, S.; Yang, Y.; Giannopoulos, G. Parameter analysis on hardening soil model of soft soil for foundation pits based on shear rates in Shenzhen bay, China. Adv. Mater. Sci. Eng. 2020, 2020, 1–11. [Google Scholar] [CrossRef] [Green Version]
- Zhao, W.; Han, J.; Chen, Y.; Jia, P.; Li, S.; Li, Y.; Zhao, Z. A numerical study on the influence of anchorage failure for a deep excavation retained by anchored pile walls. Adv. Mech. Eng. 2018, 10, 1–17. [Google Scholar] [CrossRef] [Green Version]
- Li, L.; Zhang, Y.; Hu, X. Finite element analysis of a pit-in-pit excavation based on plaxis 3d. Chin. J. Undergr. Space Eng. 2016, 12, 254–261. [Google Scholar]
- Hsieh, P.; Ou, C. Shape of ground surface settlement profiles caused by excavation. Can. Geotech. J. 1998, 35, 1004–1017. [Google Scholar] [CrossRef]
Figure 1.
Pile and anchor support structure.

Figure 2.
Construction site pictures: (a) excavation of foundation pit, (b) anchor cable and waist beam.
Figure 2.
Construction site pictures: (a) excavation of foundation pit, (b) anchor cable and waist beam.

Figure 3.
Schematic drawing of monitoring point arrangement.

Figure 4.
Layout of monitoring cross-section.

Figure 5.
Horizontal displacement curves of piles under different working conditions: (a) ZQT-7, (b) ZQT-1, (c) ZQT-34, (d) ZQT-33.
Figure 5.
Horizontal displacement curves of piles under different working conditions: (a) ZQT-7, (b) ZQT-1, (c) ZQT-34, (d) ZQT-33.

Figure 6.
Maximum horizontal displacement of piles.

Figure 7.
Horizontal displacement of piles top.

Figure 8.
Maximum ground settlement.

Figure 9.
Distribution of ground settlement around pit under different case: (a) DBC-7, (b) DBC-33, (c) DBC-34.
Figure 9.
Distribution of ground settlement around pit under different case: (a) DBC-7, (b) DBC-33, (c) DBC-34.

Figure 10.
3D finite element model.

Figure 11.
3D mesh of the model.

Figure 12.
The positions of section.

Figure 13.
Ground settlement: (a) HH section of the long side, (b) KK section of the short side.

Figure 14.
Horizontal displacement of piles top: (a) HH section of the long side, (b) KK section of the short side.
Figure 14.
Horizontal displacement of piles top: (a) HH section of the long side, (b) KK section of the short side.

Figure 15.
Horizontal displacement of piles at various depths: (a) HH section of the long side, (b) KK section of the short side.
Figure 15.
Horizontal displacement of piles at various depths: (a) HH section of the long side, (b) KK section of the short side.

Figure 16.
Cloud map of the spatial distribution of pit deformation: (a) Case1, (b) Case5, (c) Case8.
Figure 16.
Cloud map of the spatial distribution of pit deformation: (a) Case1, (b) Case5, (c) Case8.

Figure 17.
Simulation results of different sections: (a) Horizontal displacement of piles, (b) Ground settlement, (c) Axial force.
Figure 17.
Simulation results of different sections: (a) Horizontal displacement of piles, (b) Ground settlement, (c) Axial force.

Figure 18.
Horizontal displacement of piles top along long side.

Figure 19.
Horizontal displacement of piles.

Figure 20.
Ground settlement.

Figure 21.
Influence curve of different elastic modulus: (a) Horizontal displacement of piles, (b) Ground settlement, (c) Axial force.
Figure 21.
Influence curve of different elastic modulus: (a) Horizontal displacement of piles, (b) Ground settlement, (c) Axial force.

Figure 22.
Influence curve of different cohesion: (a) Horizontal displacement of piles, (b) Ground settlement, (c) Axial force.
Figure 22.
Influence curve of different cohesion: (a) Horizontal displacement of piles, (b) Ground settlement, (c) Axial force.

Figure 23.
Influence curves of different pile diameters: (a) Horizontal displacement of piles, (b) Ground settlement, (c) Axial force.
Figure 23.
Influence curves of different pile diameters: (a) Horizontal displacement of piles, (b) Ground settlement, (c) Axial force.

Figure 24.
Influence curve of different pile spacing: (a) Horizontal displacement of piles, (b) Ground settlement, (c) Axial force.
Figure 24.
Influence curve of different pile spacing: (a) Horizontal displacement of piles, (b) Ground settlement, (c) Axial force.

Figure 25.
Influence curves of different prestress: (a) Horizontal displacement of piles, (b) Ground settlement.
Figure 25.
Influence curves of different prestress: (a) Horizontal displacement of piles, (b) Ground settlement.

Figure 26.
Influence curves of different tilt angle: (a) Horizontal displacement of piles, (b) Ground settlement.
Figure 26.
Influence curves of different tilt angle: (a) Horizontal displacement of piles, (b) Ground settlement.


Table 1.
Mechanical parameters of soils.
| Soil Layer | Depth (m) | γ (kN⋅m−3) | c (kPa) | φ (°) | Es (MPa) | E50ref (MPa) | Eoedref (MPa) | Eurref (MPa) | K0 |
|---|---|---|---|---|---|---|---|---|---|
| Miscellaneous fill | 0–10 | 18.5 | 14 | 12 | 5.0 | 7.5 | 7.5 | 22.5 | 0.79 |
| Totally weathered red sandstone | 10–10.7 | 19.5 | 17.5 | 16.5 | 11.0 | 22 | 22 | 66 | 0.71 |
| Strongly weathered red sandstone | 10.7–15.7 | 23.5 | 35 | 22 | 30.0 | 60 | 60 | 180 | 0.63 |
| Moderately weathered red sandstone | >15.7 | 26.6 | 300 | 25.7 | — | 150 | 150 | 450 | 0.57 |
γ = soil unit weight; c = cohesion; φ = internal friction angle; Es = modulus of compression; E50ref = reference secant stiffness in triaxial test; Eoedref = reference tangent stiffness for oedometer loading; Eurref = reference unloading/reloading stiffness; K0 = lateral coefficient of the earth pressure.
Table 2.
Construction sequence.
| Case | Construction Process |
|---|---|
| 1 | Construction of pile row, excavation to −10.5 m, construction of top beam, the 1st anchor cable, 100 kN prestressing |
| 2 | Excavation to −13.5 m, construction of the 1st floor wale, the 2nd anchor cable, 100 kN prestressing |
| 3 | Excavation to −16.5 m, construction of the 2nd floor wale, the 3rd anchor cable, 100 kN prestressing |
| 4 | Excavation to −19.5 m, construction of the 3rd floor wale, the 4th anchor cable, 100 kN prestressing |
| 5 | Excavation to −22.5 m, construction of the 4th floor wale, the 5th anchor cable, 100 kN prestressing |
| 6 | Excavation to −25.5 m, construction of the 5th floor wale, the 6th anchor cable, 100 kN prestressing |
| 7 | Excavation to −29.0 m |
| 8 | One month after excavation to the bottom |
Table 3.
Main properties of soil nailing.
| Property | Value |
|---|---|
| Elastic modulus, E (GPa) | 210 |
| Incident angle (°) | 15 |
| Length (m) | 10 |
| Diameter (m) | 0.2 |
Table 4.
Main parameters of bored pile.
| Type | Row of Piles | Concrete Surface | |
|---|---|---|---|
| Property | |||
| equivalent thickness, h (m) | 0.955 | 0.20 | |
| Unit weight, γ (kN⋅m−3) | 25 | 25 | |
| Elastic modulus, E/GPa | 32.5 | 30 | |
| Poisson’s ratio, υ | 0.3 | 0.3 | |
Table 5.
Main parameters of prestressed anchor cable.
| Number | 1st Anchor Cable | 2nd Anchor Cable | 3rd Anchor Cable | 4th Anchor Cable | 5th Anchor Cable | 6th Anchor Cable | |
|---|---|---|---|---|---|---|---|
| Property | |||||||
| Rod body type | 7ΦS10.8 | 5ΦS10.8 | 5ΦS10.8 | 5ΦS10.8 | 5ΦS10.8 | 5ΦS10.8 | |
| Incident angle (°) | 15 | 15 | 15 | 15 | 15 | 15 | |
| LFS (m) | 12 | 12 | 12 | 8 | 8 | 8 | |
| EAFS (×104 kN) | 8.042 | 5.743 | 5.743 | 5.743 | 5.743 | 5.743 | |
| LAS (m) | 16 | 12 | 12 | 8 | 8 | 8 | |
| EAAS (×104 kN) | 5.667 | 5.437 | 5.437 | 5.437 | 5.437 | 5.437 | |
| Borehole diameter (m) | 0.15 | 0.15 | 0.15 | 0.15 | 0.15 | 0.15 | |
| Prestress (kN) | 100 | 100 | 100 | 100 | 100 | 100 | |
LAS = length of anchorage segment; LFS = length of free segment; EAAS = Tensile stiffness (EA) of anchorage segment; EAFS = Tensile stiffness (EA) of free segment.
Publisher’s Note: MDPI stays neutral with regard to jurisdictional claims in published maps and institutional affiliations. |
© 2021 by the authors. Licensee MDPI, Basel, Switzerland. This article is an open access article distributed under the terms and conditions of the Creative Commons Attribution (CC BY) license (https://creativecommons.org/licenses/by/4.0/).
Share and Cite
MDPI and ACS Style
Liu, W.; Li, T.; Wan, J. Deformation Characteristic of a Supported Deep Excavation System: A Case Study in Red Sandstone Stratum. Appl. Sci. 2022, 12, 129. https://0-doi-org.brum.beds.ac.uk/10.3390/app12010129
AMA Style
Liu W, Li T, Wan J. Deformation Characteristic of a Supported Deep Excavation System: A Case Study in Red Sandstone Stratum. Applied Sciences. 2022; 12(1):129. https://0-doi-org.brum.beds.ac.uk/10.3390/app12010129
Chicago/Turabian StyleLiu, Weizheng, Tianxiong Li, and Jiale Wan. 2022. "Deformation Characteristic of a Supported Deep Excavation System: A Case Study in Red Sandstone Stratum" Applied Sciences 12, no. 1: 129. https://0-doi-org.brum.beds.ac.uk/10.3390/app12010129
Note that from the first issue of 2016, this journal uses article numbers instead of page numbers. See further details here.