Article

Theoretical Study on the Flexural Behavior of Structural Elements Strengthened with External Pre-Stressing Methods

1
Structural Engineering Department, Zagazig University, Zagazig 44519, Egypt
2
Faculty of Civil Engineering, Institute of Environmental Engineering, Technical University of Kosice, 04200 Košice, Slovakia
*
Author to whom correspondence should be addressed.
Submission received: 25 November 2021 / Revised: 17 December 2021 / Accepted: 20 December 2021 / Published: 24 December 2021
(This article belongs to the Special Issue High-Performance of Eco-Efficient Concrete, Volume 3)

Abstract

:
This study aims to strengthen the flexural behavior of structural elements with external pre-stressing tendons, thereby improving their load-carrying capacity and increasing their resistance against the external load. Different techniques were used to apply external pre-stressed strengthening to RC beams and RC frames. Seven identical RC frames were analyzed: an original sample without an external tendon, two strengthened samples with external tendons at the positive bending zone, two strengthened samples with external tendons at the beam–column connection zone, a strengthened sample with external straight line tendons along the beam and, finally, a strengthened sample with external U-shape tendons along the beam of the frame. The analysis and the results were obtained using ANSYS WORKBENCH finite element (FE) program. Comparisons were performed between these techniques to determine which technique is better for strengthening. The failure mode, vertical deflection, column stress, load-carrying capacity, and ductility of the samples were listed and analyzed under four-point vertical loading. The results show that using external tendons significantly increases the load capacity and the stiffness of structural frames. Moreover, the tendon in the beam zone is more effective than the tendon in the column zone.

1. Introduction

The strengthening of structures enables structural elements to carry additional external loads and increase their lifetime without exceeding the allowable limits of stability. External pre-stressing, in which tendons are installed outside of the structural concrete dimensions, except at anchorages and deviation points, is one a strengthening method used in several reinforced concrete (RC) structures. External pre-stressing is used in bridges, buildings, and retrofit applications [1]. External tendons can also be used in new structures, such as segmental bridges, especially in the case of box section structures. Tendons may be straight between anchorages or run through deviator blocks to create a harped profile (U-shaped or V-shaped). Pre-stressing tendons that are used in external post-tensioned systems may be greased and plastic-sheathed (as an unbonded system) or enclosed in a duct that is filled with grout. For fire protection, the external tendon is usually covered with a coating, such as metal lath and plaster in the case of systems without ducts. External pre-stressing techniques with steel tendons have been widely used with success to improve existing structures in the United States, Japan, and Switzerland [1,2,3,4,5]. The problem of environmental effects (corrosions, fires, etc.) on external steel can be resolved by the use of FRP materials, which offer high resistance to corrosions, high strength, and light weight [6,7,8]. Therefore, research in this area has been conducted since the early 1970s. External pre-stressing, both for new and existing structures, has proven to be an effective technique, offering many advantages [9,10,11,12,13]:
-
Higher utilization of small sectional areas.
-
Easy inspection and replacement of the tendon corrosion protection.
-
Friction losses are significantly reduced because external tendons are linked to the structure only at the deviation and anchorage zones.
-
The possibility of controlling and adjusting the tendon forces.
-
There is no weakening of the compression area due to ducts, so a minimum web thickness is achievable.
Many studies have discussed external pre-stressing in different structures. Zou J. et al. [1] enriched the experimental study of the external pre-stressing of RC members. They strengthened seven identical RC T-beams with external pre-stressing tendons in the laboratory and tested them under vertical loading. This study discussed experimentally the effect of the number of deviators, the tension method (direction), and the tendon profile on the flexural behavior of RC T-beams by making different cases for studying. Kim J. et al. [14] investigated how to retrofit RC frames against progressive collapse using pre-stressing tendons. They examined the effect of the external pre-stressing tendons along slab girders on the progressive collapse performance of six- and twenty-story RC model frames when the first story loses its inner column suddenly under static and dynamic loads. The results showed that the initial tension and cross-sectional area of the tendons exerted a positive influence on the retrofitting of the structures under static and dynamic conditions. Mahmoud et al. [15] showed that external post-tensioning can increase the load capacity of a single-bay frame by 30%. Subsequently, Ghannam M. et al. [16] studied the effect of post-tensioned cables on the strengthening of steel frames in order to raise their efficiency to all types of external loads. The effects of different techniques of external post-tensioning on simple frames, double bay frames, and double story frames were the subjects of this study. The profile and the location of the pre-stressed cable were used to differentiate between these techniques. The results of this paper showed that every frame featured a certain technique that could improve the load-carrying capacity of this frame. Finally, the authors concluded that the pre-stressed tendons could enrich the load-carrying capacity by about 35%or more according, to the pre-stressing force and the eccentricity of the tendon.
This technique is more economical compared to other methods of strengthening, as described by Harajli M.H. [17]. From the previous research and due to its simplicity, cost-effectiveness, speed of installation, and minimal disruption to structure users, external pre-stressing is becoming one of the most effective techniques for strengthening many types of structures and buildings.
In this paper, a theoretical study with ANSYS WORKBENCH 19.2 (ANSYS Inc.: Canonsburg, PA, USA) [18] was carried out to evaluate the flexural response of an RC single-bay frame strengthened with different techniques of externally pre-stressed tendons under vertical loading, including the failure modes, load-deflection characteristics, column-stresses, load-carrying capacity, and ductility. A sensitivity study was conducted to determine the best method of external strengthening that features the ability to improve the load capacity of the frame. The main parameters considered included the number of deviators and the profiles of the external tendons. Some conclusions and recommendations are drawn based on the results obtained from the ANSYS and can be used to guide future designs and applications.

2. Methodology and Programming

This part is divided into four sections. In the first section, the different methods of external pre-stressing strengthening that were performed by ANSYS WORKBENCH 19.2 (ANSYS Inc.: Canonsburg, PA, USA) for single-bay frames are presented. Secondly, the sample design, which includes cross-section dimensions, the span of the sample, and tendon properties, is introduced. Thirdly, the loading method and the pre-stressing of the tendons are presented. The last section presents the programming of the models in ANSYS WORKBENCH 19.2 (ANSYS Inc.: Canonsburg, PA, USA).

2.1. Methods of External Pre-Stressing Strengthening
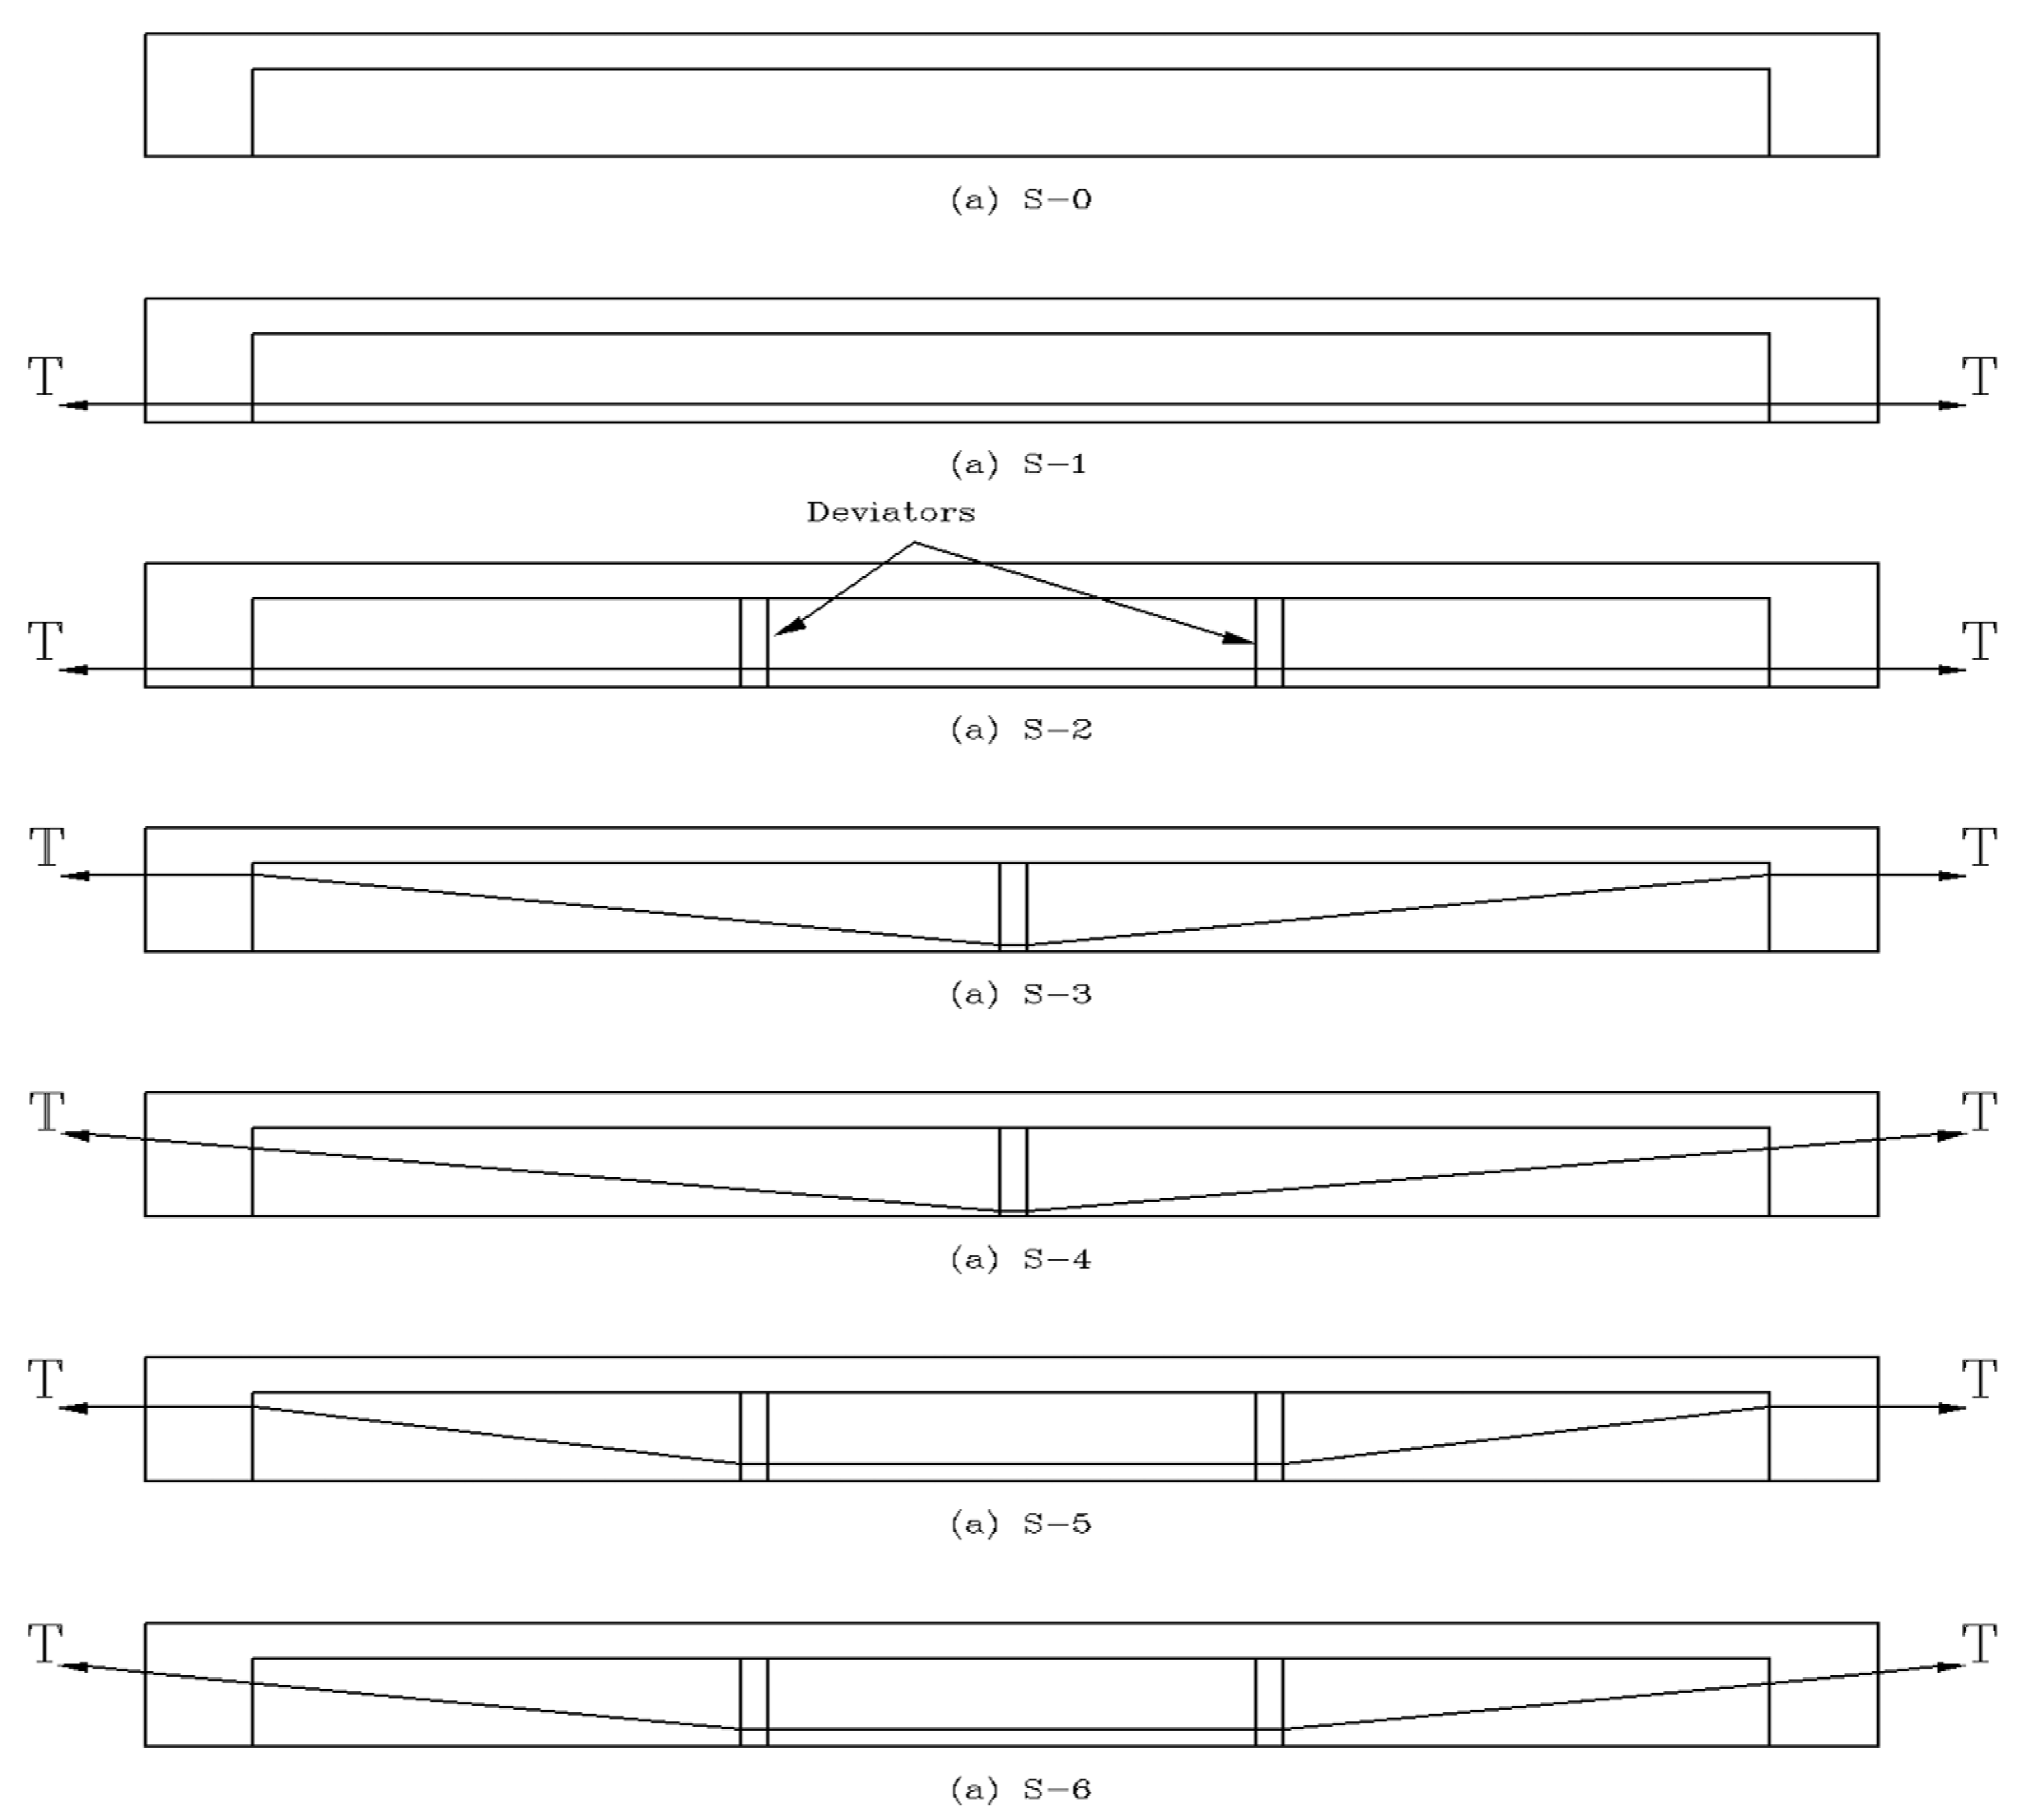
Deviators were used to change the profile of the external tendons and the technique of external pre-stressing strengthening. According to the number of deviators parameter, there were two types of tendon profile, namely, straight line along the beam of the frame, and U-shaped line with two inflection points (a fifth of the beam span).With respect to the tendon profile parameter, there were six frames, including: two frames with tendons in the positive bending zone of the beam (F1, F2), a frame with tendons in the negative bending zone of the beam (F3), a frame with tendons in the negative bending zone of the beam and the column of the frame (F4), a frame with straight-line tendons along the beam span in both the positive and the negative bending zones (F5),and a frame with U-shaped line tendons along the beam span (F6). The original sample (F0) and the six strengthened samples are presented in Figure 1.

2.2. Sample Design

A total of six single-bay RC frames that were strengthened with external tendons and one contrastive RC frame without external tendons were tested under four-point vertical loading. All of the samples were single-bay frames with a total horizontal length of 3.2 m, a calculated T-section beam span of 3.0 m, a total vertical column height of 1.28 m, and a clear column height of 1.0 m. The flange width and height of the T-beam section were 280 mm and 80 mm, respectively. The width and the height of the web of the beam section were 100 mm and 200 mm, respectively. The column section was rectangle with 100 × 200-mmdimensions. Figure 2 shows the geometric details of the testing frames. In all the frames, the internal longitudinal reinforcement consisted of two 12 mm-diameter steel bars (Φ12 HRB335) on each side of all the sections and two additional 8 mm-diameter steel bars (Φ8 HRB335) at the top of the beam sections only. All the specimens were designed according to the principle of “strong shear capacity and weak bending capacity” to ensure the flexure failure that occurred before the shear failure. The stirrups were(Φ6 HRB335) rebars with a spacing of 100 mm along the column height and bending shear region of the beam near the column (from 0 to 1/3 L and 2/3 L to 1 L) and a spacing of 150 mm in the pure bending region of the beam (from 1/3 L to 2/3 L). The reinforcement details of the T-beam and the rectangle-column are shown in Figure 2. Two 9.5 mm-diameter pre-stressed steel strands with a tensile strength of 1860 MPa were placed symmetrically with respect to the web or the column, serving as the external tendons, and the designed strength grade of the concrete was C40 [1].

2.3. Loading Method and Pre-Stressing of Tendons

The external tendons were installed in the samples as the profile of each case, as shown in Figure 1. Next, the pretension force effect was applied at all lengths of the tendon with a control pre-stress of 0.5 fu, where fu was the tensile strength of the external tendon, which was 1860 MPa. During the tensioning, the tendon elongation and the concrete strain at the top of the beam and the columns were measured simultaneously to prevent the concrete from cracking, as shown in Figure 3. Next, loading was performed at two points in the third of the horizontal frame spans, as shown in Figure 4.

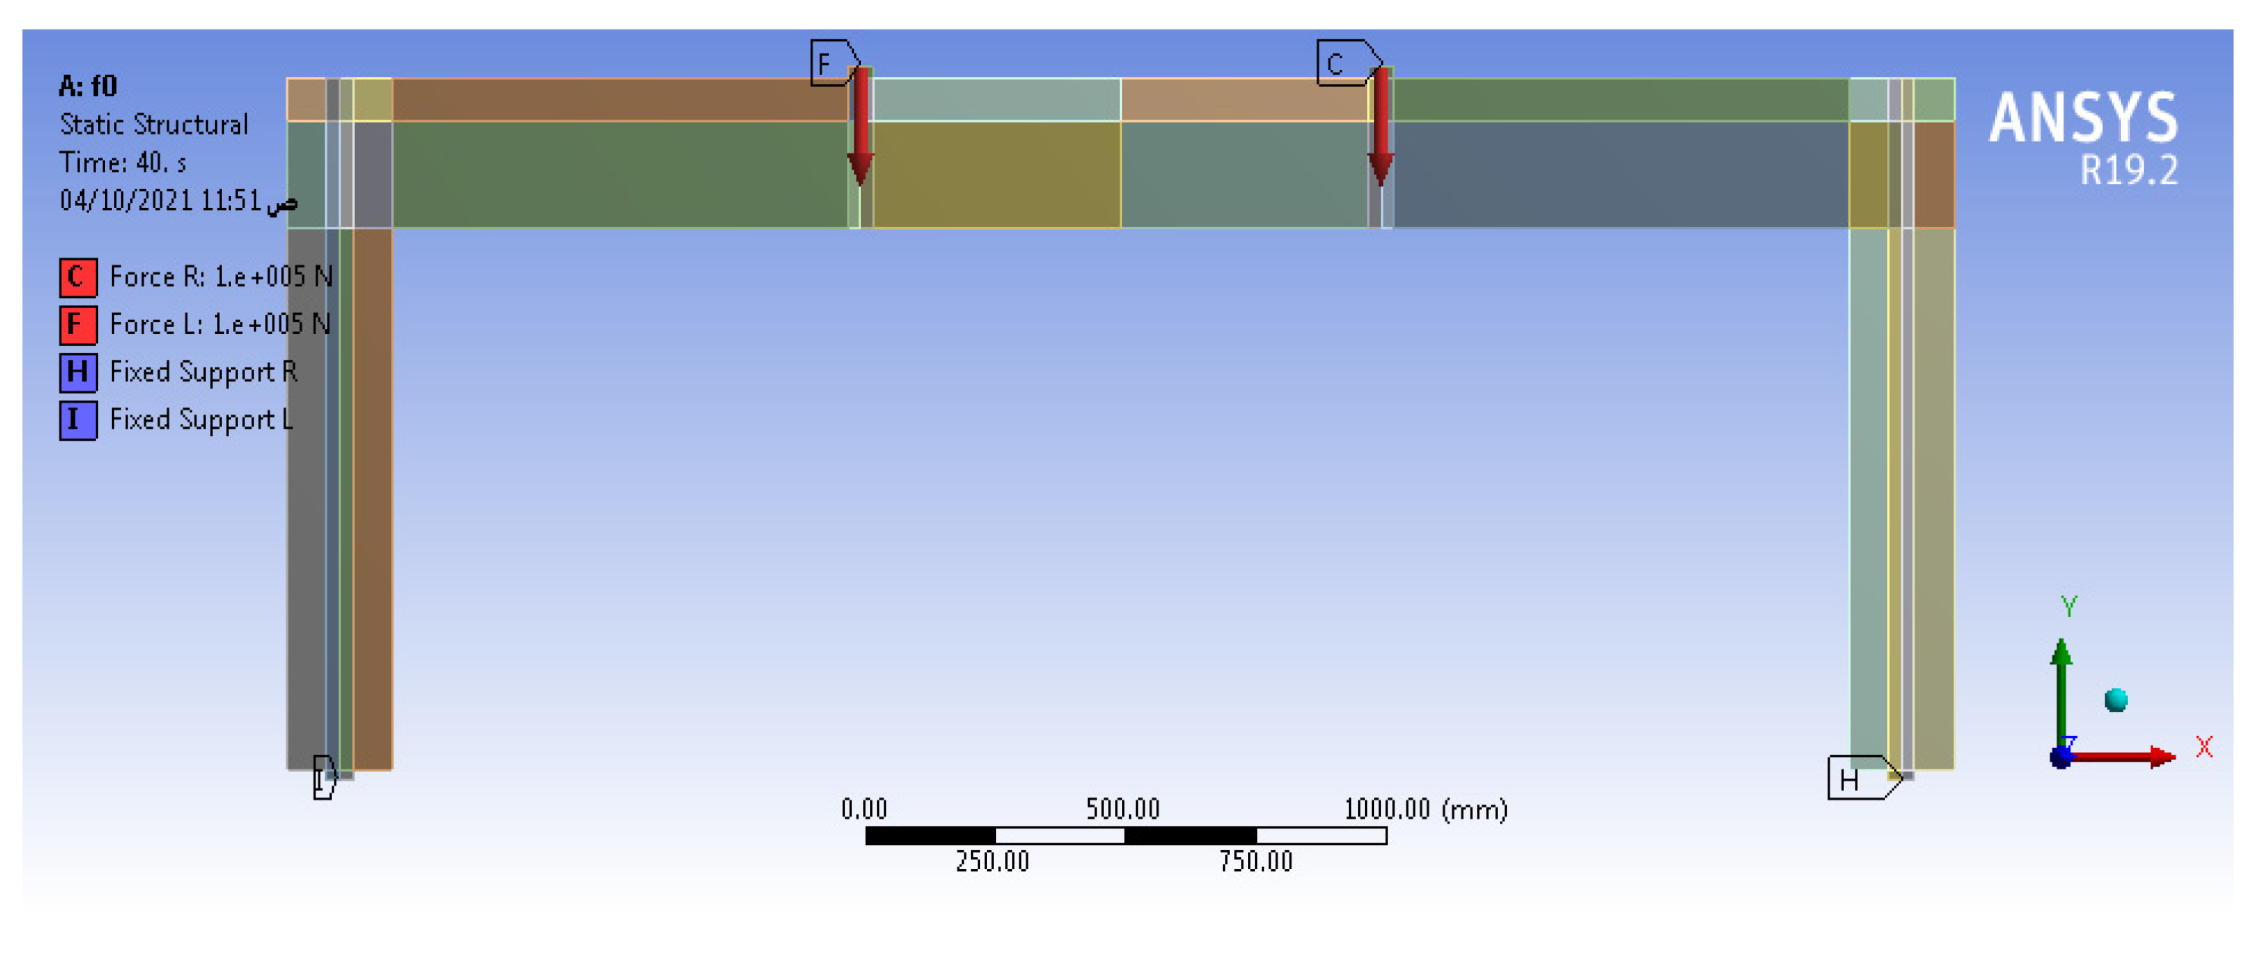
2.4. Programming Models

A non-linear analysis using the ANSYS WORKBENCH 19.2 program was performed to simulate the effect of the external pre-stressing strengthening. The modeling was performed with two loading cases. One loading case included the testing load without pre-stressing force (F0). Another case included the testing load plus the pre-stressing force for the different tendon techniques. The pre-stressing force in the cable was calculated as a temperature degree with a negative sign for all the tendon profiles (363.5 °C) to accord all the tendons the same stress (930 MPa).Shell element (SOLID 65, ANSYS Inc.: Canonsburg, PA, USA) [18] was used to model the concrete, beam element (BEAM188, ANSYS Inc.: Canonsburg, PA, USA) [18] was used to model the reinforcement of the steel and tendon, and contact element (CONTA175, ANSYS Inc.: Canonsburg, PA, USA) [18] was used to model the contact between the steel/tendon and the concrete. It should be noted that the axial stiffness of the cable was considered while the flexural stiffness of the cable was ignored during the simulation of the pre-stressing tendons.

3. Verifications of the Models

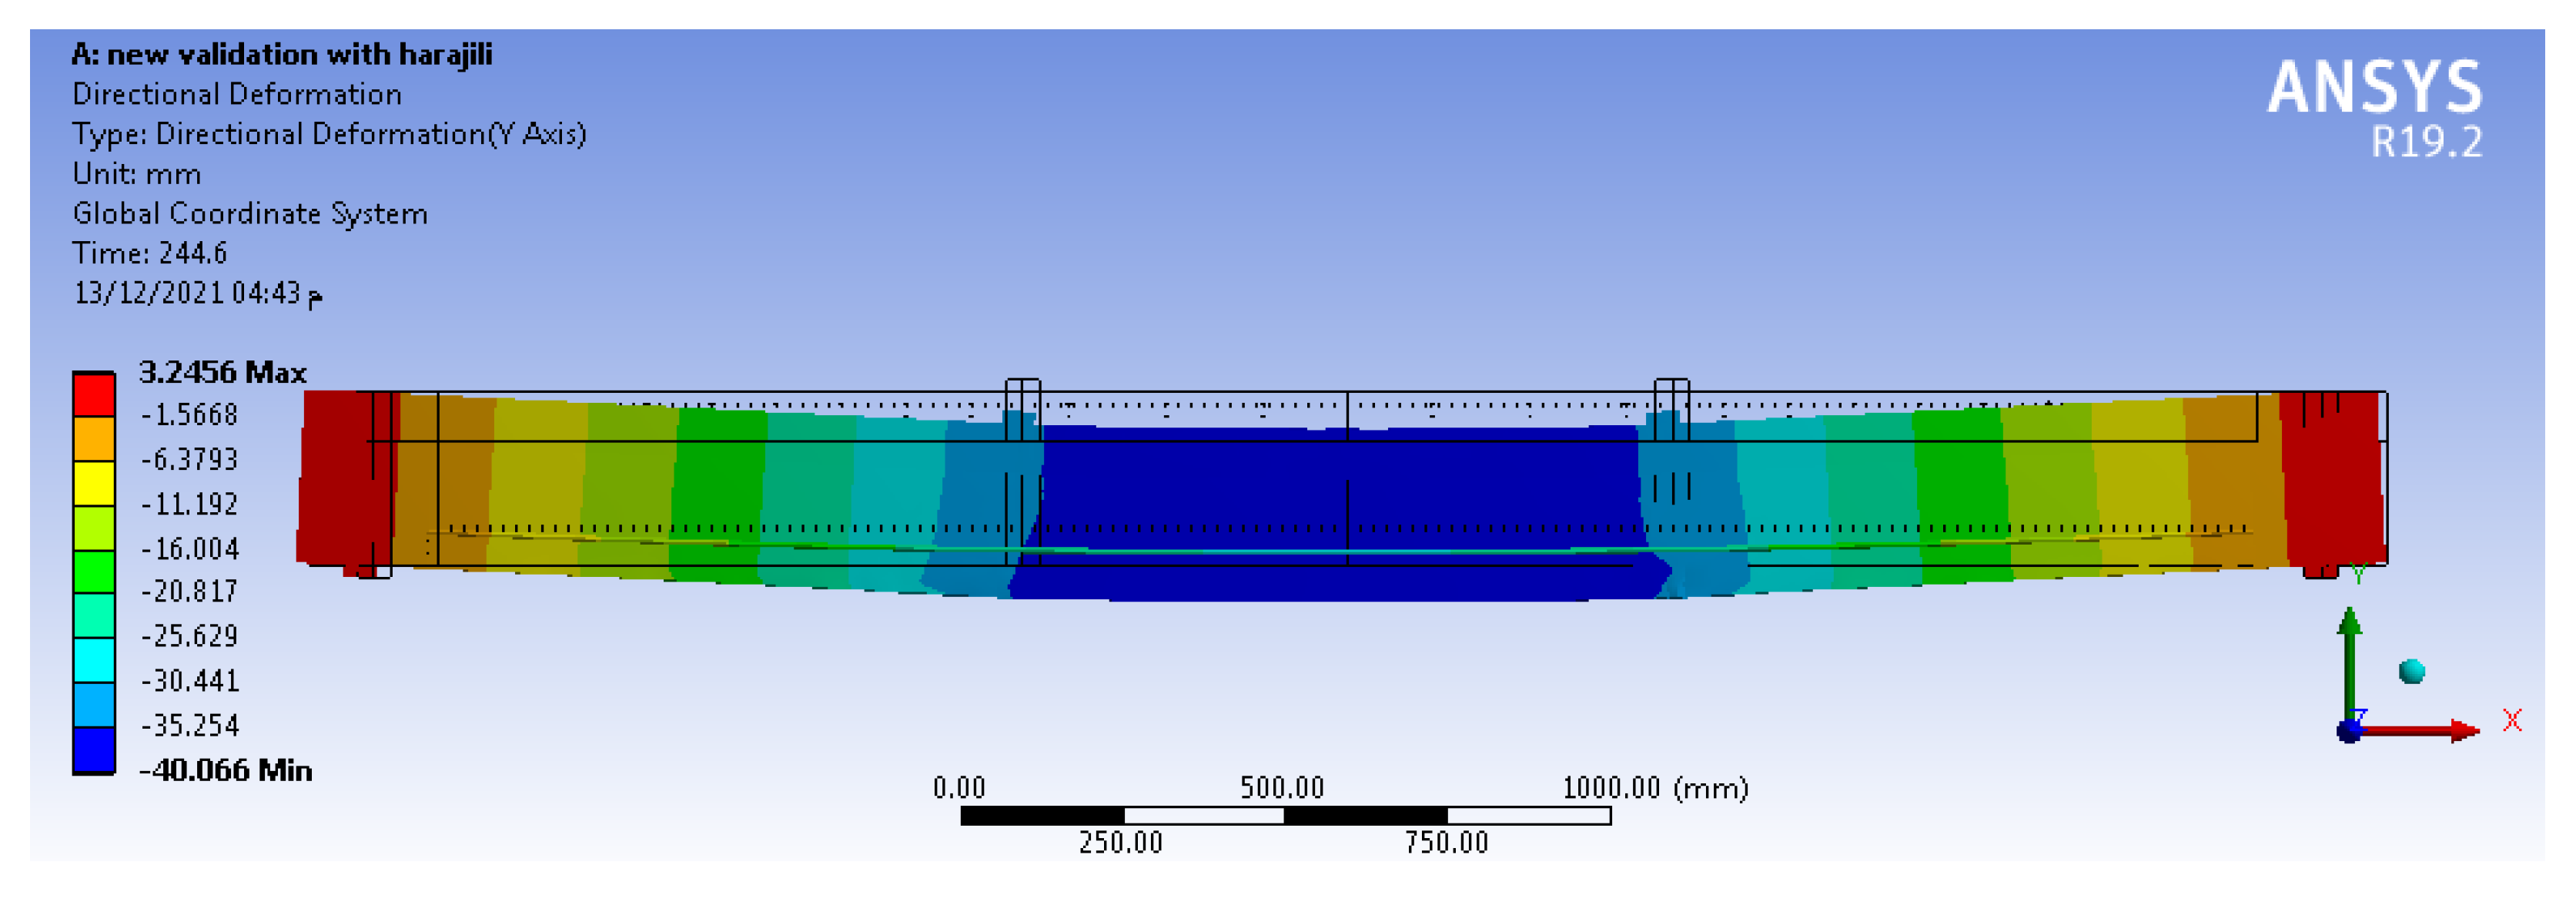
3.1. Verification with Zou J. et al.

The FE models used in this study were verified against the field measurements of existing samples in Guangzhou 510006, China, which were strengthened using post-tensioning techniques by Zou J. et al. [1]. These measurements are shown in Figure 5. Laboratory tests were performed under the same conditions using ANSYS WORKBENCH 19.2 for beams. This was the main part of our paper (frame), as mentioned in the previous section on the sample design (see Figure 2a and Figure 6).
The failure stages of the original unstrengthened sample (S0) and the six strengthened samples (S1, S2, S3, S4, S5, and S6) under the same loading conditions were approximately similar to each other. Therefore, the failure stages of the sample S0 only are presented below
For the sample S0 (control beam), the first micro-crack was recorded at the bottom of the beam in the middle-third part when the load reached 8 kN and the maximum deflection was less than 1 mm. At this point, the load was listed as a cracking load, as shown in Figure 7. While the loading continued to increase, the deflection and the concrete strain of the sample increased simultaneously; the number and the size of the cracks in the middle third part also increased. In addition, the cracking part moved from the pure bending region (middle third) to the bending shear region (two edge thirds). The stress of the tensile steel reinforcement of the sample S0 reached its yield strength when the loading value and the maximum deflection of the sample recorded 11.5 kN and 3.42 mm, respectively. At this point, the load was listed as the yield load. After this point (the yield point), the steel reinforcement could no longer carry the load and the strain of the sample increased rapidly, leading to an increase in the width and length of the cracks over a short time. Finally, when the load value and the maximum deflection of the sample recorded 69.63 kN and 30.41 mm, respectively, the cracks expanded through the section’s tensile region to the compressive region and the sample failed in a typical flexural failure with a large deflection, as shown in Figure 8 and Figure 9. At this point, the load was listed as the ultimate load (load-carrying capacity). The FE’s process of failure was similar to the experimental test process.
Figure 10 shows the relation of the loading to the maximum deflection of the strengthened beams from the FE tests and the laboratory tests. The FE results were not very different from those of the laboratory results due to some missing data that were assumed in the FE models. Therefore, additional models were performed and additional validation with the results obtained by Harajli M., et al. [19] is presented in the following section.

3.2. Verification with Harajli M. et al.

Harajli M. et al. [19] tested 12 simply supported beam specimens with T-sections over a 3.0 m span, as shown in Figure 11. The specimens were divided into four groups, each containing two externally pre-stressed beams and one without pre-stressing. Two externally pre-stressed RC beams, T2S and T4S, were used for the analysis and verification. Beam T2S was from the second group, while beam T4S was from the fourth group. No deviator is provided in beams T2S and T4S. Beams T2S and T4S feature a straight tendon profile with eccentricity equal to 84 mm along the full span. A summary of the material parameters of these beam specimens is provided in Table 1.
The comparisons between the analytical predictions and the experimental results of the entire load-midspan deflection response of the beam specimens are presented in Figure 12. It can be seen from Figure 12 that the FE model reproduced the experimental load–deflection response from zero loads up to ultimate with considerable agreement. It can also be seen that the curves exhibit approximately three different stages during the loading process. The transition from the first stage to the second stage was the result of the cracking of the concrete, while the transition from the second stage to the third stage was the result of the yielding of ordinary reinforcing steel. The third stage was the failure stage, with maximum mid-span deflection, as shown in Figure 13. These stages of loading and failure were presented in the previous validation.

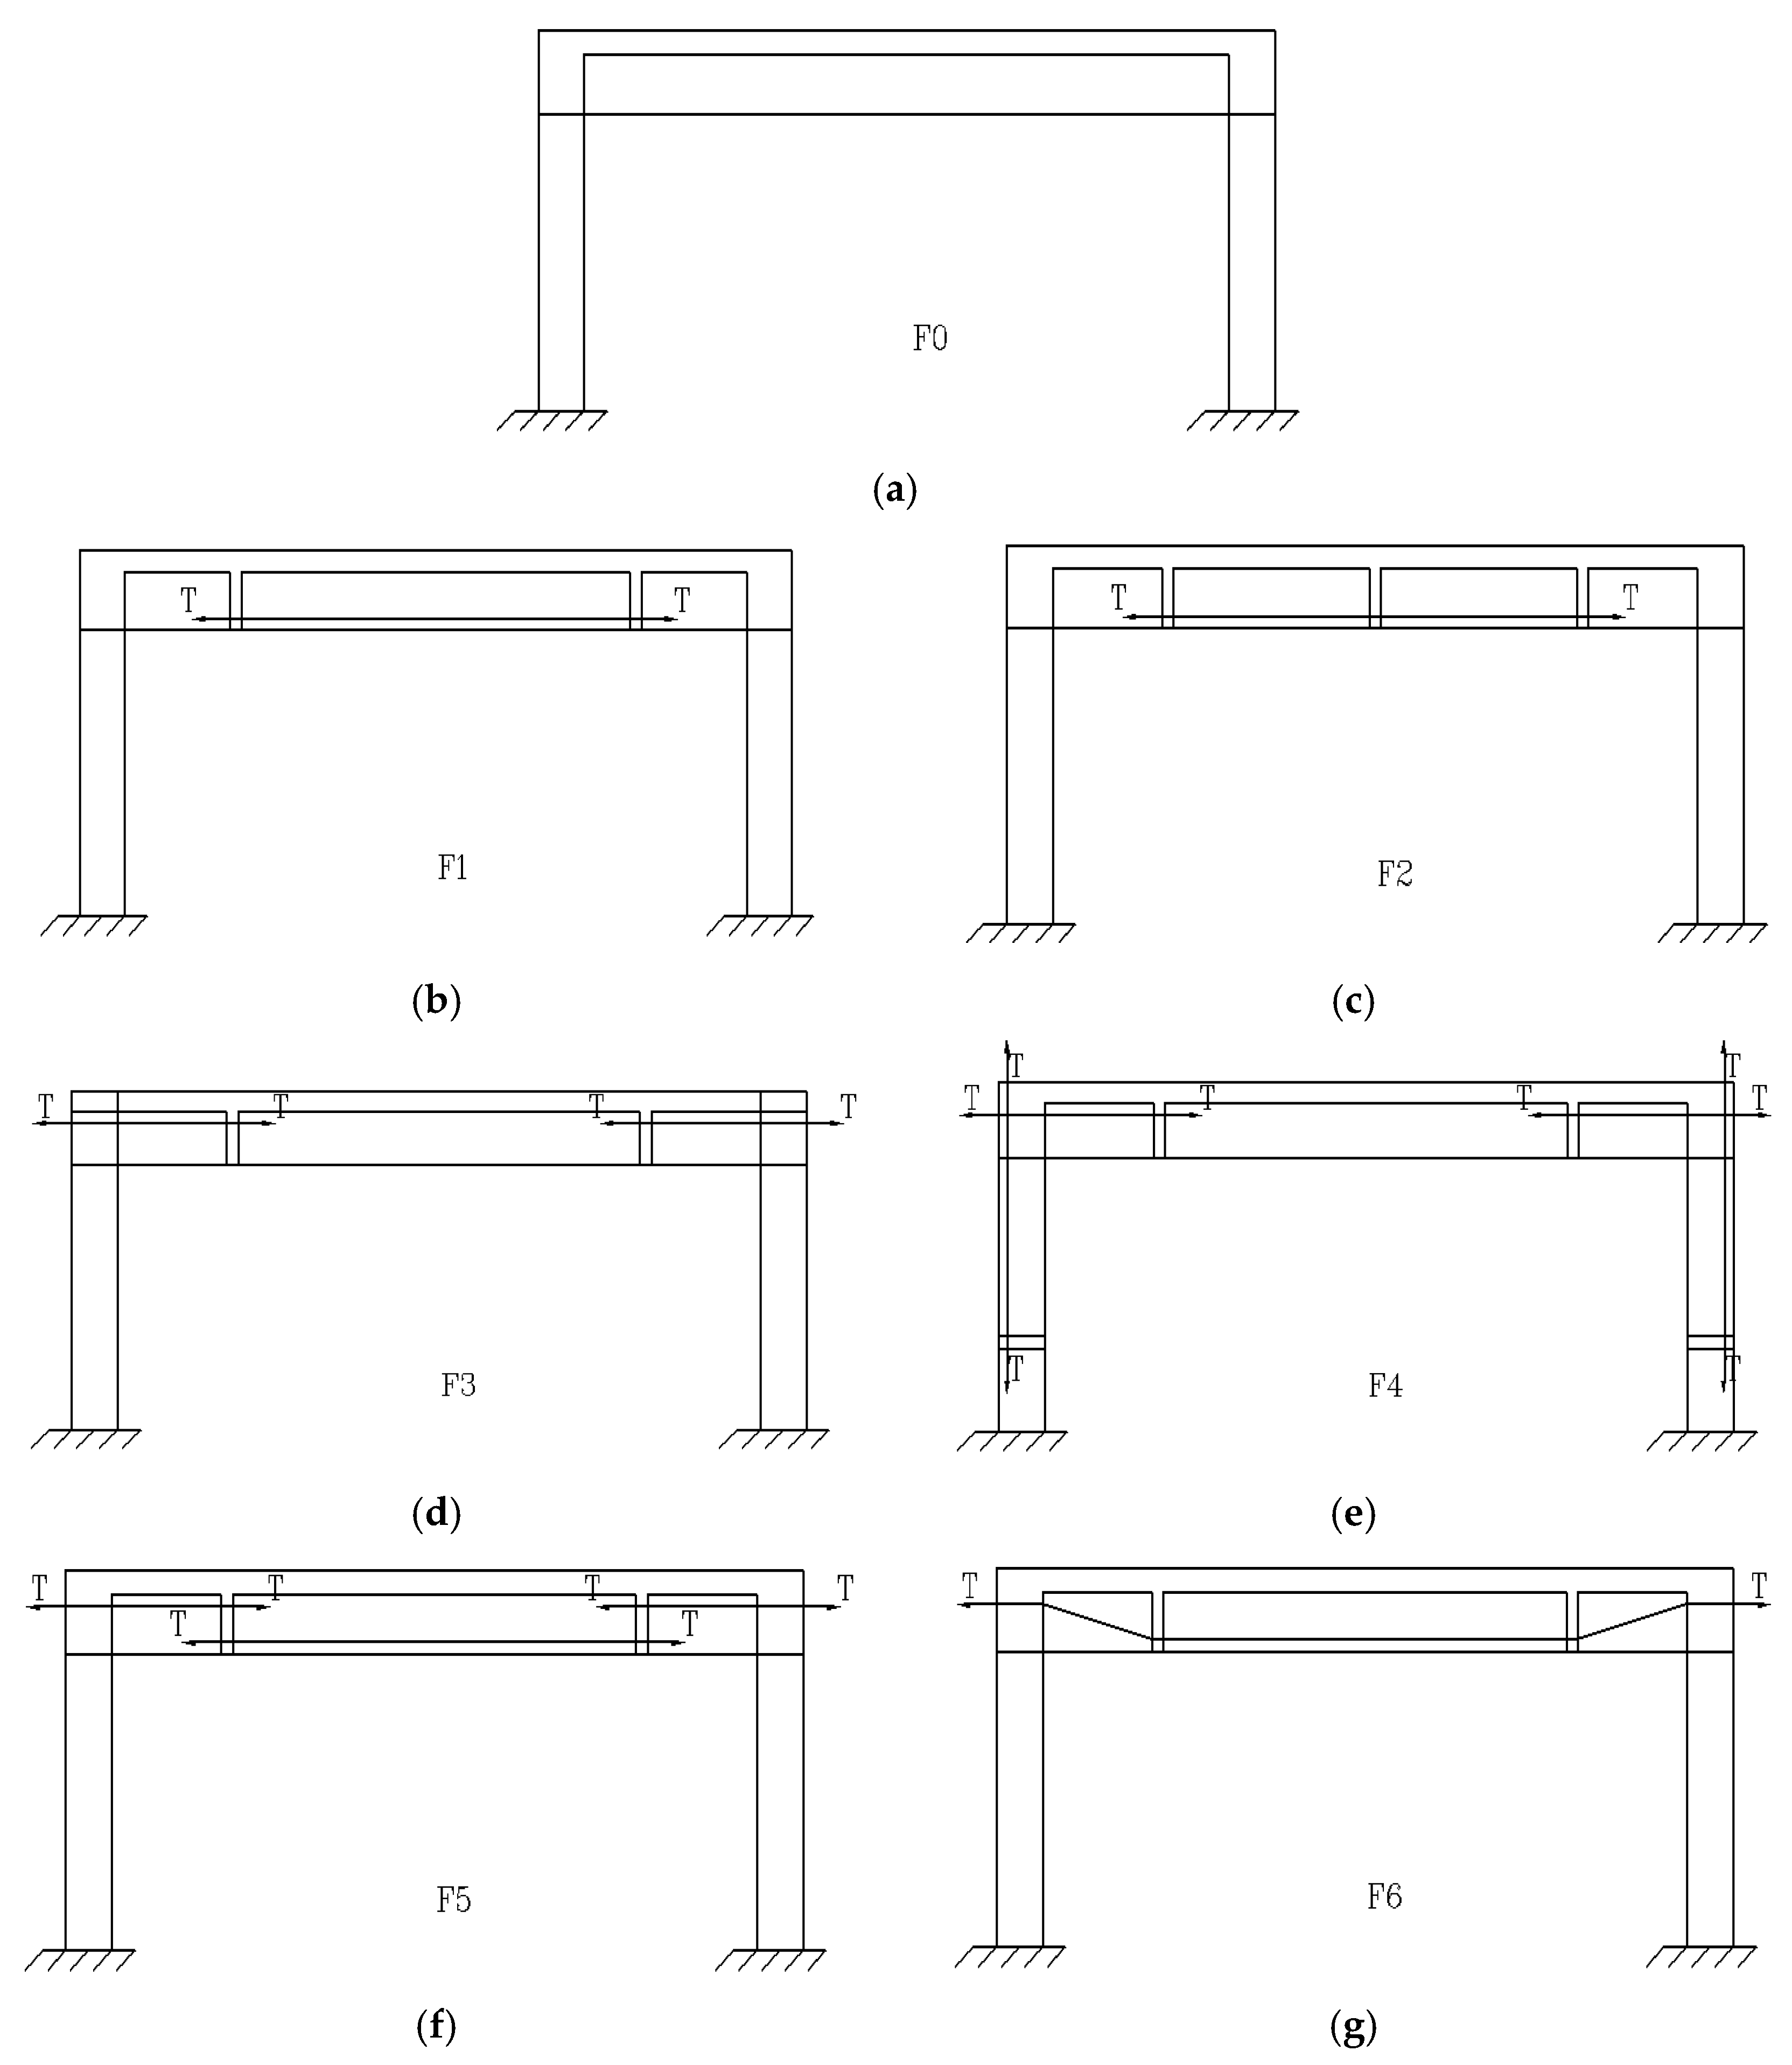
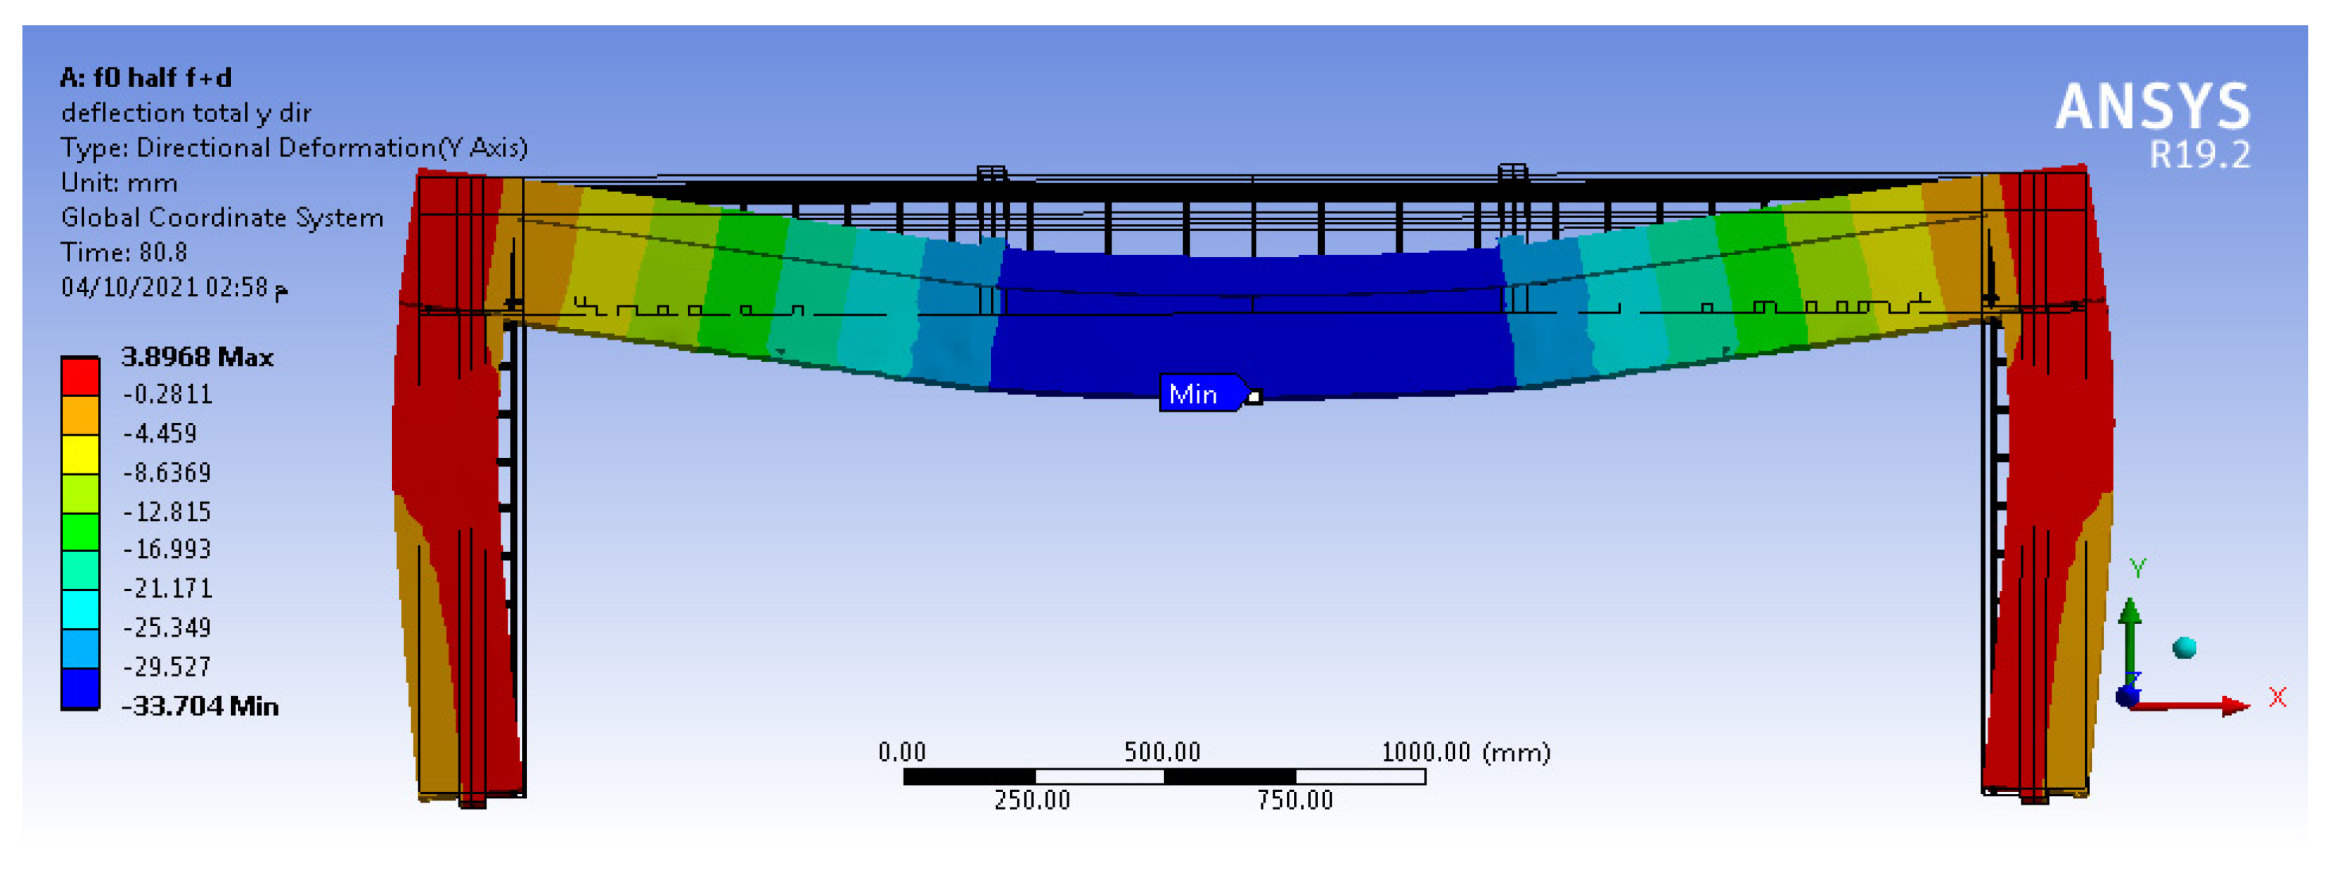
4. Strengthening Frames with External Tendons

4.1. Failure Stages

The failure stages of the original unstrengthened frame (F0) and the six strengthened frames (F1, F2, F3, F4, F5, and F6) under the same loading conditions were approximately similar to each other. Therefore, the failure stages of sample F0 only are presented below.
For sample F0, the first micro-crack was recorded at the bottom of the beam of the frame in the middle third part, in addition to the upper outer part of the frame columns, when the load reached 23 kN and the maximum vertical deflection was less than 1 mm. At this point, the load was listed as the cracking load, as shown in Figure 14. While the loading continued to increase, the deflection and the concrete strain of the frame increased simultaneously. The number and the size of the cracks in the middle third part also increased. In addition, the cracking part moved from the pure bending region (middle third) to the bending shear region (two edge thirds) and the column regions. The stress of the tensile steel reinforcement of the sample F0 reached its yield strength when the loading value and the maximum deflection of the sample recorded 33 kN and 3.41 mm, respectively. At this point, the load was listed as the yielding load. After this point (the yield point), the steel reinforcement could no longer carry the load and the strain of the sample increased rapidly, leading to an increase in the width and length of the cracks over a short time. Finally, when the load value and the maximum deflection of the sample were160 kN and 33.7 mm, respectively, the cracks expanded through the tensile region to the compressive region and the sample failed in a typical flexural failure with a large deflection, as shown in Figure 15 and Figure 16. At this point, the load was listed as the ultimate load (load-carrying capacity).
Generally, the failure processes of six external pre-stressed strengthened frames (F1, F2, F3, F4, F5, and F6) were similar to those of the unstrengthened frame (F0). The behavior of the seven samples under the same loading technique underwent the following steps:
(1)
Appearance of a micro-bending crack (cracking stage).
(2)
Yield of tensile steel reinforcement and rapid deflection (yielding stage).
(3)
Sample failure and submission due to large flexural deflections (ultimate stage).
The load values of the cracking, the yielding, and the ultimate stages of the six external pre-stressing strengthening frames (F1, F2, F3, F4, F5, and F6) were larger than those of the unstrengthened sample (F0) due to the effect of the external pre-stressing tendons. The theoretical test (finite element) results of the cracking, yielding, and ultimate stages, such as the load value, vertical deflection, and stress of the columns in all samples are summarized in Table 2.

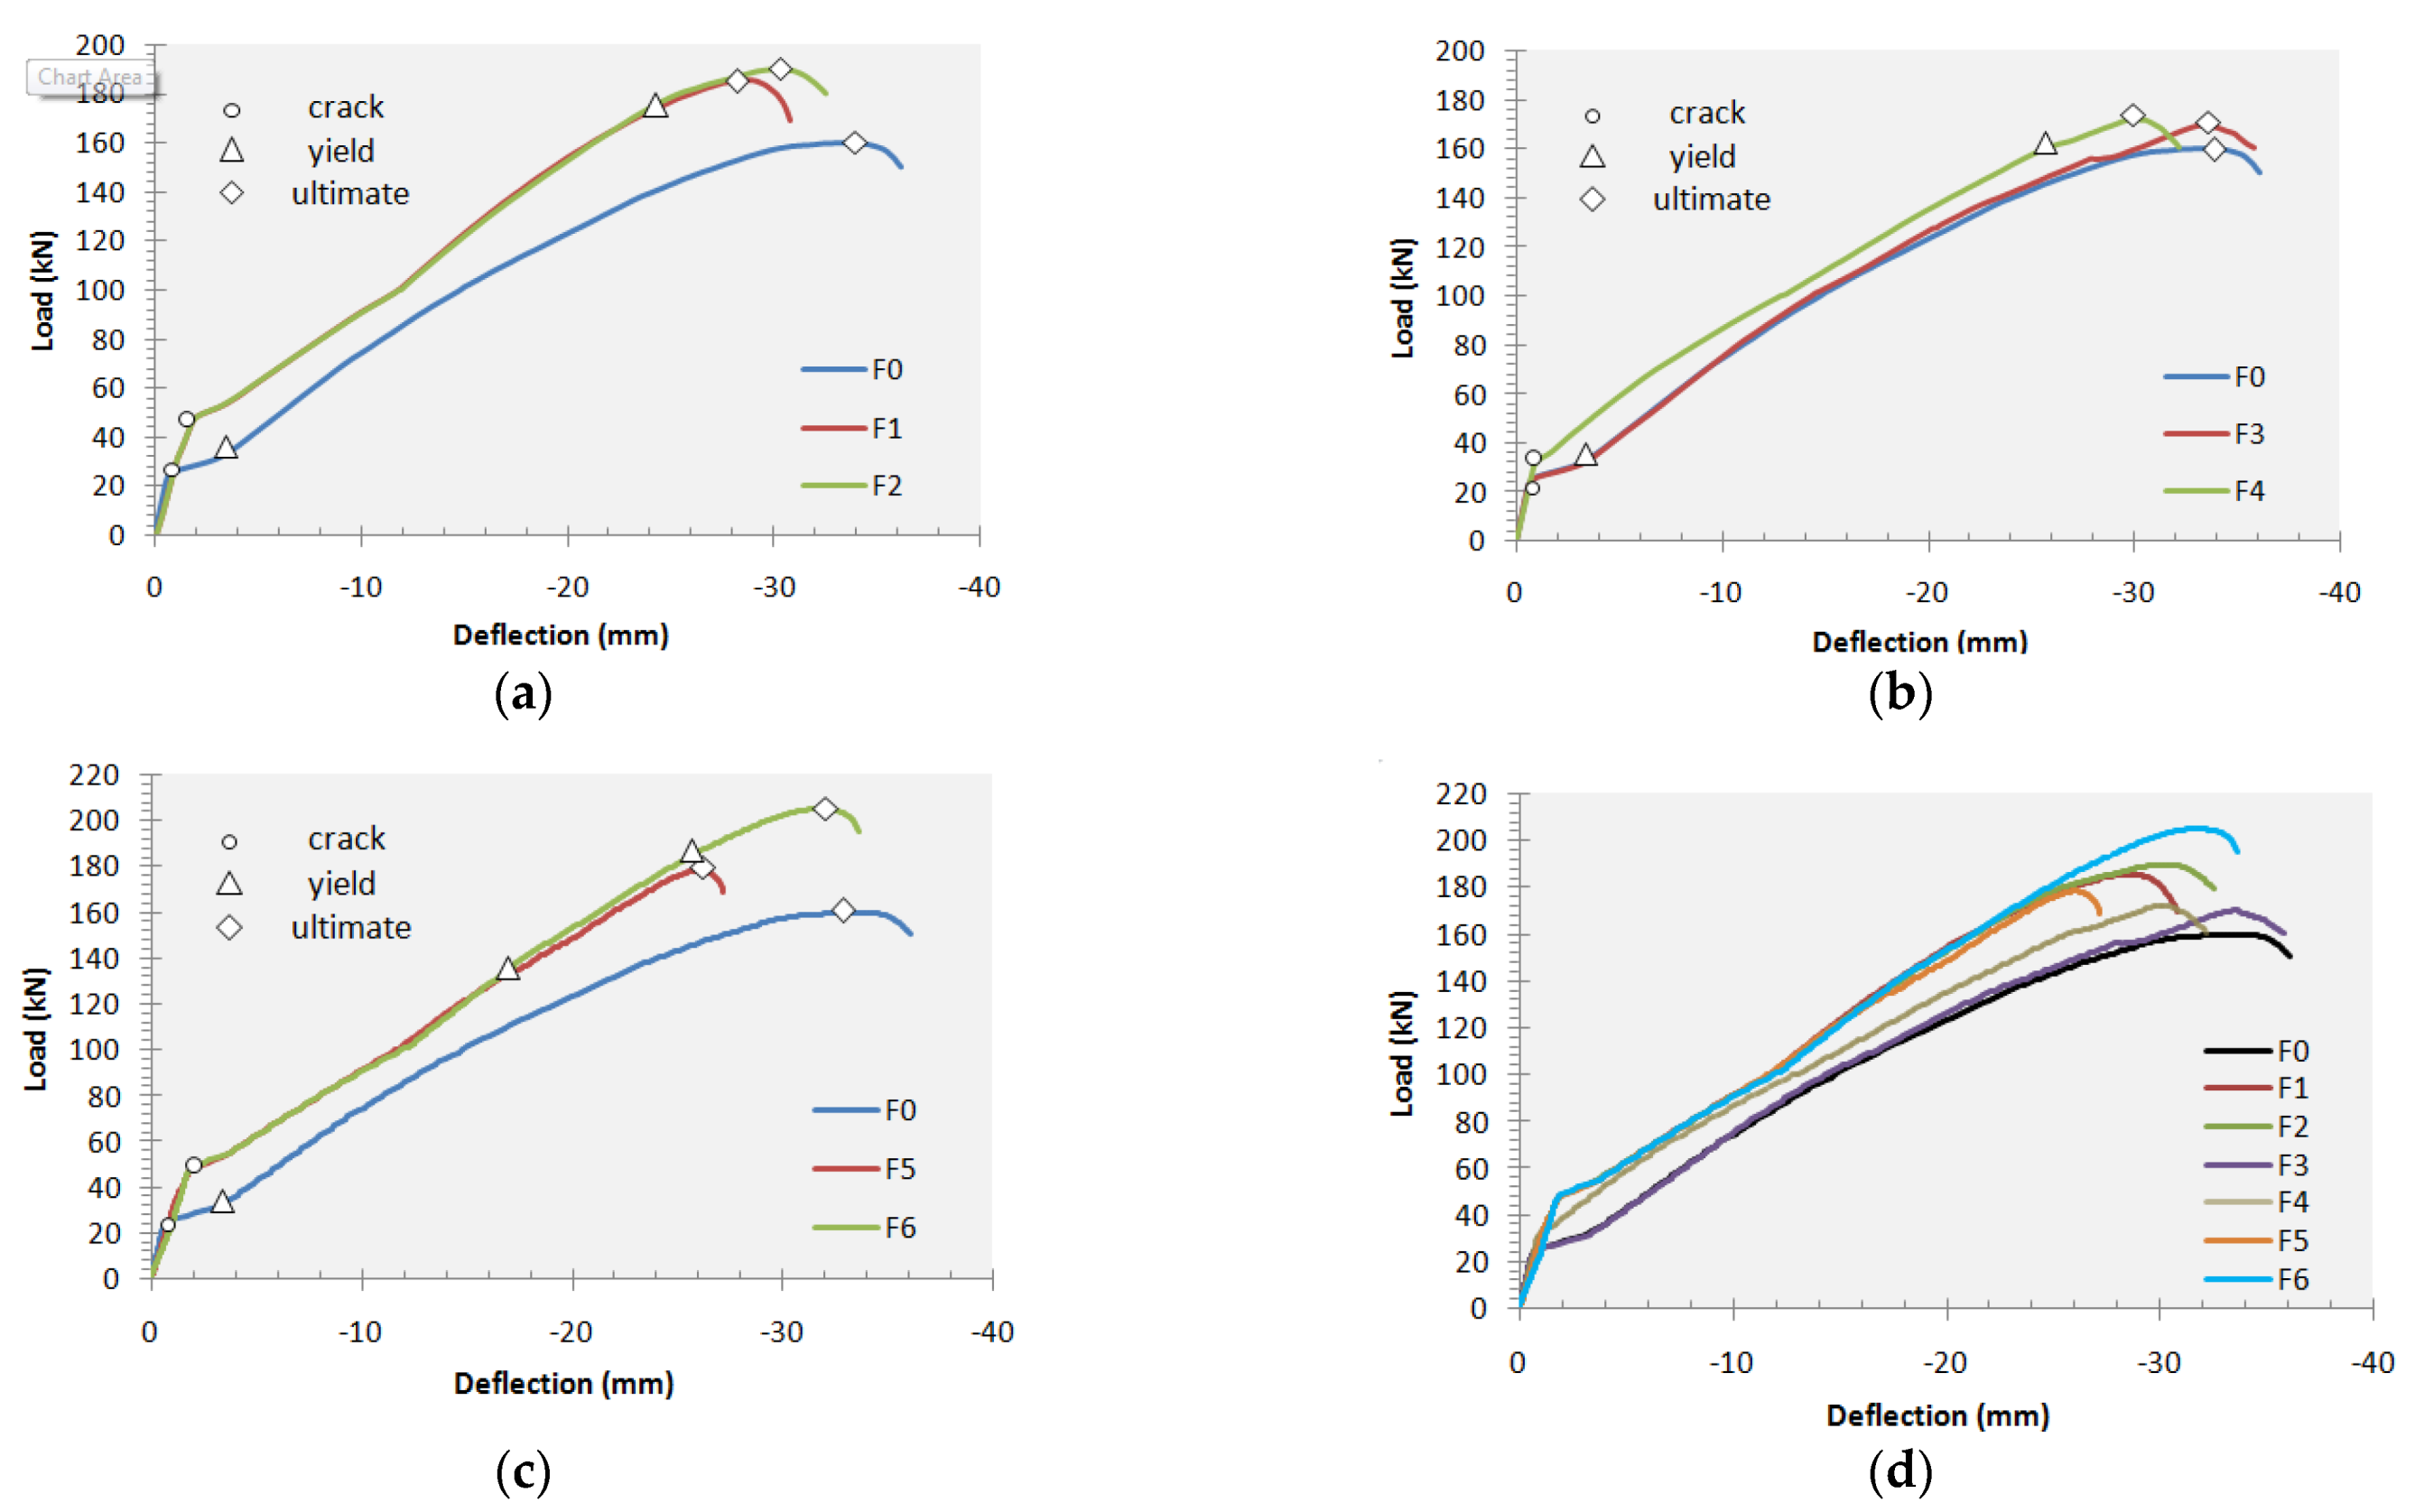
4.2. Load–Deflection Relation

Figure 17 clarifies the relation of the vertical loading to the maximum vertical deflection for the seven samples from the FE tests. The figure shows that the four externally strengthened samples, in which the lower part of the frame-beam was enhanced (F1, F2, F5, and F6), exhibited the same mechanical behavior under loading before the cracking stage until the load and the deflection reached about 47 kN and 1.8 mm, respectively. Furthermore, the frame samples, in which the lower part of the frame-beam was not enhanced (F3 and F4), could not exert a highly positive effect on the load–deflection curve, especially in the case of the F3 sample (tendons in the negative moment zone of the frame-beam only), as shown in Figure 17b, because the tension of the tendons, in this case, dragged the column near the beam, resulting in additional moments rather thanreversible moments. For the unstrengthened sample (F0), the deflection increased rapidly after the initial cracks and the tensile reinforcements reached the yielding. The specimen subsequently failed with high ductility. On the other hand, the rest of the strengthened samples, except for (F3), were able to resist loading better than (F0) and delay the yielding of the tensile reinforcements due to the ability of the tendons to carry part of the new tensile stress resulting from the loading test. This dragged the load–deflection curve upward.
Figure 17a shows the effect of the inner deviator on the load–deflection curve by comparing the results of sample (F1) with sample (F2). It can be seen that when the load was less than the yielding load, the load–deflection curves of (F1) and (F2) were almost identical, but when the load increased again, the gap between the load–deflection curves of sample (F1) and sample (F2) appeared. This was because when the load was less than the yielding load, the vertical deflection of the sample at the mid-span was very small. Therefore, the external tendons and the surrounding middle deviators in sample (F2) were separated. Next, when the load exceeded the yielding stage, the vertical deflection of the sample at the mid-span increased rapidly and led to the external tendons attaching to the surrounding middle deviators; consequently, the effects of the deviators in the sample (F2) began to clear and improve its mechanical behavior. As a result, the ultimate load of sample (F2) recorded 189.7 kN, which was increased by a slight value (2.2%) compared to sample (F1), which recorded 185.7 kN due to the short span of the model. However, it is expected for this percentage to increase for large spans. Generally, the deviator exerted a beneficial effect on the ultimate load of the strengthened samples.
Figure 17c shows the effect of the tendon profile on the load–deflection curve by comparing the results of sample (F5) with sample (F6). It can be seen that the differences between the load-deflection curves of (F5) and (F6) appeared in both the yielding and the ultimate load, where the (F6) sample recorded 185.1 kN and 205 kN, respectively. These values were increased by 37% and 14.8%, respectively, compared to sample (F5), which recorded 135.1 kN and 178.6 kN, respectively, due to the U shape of the tendon, which was similar to the final bending moment shape. The continuity of the tendon along the beam in the case of sample (F6) led to providing in the process of pre-stressing compared to sample (F5), in which the tendon was divided into three-separate parts. Furthermore, the two inner deviators in (F5) were subjected to more horizontal force than (F6) because the tension of the tendons was performed at two different points on every mid-deviator (the downward point for the tendon in the positive bending zone and the upward point for the tendon in the negative bending zone). Moreover, the best techniques for strengthening single-bay frames with external pre-stressing tendons were the U-shaped line tendon technique (F6) and the straight-line tendon at the positive bending zone of the frame-beam with inner deviators (F2).

4.3. Stress of Columns

During the loading test of the frame, the normal stresses of the columns were recorded, especially in the top points of the columns, where the maximum negative bending moment was expected, as shown in Figure 18. Table 2 presents the values of the column’s normal compression stresses for all the samples during the test stages. From the table data, it can be observed that the sample with vertical tendons (F4) caused the highest stress in the columns during all the loading stages compared with all the samples because the pre-stressing of the tendons was parallel to the columns, resulting in additional compression in the columns. Furthermore, the samples in which the tendons were placed in the zone of the lower beam (sample F1, F2, and F5) decreased the value of the column stresses compared to other samples. Therefore, it is recommended to place a tendon in the positive bending zone of the frame parallel to its beam.

4.4. Load Capacity

Table 3 summarizes the cracking, yielding, and ultimate loads of all the strengthened samples and their improvement percentages compared to the unstrengthened sample. With the help of Table 3, it can be observed that the strengthening techniques with external pre-stressing tendons could effectively increase the cracking, yielding and ultimate loads of the sample with different percentages. The results of the cracking and the yielding loads of the strengthened frames, except for (F3), increased by a higher percentage than the values of the ultimate loads due to the external pre-stressing tendons, which could delay the yielding of the tensile reinforcements and carry most of the tension stresses. From the comparison of all the samples, the sample that was strengthened with U-shaped line tendons (sample F6) displayed the maximum ultimate load, while the sample that was strengthened with straight-line tendons in the negative moment zone of the frame beam (sample F3) featured the minimum ultimate load. It can further be observed that the samples that were strengthened with tendons in the negative moment zone of the frame (F3 and F4) featured a light priority in flexural loading capacity compared to the unstrengthened sample (F0), so strengthening with external tendons in the negative moment zone only is not preferred for single-bay frames. Generally, samples F6 (strengthened with U-shaped line tendons) and F2 (strengthened with straight-line tendons in the positive moment zone) are a convenient choice for external strengthening with pre-stressing tendons for these samples (single-bay frames).

4.5. Ductility Analysis

From the tests of the externally strengthened samples and their load–deflection curves, the mechanical property of the linear elasticity was clearly seen. Although the high elasticity of these tests was notable, low ductility was shown in these tests due to the rapid failure after the yielding. The ductility of the structure was usually calculated with a displacement ductility coefficient denoted by:
Μ = Δu/Δy
where Δy was the yield deflection or the maximum vertical displacement of the structure that was recorded when the ordinary tensile reinforcement reached its yielding strength, and Δu was the deflection or the maximum vertical displacement of the same structure that was recorded when the load reached the ultimate load of the structure (at the mid-span of the frame-beam in the single-bay frame case). The values of the displacement ductility coefficients of the studied strengthening samples and their comparisons with the unstrengthened samples are presented in Table 4.
Table 4 shows that the externally strengthened samples were less ductile than the unstrengthened sample according to the FE results. The ductility of the five strengthened samples (F0, F1, F2, F4, F5, and F6) decreased from 84.82% to 88.36% compared to the unstrengthened sample (F0)but the ductility of sample (F3) decreased by 7.9% only due to the absence of the pre-stressing effect on the positive moment zone of the frame beam. It may also be noted that the inner deviators exerted a light impact on the displacement ductility coefficient. The decreased percentage of the ductility of the strengthened sample (F2) was approximately 87.55%, while the decreased percentage of ductility for sample (F1) was approximately 88.16%. Furthermore, the profile of the tendon exerted a light impact on the displacement ductility coefficient. The decreased percentage of ductility of the strengthened sample (F5) was approximately 84.82%, while the decreased percentage of ductility for the sample with the U-shaped external tendon along the frame beam (F6) was approximately 87.65%compared to the unstrengthened samples. In general, the effects of all the strengthened samples, except for (F3), on the ductility of frames were similar.

5. Conclusions and Recommendations

From the FE study that was carried out on single-bay RC frames strengthened with external pre-stressing tendons, the following conclusions can be drawn:
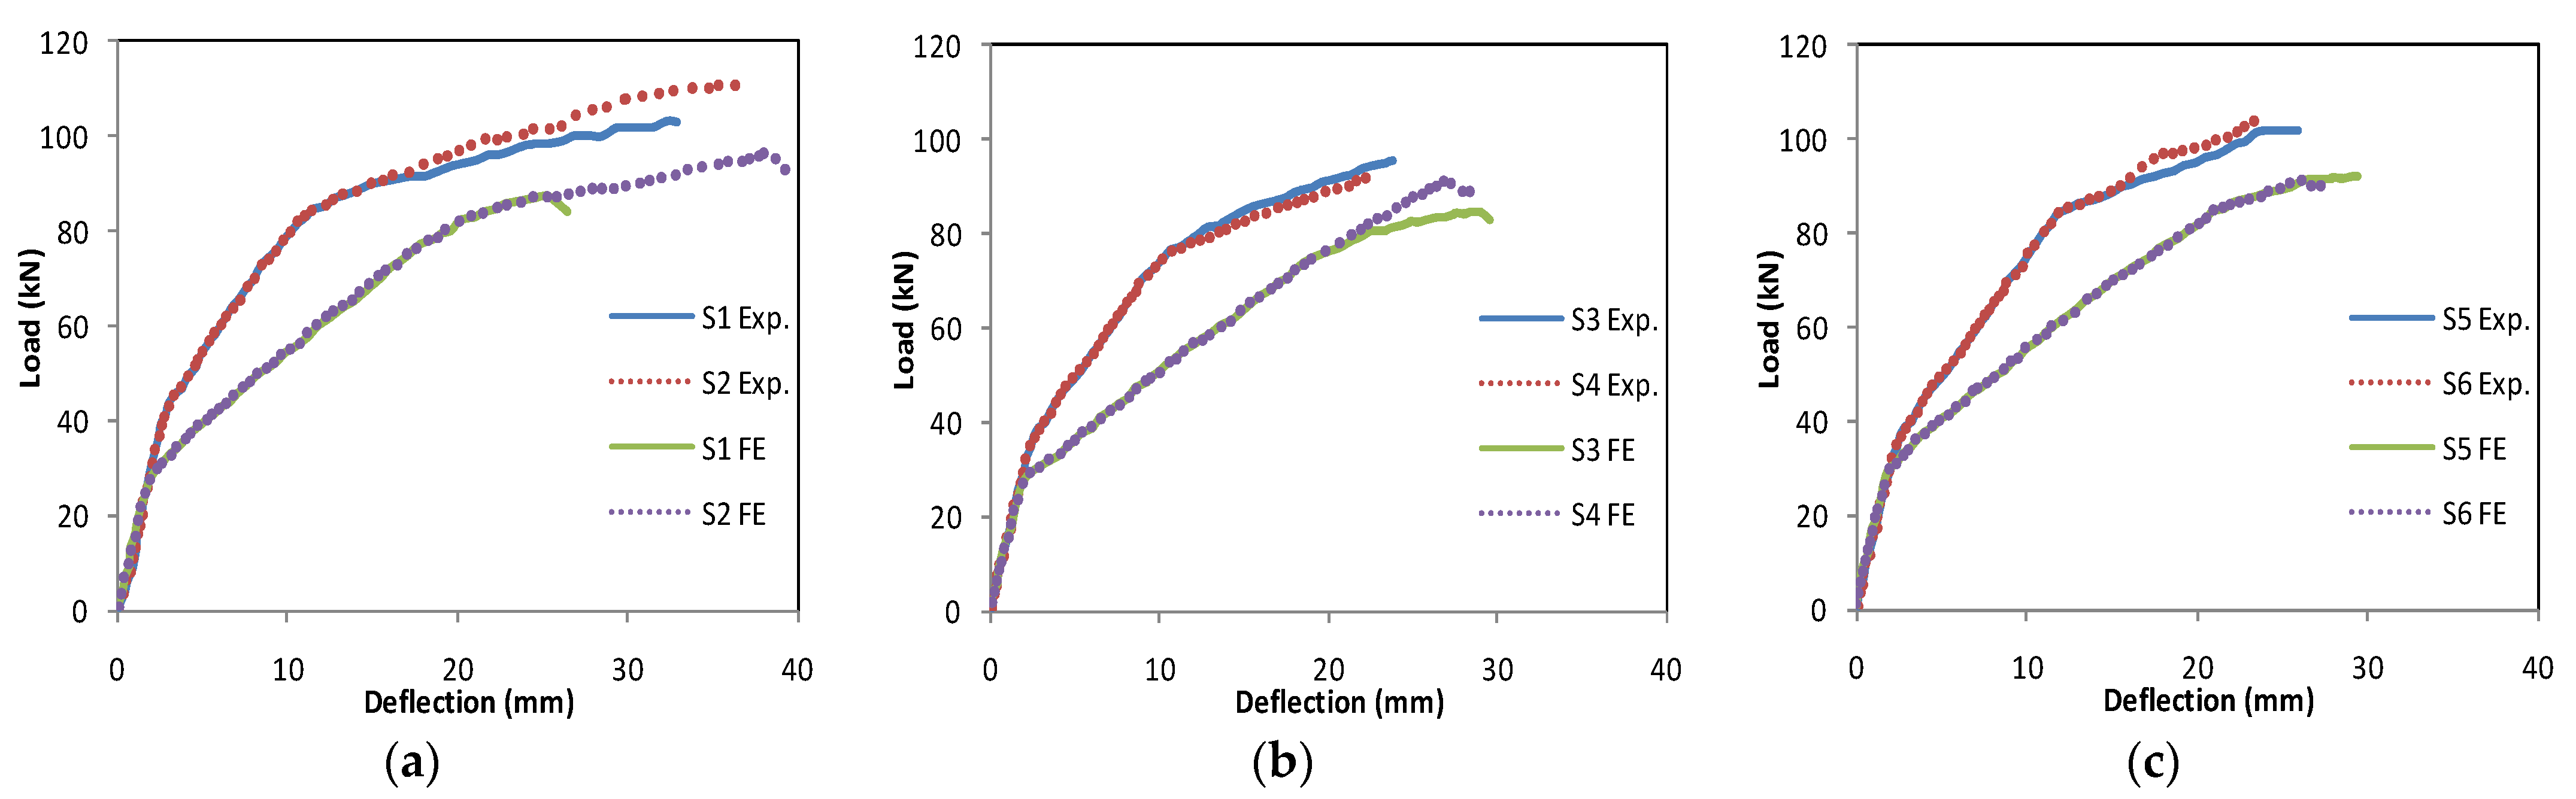
  • Most of the FE results are roughly in agreement with those of the laboratory tests in the case of simple beams.
  • The results show that strengthening with external pre-stressing tendons significantly improves the ultimate loading capacity and mechanical behavior of RC beams and frames.
  • External strengthening frames with pre-stressing tendons can delay the initial cracking load by about 100–104% compared with the unstrengthening frame.
  • External strengthening frames with pre-stressing tendons can increase the load-carrying by about 400–460% for yielding and 16–28% for failure compared to the unstrengthened sample.
  • The tendon profile and the number of inner deviators exert a good effect on loading capacity and a light effect on ductility. All the samples that were strengthened with external tendons in the positive bending zone of the frame-beam (i.e., straight-line tendon F2 or U-shape tendons F6) increased loading capacity by about 11.5 and 19.1 %, respectively, compared to the samples that were strengthened without any tendons in the frame beam zone (i.e., straight-line tendon F3 or F4). Therefore, the technique of strengthening with external pre-stressing U-shaped tendons is recommended in the case of single-bay frames.
  • Strengthening frames with external tendons in the beam-column connection zone is not an appropriate technique for single-bay frames because the tension in this region increases the stress on the columns and the effect of pre-stressing does not extend to the frame beam with adequate value.
  • Further investigations need to be carried out to devise a convenient method of RC frames strengthening with external pre-stressing tendons based on the experimental study.

Author Contributions

Supervision, visualization, writing—original draft preparation: G.A.M.; validation, formal analysis, writing—review and editing: A.S.E.; investigation, software, resources: M.H.E.-F.; writing—review and editing, resources: P.P. All authors have read and agreed to the published version of the manuscript.

Funding

This work was supported by the Slovak Research and Development Agency under the contract no. APVV-20-0281.

Acknowledgments

This work was supported by the Slovak Research and Development Agency under the contract no. APVV-20-0281 and VEGA 1/0363/21.

Institutional Review Board Statement

Not applicable.

Informed Consent Statement

Not applicable.

Data Availability Statement

Not applicable.

Conflicts of Interest

The authors declare no conflict of interest.

References

  1. Zou, J.; Huang, Y.; Feng, W.; Chen, Y.; Yue, H. Experimental study on flexural behavior of concrete T-beams strengthened with externally prestressed tendons. Math. Biosci. Eng. 2019, 16, 6962–6974. [Google Scholar] [CrossRef] [PubMed]
  2. Lee, S.-H.; Shin, K.-J.; Lee, H.-D. Post-Tensioning Steel Rod System for Flexural Strengthening in Damaged Reinforced Concrete (RC) Beams. Appl. Sci. 2018, 8, 1763. [Google Scholar] [CrossRef] [Green Version]
  3. Xin, Y.; Wu, J.; Wu, Q.; Cui, W.; Zhang, S.; Cheng, S. Study on the sickle anchoring joint in external prestressing strengthening of portal frame. Structures 2020, 28, 552–561. [Google Scholar] [CrossRef]
  4. Tan, K.-H.; Ng, C.-K. Effects of Deviators and Tendon Configuration on Behavior of Externally Prestressed Beams. ACI Struct. J. 1997, 94, 13–22. [Google Scholar] [CrossRef]
  5. Fan, Y.L. Collapse Behavior of RC Column-Beam Sub-Structure with External Prestressing Tendons. Appl. Mech. Mater. 2016, 847, 325–330. [Google Scholar] [CrossRef]
  6. Aslam, M.; Shafigh, P.; Jumaat, M.Z.; Shah, S.N.R. Strengthening of RC beams using prestressed fiber reinforced polymers—A review. Constr. Build. Mater. 2015, 82, 235–256. [Google Scholar] [CrossRef]
  7. Liu, T.; Xiao, Y.; Yang, J.; Chen, .S. CFRP Strip CableRetrofit of RC Frame for Collapse Resistance. J. Compos. Constr. 2017, 21, 04016067. [Google Scholar] [CrossRef]
  8. Mukherjee, A.; Rai, G. Performance of reinforced concrete beams externally prestressed with fiber composites. Constr. Build. Mater. 2009, 23, 822–828. [Google Scholar] [CrossRef]
  9. Nordin, H. Strengthening Structures with Externally Pre-Stressed Tendons Laboratory Tests; Technical Report; Department of Civil and Environmental Engineering, Division of Structural Engineering, Lulea University of Technology: Lulea, Sweden, 2005; ISRN LTU-TR--05/07—SE; Available online: http://www.diva-portal.org/smash/get/diva2:997963/FULLTEXT01.pdf (accessed on 20 November 2021).
  10. Nordin, H. Strengthening Structures with Externally Pre-Stressed Tendons Literature Review; Technical Report; Department of Civil and Environmental Engineering, Division of Structural Engineering, Lulea University of Technology: Lulea, Sweden, 2005; ISRN LTU-TR--05/06—SE; Available online: http://citeseerx.ist.psu.edu/viewdoc/download?doi=10.1.1.620.5475&rep=rep1&type=pdf (accessed on 20 November 2021).
  11. Stoll, F.; Saliba, J.E.; Casper, L.E. Experimental study of CFRP-prestressed high-strength concrete bridge beams. Compos. Struct. 2000, 49, 191–200. [Google Scholar] [CrossRef]
  12. Picard, A.; Massicotte, B.; Bastien, J. Relative efficiency of external prestressing. J. Struct. Eng. 1995, 121, 1832–1841. [Google Scholar] [CrossRef]
  13. Abd-Elaty, I.; Eldeeb, H.; Vranayova, Z.; Zelenakova, M. Stability of Irrigation Canal Slopes Considering the Sea Level Rise and Dynamic Changes: Case Study El-Salam Canal, Egypt. Water 2019, 11, 1046. [Google Scholar] [CrossRef] [Green Version]
  14. Kim, J.; Shin, W.-S. Retrofit of RC frames against progressive collapse using prestressing tendons. Struct. Des. Tall Spec. Build. 2013, 22, 349–361. [Google Scholar] [CrossRef]
  15. Mahmoud, N.S.; Badr, A.; Ssalem, F.A.; Ghannam, M. Strengthening steel frames by using post tensioned cable. Life Sci. J. 2014, 11, 111–116. Available online: https://www.researchgate.net/publication/289610723_Strengthing_steel_frames_by_using_post_tensioned_cable (accessed on 20 November 2021).
  16. Ghannam, M.; Mahmoud, N.S.; Badr, A.; Salem, F.A. Effect of post tensioning on strengthening different types of steel frames. J. King Saud Univ.-Eng. Sci. 2017, 29, 329–338. [Google Scholar] [CrossRef] [Green Version]
  17. Harajli, M.H. Strengthening of concrete beams by external prestressing. PCI J. 1993, 38, 76–88. Available online: https://www.pci.org/PCI_Docs/Publications/PCI%20Journal/1993/November/Strengthening%20of%20Concrete%20Beams%20by%20External%20Prestressing.pdfcable (accessed on 20 November 2021). [CrossRef]
  18. ANSYS WORKBENCH. Computer Software for Finite Element Analysis, Verification Manual, Release 19.2; ANSYS Inc.: Canonsburg, PA, USA, 2018. [Google Scholar]
  19. Harajli, M.; Khairallah, N.; Nassif, H. Externally prestressed members: Evaluation of second-order effects. J. Struct. Eng. 1999, 125, 1151–1161. [Google Scholar] [CrossRef]
Figure 1. Different methods of external pre-stressing strengthening: (a) Unstrengthened (original) frame; (b) tendons in the positive bending zone; (c) tendons in the positive bending zone with mid-deviator; (d) tendons in the negative bending zones of the beam; (e) tendons in the negative bending zones of the frame; (f) tendons in positive and negative bending zones; (g) U-shaped tendons along the beam.
Applsci 12 00171 g001
Figure 2. Sample design: (a) beam [1]; (b) column.
Applsci 12 00171 g002
Figure 3. Pre−stressing of tendons of sample F2.
Applsci 12 00171 g003
Figure 4. Loading of all samples.
Applsci 12 00171 g004
Figure 5. Different methods of external pre-stressing strengthening beams [1].
Applsci 12 00171 g005
Figure 6. Profile of the external tendon and loading: (a) finite element; (b) laboratory.
Applsci 12 00171 g006
Figure 7. Initial crack of sample S0.
Applsci 12 00171 g007
Figure 8. Cracks in sample S0 at failure.
Applsci 12 00171 g008
Figure 9. Deflection of sample S0 at failure.
Applsci 12 00171 g009
Figure 10. Load–deflection curves of experimental tests [1] and FE models: (a) sample S1, S2; (b) sample S3, S4; (c) sample S5, S6.
Applsci 12 00171 g010
Figure 11. Profile of the external tendon and loading: (a) finite element; (b) laboratory.
Applsci 12 00171 g011
Figure 12. Load–deflection curves of experimental tests [19] and FE models: (a) specimen T2S; (b) specimen T4S.
Applsci 12 00171 g012
Figure 13. Deflection of sample T2S at failure.
Applsci 12 00171 g013
Figure 14. Initial crack in sample F0.
Applsci 12 00171 g014
Figure 15. Cracks in sample F0 at failure.
Applsci 12 00171 g015
Figure 16. Deflection of sample F0 at failure.
Applsci 12 00171 g016
Figure 17. Load–deflection curves for F0, F1, F2, F3, F4, F5 and F6: (a) straight–line tendons at the positive bending zones of the frame–beam (F0 with F1, F2); (b) straight–line tendons at the negative bending zones of the frame (F0 with F3, F4); (c) straight–line and U–shape line tendons along the frame–beam (F0 with F5, F6); (d) all tendon techniques versus the original frame (F0 with F1, F2, F3, F4, F5, F6).
Applsci 12 00171 g017
Figure 18. Normal stress of columns for F0.
Applsci 12 00171 g018
Table 1. Summary of parameters of beam specimens [19].
Beam SpecimenAs (mm2)fy (MPa)Ape (mm2)fpe (MPa)fpu (MPa)f ‘c (MPa)
For SteelFor SteelFor TendonFor TendonFor Tendonfor Concrete
T2S34061239935160740.1
T4S603413.775994198641.8
Table 2. Summary of the test results of all frame samples.
Sample No.Cracking StageYielding StageUltimate Stage
Load kNMax. Deflection mmLoad kNMax. Deflection mmMax. Column Stress MpaLoad kNMax. Deflection mmMax. Column Stress MpaLoad kN
F0230.6333.416.7816033.733.6423
F1471.8175.624.6930.5185.728.8531.4547
F2471.81177.424.7629.44189.730.433247
F3230.6343.76.4170.133.6433.823
F4310.881612634.34172.129.973531
F5461.74135.117.3625.43178.626.13046
F6471.78185.125.7332.7120531.5133.3847
Table 3. Summary of the load capacity analysis.
Sample No.Cracking StageYielding StageUltimate Stage
Load kN% IncreaseLoad kN% IncreaseLoad kN% Increase
F023-33-160-
F147104.4175.6432.1185.716.1
F247104.4177.4437.6189.718.6
F3230343170.16.3
F43138.8161387.8172.17.6
F546100135.1309.4178.611.6
F647104.4185.1460.920528.1
Table 4. Displacement ductility coefficient results.
Sample No.∆y mm∆u mmµ = ∆u/∆y% Decrease
F03.4133.79.9-
F124.6928.851.1788.16
F224.7630.431.2387.55
F33.733.649.17.9
F42629.971.1588.36
F517.3626.11.584.82
F625.7331.511.2287.65
Publisher’s Note: MDPI stays neutral with regard to jurisdictional claims in published maps and institutional affiliations.

