1. Introduction
On 11 September 2016 at 13:10 UTC time a strong, magnitude M
L5.3, earthquake occurred under the Macedonian capital Skopje. More than 100 people were injured and required medical assistance according to the MIA news agency. Using data from the local and regional seismic stations, the UKIM Seismological Observatory SKO estimated its location at 42.008° N and 21.488° E [
1,
2]. Global seismic records favored a shallow focal depth of about 10 km [
3].
Such tremors create panic among residents because the Skopje region has a history of strong and damaging earthquakes. In 1963, the city was hit by a shallow, magnitude 6.1 earthquake with an intensity rating of IX (Mercalli scale). The event caused heavy losses of life and property, killing more than 1000 people, injuring around 4000, and leaving more than 200,000 people homeless. About 80% of the city was destroyed and many public buildings, schools, hospitals, and historical monuments were badly damaged according to numerous reports [
4]. Following the disastrous Skopje 1963 earthquake, a 1964 law was enacted that mandated earthquake resistant design rules for the former territory of Yugoslavia.
On the morning of the 22 March 2020, an earthquake of magnitude M
L5.5 struck the Croatian capital city of Zagreb. The maximum felt intensity was VII-VIII (MSK scale), causing one death and injuring 27 people. It was the strongest earthquake in the Zagreb area in the last 140 years and caused substantial damage in the historical town center. The event parameters were calculated by using data from the Croatian national seismological network and regional seismic stations. According to [
5], the earthquake epicenter was located at 45.907° N and 15.970° E in the Medvednica Mountain at a focal depth of 10 km.
Unreinforced masonry buildings from pre-1945 suffered substantially more damage than reinforced concrete (walls or infilled frames) or confined masonry buildings from the post-1964 period. Such extensive damage from a moderate sized earthquake can be attributed to other factors besides the construction date and building materials, possibly the source mechanism and focal distance in combination with local site effects, which can significantly amplify or de-amplify the shaking.
Beside intensity maps [
6], limited strong motion records of near field ground shaking during moderate earthquakes exist, and those that are available are quite important for testing the validity of the building standards. Here, we aim to analyze response spectra from the Skopje September 2016 and Zagreb March 2020 earthquakes recorded on the closest stations and then apply the Nakamura method and discuss the results in the context of the existing geological maps at each site.
2. Instrumental Data
Three strong motion records were selected for the main event on 11 September 2016—the acceleration recorded at the Seismological Observatory SKO, the seismograms at IZIIS Institute, and the film record at the FCE (Faculty of Civil Engineering—Gradezhen Fakultet). The station locations and epicenter are superimposed on the simplified geology map of the Skopje region (
Figure 1).
Two records of the Zagreb 22 March 2020 earthquake from the closest stations coded QUHS and QARH, were used for our analysis. The stations’ location and the epicenter superimposed over the geology map (detailed explanation in [
7]) of the Zagreb region are displayed on
Figure 2.
Station coordinates, instrumentation, and soil type according to standard Eurocode-8 classification and using V
S30 maps, are listed in
Table 1.
In the Seismological Observatory SKO at epicentral distance of approximately 7.2 km, the acceleration was recorded by the EpiSensor Kinemetrics instrument installed on bedrock. It is a multi-component set consisting of three force balance accelerometer modules mounted orthogonally and with full-scale recording ranges of ±0.25 to ±4 g, that is especially useful at near fault locations and in a variety of structure types.
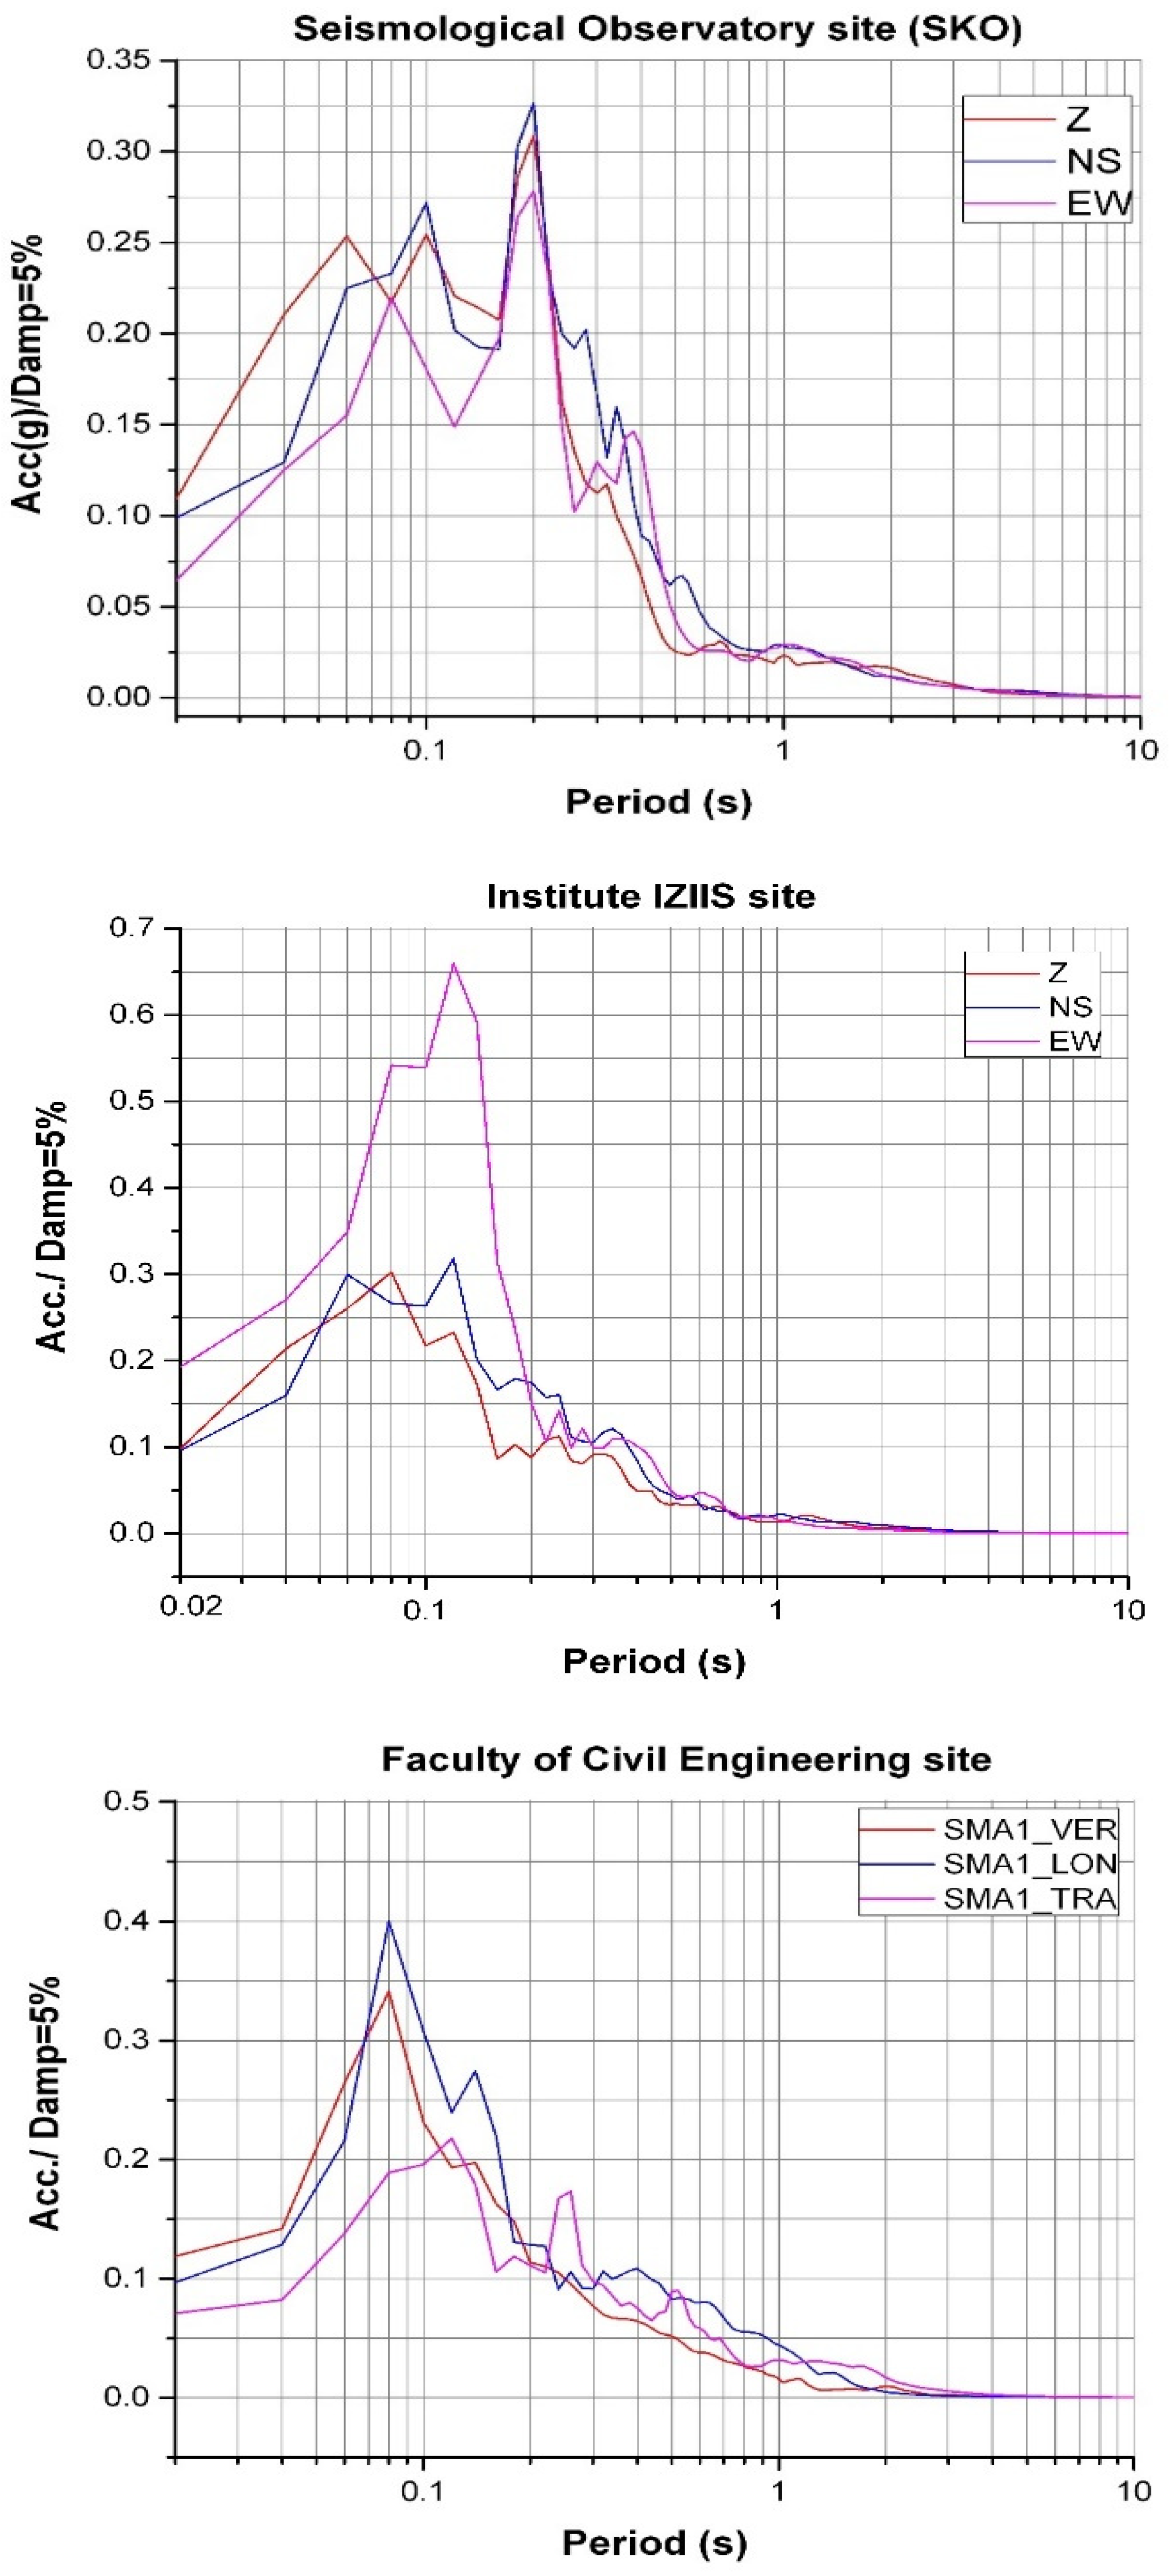
The 3-channels acceleration record of the 11 September 2016 magnitude M
L5.3 earthquake at the SKO location is shown on
Figure 3. The maximum acceleration was on the Z-component; a measured zero-to-peak value of 555,000 counts or peak ground acceleration (PGA) of 0.140 g, the N-S component PGA was 0.10 g, and the E-W component PGA was 0.07 g.
At the Faculty of Civil Engineering (Gradezen Fakultet) location, at an epicentral distance of approximately 6.5 km, the acceleration was recorded by the SMA-1 Kinemetrics instrument that was deployed at the site. It is a longstanding instrument that records on film and data had to be manually digitized. It was installed in the sub-basement of the faculty and the foundations consist of a few meters of sand, gravel, and quartz deposits 7 m deep.
The 3-channel acceleration record of the 11 September 2016 magnitude M
L5.3 earthquake at the Faculty of Civil Engineering-Gradezen Fakultet location is shown in
Figure 4. The maximum acceleration was recorded on the L-component and had a zero-to-peak value of 4.5 units or 0.121 g, while the V-component had slightly smaller values of 0.118 g and the T-component about 0.078 g.
At the Institute of Earthquake Engineering and Engineering Seismology-IZIIS location at an epicentral distance of approximately 7.3 km, the acceleration was recorded by a broadband Güralp instrument that was deployed on the ground floor at that site. It is a non-anchored digital instrument positioned on a laminated concrete slab in the laboratory of the Institute [
8].
The 3-channel acceleration record of the 11 September 2016 magnitude M
L5.3 earthquake at the IZIIS location is shown on
Figure 5. The maximum acceleration was observed on the E-W component and had a zero-to-peak value of 0.192 g, on the Z-component the zero-to-peak PGA was 0.123 g, and on the N-S component the zero-to-peak PGA was 0.098 g.
The differences in the amplitude values of the strong motion records can be primarily attributed to the types of surface and place where the instruments were installed—bedrock versus the sediments. Shaking can increase or decrease depending on the geometry and structure of the layers, Moreover, the shape of the waveforms might change because of their relative site position in respect to the fault activated during the main earthquake.
The records of Zagreb March 2020 earthquake from the two closest stations coded QUHS and QARH, were selected for our analysis. Both were equipped with Güralp instruments with a general set of response curves to convert the measurements from counts into units of acceleration, as described in the user manuals.
Figure 6 displays about half-minute sections of the recorded Zagreb M
L5.5 March 2020 earthquake on stations QUHS and QARH. Each plot is automatically scaled and shown as time in seconds vs. acceleration in g. The vertical component Z of the P-waves had the highest accelerations, though the horizontals carried most of the energy in their respective S-waves. That is expected with close earthquakes, given the geology, the source mechanism, and the fault orientation.
The maximum acceleration and the hypocentral distance for the selected five stations are summarized in
Table 2.
4. Nakamura Processing
The accelerograms from the 2016 seismic sequence in the Skopje area were further analyzed using the complete records in raw format and applying the Nakamura method [
13,
14]. The theory predicts that on soft ground, the horizontal motion is larger than the vertical motion. However, on rock, the horizontal and vertical motions should be similar, both in the maximum amplitudes and in the waveform content. Here, we used the software to automatically select the parts/windows of the waveform and calculate the maximum values of the H/V ratio and compare them with the ground characteristics for the selected stations. The basic assumptions upon which the Nakamura method is based then, as a first approximation, the resonance frequency, f
0, of the superficial layer and the amplification level A(f
0), are given by the equations:
where V
1 and V
2 are the S-wave velocities in the upper layer and the bedrock, respectively. The corresponding densities of the materials are r
1 and r
2, usually read from lab tests, and H is the thickness of the superficial layer.
Thus, the amplification characteristics of horizontal motions by surface layers can be estimated from the ratio of horizontal-motion spectra measured at soft soil and bedrock sites. However, it is often difficult to determine the resonance frequency corresponding to the surface layer because the spectral ratio can have several peaks [
15]. That phenomenon was recognized to be caused mainly by surface waves. Therefore, although uncertain, the method can assist to distinguish the amplification caused by multiple reflections of the vertically polarized waves in the top layers, which is important during forming the velocity models for further computational analysis.
According to the results of surface layer investigation, the depth estimates depend on the velocity of the top material. The amplitudes of the peaks then match certain combinations of layers with given velocities, and the solutions might be ambiguous. It is a common practice to discard the extreme solutions that are not physically possible and keep the most plausible.
Horizontal vs. vertical ratio of the 11 September 2016 magnitude M
L5.3 earthquake at locations of Seismological observatory SKO, IZIIS Institute, and FCE (Faculty of Civil Engineering—Gradezen Fakultet) is shown on
Figure 9. The predominant peaks and frequency found on the seismic station SKO record, where the instrument is installed on rock, are at 2, 2.5, and 3.75 Hz, while some spikes below 0.5 Hz could be artifacts of the processing. Using the general values for velocities in soft rock, the thickness of the top cover can be approximated to 70 m, which is in line with the Eurocode-8 classification of type A. Similar peak distribution was noticed when records from local explosions and ambient noise were analyzed (Sinadinovski-Pekevski, personal communication, 2021).
The main peaks and frequency found on the seismic station IZIIS record, where the instrument is free-standing, are at 2.5, 3.75, and 6 Hz, probably a coupling effect with the base block. Using the average values for velocities in porous materials, the thickness of the top soil cover is between 40 and 50 m, and is according to Eurocode-8, classified soil of type B. The highest peak and frequency found on the seismic station FCE record, where the instrument is in the sub-basement of the faculty on ground that consists of sand and gravel sediments, is at 2.25 Hz. Using the average values for velocities in sediments of 300 m/s, those frequencies imply an overall soil depth of around 22 m underneath that location, which is, according to the 1998 Eurocode-8 classification, soil of type C.
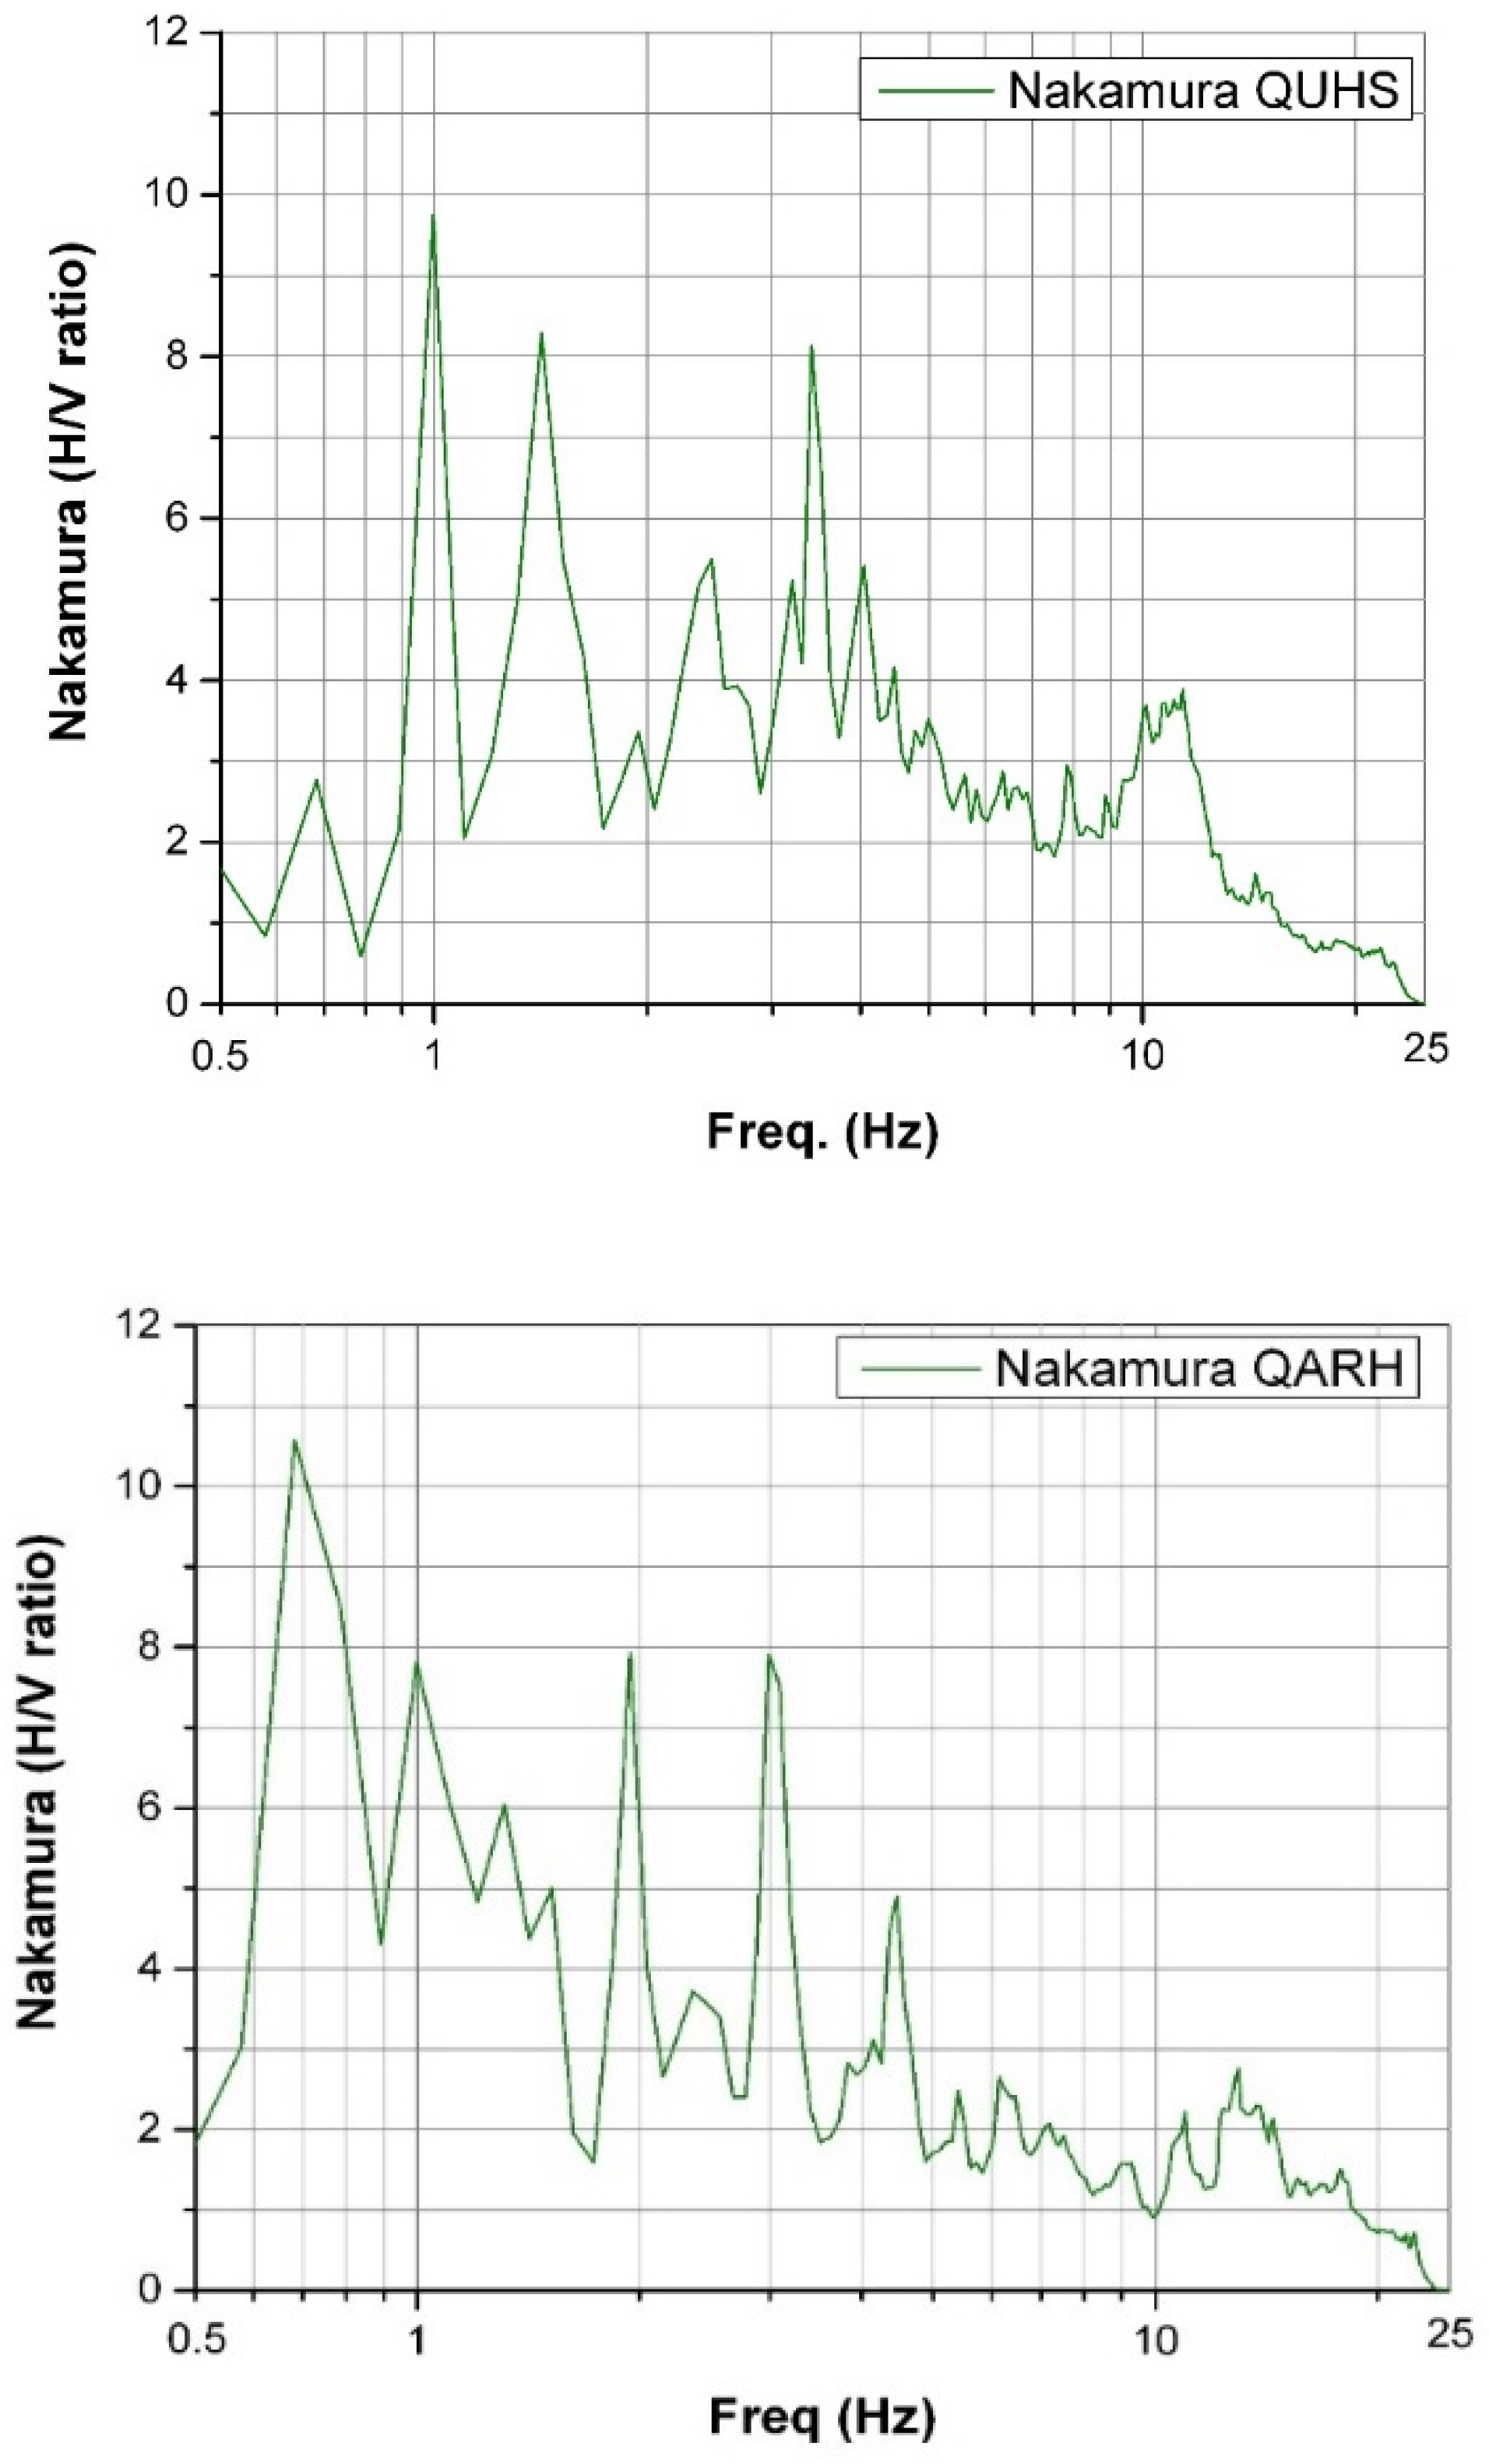
Horizontal vs. vertical ratio of the 22 March 2020 Zagreb magnitude M
L5.5 earthquake at stations QUHS and QARH is shown in
Figure 10. One of the dominant peaks on both seismic station records, is around 1 Hz, while lower frequencies may exhibit certain artefacts. Using the average values for velocities in sediments, that could be associated with an overall deposit depth of around 50 m underneath that location, which is according to [
11] soil classification, of type C. Thus, shaking through such subsurface may affect objects with predominant natural periods of 0.5–1 s. Uglešić [
12] estimated site parameters at the location of QUHS and QARH of 293 and 350 m/s with estimated depth to bedrock (800 m/s, H
800) at 50 and 80 m, respectively.
Besides the depth of the sedimentary layers, the amplification of the vibration at the station sites might be related to a different formation, faulting, or level of the water table, as indicated in the literature. For example, the authors of [
16] estimated the high-frequency attenuation parameter kappa for the Zagreb seismic stations and showed that its distribution is influenced by local and regional geological structures within regional active faults. Causse et al. [
17] provide new insights on possible significant damage and exceptional ground motion acceleration for the moderate M
W4.9 earthquake (Le Teil event) due to near-source area characteristics.
Response spectra for the Zagreb event showed the peak values mainly between 0.1 and 0.2 s, equivalent to frequencies of 5–10 Hz, that corresponds with observed building damage in Zagreb (e.g., [
5,
18]). However, spectra for both stations QUHS and QARH are broad, and high spectral accelerations (above 0.2 g) are observed between periods of 0.5 and 0.7 s equivalent to frequencies of 1.4–2 Hz that is comparable with the dominant H/V frequency peaks.
Using known soil profiles from geophysical measurements, bedrock depths were extracted for all observed microtremor spectral response curves using H/V forward modeling, where the map depicting sediment thickness cover above bedrock was derived using the spatial interpolation [
19]. A good correlation was noticeable between the estimated bedrock depths as well as topographical and local geological maps and the distribution of fundamental soil frequency, which was an encouraging finding before our experiment.
5. Summary and Discussion
There was a lack of instrumental data at short distance during the 1963 Skopje earthquake and compiled reports were mainly based on macroseismic data depicting intensity, the 2016 earthquake was recorded at several local and regional seismic stations. The seismological network data were used to locate the hypocenter of the earthquake and its magnitude of M
L5.3. In this study, three strong motion records were analyzed in more details and the response spectra presented in relation to their site geology. In earlier analysis [
20], such ground effects were correlated with the reported damage.
The 22 March 2020 Zagreb earthquake of magnitude ML5.5 was located using data from the Croatian national seismological network and regional seismic stations. In this study, we calculated for the first time the response spectra from the mainshock recorded on the two closest stations and applied the Nakamura method in order to explore the characteristics of that recent moderate sized earthquake.
The differences in the values of the station spectra can be primarily attributed to the types of surface and locations where the instruments were installed. The dominant frequencies of 5 Hz or 0.2 s found on the SKO Observatory record of the instrument installed on bedrock and similarly at IZIIS Institute may indicate that the stations are on the flank of the same geological block that generated the strongest earthquake on 11 September 2016. That is consistent with the value of 0.9V
S velocity that is a general rate for rupture propagation on faults [
3].
The prevailing frequency of 1 Hz (period 1 s) found on the records from the instruments installed over the sedimentary layer may indicate that the vibration at the station site is dominated by guided waves created in the subsurface and influenced by the relative site position in respect to the fault system activated by the main earthquake.
Response spectra for the Zagreb event showed the peak values mainly between 0.1 and 0.2 s, equivalent to frequencies of 5–10 Hz, which corresponded with observed building damage in the Zagreb city [
5]. The spectral peak for stations QUHS and QARH is broad, and high spectral accelerations (above 0.2 g) are observed between 0.5 and 0.7 s equivalent to frequencies of 1.4–2 Hz, the results comparable with the dominant H/V frequency peaks.
The main principle of the microtremor spectral response methodology is that ambient noise measurements are performed without an earthquake influence and, therefore, the fundamental soil frequency peak amplitude only represents a site response in the natural state. Otherwise, site response analysis provides possible amplification for given ground motion propagated from the bedrock level through the local soil profile. The change from site response of natural state and the site response of the local soil when subject to an earthquake influence is subject to different scenarios, including nonlinearity.
These recorded data at short epicenter distance are valuable information for improvement of the seismic design codes. The selected stations were at very close hypocentral distances, so the ground shaking exceeded the design criteria across certain frequency ranges. Therefore, old and new unreinforced masonry buildings might suffer damage when rare shallow, moderate-magnitude earthquakes occur nearby. The response spectra of these two moderate size earthquakes, in the Skopje and Zagreb areas, should be considered in the Design Spectra for the Building Codes, which are subject of continuous work for the committees formed by the countries’ standardization institutions.
In this research, our aim was to combine only the results of the SM analysis and the Nakamura method and prove that the site substructure can be fairly inferred to the first degree, which is very useful in evaluation of the regional velocity models. For more detailed assessment of linear and nonlinear site amplification behavior under different input levels of seismic ground motions, the site response analysis is strongly recommended, especially when some of the modern building codes require the performance of such analysis under specific conditions.


 ,
, 


